Article

Genome-Wide Identification and Expression Profile Analysis of the NF-Y Transcription Factor Gene Family in Eucalyptus grandis

1
College of Life Science, Shanxi Normal University, Taiyuan 030031, China
2
Research Institute of Tropical Forestry, Chinese Academy of Forestry, Guangzhou 510520, China
3
Laboratory Management Center, Shanxi University of Chinese Medicine, Taiyuan 030031, China
*
Authors to whom correspondence should be addressed.
Forests 2025, 16(2), 361; https://doi.org/10.3390/f16020361
Submission received: 17 January 2025 / Revised: 10 February 2025 / Accepted: 13 February 2025 / Published: 17 February 2025
(This article belongs to the Section Genetics and Molecular Biology)

Abstract

:
The nuclear factor Y (NF-Y) transcription factor family identified in plant organisms consists of NF-YA, NF-YB, and NF-YC subunits, known for their pivotal role in regulating plant growth, development, and responses to environmental stress. Despite extensive studies on the NF-Y gene family across various species, the understanding of the NF-Y gene family in Eucalyptus is incomplete. This study aimed to identify 31 EgrNF-Y genes (7 EgrNF-YA, 16 EgrNF-YB, and 8 EgrNF-YC) in Eucalyptus grandis, all displaying conserved core regions. The chromosome distribution analysis showed that these genes were unevenly distributed on 11 chromosomes. The protein interaction analysis revealed EgrNF-YA1/A4/A6 as central within the EgrNF-Y protein network, interacting extensively with other EgrNF-Y proteins. Prediction of promoter cis-elements suggested that the expression of EgrNF-Y genes may be affected by various hormonal and abiotic stresses. Tissue-specific expression patterns indicated the widespread presence of all 30 EgrNF-Y genes across different tissues. EgrNF-YB1 and EgrNF-YB11 are implicated in regulating E. grandis flowering, whereas the upregulated expression of EgrNF-YB6/B11/B13 under phosphorus deficiency is involved in phosphorus absorption and utilization. This study lays a foundation for further understanding of the evolutionary diversity of the NF-Y gene family and serves as a reference for future studies in woody plants.

1. Introduction

Transcription factors (TFs) are proteins that bind to a cis-acting element within the promoter region of a eukaryotic gene, thereby facilitating the specific expression of the target gene. They play crucial roles in the growth, development, and response to abiotic stress. Nuclear factor Y (NF-Y), also known as heme activator protein or CCAAT-binding factor, is a highly prevalent heterotrimeric transcription factor identified in numerous genes across plants, animals, and fungi. In higher eukaryotes, the trimeric complex NF-Y is composed of three distinct subunits—NF-YA, NF-YB, and NF-YC—and exhibits a high degree of conservation [1,2].
In plants, each subunit of the NF-Y gene family is usually encoded by multiple members, indicating that heterotrimer complexes composed of various NF-Y members fulfill distinct regulatory functions [3,4]. NF-Y TFs have been identified in various plant species, including Arabidopsis thaliana (33 NF-Y genes) [5], Glycine max (68 NF-Y genes) [6], Brassica napus L. (33 NF-Y genes) [7], Medicago sativa (60 NF-Y genes) [8], and Petunia hybrida (27 NF-Y genes) [9]. Furthermore, the NF-Y gene family has also been reported in several woody plants. For example, there are 46 members (11 NF-YAs, 21 NF-YBs, and 14 NF-YCs) in Populus [10], 28 members (9 NF-YAs, 9 NF-YBs, and 10 NF-YCs) in Pinus tabuliformis [11] and 22 members (6 NF-YAs, 11 NF-YBs, and 5 NF-YCs) in Citrus [12]. Recently, 23 EgNF-YB gene members of Eucalyptus have been analyzed and identified [13]. However, despite extensive studies on the NF-Y gene family in various plant species, a comprehensive exploration of the NF-Y gene family in Eucalyptus remains lacking.
Many studies have indicated the essential roles of NF-Y genes in regulating physiological processes associated with plant growth and development. For instance, AtNF-YB9, the initial NF-Y gene isolated from a plant, has a crucial function in the development of seeds in Arabidopsis [14]. The NF-Y has been extensively documented to exert a significant impact on the regulation of flowering time. Specifically, it is intricately involved in the modulation of SOC1 expression through H3K27me3 demethylation, thereby mediating the influence of the photoperiod and GA signaling on the timing of flowering [15]. Furthermore, CmNF-YB8 has been shown to modulate flowering time by controlling the expression of cmo-MIR156 in Chrysanthemum’s aging pathway [16]. Beyond flowering, NF-Y plays pivotal roles in various physiological processes, including starch biosynthesis [17], root elongation [18], and fruit ripening [19].
In addition to its role in plant growth and development, NF-Y is also involved in stress response. The role of NF-Y is not only in drought and salt stress [20,21,22,23], but also in adaptation to nutrient stress processes such as N and P [24,25,26,27]. Some studies have indicated that the NF-Y protein plays a crucial role in the regulation of root nodule formation and nutrient (P and N) absorption in plants [24]. The expression levels of AtNF-YA2/3/5/7/10 members are also upregulated under low P stress [25]. The overexpression of TaNFYA-B1 can promote nitrate and phosphate transport and root growth [26]. Recently, it has been reported that the GmNF-YC4-GmEXPA7 module can participate in inducing low phosphorus stress in soybeans and promote the growth and development of plant roots [27]. Although the above studies suggest that NF-Y may play a role in P signaling, its role in E. grandis is unclear.
Eucalyptus, a member of the Myrtaceae family, is a significant tree species renowned for its rapid growth. Eucalyptus is widely recognized as one of the three fastest-growing tree genera globally, alongside poplar and pine. Eucalyptus grandis is among the fastest-growing tropical eucalypt species. With a short growth cycle, certain genotypes can flower within 2–3 years, making E. grandis an ideal model for studying flowering regulation in woody plants. In China, it is primarily cultivated in the southern and southwestern regions, where soils are often nutritionally deficient, significantly affecting its growth. Therefore, this study identified 31 NF-Y members in the E. grandis genome and performed a comprehensive bioinformatic analysis. Furthermore, the gene expression levels of EgrNF-Y gene members in different tissues and response to phosphorus deficiency were preliminarily analyzed using qRT-PCR. Finally, combined with the results of bioinformatics and qRT-PCR analysis, the key genes that may be involved in flowering regulation and response to phosphorus stress were screened. This study provides a theoretical basis for further identification of functional genes in E. grandis.

2. Materials and Methods

2.1. Identification and Sequence Analysis of NF-Y in E. grandis

The AtNF-Y nucleotide sequences were used as a reference sequence from the Arabidopsis Information Resource (TAIR) database URL (http://www.arabidopsis.org/, accessed on 31 December 2023) [28], and further searched for E. grandis in Phytozome v13 (https://phytozome-next.jgi.doe.gov/, accessed on 31 December 2023) using the BLAST (BLASTN) program and selected all sequences cut-off was set as e-value < 10−10. Subsequently, the protein sequences were checked using the Hidden Markov Model of the Pfam 37.2 (http://pfam.xfam.org/, accessed on 31 December 2023) and the SMART v 8 tools (http://smart.embl-heidelberg.de/, accessed on 31 December 2023) to confirm the presence of conserved domains in the NF-Y family [29]. Finally, 31 candidate members of E. grandis NF-Y were obtained for subsequent analysis. Meanwhile, the ProtParam website (http://web.expasy.org/protparam/, accessed on 31 December 2023) was utilized for the analysis of each EgrNF-Y gene, specifically focusing on molecular weight (MW), isoelectric point (pI), and other physical and chemical properties. The subcellular localization of each EgrNF-Y protein was predicted using Cell-PLoc 2.0 (http://www.csbio.sjtu.edu.cn/bioinf/Cell-PLoc-2/, accessed on 31 December 2023).

2.2. Gene Structure and Cis-Regulatory Elements Analysis of the EgrNF-Y Gene Family

The GSDS v 2.0 tool (http://gsds.cbi.pku.edu.cn/, accessed on 31 December 2023) was used for gene structure analysis, including the number and distribution of exons and introns in the EgrNF-Y gene [30]. A phylogenetic tree of full-length EgrNF-Y protein sequences was constructed using the neighbor-joining method (NJ) with 1000 bootstrap test replicates. The conserved motifs were analyzed using the MEME suite. The protein sequences of all NF-Y were submitted to the MEME suite v5.5.7 (https://meme-suite.org/meme/, accessed on 31 December 2023) with the default parameters, setting the maximum number of motifs to 10 [31]. For cis-element analysis, the regulatory promoter region of EgrNF-Ys was obtained from the genome of E. grandis; the promoter sequence consists of a 2 kb sequence located upstream of the ATG start codon. The promoter elements were further analyzed using the PlantCARE online software (http://bioinformatics.psb.ugent.be/webtools/plantcare/html/, accessed on 31 December 2023) [32], and their distribution was visually analyzed using the TBtools v 2.056 software—in view of biological sequence with default parameters [33].

2.3. Chromosome Distribution, Duplication, and Synteny Analysis of the EgrNF-Y Genes

Chromosome localization of EgrNF-Y gene members was performed using the MapInspect v1.0 software with default parameters [34]. TBtools was utilized to extract the genomic coordinates of NF-Y genes from A. thaliana (TAIR10), P. trichocarpa (Version 3.0), and E. grandis (Version 2.0) genome files as well as gene annotation files. The nonsynonymous substitution rate (Ka), synonymous substitution rate (Ks), and Ka/Ks ratio for each pair of duplicated genes among A. thaliana, P. trichocarpa, and E. grandis were computed between pairs of genes identified as homologous using TBtools with default settings. Furthermore, the homologous genetic relationships of three different species were analyzed by TBtools-MCscanX software with default parameters [35].

2.4. Multiple Alignments and Evolutionary Analysis of EgrNF-Y Proteins

The NF-Y protein sequences (A. thaliana, P. trichocarpa, E. grandis, and P. tabuliformis) were acquired from Phytozome v13. For EgrNF-Ys multiple sequence alignment analysis, the ClustalX2.1 software (with default parameters) was used to perform the analysis [36]. For phylogenetic relationship analysis, the MEGA7.0 software was employed to construct the phylogenetic tree based on the complete NF-Y protein sequences using the NJ with 1000 bootstrap replicates [37]. Finally, the evolutionary tree underwent further editing using iTOL v7 (http://itol.embl.de/, accessed on 31 December 2023) to ensure its accuracy and clarity.

2.5. miRNA Target Site and Gene Interaction NetworkPrediction of the EgrNF-Y Genes

For miRNA target site prediction, the miRNA sequences of Eucalyptus were downloaded from the PmiREN database (PmiREN: Plant microRNA Encyclopedia). EgrNF-Y gene nucleic acid sequence and EgrmiRNA sequence were further used to predict their binding sites by psRNATarget online analysis software (psRNATarget: A Plant Small RNA Target Analysis Server (2017 Update) (zhaolab.org, accessed on 31 December 2023) (Expectation < 3.5).
For protein–protein interaction prediction, the EgrNF-Y family protein sequence was uploaded to the STRING v12.0 website (https://string-db.org, accessed on 31 December 2023) to analyze interactions among the EgrNF-Y family proteins and construct the protein interaction map. In addition, the confidence threshold was set to 0.700, and six interaction types were selected. (Experimental, Database, Co-expression, Neighborhood, Gene Fusion, and Co-occurrence). Cytoscape v3.10.0 software was used for the visualization of the result.

2.6. Plant Material, Cultivation Environment, and P Treatment

The experimental material was E. grandis clone DH3229 raised as tissue-cultured plantlets at the Institute of Tropical Forestry, Chinese Academy of Forestry (Guangzhou, China). Plantlets were kept in a growth chamber with a temperature of 23 ± 1 °C and relative humidity ranging 60%–70% under a light/dark photoperiod of 16 h light and 8 h dark. The plantlets were transferred to a liquid culture medium containing a Hoaglan total nutrient solution (800 mL/pot, change the medium every five days, composition per Table S1) for one month and used for later experiments. After one month, plantlets of even size and growth rate were divided into a control group, which was maintained using the same Hoagland’s regime, and a phosphorous-deficient group (modified Hoaglands see Table S1). After 2 weeks of treatment, the roots (newest root and second lateral root) and leaves were harvested and quickly frozen in liquid nitrogen for subsequent experiments.
Tissue samples, including roots, stems, and leaves, were harvested from plantlets cultured for 6 months. In addition, mature leaves, xylem, and flowers were collected from Jiangmen City, Guangdong Province. All samples are promptly frozen in liquid nitrogen and stored at −80 °C until further analysis.

2.7. Total RNA Extraction and Real-Time Quantitative PCR Analysis

Total RNA was extracted from 100 mg of various tissue samples and treatments using the Plant RNA Kit (OMEGA, Shanghai, China) following the manufacturer’s instructions. After extraction, the RNA samples were subjected to DNase I (Takara, Beijing, China) treatment to eliminate the genomic DNA. For the synthesis of cDNA, the total RNA isolated from each tissue and treatment was used as the template. Subsequently, cDNA was synthesized using a cDNA reverse transcription synthesis kit (Takara, Beijing, China) for subsequent fluorescence quantitative analysis experiments.
To evaluate the expression levels of the EgrNF-Y gene in various tissues and under phosphorus-deficient conditions, we conducted a quantitative real-time PCR (qRT-PCR) analysis using SYBR® Premix Ex Taq™ (Takara, Beijing, China). EgrEF2 was used as the reference gene in this study. All primers were designed using the Primer3Plus website (https://www.primer3plus.com/index.html, accessed on 31 December 2023) and were listed in Table S2. The PCR program was as follows: 95 °C for 30 s, 40 cycles of 95 °C for 5 s, and 60 °C for 10 s, and then, a final elongation step of 72 °C for 7 min. The reactions were prepared in a total volume of 20 μL, including 2 μL of template, 1 μL of each primer, 10 μL of 2 × SYBR® Premix Ex Taq™, and 6 μL of ddH2O. The 2−ΔΔCT method was employed to analyze the relative expression levels of these genes in our study.

2.8. Statistical Analysis

Three independent biological and technical replicates were used in this study. The data were presented as the mean ± standard error. The statistical analysis was performed using SPSS 19.0 software (IBM SPSS, Chicago, IL, USA) with Duncan’s test. Statistical significance was indicated by asterisks (* p < 0.05; ** p < 0.01).

3. Results

3.1. Isolation and Identification of the NF-Y Family Members in E. grandis

Through comprehensive screening, 31 sequences belonging to the EgrNF-Y family were identified within the E. grandis genome, including 7 NF-YA, 16 NF-YB, and 8 NF-YC gene members. Furthermore, the basic information of all gene members was determined using the ExPASy server (http://www.expasy.org/, accessed on 31 December 2023), and is documented in Table 1. Among these, the identified EgrNF-Y genes encoded peptides ranging from 94 to 339 aa. The molecular weights (MWs) and the isoelectric point (pI) values of these proteins ranged from 10.64 to 37.21 kDa, and from 4.49 to 9.48, respectively. Based on Cell-PLoc predictions, the subcellular location of the EgrNF-Y family proteins was mainly in the nucleus (except for EgrNF-YC2 and EgrNF-YC8 in the nucleus and cytoplasm) (Table 1).

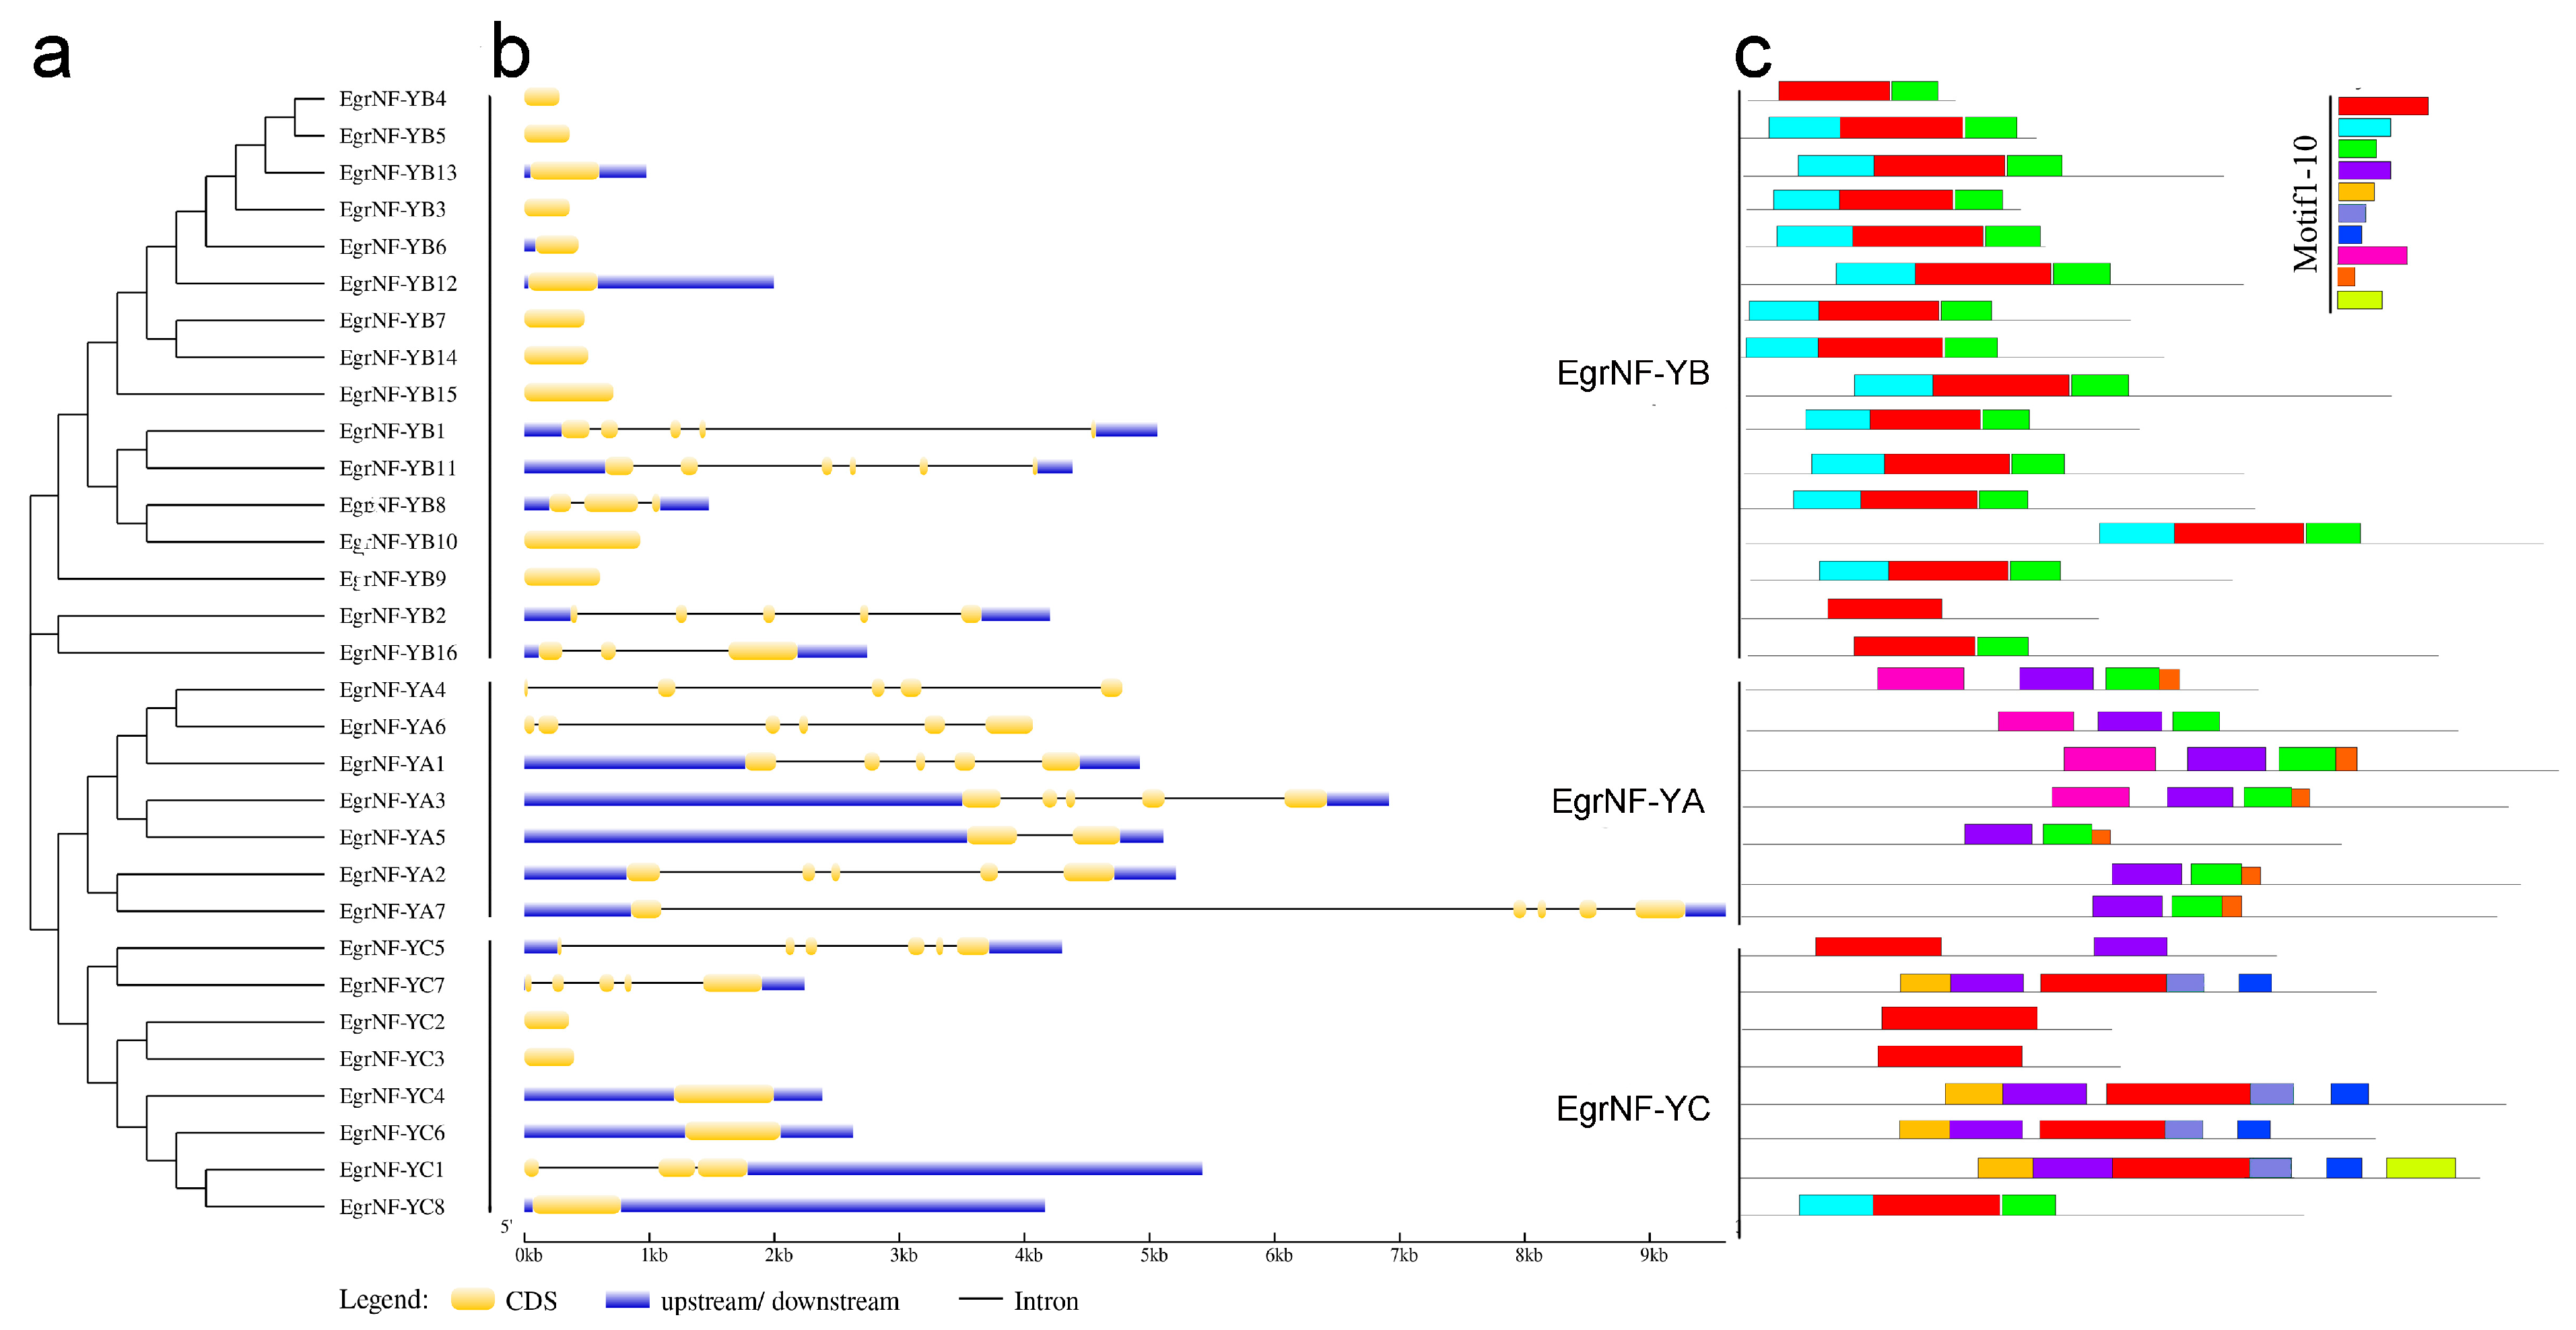
3.2. Analysis of Gene Structure and Conserved Motifs of the EgrNF-Y Genes

The analysis of gene structure could help to understand the evolution of gene families. The gene structures of 31 identified EgrNF-Y genes using the GSDS website were analyzed to better understand the exon–intron structures of the NF-Y gene family in E. grandis. The phylogenetic analysis revealed that the EgrNF-Y genes were divided into three groups: EgrNF-YA, EgrNF-YB and EgrNF-YC. Most EgrNF-YA genes (except EgrNF-YA5) contained five or six exons with similar distribution patterns. More than two-thirds of EgrNF-YB genes had no introns, and genes with similar exon–intron structures were found within the same phylogenetic clade. In the EgrNF-YC subfamily, EgrNF-YC1 and EgrNF-YC4 had two exons, whereas EgrNF-YC5 and EgrNF-YC7 contained six and five exons, respectively. Overall, the gene structures of NF-Y members were closely correlated with their phylogenetic relationships (Figure 1a,b). Additionally, conserved motif distribution was analyzed using MEME software. The results show that all genes, except EgrNF-YA6, contained motif 1. Interestingly, each of the three EgrNF-Y subunits exhibited a distinct motif pattern (Figure 1c). For instance, motif 8 was unique to EgrNF-YA, motif 2 was found only in EgrNF-YB, and motif 7 was specific to EgrNF-YC.

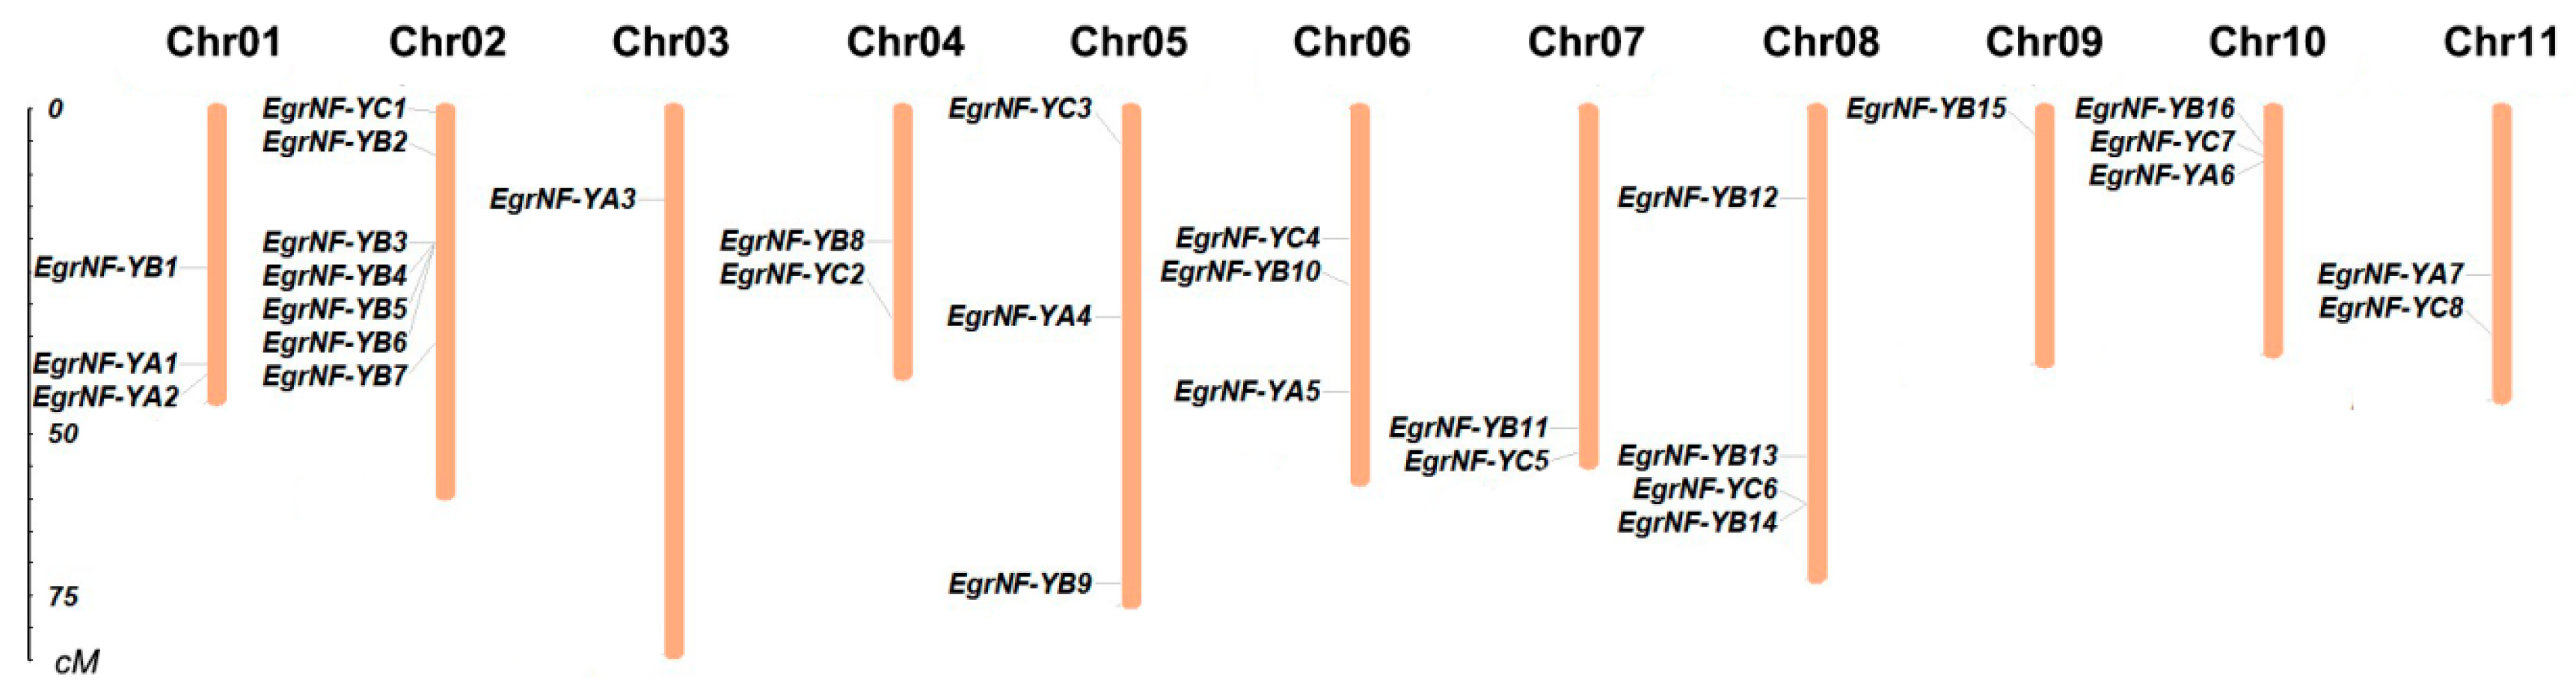
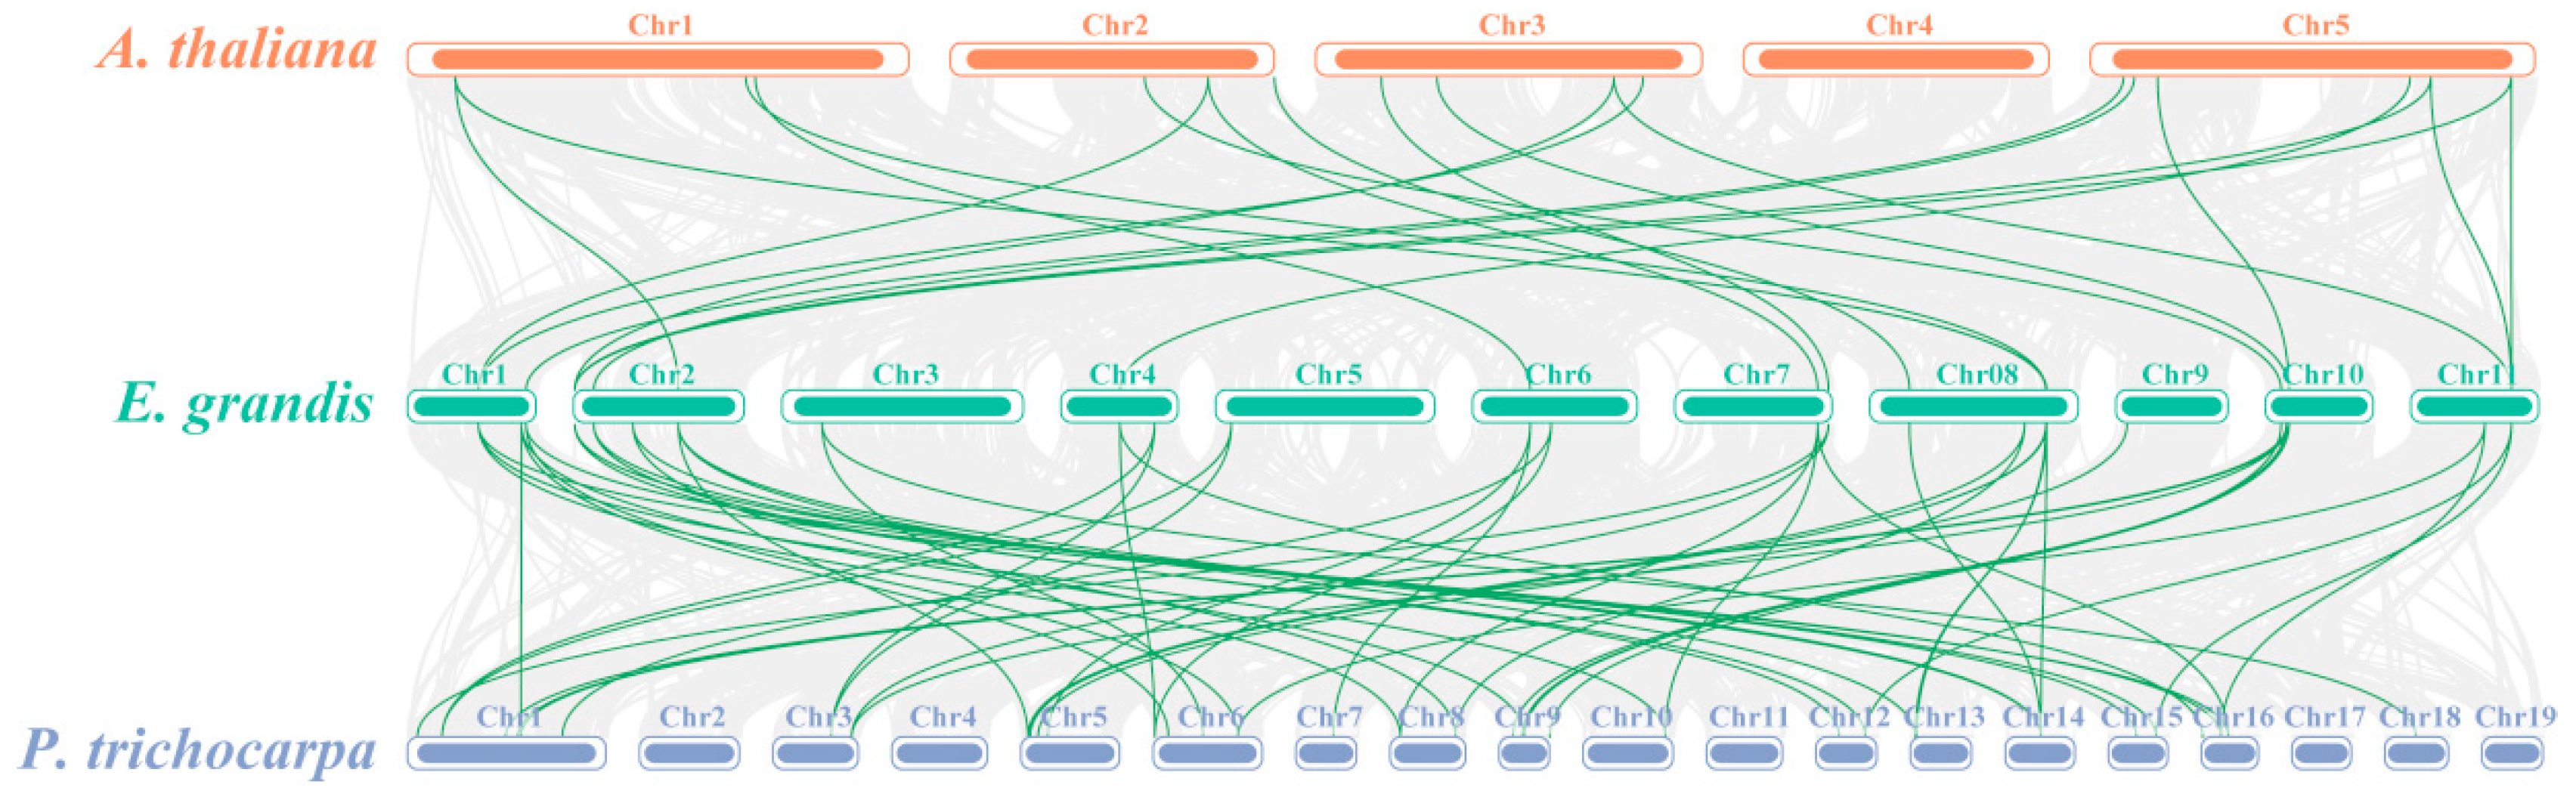
3.3. Chromosomal Distribution and Collinearity Analysis of EgrNF-Y Genes

The 31 EgrNF-Y gene members were widely distributed across the annotated chromosomes in the E. grandis genome database (Table 1). A chromosomal location map was constructed using MapInspect software to further analyze the distribution of EgrNF-Y family members on each chromosome. The result showed an uneven distribution of the NF-Y gene family on the chromosomes of E. grandis. Among these, the largest number of members were located on chromosome 2, whereas only one member was found on chromosome 3 and 9. Moreover, the number of genes was not positively correlated with chromosome length. For example, chromosome 3 had the greatest length but contained only one EgrNF-Y member (Figure 2).
A multi-species comparative synteny map was generated to further investigate the homologous genes and their evolutionary relationships among E. grandis, the model plant Arabidopsis, and the woody model plant Populus. The 31 EgrNF-Y genes were located on 11 scaffolds, 46 PtNF-Y genes were distributed across 19 chromosomes, and 36 AtNF-Y genes were distributed across 5 chromosomes, all showing collinearity with EgNF-Y genes. To further track the dates of the duplication events, the parameters Ks, Ka, and Ka/Ks ratio are estimated; the results show that there were 22 orthologous genes of E. grandis and Arabidopsis, and 49 orthologous genes of E. grandis and P. trichocarpa (Table S3). These results indicate that the relationship between E. grandis and Populus was closer, indicating a stronger evolutionary relationship of the NF-Y gene family between woody plants (Figure 3).

3.4. Conserved Regions and Phylogenetic Relationships of EgrNF-Ys

The protein sequences of the 31 members were analyzed using ClustalW 2.1 and Genedoc 2.7. software to further investigate the conserved regions of EgrNF-Y proteins. Multiple sequence alignment results suggested that each EgrNF-Y family member contained a heterodimerization domain and a DNA-binding domain. These core conserved regions of the EgrNF-YA proteins consisted of 53 amino acids (AAs) and included two highly conserved domains: the NF-YB/C subdomain and the DNA binding domain. These domains were separated by a conserved linker with 21 AAs (Figure 4a). As shown in Figure 4b, the central domain of EgrNF-YB proteins had 91AAs. Among EgrNF-YB proteins, EgrNF-YB2/4/16 had shorter conserved domains. Figure 4c shows that EgrNF-YC subunits also consisted of a core histone-like sequence with a central domain of about 79 AAs in length. Among these, EgrNF-YC5 and EgrNF-YC7 were slightly different from other NF-YC proteins. Overall, the EgrNF-YA protein was more evolutionarily conserved in the three subfamilies (Figure 4).
In order to elucidate the evolutionary relationship and potential function of EgrNF-Y proteins, a phylogenetic tree was generated using NF-Y protein sequences from E. grandis, A. thaliana, and P. trichocarpa using the MEGA7 software. The phylogenetic study result showed that the 107 NF-Y members formed three distinct clusters: NF-YA (yellow), NF-YB (green), and NF-YC (pinkish red). It was as per the subfamily classifications of the EgrNF-Y proteins in this study (Table 1). Considering the evolutionary tree’s phylogenetic relationship and the known functions of AtNF-Ys, it was possible to make further predictions about the functions of EgrNF-Y members. Within each cluster, it was observed that certain pairs of paralogous NF-Y proteins consisted of one EgrNF-Y and one AtNF-Y, for example, EgrNF-YA1 and AtNF-YA6, as well as EgrNF-YC5 and AtNF-YC11. This also suggests that they have more similar biological functions. This study also found that EgrNF-YB9, AtNF-YB6/9, and PtNF-YB3/5 formed a distinct subgroup, classified under LEC1/LEC1-like. In addition, it also identified three pairs of analogs: EgrNF-YB4 and EgrNF-YB5, EgrNF-YB7 and EgrNF-YB14, and EgrNF-YC2 and EgrNF-YC3, whereas most EgrNF-Y proteins shared low homology with other members, suggesting that they evolved in diversity (Figure 5). In order to further analyze the NF-Y evolutionary relationship of woody plants, we used the NF-Y protein sequences of E. grandis, P. tabuliformis, and P. trichocarpa to construct an evolutionary tree. The results show that some NF-Y homologous protein pairs were composed of EgrNF-Y and PtNF-Y, such as EgrNF-YA1/A4 and PtNF-YA6/A4, EgrNF-YB1/B8/B10/B15/B16 and PtNF-YB2/B4/B13/B10/B19, and EgrNF-YC7 and PtNF-YC12. This result indicated that these gene pairs have similar biological functions, and angiosperms were more closely related to each other than gymnosperms (Figure S2).

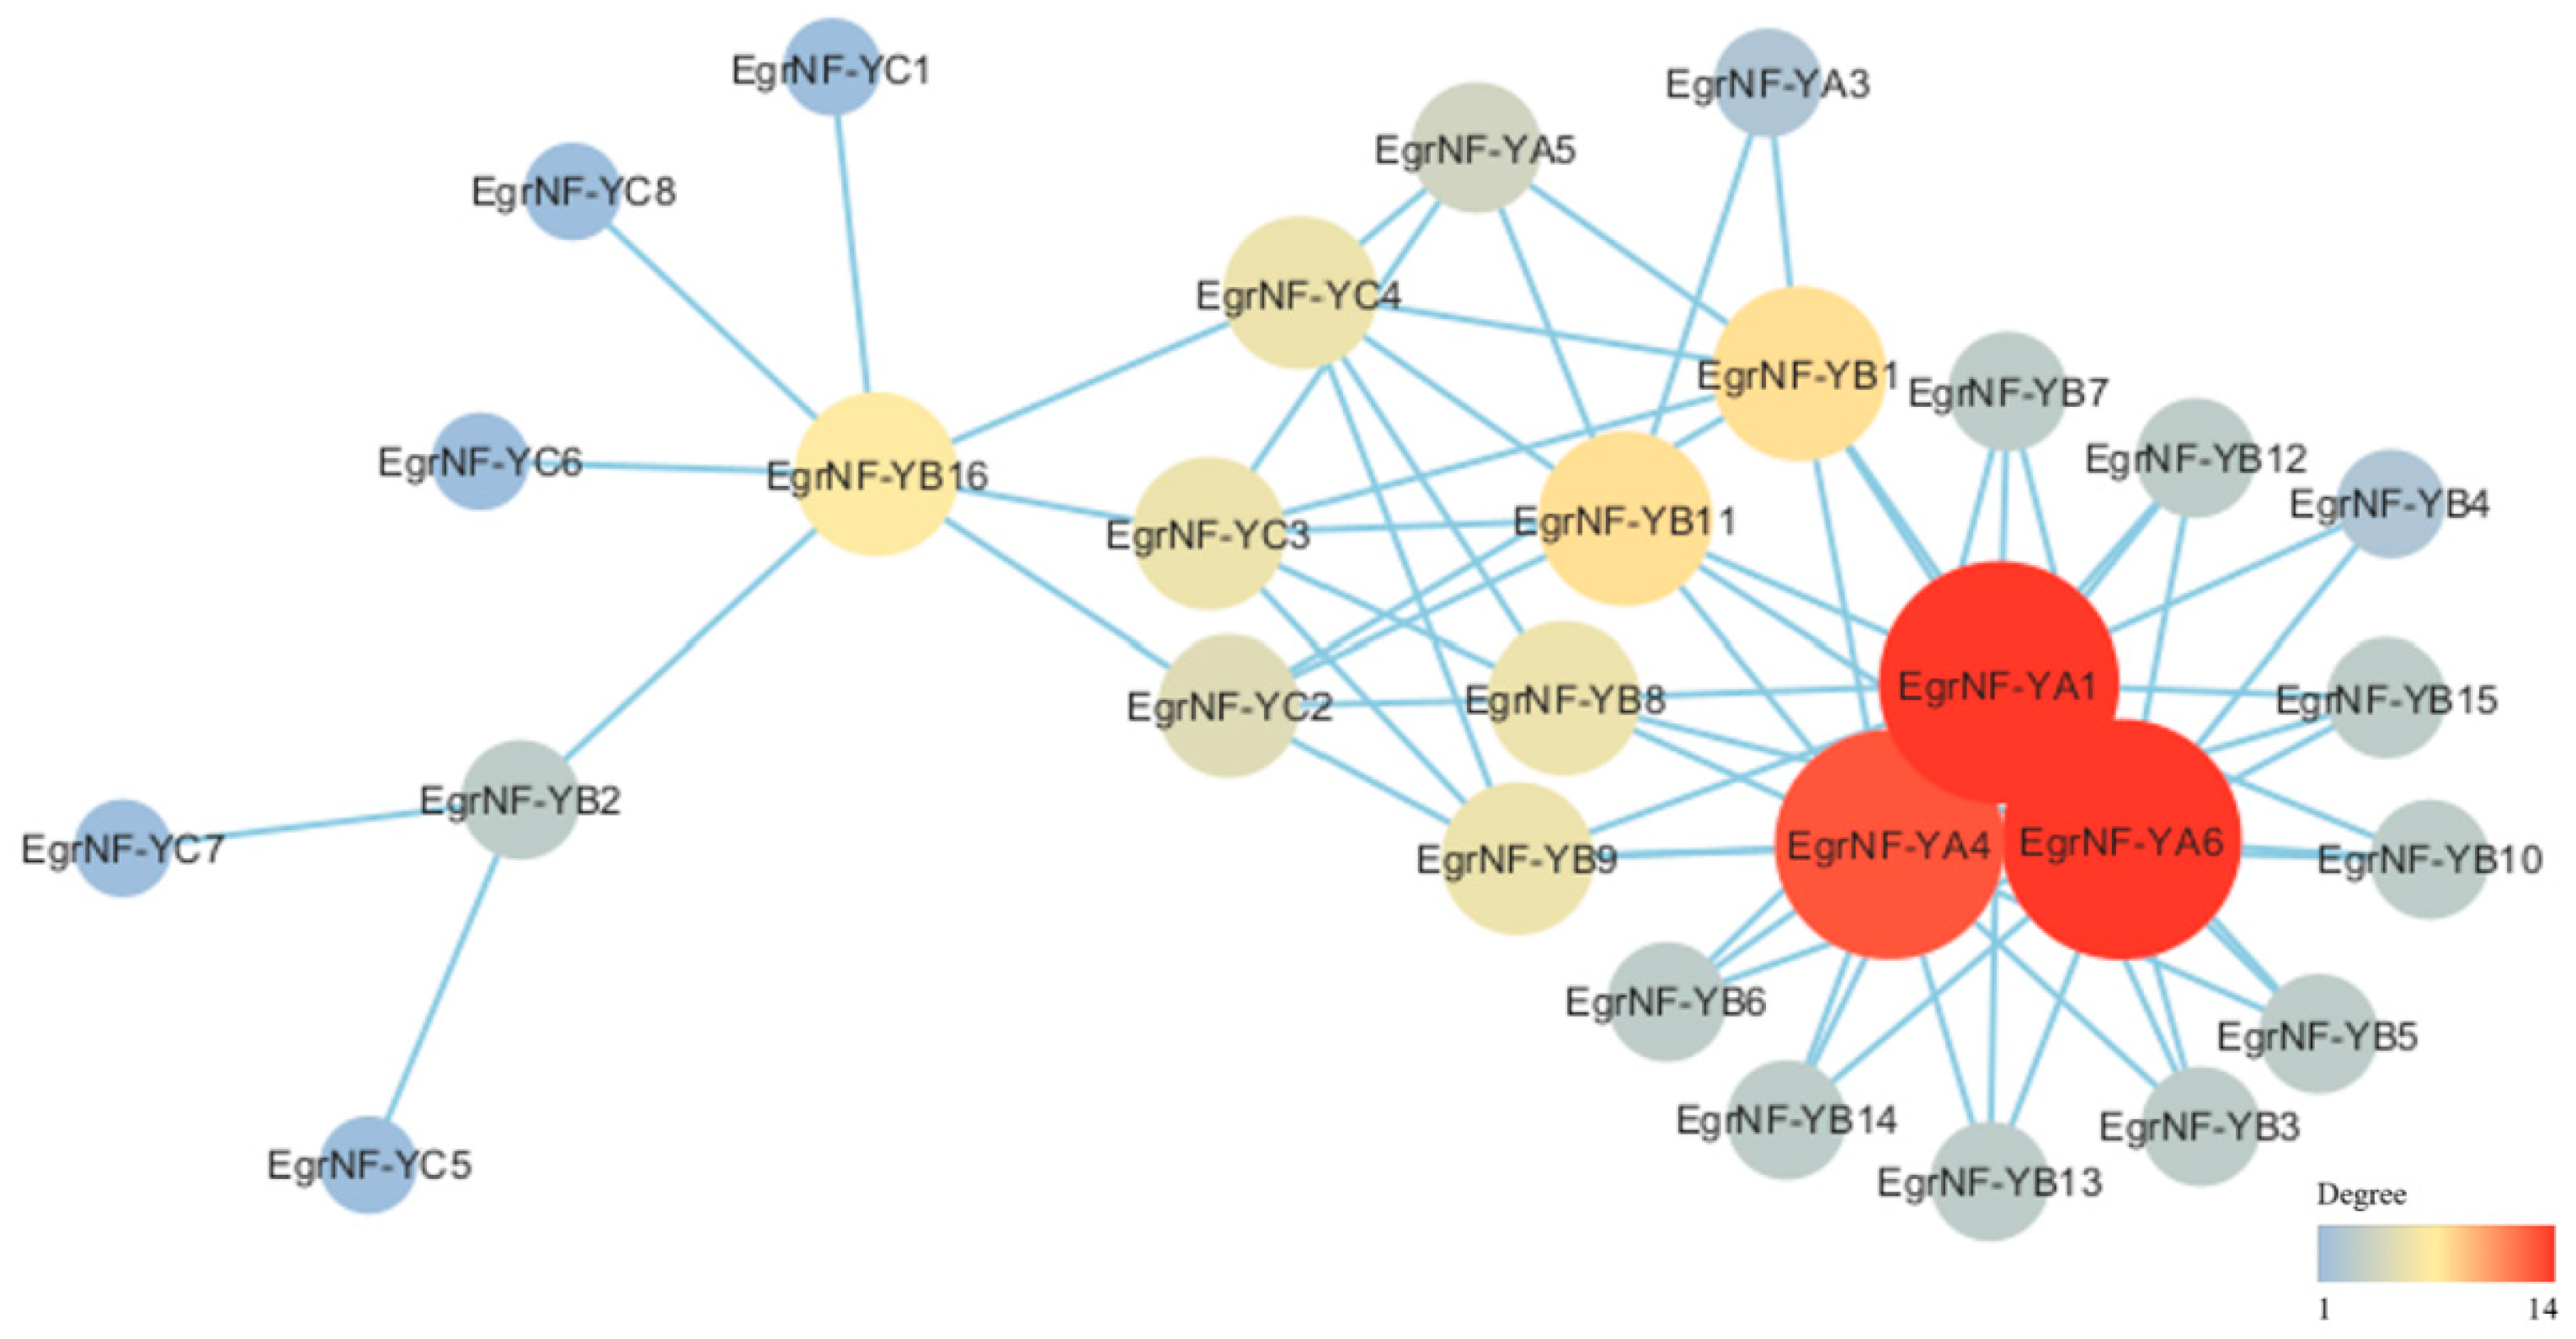
3.5. miRNA Target Site and Protein–Protein Interaction Prediction of the EgrNF-Y Genes

MicroRNAs are widely recognized for their ability to modulate target genes by either cleaving mRNA or inhibiting translation. To further investigate the potential target relationship between Egr-miRNA and members of the EgrNF-Y family gene, we utilized the PmiREN database (Plant microRNA Encyclopedia) to download all miRNA sequences of E. grandis, resulting in a total of 63 miRNA families. Subsequently, these sequences were employed to predict potential target transcripts of EgrNF-Y proteins. The analysis revealed that four EgrNF-Ys could be regulated by five miRNA169 members (Table S4). Specifically, EgrNF-YA2, EgrNF-YA3, EgrNF-YA5, and EgrNF-YA7 were found to have target sites for 5, 3, 3, and 3 miRNA families, respectively. These findings strongly suggest the existence of the miR169-NF-YA module in E. grandis.
NF-Y proteins usually form heterodimers or trimers to function [1,2]. Therefore, the STRING database was utilized in this study to predict protein–protein interactions among members of the EgrNF-Y family of E. grandis. The results show 29 nodes in the whole protein interaction network and 68 pairs of protein interaction relationships between nodes. Among these, all EgrNF-Y proteins exhibited interaction relationships except EgrNF-YA2 and EgrNF-YA7. Notably, EgrNF-YA1, EgrNF-YA4, and EgrNF-YA6 were located at the center of the network of the entire EgrNF-Y family of proteins, interacting with multiple EgrNF-Ys proteins (Figure 6).

3.6. Identification of Cis-Elements in the Promoter Regions of EgrNF-Y Genes

To investigate the potential role of the 31 EgrNF-Y genes, we utilized PlantCARE software to analyze the distribution of cis-elements within the 2000 bp EgrNF-Y promoter regions. Further, 19 types of cis-regulatory elements were detected across the 31 EgrNF-Y genes, including elements related to light responsiveness, hormone responsiveness, stress responsiveness, and growth regulation, in addition to the core cis-elements. A comprehensive classification and detailed information on all cis-elements are provided in Table S5. Meanwhile, the cis-elements binding site is also shown in Figure 7. These findings suggest that EgrNF-Y genes may play a significant role in stress responses and growth regulation.

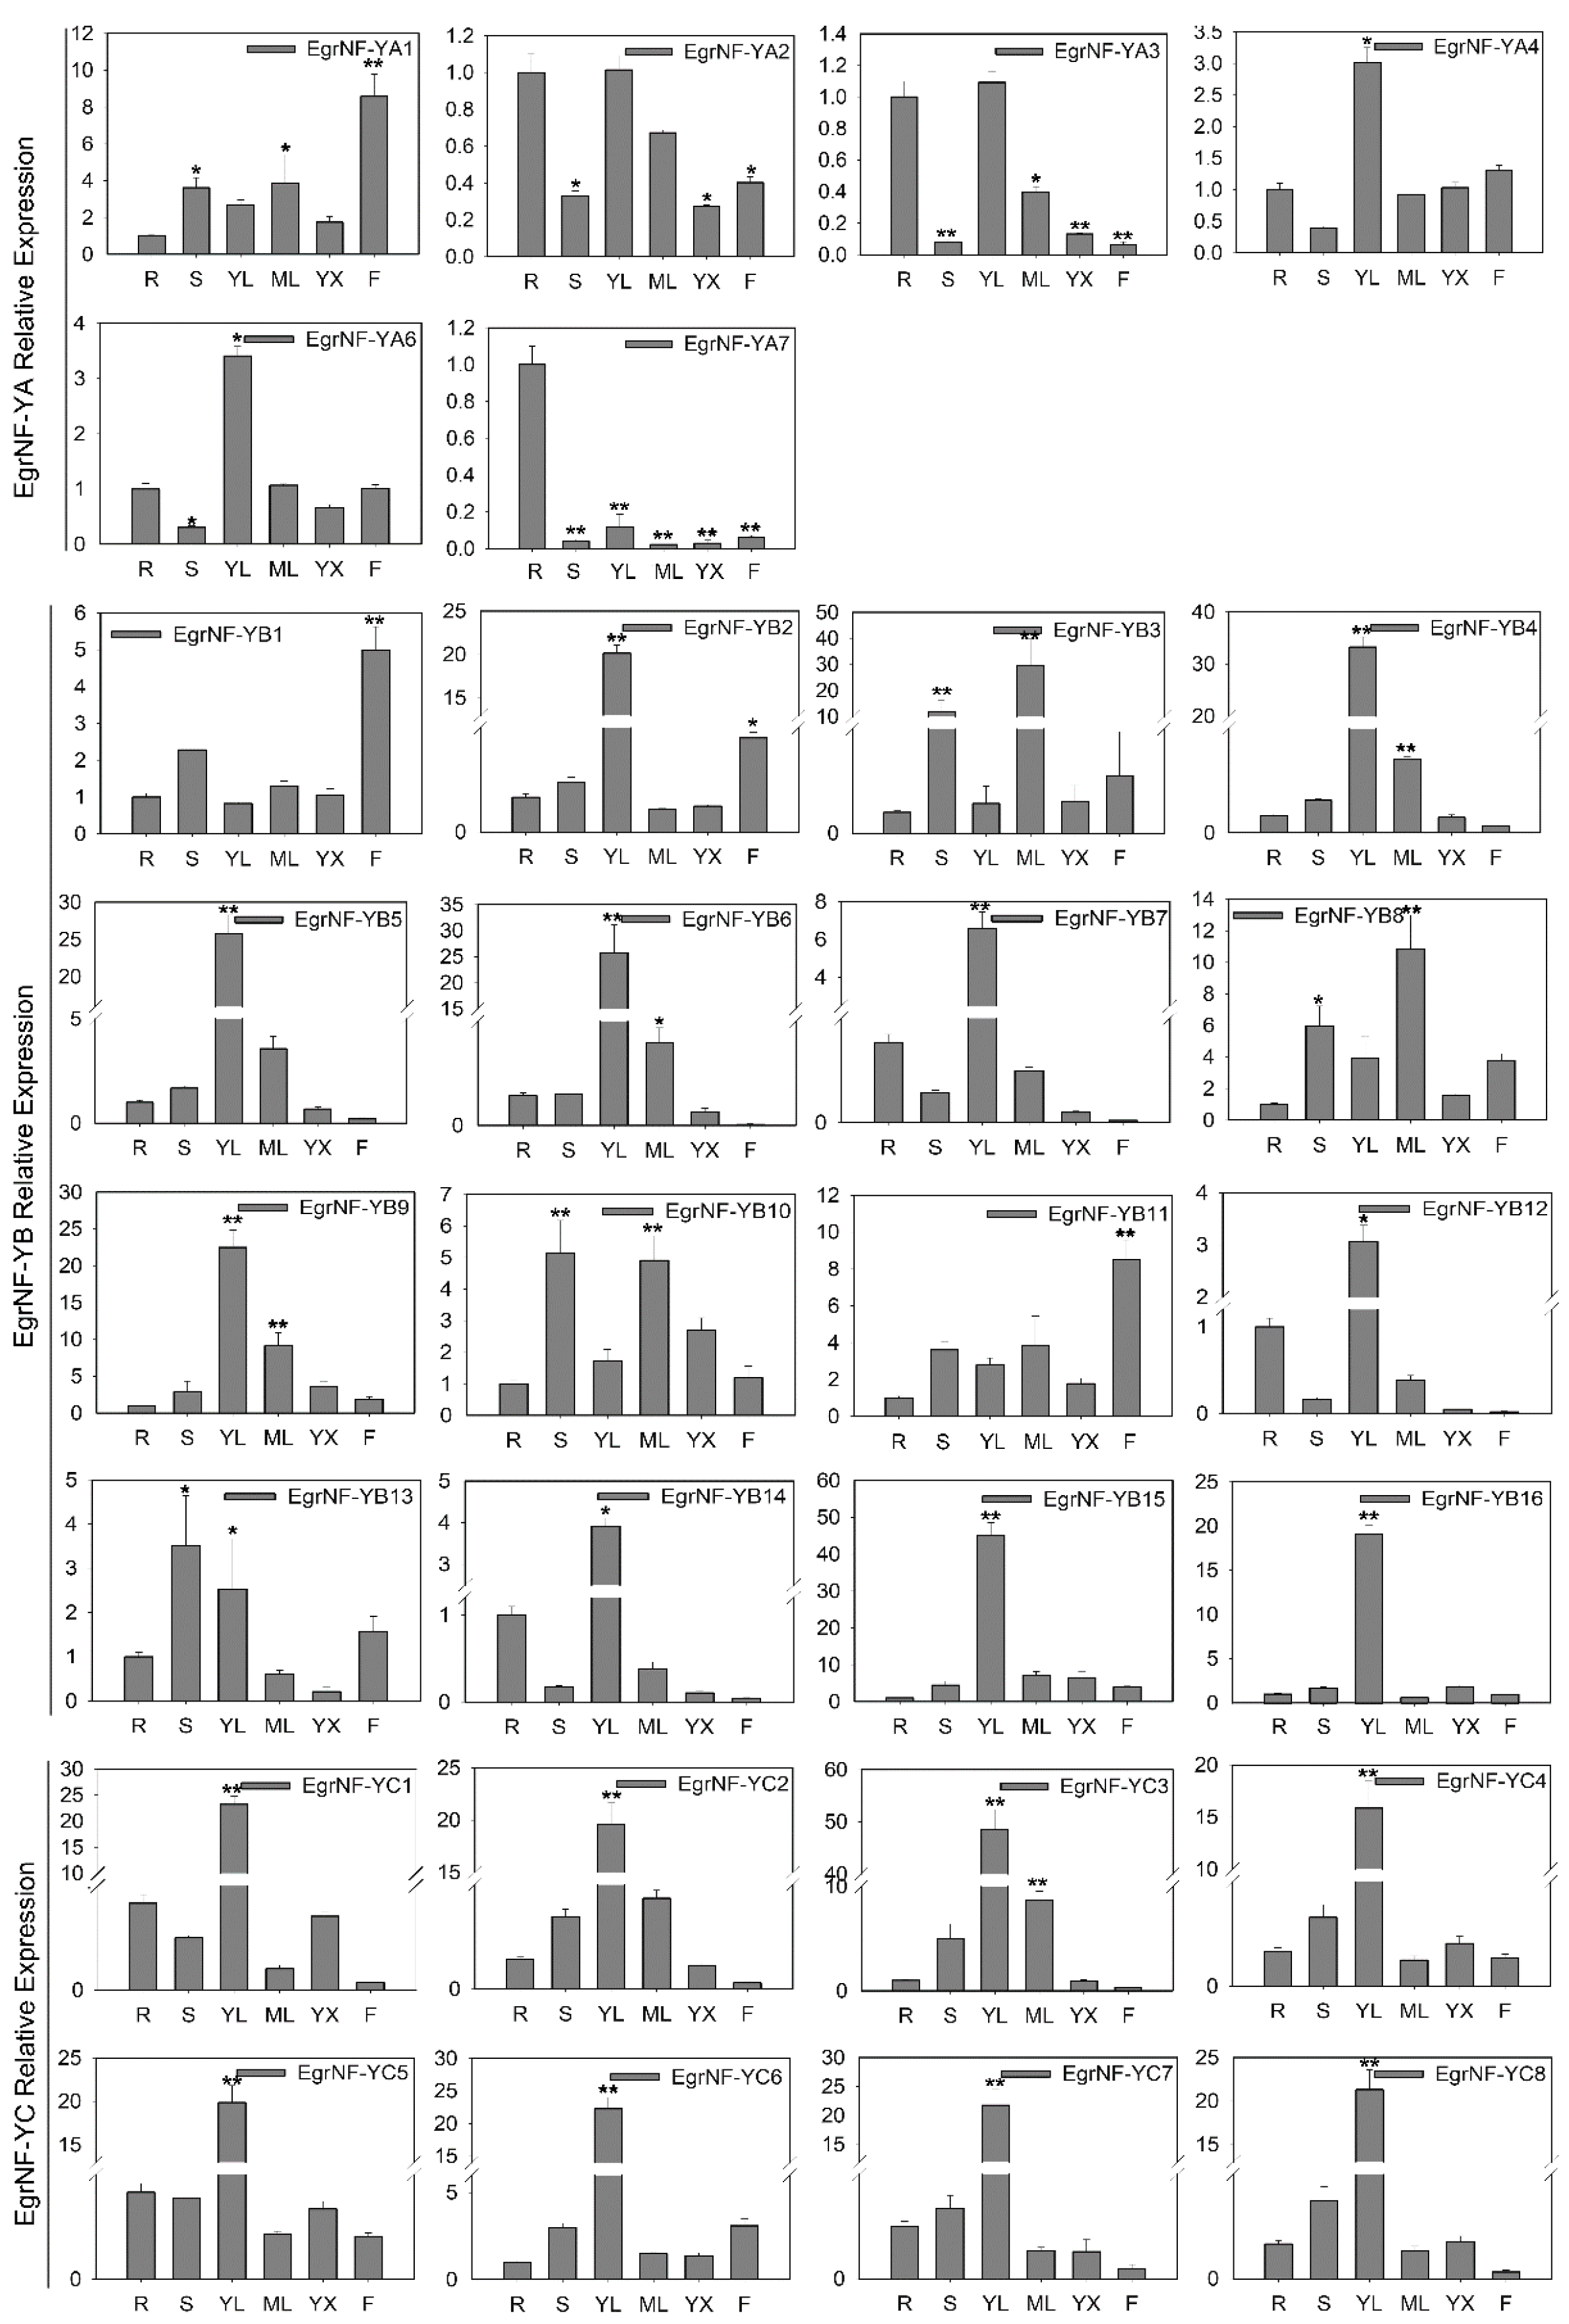
3.7. Expression Patterns of the EgrNF-Y Genes Across Various Tissues

To further explore the potential roles of the EgrNF-Y member genes in the developmental processes of E. grandis, their expression patterns were analyzed using qRT-PCR across six distinct tissues: root, stem, young leaf, mature leaf, xylem, and flower. All member genes, except EgrNF-YA5, were expressed. Therefore, the tissue-specific expression patterns of 30 EgrNF-Y genes were analyzed. The findings indicated that these genes were widely expressed across various tissues and organs in E. grandis, exhibiting diverse spatial and temporal expression profiles. For the EgrNF-YA subfamilies, EgrNF-YA1 and EgrNF-YA7 were significantly expressed in flowers and roots, respectively, whereas EgrNF-YA4 and EgrNF-YA6 showed the highest expression in young leaves. Within the EgrNF-YB subfamilies, EgrNF-YB1 and EgrNF-YB11 exhibited the highest expression levels in flowers, whereas more than 90% of other EgrNF-YB members were highly expressed in young leaves. For the EgrNF-YC subfamilies, although all members of the EgrNF-YC exhibited expression in nearly all tissues, their highest expression levels were observed in young leaves (Figure 8). The diversity of EgrNF-Y gene expression patterns suggested distinct biological functions of these genes during growth and development.

3.8. Expression Profiles of the EgrNF-Y Genes Under Low-Phosphorus Conditions

E. grandis is mainly distributed in southwest and southern China, where soil is generally deficient in phosphorus. Studies have demonstrated that NF-Y proteins act as key transcriptional regulators, playing crucial roles in plant stress responses and growth processes. To investigate the response of EgrNF-Y gene expression to phosphate starvation, we selected 1-month-old seedlings with similar growth trends and divided them into control and treatment groups. The seedling growth phenotype changed significantly after 2 weeks of phosphorus treatment (Figure S4). Following treatment, the roots and leaves were collected, and their expression levels were analyzed using qRT-PCR. The results reveal that 12 genes (EgrNF-YB3/B8/B11/B12/Bl3/B14/B15 and EgrNF-YC1/C2/C3/C5/C7) were significantly upregulated—by more than twofold—in leaves after 14 days of phosphate starvation. The remaining genes either remained constant or showed decreased expression. Under low-phosphorus conditions, only EgrNFYB6/B11/B13 was upregulated by more than twofold in roots, whereas most other genes maintained stable expression levels (Figure 9). These findings suggest a role for the upregulated genes in phosphate uptake under phosphorus-deficient conditions.

4. Discussion

4.1. Identification and Characterization of EgrNF-Y Genes in E. grandis

Accumulating evidence shows that NF-Y proteins play various crucial roles in plant growth and responses to environmental stress. Plants often have large gene families due to gene duplication, which have been extensively studied in many herbaceous species, such as A. thaliana [5], Oryza sativa [38], Glycine max [6], Petunia hybrida [9], Medicago sativa [8], and Brassica napus [7]. Recently, NF-Y family genes have also been increasingly identified in perennial plant species, such as Populus tomentosa and Pinus tabuliformis [10,11]. Eucalyptus is recognized by the FAO as one of the three fastest-growing tree species in the world. However, limited research has been carried out to date on the identification and analysis of the NF-Y gene family in E. grandis. Here, a total of 31 EgrNF-Y genes were isolated and characterized. The number of NF-Y genes in E. grandis was found to be similar to that in other species—such as 36 in A. thaliana [5], 28 in Oryza [38], 46 in P. trichocarpa [10], and 28 in P. tabuliformis [11]. However, compared with previous studies that reported 23 members of EgrNF-YB identified in E. grandis, the number of EgrNF-YB gene members identified in this study is smaller. These differences in the number of gene members may be related to the version of the gene used and the criteria for setting the threshold [13].
To elucidate the function of these EgrNF-Ys, we conducted an in-depth analysis of exon-intron structure and motifs (Figure 1). Our findings indicated that the number and distribution of exon-intron structures and motifs closely align with previous research [3,11], suggesting potential functional similarities between EgrNF-Ys and homologous genes in other species.

4.2. Core Protein Regions and Phylogenetic Relationships of EgrNF-Ys

Studies have shown that Arabidopsis NF-YB subunits can be classified into LEC1 and non-LEC1 groups. Among these, aspartic acid at position D55, is considered a key protein interaction site in the AtNF-YB subfamily, distinguishing LEC1 from non-LEC1 types. LEC1 is crucial in plant embryogenesis and seed development [5,20]. In this study, the substitution of lysine (K) with aspartate (D) was observed at a specific binding site in EgrNF-YB9 (Figure 4). The phylogenetic analysis further revealed that EgrNF-YB9 clustered with AtNF-YB9 (AtLEC1) and AtNF-YB6 (AtLEC1) (Figure 5). These findings suggest that EgrNF-YB9 may play a significant role in regulating seed development and embryogenesis.
Previous studies have also noted that the NF-Y family members of Arabidopsis do not contain AtNF-YB11/12/13 and AtNF-YC10/11/13 due to the absence of a corresponding structure [3]. In this study, a phylogenetic tree was constructed to analyze the NF-Y proteins of E. grandis. Interestingly, the analysis of evolutionary tree results show that EgrNF-YB2/B16 and EgrNF-YC5/C7 had distant evolutionary relationships with other EgrNF-YA/B/C gene clusters, similar to AtNF-YB11/12/13 and AtNF-YC11 (Figure 5). In addition, multiple alignments and phylogenetic tree analysis support this observation (Figure 4).

4.3. Tissue-Specific Transcription Patterns of EgrNF-Y Genes in E. grandis

NF-Y proteins are well-documented as key transcriptional regulators, with widespread expression throughout various stages of plant growth, including both vegetative and reproductive phases. In this study, the relative expression levels of EgrNF-Y in different organs and tissues of E. grandis were analyzed using qRT-PCR. The results indicate that EgrNF-Y genes are broadly expressed across various tissues, albeit at different levels. Notably, the EgrNF-YC subfamily exhibited high expression levels in young leaves, suggesting an important role in developing leaves. Previous studies have indicated that NF-YC subunits can interact with CONSTANS (CO)proteins to regulate the transcription of key floral integrators, such as FT, thereby promoting early flowering. For instance, NF-YC3/4/9 have been found to be essential for the photoperiod-dependent initiation of flowering in Arabidopsis, and CO function in FT transcriptional activation requires these NF-YC subunits. Moreover, FT proteins, which serve as crucial regulators of flowering, are exclusively synthesized in leaves [39,40]. Therefore, the high expression levels of EgrNF-YC genes in leaves suggest that they may contribute to FT activation and flowering induction in E. grandis.
In addition to NF-YC members playing a role in flowering regulation through photoperiodic pathways, some studies have suggested a role of NF-YB subfamily members in flowering regulation via age-dependent pathways. For example, in Chrysanthemum (Chrysanthemum morifolium), CmNF-YB8 has been shown to enhance the accumulation of SPL transcripts by regulating miR156 expression, ultimately influencing flowering time [16]. Interestingly, the analysis of tissue-specific expression levels of EgrNF-YB subfamily members revealed that EgrNF-YB1 and EgrNF-YB11 exhibited the highest expression levels in flowers (Figure 8). Additionally, a phylogenetic analysis comparing EgrNF-YB subfamily members with CmNF-YB8 was performed by constructing an evolutionary tree. The results show that EgrNF-YB1, EgrNF-YB11, and CmNF-YB8 clustered into the same subclade (Figure S4). Based on this, it is speculated that EgrNF-YB1 and EgrNF-YB11 may have similar functions as CmNF-YB8 in flowering regulation. Furthermore, previous studies have shown that stress-induced early flowering is a novel signaling pathway mediated by miR169 [41]. In this study, the protein interaction analysis showed that EgrNF-YB1 and EgrNF-YB11 interact with EgrNF-YA3 and EgrNF-YA5, respectively. Moreover, the target site prediction indicated that EgrNF-YA3 and EgrNF-YA5 could be regulated by Egr-miRNA169. This suggests that EgrNF-YB1 and EgrNF-YB11 may form heterodimers with EgrNF-YA3 and EgrNF-YA5 to regulate Egr-miRNA169, thereby participating in flowering regulation. However, further studies, such as transgenic experiments and yeast two-hybrid assays, are needed to determine whether EgrNF-YB1 and EgrNF-YB11 regulate flowering via miR156 or miR169, and to elucidate their specific regulatory mechanisms.

4.4. Expression Patterns of EgrNF-Y Genes in Response to Pi Starvation

NF-Y not only plays an important role in responding to drought and salt stress [20,21,22,23], but also plays an important role in nitrogen, phosphorus, and other nutrient stress processes [24,25,26,27]. For instance, the overexpression of TaNFYA-B1 under low-nitrogen and low-phosphorus conditions has been shown to significantly enhance nitrogen and phosphorus uptake. This improvement is likely due to the role of TaNFYA-B1 in stimulating root development and upregulating the expression of nitrate and phosphate transporters in roots [26]. Similarly, it has been reported that the GmNF-YC4-GmEXPA7 module can participate in inducing low phosphorus stress in soybeans and promote the growth and development of plant roots [27]. In this study, EgrNF-Y subunits exhibited distinct expression patterns under the phosphorus deficiency condition. Among these, three genes (EgrNF-YB6, EgrNF-YB11, and EgrNF-YB13) were significantly upregulated in the root (Figure 9), and the seedlings showed lateral root growth under the phosphorus deficiency condition (Figure S3). In addition, the promoter elements showed that EgrNF-Y may play an important role in stress response and growth regulation (Figure 7). Therefore, it is speculated that these genes may enhance phosphorus utilization by promoting root development and subsequently upregulating phosphate transporter expression in roots.

5. Conclusions

In this study, 31 EgrNF-Y genes were identified, including 7 EgrNF-YA, 16 EgrNF-YB, and 8 EgrNF-YC genes. Also, their gene structure, phylogenetic relationships, cis-elements, and expression patterns were analyzed. All EgrNF-Y proteins displayed conserved core regions. EgrNF-YA family members possessed multiple Egr-miRNA169 target sites, and interaction was detected between the 29 encoded proteins. Furthermore, combining bioinformatics analysis and gene expression profiling, EgrNF-YB1/B11 genes were identified as potential regulators of flowering, and EgrNFYB6/B11/B13 genes were implicated in enhancing phosphorus utilization. In summary, the findings of this study provide valuable insights into the biological roles of EgrNF-Y genes, offering a foundation for further functional studies.

Supplementary Materials

The following supporting information can be downloaded at: https://www.mdpi.com/article/10.3390/f16020361/s1.

Author Contributions

J.L. designed and supervised the whole experiments, and wrote the manuscript. J.L. and G.L. collected plant materials. J.L., L.Z. and C.G. analyzed the data and edited manuscript. J.L., Z.L. and J.X. revised manuscript. All authors have read and agreed to the published version of the manuscript.

Funding

This research has been supported by the Young Scientists Fund of the National Natural Science Foundation of China (32201524), the National Key Research and Development Program of China during the 14th five-year plan Period (2022YFD2200203), the Fundamental Research Funds for the Central Non-profit Research Institution of CAF (CAFYBB2022SY017) and the Guangzhou Science and technology plan project (2023A04J0711).

Data Availability Statement

The original contributions presented in this study are included in the article and Supplementary Material. Further inquiries can be directed to the corresponding author.

Acknowledgments

We appreciate the contributions and support from the lab members. We also extend our sincere appreciation to the editor and reviewers their thorough evaluation of this manuscript and for offesring valuable feedback to enhance its quality.

Conflicts of Interest

The authors declare no conflicts of interest.

References

  1. Bucher, P.; Trifonov, E.N. CCAAT box revisited: Bidirectionality, location and context. J. Biomol. Struct. Dyn. 1988, 5, 1231–1236. [Google Scholar] [CrossRef] [PubMed]
  2. Maity, S.N.; De Crombrugghe, B. Role of the CCAAT-binding protein CBF/NF-Y in transcription. Trends Biochem. Sci. 1998, 23, 174–178. [Google Scholar] [CrossRef] [PubMed]
  3. Gusmaroli, G.; Tonelli, C.; Mantovani, R. Regulation of novel members of the Arabidopsis thaliana CCAATbinding nuclear factor Y subunits. Genes 2002, 283, 41–48. [Google Scholar] [CrossRef]
  4. Chaves-Sanjuan, A.; Gnesutta, N.; Gobbini, A.; Martignago, D.; Bernardini, A.; Fornara, F.; Mantovani, R.; Nardini, M. Structural determinants for NF-Y subunit organization and NF-Y/DNA association in plants. Plant J. 2021, 105, 49–61. [Google Scholar] [CrossRef]
  5. Siefers, N.; Dang, K.K.; Kumimoto, R.W.; Bynum, W.E.; Tayrose, G.; Holt, B.F., 3rd. Tissue-specific expression patterns of Arabidopsis NF-Y transcription factors suggest potential for extensive combinatorial complexity. Plant Physiol. 2009, 149, 625–641. [Google Scholar] [CrossRef] [PubMed]
  6. Quach, T.N.; Nguyen, H.T.; Valliyodan, B.; Joshi, T.; Xu, D.; Nguyen, H.T. Genome-wide expression analysis of soybean NF-Y genes reveals potential function in development and drought response. Mol. Genet Genom. 2015, 290, 1095–1115. [Google Scholar] [CrossRef] [PubMed]
  7. Wang, J.; Jin, Z.; Zhou, M.; Yu, Y.; Liang, M. Characterization of NF-Y transcription factor families in industrial rapeseed (Brassica napus L.) and identification of BnNF-YA3, which functions in the abiotic stress response. Ind. Crops Prod. 2020, 148, 112253. [Google Scholar] [CrossRef]
  8. An, Y.; Suo, X.; Niu, Q.; Yin, S.; Chen, L. Genome-wide identification and analysis of the NF-Y transcription factor family reveal its potential roles in salt stress in alfalfa (Medicago sativa L.). Int. J. Mol. Sci. 2022, 23, 6426. [Google Scholar] [CrossRef]
  9. Wei, Q.; Wen, S.; Lan, C.; Yu, Y.; Chen, G. Genome-wide identification and expression profile analysis of the NF-Y transcription factor gene family in Petunia hybrida. Plants 2020, 9, 336. [Google Scholar] [CrossRef]
  10. Li, J.; Gao, K.; Khan, W.U.; Yang, X.; Yang, X.; Zhao, T.; Chen, Z.; An, X. Genome-wide analysis of the poplar NF-Y gene family and its expression in floral bud development of Populus tomentosa. Trees 2019, 34, 285–296. [Google Scholar] [CrossRef]
  11. Guo, Y.; Niu, S.; El-Kassaby, Y.A.; Li, W. Transcriptome-wide isolation and expression of NF-Y gene family in male cone development and hormonal treatment of Pinus tabuliformis. Physiol. Plant. 2021, 171, 34–47. [Google Scholar] [CrossRef]
  12. Pereira, S.L.; Martins, C.P.; Sousa, A.O.; Camillo, L.R.; Araújo, C.P.; Alcantara, G.M.; Camargo, D.S.; Cidade, L.C.; de Almeida, A.A.; Costa, M.G. Genome-wide characterization and expression analysis of citrus NUCLEAR FACTOR-Y (NF-Y) transcription factors identified a novel NF-YA gene involved in drought-stress response and tolerance. PLoS ONE 2018, 13, e0199187. [Google Scholar] [CrossRef] [PubMed]
  13. Dai, J.; Hu, A.; Zhang, J.; Liao, W.; Ma, H.; Wu, J. NF-YB-mediated active responses of plant growth under salt and temperature stress in Eucalyptus grandis. Plants 2021, 10, 1107. [Google Scholar] [CrossRef]
  14. Braybrook, S.A.; Harada, J.J. LECs go crazy in embryo development. Trends Plant Sci. 2008, 13, 624–630. [Google Scholar] [CrossRef] [PubMed]
  15. Hou, X.; Zhou, J.; Liu, C.; Liu, L.; Shen, L.; Yu, H. Nuclear factor Y-mediated H3K27me3 demethylation of the SOC1 locus orchestrates flowering responses of Arabidopsis. Nat. Commun. 2014, 5, 4601. [Google Scholar] [CrossRef]
  16. Wei, Q.; Ma, C.; Xu, Y.; Wang, T.; Chen, Y.; Lü, J.; Zhang, L.; Jiang, C.Z.; Hong, B.; Gao, J. Control of chrysanthemum flowering through integration with an aging pathway. Nat. Commun. 2017, 8, 829. [Google Scholar] [CrossRef]
  17. Bai, A.N.; Lu, X.D.; Li, D.Q.; Liu, J.X.; Liu, C.M. NF-YB1-regulated expression of sucrose transporters in aleurone facilitates sugar loading to rice endosperm. Cell Res. 2015, 26, 384–388. [Google Scholar] [CrossRef] [PubMed]
  18. Zhou, Y.; Zhang, Y.; Wang, X.; Han, X.; An, Y.; Lin, S.; Shen, C.; Wen, J.; Liu, C.; Yin, W.; et al. Root-specific NF-Y family transcription factor, PdNF-YB21, positively regulates root growth and drought resistance by abscisic acid-mediated indoylacetic acid transport in Populus. New Phytol. 2020, 227, 407–426. [Google Scholar] [CrossRef] [PubMed]
  19. Li, S.; Li, K.; Ju, Z.; Cao, D.; Fu, D.; Zhu, H.; Zhu, B.; Luo, Y. Genome-wide analysis of tomato NF-Y factors and their role in fruit ripening. BMC Genom. 2016, 17, 36. [Google Scholar] [CrossRef]
  20. Wang, Y.; Xu, W.; Chen, Z.; Han, B.; Haque, M.E.; Liu, A. Gene structure, expression pattern and interaction of Nuclear Factor-Y family in castor bean (Ricinus communis). Planta 2017, 247, 559–572. [Google Scholar] [CrossRef] [PubMed]
  21. Xu, X.; Su, H.; Sun, S.; Sun, J.; Zhang, X.; Yu, J. Genome-wide identification and expression profiles of Nuclear Factor Y a transcription factors in blueberry under abiotic stress. Int. J. Mol. Sci. 2024, 25, 12832. [Google Scholar] [CrossRef]
  22. Ma, X.J.; Yu, T.F.; Li, X.H.; Cao, X.Y.; Xu, Z.S. Overexpression of GmNF-YA5 confers drought tolerance to transgenic Arabidopsis and soybean plants. BioMed Central. 2020, 20, 123. [Google Scholar]
  23. Sato, H.; Suzuki, T.; Takahashi, F.; Shinozaki, K.; Yamaguchi-Shinozaki, K. NF-YB2 and NF-YB3 have functionally diverged and differentially induce drought and heat stress-specific genes. Plant Physiol. 2019, 180, 1677–1690. [Google Scholar] [CrossRef] [PubMed]
  24. Soyano, T.; Kouchi, H.; Hirota, A.; Hayashi, M. NODULE INCEPTION Directly targets NF-Y subunit genes to regulate essential processes of root nodule development in Lotus japonicus. PLoS Genet. 2013, 9, e1003352. [Google Scholar] [CrossRef] [PubMed]
  25. Leyva-González, M.A.; Ibarra-Laclette, E.; Cruz-Ramírez, A.; Herrera-Estrella, L. Functional and transcriptome analysis reveals an acclimatization strategy for abiotic stress tolerance mediated by Arabidopsis NF-YA family members. PLoS ONE 2012, 7, e48138. [Google Scholar] [CrossRef]
  26. Qu, B.; He, X.; Wang, J.; Zhao, Y.; Teng, W.; Shao, A.; Zhao, X.; Ma, W.; Wang, J.; Li, B.; et al. A wheat CCAAT box-binding transcription factor increases the grain yield of wheat with less fertilizer input. Plant Physiol. 2015, 167, 411–423. [Google Scholar] [CrossRef]
  27. Liu, X.; Cai, Y.; Yao, W.; Chen, L.; Hou, W. The soybean NUCLEAR FACTOR-YC4 and α-EXPANSIN 7 module influences phosphorus uptake by regulating root morphology. Plant Physiol. 2025, 197, kiae478. [Google Scholar] [CrossRef] [PubMed]
  28. Petroni, K.; Kumimoto, R.W.; Gnesutta, N.; Calvenzani, V.; Fornari, M.; Tonelli, C.; Holt, I.I.I.B.F.; Mantovani, R. The promiscuous life of plant NUCLEAR FACTOR Y transcription factors. Plant Cell 2012, 24, 4777–4792. [Google Scholar] [CrossRef]
  29. Letunic, I.; Doerks, T.; Bork, P. SMART 6: Recent updates and new developments. Nucleic Acids Res. 2009, 37, D229–D232. [Google Scholar] [CrossRef] [PubMed]
  30. Hu, B.; Jin, J.; Guo, A.Y.; Zhang, H.; Luo, J.; Gao, G. GSDS 2.0: An upgraded gene feature visualization server. Bioinformatics 2015, 31, 1296–1297. [Google Scholar] [CrossRef]
  31. Bailey, T.L.; Williams, N.; Misleh, C.; Li, W.W. MEME: Discovering and analyzing DNA and protein sequence motifs. Nucleic Acids Res. 2006, 34, W369–W373. [Google Scholar] [CrossRef]
  32. Magali, L.; Patrice, D.; Gert, T.; Kathleen, M.; Yves, M.; Yves, V.D.P. PlantCARE, a database of plant cis-acting regulatory elements and a portal to tools for in silico analysis of promoter sequences. Nucleic Acids Res. 2002, 30, 325–327. [Google Scholar]
  33. Chen, C.; Chen, H.; Zhang, Y.; Thomas, H.R.; Frank, M.H.; He, Y. TBtools: An integrative toolkit developed for interactive analyses of big biological data. Mol. Plant 2020, 13, 1194–1202. [Google Scholar] [CrossRef] [PubMed]
  34. Zhang, S.; Tong, Y.; Li, Y.; Cheng, Z.M.; Zhong, Y. Genome-wide identification of the HKT genes in five Rosaceae species and expression analysis of HKT genes in response to salt-stress in Fragaria vesca. Genes Genom. 2019, 41, 325–336. [Google Scholar] [CrossRef]
  35. Wang, Y.; Tang, H.; Debarry, J.D.; Tan, X.; Li, J.; Wang, X. MCScanX: A toolkit for detection and evolutionary analysis of gene synteny and collinearity. Nucleic Acids Res. 2012, 40, e49. [Google Scholar] [CrossRef]
  36. Larkin, M.A.; Blackshields, G.; Brown, N.P.; Chenna, R.; McGettigan, P.A.; McWilliam HClustal, W.; Clustal, X. version 2.0. Bioinformatics 2007, 23, 2947–2948. [Google Scholar] [CrossRef]
  37. Kumar, S.; Stecher, G.; Tamura, K. MEGA7: Molecular evolutionary genetics analysis version 7.0 for bigger datasets. Mol. Biol. Evol. 2016, 33, 1870–1874. [Google Scholar] [CrossRef]
  38. Thirumurugan, T.; Ito, Y.; Kubo, T.; Serizawa, A.; Kurata, N. Identification, characterization and interaction of HAP family genes in rice. Mol. Genet. Genom. 2008, 279, 279–289. [Google Scholar] [CrossRef] [PubMed]
  39. Böhlenius, H.; Huang, T.; Charbonnel-Campaa, L.; Brunner, A.M.; Jansson, S.; Strauss, S.H.; Nilsson, O. CO/FT regulatory module controls timing of flowering and seasonal growth cessation in trees. Science 2006, 312, 1040–1043. [Google Scholar] [CrossRef] [PubMed]
  40. Turck, F.; Fornara, F.; Coupland, G. Regulation and identity of florigen: FLOWERING LOCUS T moves center stage. Annu. Rev. Plant Biol. 2008, 59, 573–594. [Google Scholar] [CrossRef]
  41. Xu, M.Y.; Zhang, L.; Li, W.W.; Hu, X.L.; Wang, M.B.; Fan, Y.L.; Zhang, C.Y.; Wanfg, L. Stress-induced early flowering is mediated by miR169 in Arabidopsis thaliana. J. Exp. Bot. 2014, 65, 89–101. [Google Scholar] [CrossRef]
Figure 1. Phylogenetic, gene structure, and conserved motif analyses of the EgrNF-Y genes. (a) Phylogenetic analysis of the EgrNF-Y genes. (b) The yellow boxes represent CDS and black line represents intron, the upstream/downstream are depicted by blue boxes. (c) Conserved motif analysis. Conserved motifs (1–10) are represented by different colored boxes, and nonconserved sequences are indicated by gray line (sequences of conserved motifs are given in Figure S1).
Forests 16 00361 g001
Figure 2. Chromosomal location of NF-Y genes in E. grandis. Chromosome numbers are shown at the top of each bar. Chromosome size is indicated by the vertical scale.
Forests 16 00361 g002
Figure 3. Synteny analyses of NF-Y genes between E. grandis and two module plants (Arabidopsis thaliana and Populus trichocarpa). The green lines indicate the homologous pair of the NF-Y gene and their corresponding location on each chromosome. The gray lines in the background represent the syntenic pairs of the whole genome. To distinguish between different types of plants, the chromosome bars and the names of each plant species are represented in a different color (Arabidopsis is orange, E. grandis is green, and P. trichocarpa is blue).
Forests 16 00361 g003
Figure 4. Multiple sequence alignments of E. grandis NF-Y proteins: (a) EgrNF-YA, (b) EgrNF-YB, and (c) EgrNF-YC. The amino acids within this conserved domain and functional domain were individually labeled. The completely conserved amino acids and the relatively conserved amino acids (80%–100%) are colored with black boxes and gray boxes, respectively.
Forests 16 00361 g004
Figure 5. Phylogenetic analysis of E. grandis, Arabidopsis, and poplar NF-Y proteins. Three separate branches were established to correspond with genes containing distinct subunits. The number displayed in the tree represents the bootstrap value. The color pinkish red is indicative of NF-YCs, while green denotes NF-YB and yellow represents NF-YA.
Forests 16 00361 g005
Figure 6. Predicted EgrNF-Y protein interaction networks. The blue line represents an interaction between the two proteins. The size of the node indicates the degree of interaction with other proteins (the color gradient from blue to orange signifies a range from weak to strong interaction).
Forests 16 00361 g006
Figure 7. Analysis of cis-regulatory elements in the promoter region of EgrNF-Y gene in E. grandis. The cis-elements are marked with different-colored boxes in their respective positions.
Forests 16 00361 g007
Figure 8. Expression patterns of EgrNF-Y genes in different tissues. R, S, YL, ML, YX, and F are used to denote roots, stems, young leaves, mature leaves, xylem, and flowers, respectively. Data are mean ± SE of three biological replications. The asterisk above the bar indicates the difference in expression (* p < 0.05, ** p < 0.01, root as a control group).
Forests 16 00361 g008
Figure 9. Expression pattern analysis of EgrNF-Y gene in E. grandis seedlings under phosphorus deficiency condition. The black column represents normal growth condition, and the gray column represents phosphorus-deficient growth conditions. The gene expression analysis involved the collection of roots and leaves, respectively. The error bar represents the standard deviation of the three biological replicates. “*” and “**” denote statistically significant differences from the control sample at the 0.05 and 0.01 significance levels (t-test), respectively.
Forests 16 00361 g009
Table 1. The information of the nuclear factor Y gene family in E. grandis.
NameTranscript
Name
DNA LengthCDS LengthPeptide ResidueWM
(Kd)
pILocusChromosomes
Position
Subcellular Localization
NF-YA
EgrNF-YA1Eucgr.A02381.1492391230433.439.48Chr0139266249–39271172Nucleus
EgrNF-YA2Eucgr.A02570.1521197832635.349.13Chr0140871807–40877018Nucleus
EgrNF-YA3Eucgr.C00842.16915101733937.219.43Chr0313879073–13885988Nucleus
EgrNF-YA4Eucgr.K01943.1478260620222.247.90Chr0531968551–31973333Nucleus
EgrNF-YA5Eucgr.F03169.1511177725929.579.29Chr0643547878–43552989Nucleus
EgrNF-YA6Eucgr.J00764.1406796632234.726.76Chr108053229–8057296Nucleus
EgrNF-YA7Eucgr.K01921.1961194831635.259.53Chr1125456393–25466004Nucleus
NF-YB
EgrNF-YB1Eucgr.A01179.1506253417819.116.44Chr0124459334–24464396Nucleus
EgrNF-YB2Eucgr.B00669.1420647115717.364.70Chr026999487–7003693Nucleus
EgrNF-YB3Eucgr.B01293.136336312113.655.90Chr0220499626–20499989Nucleus
EgrNF-YB4Eucgr.B01299.12822829410.648.37Chr0220570932–20571214Nucleus
EgrNF-YB5Eucgr.B01300.136336312113.595.89Chr0220589022–20589385Nucleus
EgrNF-YB6Eucgr.B01303.143334511513.055.89Chr0220605624–20606057Nucleus
EgrNF-YB7Eucgr.B01940.148348316118.185.17Chr0236132078–36132561Nucleus
EgrNF-YB8Eucgr.L00153.1147766622223.085.91Chr0420329570–20331047Nucleus
EgrNF-YB9Eucgr.E03857.160660620222.315.56Chr0573093680–73094286Nucleus
EgrNF-YB10Eucgr.F02051.192792730932.857.69Chr0627056531–27057458 Nucleus
EgrNF-YB11Eucgr.G02796.1438560020022.168.59Chr0749153405–49157790Nucleus
EgrNF-YB12Eucgr.H01189.1199755518520.375.84Chr0813701266–13703263Nucleus
EgrNF-YB13Eucgr.H03892.197855218420.555.89Chr0853309416–53310394Nucleus
EgrNF-YB14 Eucgr.H04502.151057017019.105.26Chr0860897292–60897802Nucleus
EgrNF-YB15Eucgr.I00185.171471423826.876.30Chr093806528–3807242Nucleus
EgrNF-YB16Eucgr.J00499.1274185828630.988.86Chr105349209–5351950Nucleus
NF-YC
EgrNF-YC1Eucgr.B00106.1542581027030.025.59Chr02459824–465249Nucleus
EgrNF-YC2Eucgr.D01871.135735711912.836.73Chr0432254203–32254560Nucleus, Cytoplasm
EgrNF-YC3Eucgr.E00570.139939913314.678.82Chr055429231–5429630Nucleus
EgrNF-YC4Eucgr.F01474.1238279826629.665.62Chr0619881307–19883689Nucleus
EgrNF-YC5Eucgr.G03198.1430064521524.239.30Chr0752859040–52863340Nucleus
EgrNF-YC6Eucgr.H04476.1263176225428.145.30Chr0860666762–60669393Nucleus
EgrNF-YC7Eucgr.J00664.1224179526528.734.49Chr107199557–7201798Nucleus
EgrNF-YC8Eucgr.K02714.1416670523525.445.05Chr1134667163–34671329Nucleus, Cytoplasm
Disclaimer/Publisher’s Note: The statements, opinions and data contained in all publications are solely those of the individual author(s) and contributor(s) and not of MDPI and/or the editor(s). MDPI and/or the editor(s) disclaim responsibility for any injury to people or property resulting from any ideas, methods, instructions or products referred to in the content.

