1. Introduction
The United Nations has launched the 2030 Agenda to address global challenges; this includes 17 SDGs (Sustainable Development Goals) [
1], focusing on economic growth [
2], promoting equality, and mitigating environmental degradation, with a view to shaping a more sustainable, just, and prosperous future [
3]. The environment is very much a part of globalization politics [
4]. In view of the accelerated globalization process, environmental pollution and ecosystem degradation [
5] and the dire consequences of global warming [
6], there is a broad consensus in the international community that the promotion of SDGs (sustainable development goals) has become a key issue that needs to be addressed urgently. The core strategy for achieving these goals focuses on effectively addressing various global challenges [
7,
8].
Forest areas, as an important part of the earth’s ecosystem, are rich in natural resources and play a vital role in maintaining ecological balance and the stability of the human activity system [
9], at the same time, forests are human-dominated ecosystems [
10]. However, these regions are also experiencing serious challenges from various aspects, including environmental degradation [
11], ongoing biodiversity crisis [
12], poverty and population loss [
13]. Relevant studies have shown that abundant natural resources are not a sufficient driver of economic growth but rather constitute a limiting factor [
14], and the abundance of natural resources has not been effective in improving environmental quality [
15]. Accordingly, the phenomenon of out-migration has not only had a profound impact on the labor supply and economic composition of forested areas but also formed an intertwined relationship with the health of ecosystems and the green economy [
16,
17]. Therefore, an in-depth analysis of the impact of population outflow on economic growth and high-quality economic development in forest areas is of great significance for the formulation of effective development strategies and the promotion of sustainable development in forest areas.
However, previous studies have generally paid insufficient attention to the success or otherwise of forest area transformation. Compared with large cities, the economic development status of some forest areas is relatively lagging behind [
18], and vast forested areas often coincide geographically with a large number of impoverished populations who rely on forests for their livelihoods [
19]. Currently, key state-owned forest areas in China are still facing a series of severe challenges such as lagging economic development [
20], irrational industrial structure [
21], prominent aging problem [
22], increasing social burden, and constraints of geographic and climatic conditions, compared to developed areas [
23]. The combined effects of these factors drive population migration to more livable areas. In exploring the theme of population and economy in forest areas, we first focus on the specific impacts of state-owned forest reforms on the quality of life of workers’ families and their ability to restore their livelihoods [
24], and then we explore how the population and economy in forest areas can achieve long-term sustainable development [
25].
In the face of the multiple current challenges, and given the unique stage of economic development in forest areas—, i.e., a steady state of neither abundance nor scarcity—it has become insufficient to focus solely on enhancing economic growth. Thus, it is necessary to shift to the pursuit of a high-quality economic development path. Setting high standards and specific requirements has become a necessary means to gradually narrow the economic gap with developed regions. This study is innovative for the following reasons. Firstly, focusing on Heilongjiang, Jilin and the Inner Mongolia Autonomous Region—the provinces where China’s key state-owned forest areas are located—a set of indicators of high-quality economic development is constructed based on the core concept of green development. Then, the state of high-quality economic development from 2000 to 2022 is evaluated accordingly. Secondly, this study focuses on the phenomenon of population exodus from forest areas and the specific impact of the population exodus from forest areas on the economy is analyzed from the perspectives of economic growth and high-quality economic development. Accordingly, a series of targeted recommendations and countermeasures are proposed. This is of great significance in enriching the knowledge of regional development in forest areas, promoting the harmonious and sustainable development of forest areas, and aiding the implementation of rural revitalization strategies.
The research content planning of this paper is summarized as follows: the second part focuses on the research background and theoretical structure. This part comprehensively compiles and deeply analyzes the relevant literature, and builds a solid theoretical cornerstone for this paper. Among them,
Section 2.1 elaborates on the three major stages of forest area development: from the stage of economic growth, through the stage of sustainable development, to the stage of high-quality development, which comprehensively reviews the development history of forestry and forest areas; while
Section 2.2 is divided into two parts, one is to summarize the literature related to high-quality development, and the other is to discuss the theoretical links between population mobility and economic development, which provides strong theoretical support. Then, the third part,
Section 3.1, describes the study area and its current situation, specifically analyzing key indicators such as population density, natural growth rate and net outflow of population in Heilongjiang, Jilin and Inner Mongolia; and
Section 3.2 constructs a system of variables and models, elaborating the mechanism of the impact of population mobility (including the number of mobility and mobility rate) on economic growth and high-quality development of the economy and adopting the principal component analysis and fixed effect model as research tools. The fourth part shows the research results, which are mainly divided into two main aspects: on the one hand, it explores the effect of population outflow on economic growth, and on the other hand, it analyzes the impact of population outflow on the high-quality development of the economy. The fifth part is an in-depth discussion of the research results and provides targeted recommendations. Finally, the sixth part summarizes the whole paper and outlines the main findings of the paper.
2. Policy Background and Research Framework
2.1. Background of the Study on the Development of Forest Areas in China
According to the concept and pursuit of sustainable development of forestry and forest areas, China’s forest area development can be divided into three stages, namely, the economic growth stage, the sustainable development stage and the High-quality economic development stage. Among them, the economic growth stage mainly covers the period before 2000. In this stage, China’s forest areas pursued the growth of forest product production and output value, especially timber and wood forest products. However, this development concept caused large-scale destruction of forest resources and a series of ecological crises [
26,
27], including degradation of forests and landscapes [
28], loss of biodiversity [
29], unacceptable levels of soil erosion and catastrophic flooding [
30]. At the same time, due to the destruction of forest resources, the livelihoods of forest enterprises and forest dwellers also face unsustainable impacts [
31]. Therefore, China began to reduce timber production and implement natural forest resource protection projects in 2000. This is also an important symbol that China’s forest areas have entered the stage of sustainable development [
32].
The stage of sustainable development of forest areas mainly contains 2000–2017. In order to enhance the sustainability of forest areas, after 2000, China reduced timber production and restored forest resources by implementing or strengthening ecological projects in forest areas [
33,
34]. One of the most famous ecological projects is the natural forest resources protection project. The implementation of these ecological projects aims to enhance the natural resilience of forests, ensure intergenerational equity in forest areas, and then realize sustainability. However, in the process of implementation, the exploitation and utilization of forest resources have been strictly restricted by policies, leading to problems such as a single source of funding for forest areas, loss of population in forest areas and declining incomes for forest farmers, which have not realized sustainable development as expected [
35].
The stage of high-quality economic development of forest areas mainly covers the stage of operational transformation of China’s forest areas since 2018. In 2017, the Chinese government put forward the requirement of high-quality economic development, i.e., a development that conforms to innovation, coordination, greenness, openness and sharing, which effectively covers a number of aspects such as the power and results of development, and efficiency and fairness, etc. This requirement was soon regarded as a new idea for the development of forest areas for a number of reasons, including the following: firstly, high-quality development puts forward innovative development, breaks through the factor limitations of forest area development, and provides new development ideas for forest areas with population loss and insufficient funds; secondly, high-quality development puts forward green development and coordinated development and provides ideas for alleviating the contradiction between protection and utilization in the development of forest areas. It can be seen that the breakthrough strategy for China’s forest areas is not only the pursuit of simple economic growth but also the pursuit of high-quality economic development.
High-quality economic development can be summarized as five dimensions: innovation, coordination, green, openness and sharing. High-quality economic development applied to forest areas can be defined as follows: through innovations in science and technology, industrial structure, and organization and management, it achieves orderly restoration of forest resources and provides a basis for industrial development in forest areas, achieving development that includes ecological and economic benefits. The selection of high-quality economic development as the main object of observation is in line with the latest development dynamics and the real needs of China’s forest areas.
2.2. Research Framework
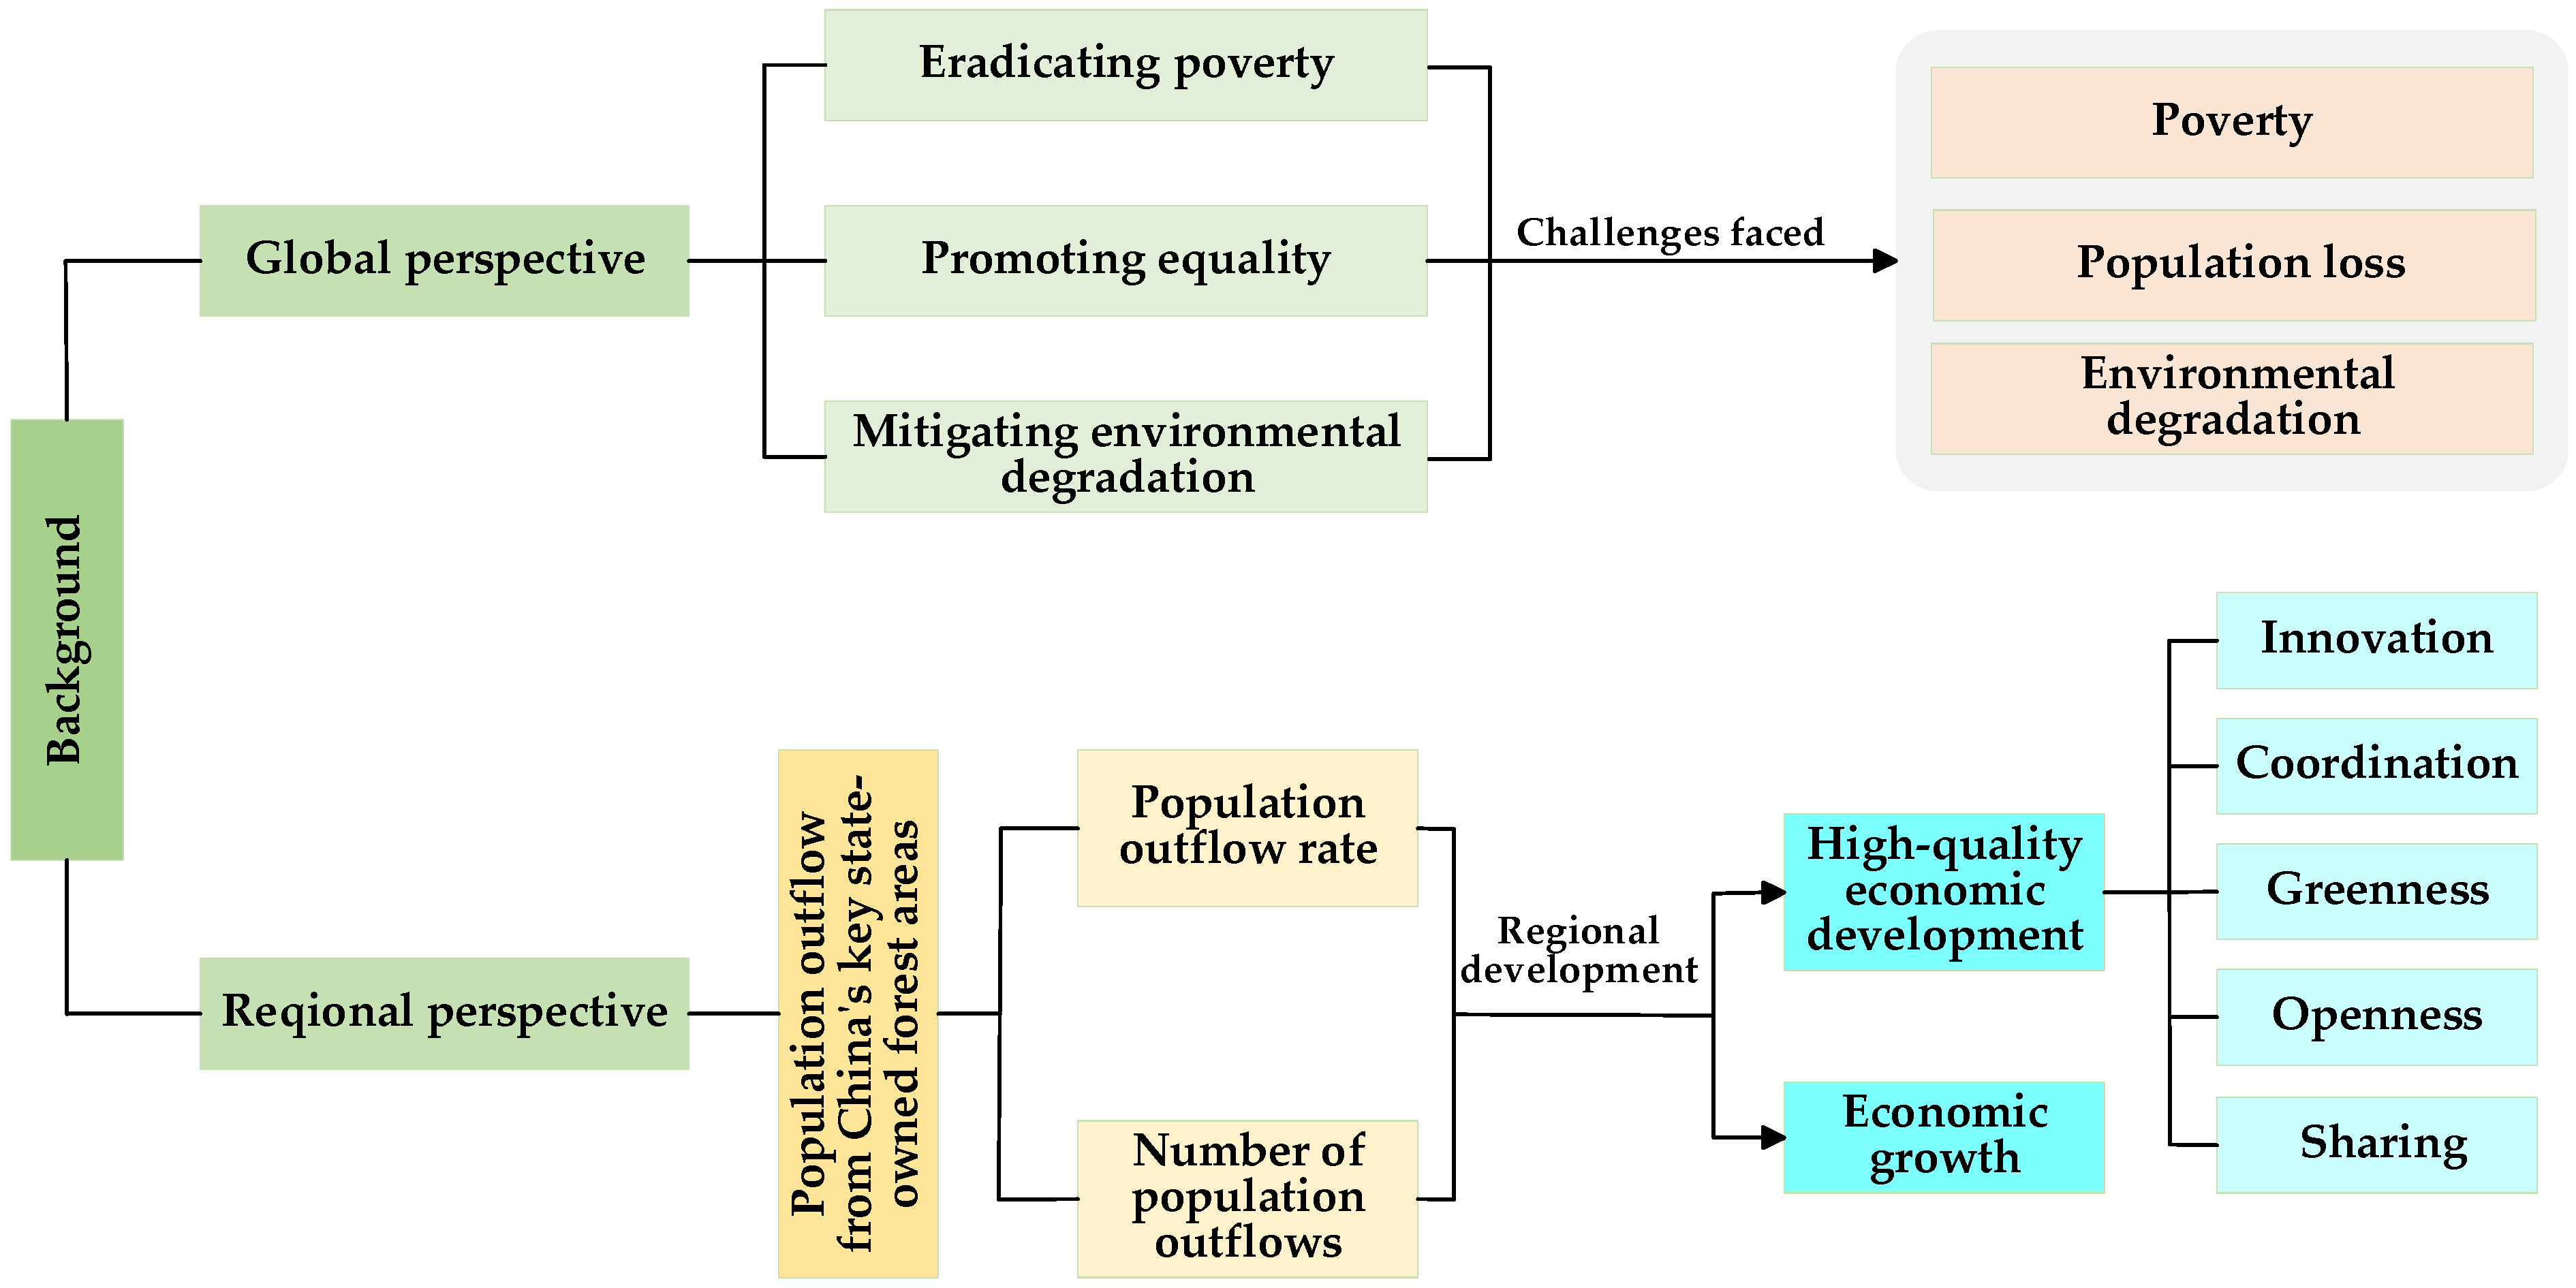
In this section, the study presents a theoretical analytical framework based on the Background of the study on the development of forest areas in China, the impact of high-quality economic development and population exodus on economic development (
Figure 1).
2.2.1. High-Quality Economic Development
High-quality economic development, as its name suggests, emphasizes the quality of economic development rather than mere speed or scale expansion, and represents a new stage of economic development, an inevitable choice for China’s economy as it enters a new normal. Prior to the introduction of high-quality development, the quality of economic growth was commonly used in economics to discuss the “quality” of economic growth [
36]. Economist have been studying economic growth from classical growth models and neoclassical growth models to endogenous growth models [
37]. Since Kamaee first proposed two dimensions of the quality of economic growth in 1977, economists have continued to expand their research horizons to include factors such as environmental sustainability and social welfare enhancement. Krugman argues that economic growth in East Asia is largely dependent on factor inputs, and that total factor productivity does not have a significant impact on economic growth in East Asia [
38]. Moreover, Agbola (2014) conducted an in-depth analysis of the complex impacts of single or multiple factors on the internal mechanism of the quality of economic growth [
39]. Meanwhile, Qi (2016) comprehensively assessed the quality of economic growth in terms of four dimensions: scale expansion, performance improvement, structural optimization and system synergy [
40]. Mlachila (2017) constructed an innovative “economic growth quality index” that provides a new perspective for the quantitative assessment of the quality of economic growth [
41].
In China’s current socio-economic context, high-quality development is not only a theoretical pursuit but also a key path to address real challenges and solve pressing problems. In recent years, high-quality development has become an inevitable requirement for the sustained and healthy development of China’s economy, and China is pursuing a sustainable ecology and a society in which people are happy while developing its economy [
42]. The rich connotations of Chinese scholars on high-quality economic development have attracted extensive attention from the academic community. For example, Wei Min (2018) has pointed out that high-quality development goes beyond the pursuit of a single goal, focuses more on improving the intrinsic quality and efficiency of economic development, and seeks to realize the unification of quality and quantity in growth [
43]. Despite the different perspectives and elaborations presented by scholars, there is a general consensus that high-quality economic development is reflected in the comprehensive enhancement of efficiency, equity, green development, sustainability, and security and stability [
44]. Secondly, quantitative assessment methods regarding the level of high-quality economic development have become key aspects of the discussion. The assessment tools that are commonly adopted by academics are mainly categorized into the single-indicator method and the comprehensive index method. The single-indicator method mainly focuses on the total factor productivity [
45], green total factor productivity [
46] and labor productivity [
47].
In recent years, high-quality development has become an inevitable requirement for the sustained and healthy development of China’s economy, and China is pursuing sustainable ecology and people’s well-being in society while developing its economy [
42]. The rich connotations of high-quality economic development among Chinese scholars have attracted extensive attention within the academic community. Meanwhile, the comprehensive index method, based on the new development concept, consists of a set of multi-dimensional assessment systems, aiming to comprehensively and accurately measure the overall status of high-quality economic development. For example, scholars such as Nie Changfei (2020) focus on the assessment dimensions of quality and efficiency [
48]. Meanwhile, Sinha et al. (2022) defined HQED (High-Quality Economic Development) in terms of economy, coordination, innovation, openness, greenness, and inclusiveness [
49]. Huan Zheng (2024) designed a five-level hierarchical assessment framework for the HQED (High-quality economic development stage) system across the five domains of economy, politics, culture, society and ecological civilization [
50]. Dan Sun (2024) constructed a HQED (High-quality economic development stage) evaluation index system around the five dimensions of “innovation, greenness, coordination, openness and sharing” [
51]. Finally, regarding the realization of high-quality economic development, scholars such as Ren Baoping (2022) [
52] and Gao Changhai (2024) [
53] emphasize that the ideal path should demonstrate strong integration and a dynamic synergy among economic, natural and social systems, so as to achieve the goal of comprehensive, coordinated and sustainable development. This study will enrich and expand the theory of high-quality economic development and provide a theoretical basis for promoting high-quality economic development in the world’s forestry regions.
2.2.2. Impact of Population Mobility on the Economy
From a theoretical point of view, there exists a close and complex correlation between population mobility and economic development. This relationship is not only reflected in the basic driving factors of population flow but also in the results of the flow and its impact on the outflow and inflow areas [
54]. The relationship between population mobility and development has undergone a fundamental shift, “swinging back and forth like a pendulum” [
55]. In other words, it is constantly shifting between positive and negative as time progresses. Population outflows often cause labor shortages and insufficient incentives for economic development due to population loss, while inflows may cause social problems and resource constraints due to the over-concentration of the population [
56]. A controversial topic is the effect of the mobile population on the development of the outflow area, i.e., whether it promotes the local development process or, on the contrary, constitutes an obstacle to development. This study focuses on the phenomenon of population outflow from forest areas, in which the massive outflow of laborers has created a serious imbalance in the population age structure in China’s key state-owned forest areas. This poses a major challenge to the stability of the labor market and the rational allocation of resources, while also aggravating the pressure on the carrying capacity of the social production system. Studies have been conducted to explore the impact of population outflow from forest areas, but there are divergent views. Some scholars believe that the migration of people from forest areas contributes to the restoration of ecosystems. Population outflow reduces human interference in the natural environment to a certain extent, which is conducive to ecological restoration and biodiversity conservation in forest areas [
57]. However, some experts hold opposing views. They point out that, as the rural population in forest areas decreases, the increasing demand for resources by the urban population in these areas may exacerbate environmental problems such as deforestation [
58,
59]. At the same time, population exodus places pressure on the management of forestry ecological resources in terms of staff shortages, which affects the sustainable development of forest areas [
60]. However, there is a relative lack of academic research on the far-reaching impacts of this exodus on the economy in forest areas. These impacts play a crucial role in promoting high-quality regional development—especially the sustainable development of forest areas.
3. Materials and Methods
3.1. Study Area
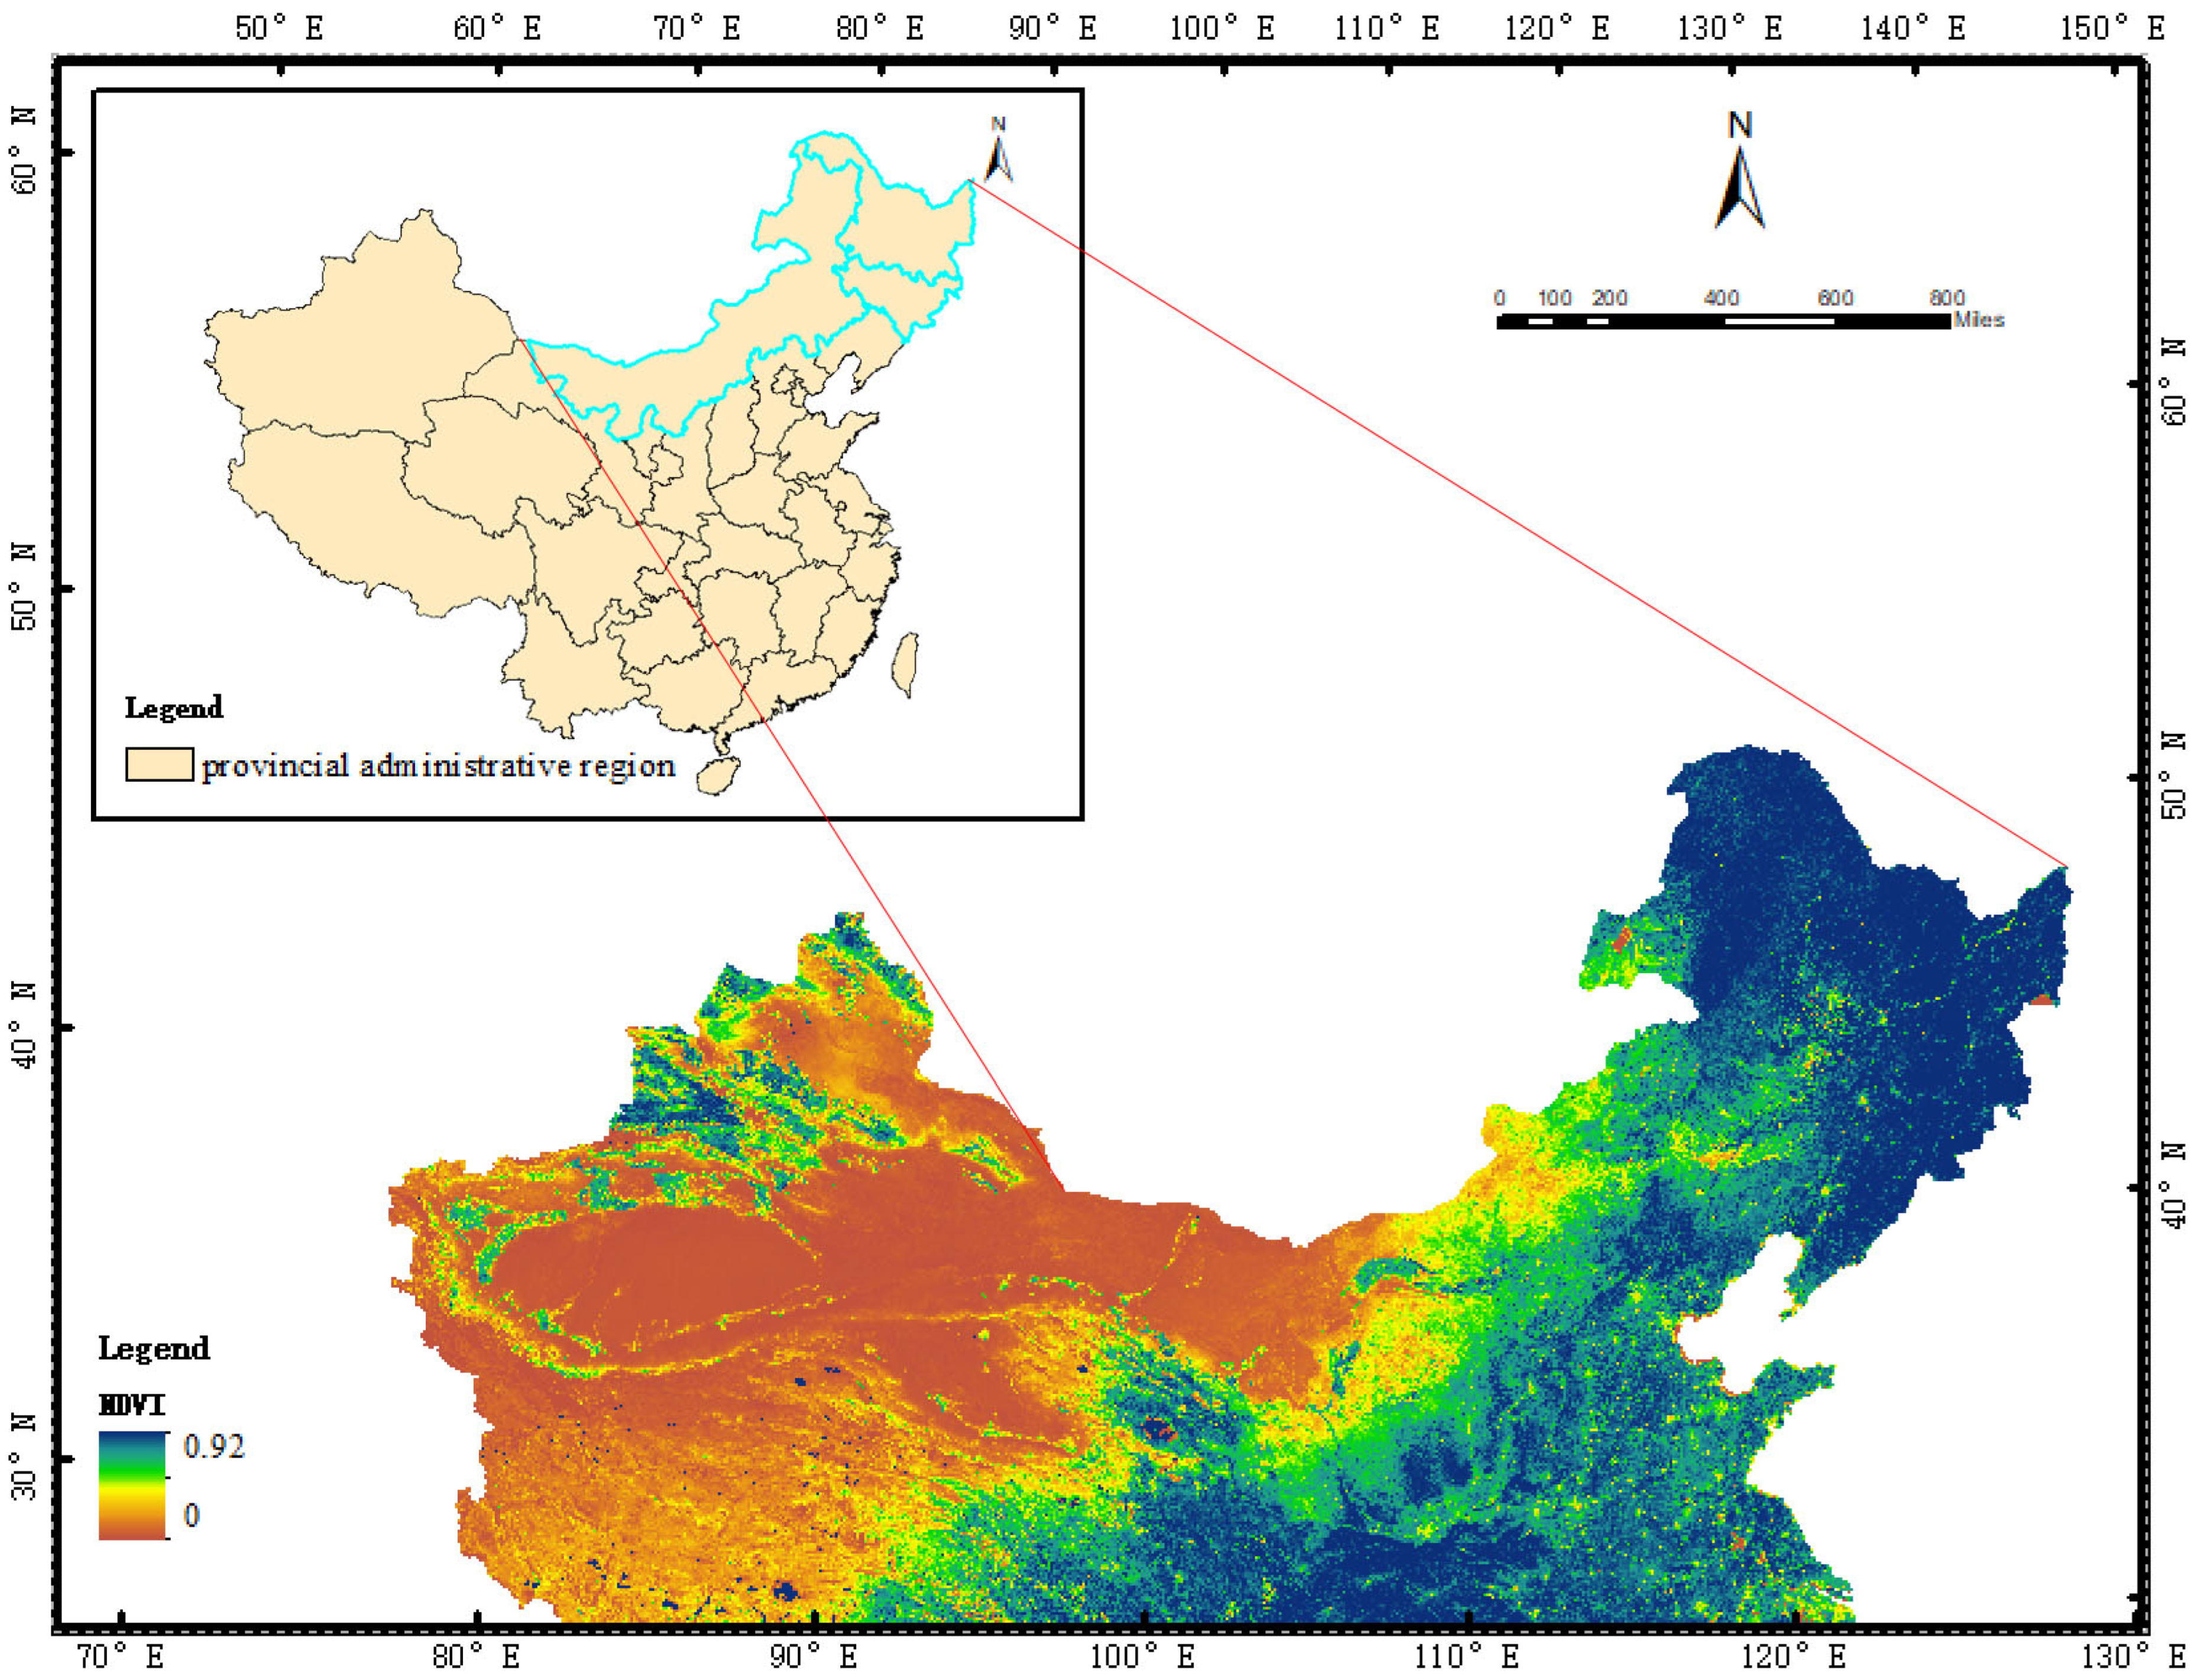
This study focuses on the key state-owned forest areas in Northern and Northeastern China, namely Heilongjiang, Jilin and the Inner Mongolia Autonomous Region. These are located in the latitudinal and longitudinal ranges from 97°12′ E to 135°05′ E and from 37°24′ N to 53°33′ N, with a predominantly cool–temperate, temperate–continental monsoon and temperate–continental climate spanning from temperate to cool–temperate climatic zones. This study area not only exhibits high natural ecological value but also plays a crucial role in promoting regional economic development and maintaining ecological security. Specifically, Heilongjiang, Jilin and Inner Mongolia are rich in natural resources and have a core geographic area composed of major state-owned forests (
Figure 2).
Under the macro perspective of regional economic and social progress, maintaining an appropriate population size constitutes a prerequisite for sustained regional development, creating a domestic demand and providing the necessary factors of production for the regional economy. Currently, the provinces containing key state-owned forest areas—especially Heilongjiang, Jilin and Inner Mongolia, which are the focus of this work—exhibit the highest levels of negative population growth. Their main contradictions and challenges have shifted away from rapid population growth, exhibiting a strategic transformation and seeking long-term, balanced population development. Since 2000, the year-end population numbers in Heilongjiang, Jilin and Inner Mongolia have shown decreasing trends, albeit to different degrees. Specifically, the population of Heilongjiang Province declined from 45 million in 2000 to 37.68 million in 2022, representing a decrease of approximately 7.32 million. The population of Jilin Province declined from 40 million to 29.93 million, i.e., a decrease of 1.07 million. Finally, the population of the Inner Mongolia Autonomous Region has declined from 35 million to 24.76 million, with a decrease of approximately 10.24 million. This series of data suggests that these three regions are facing serious population loss.
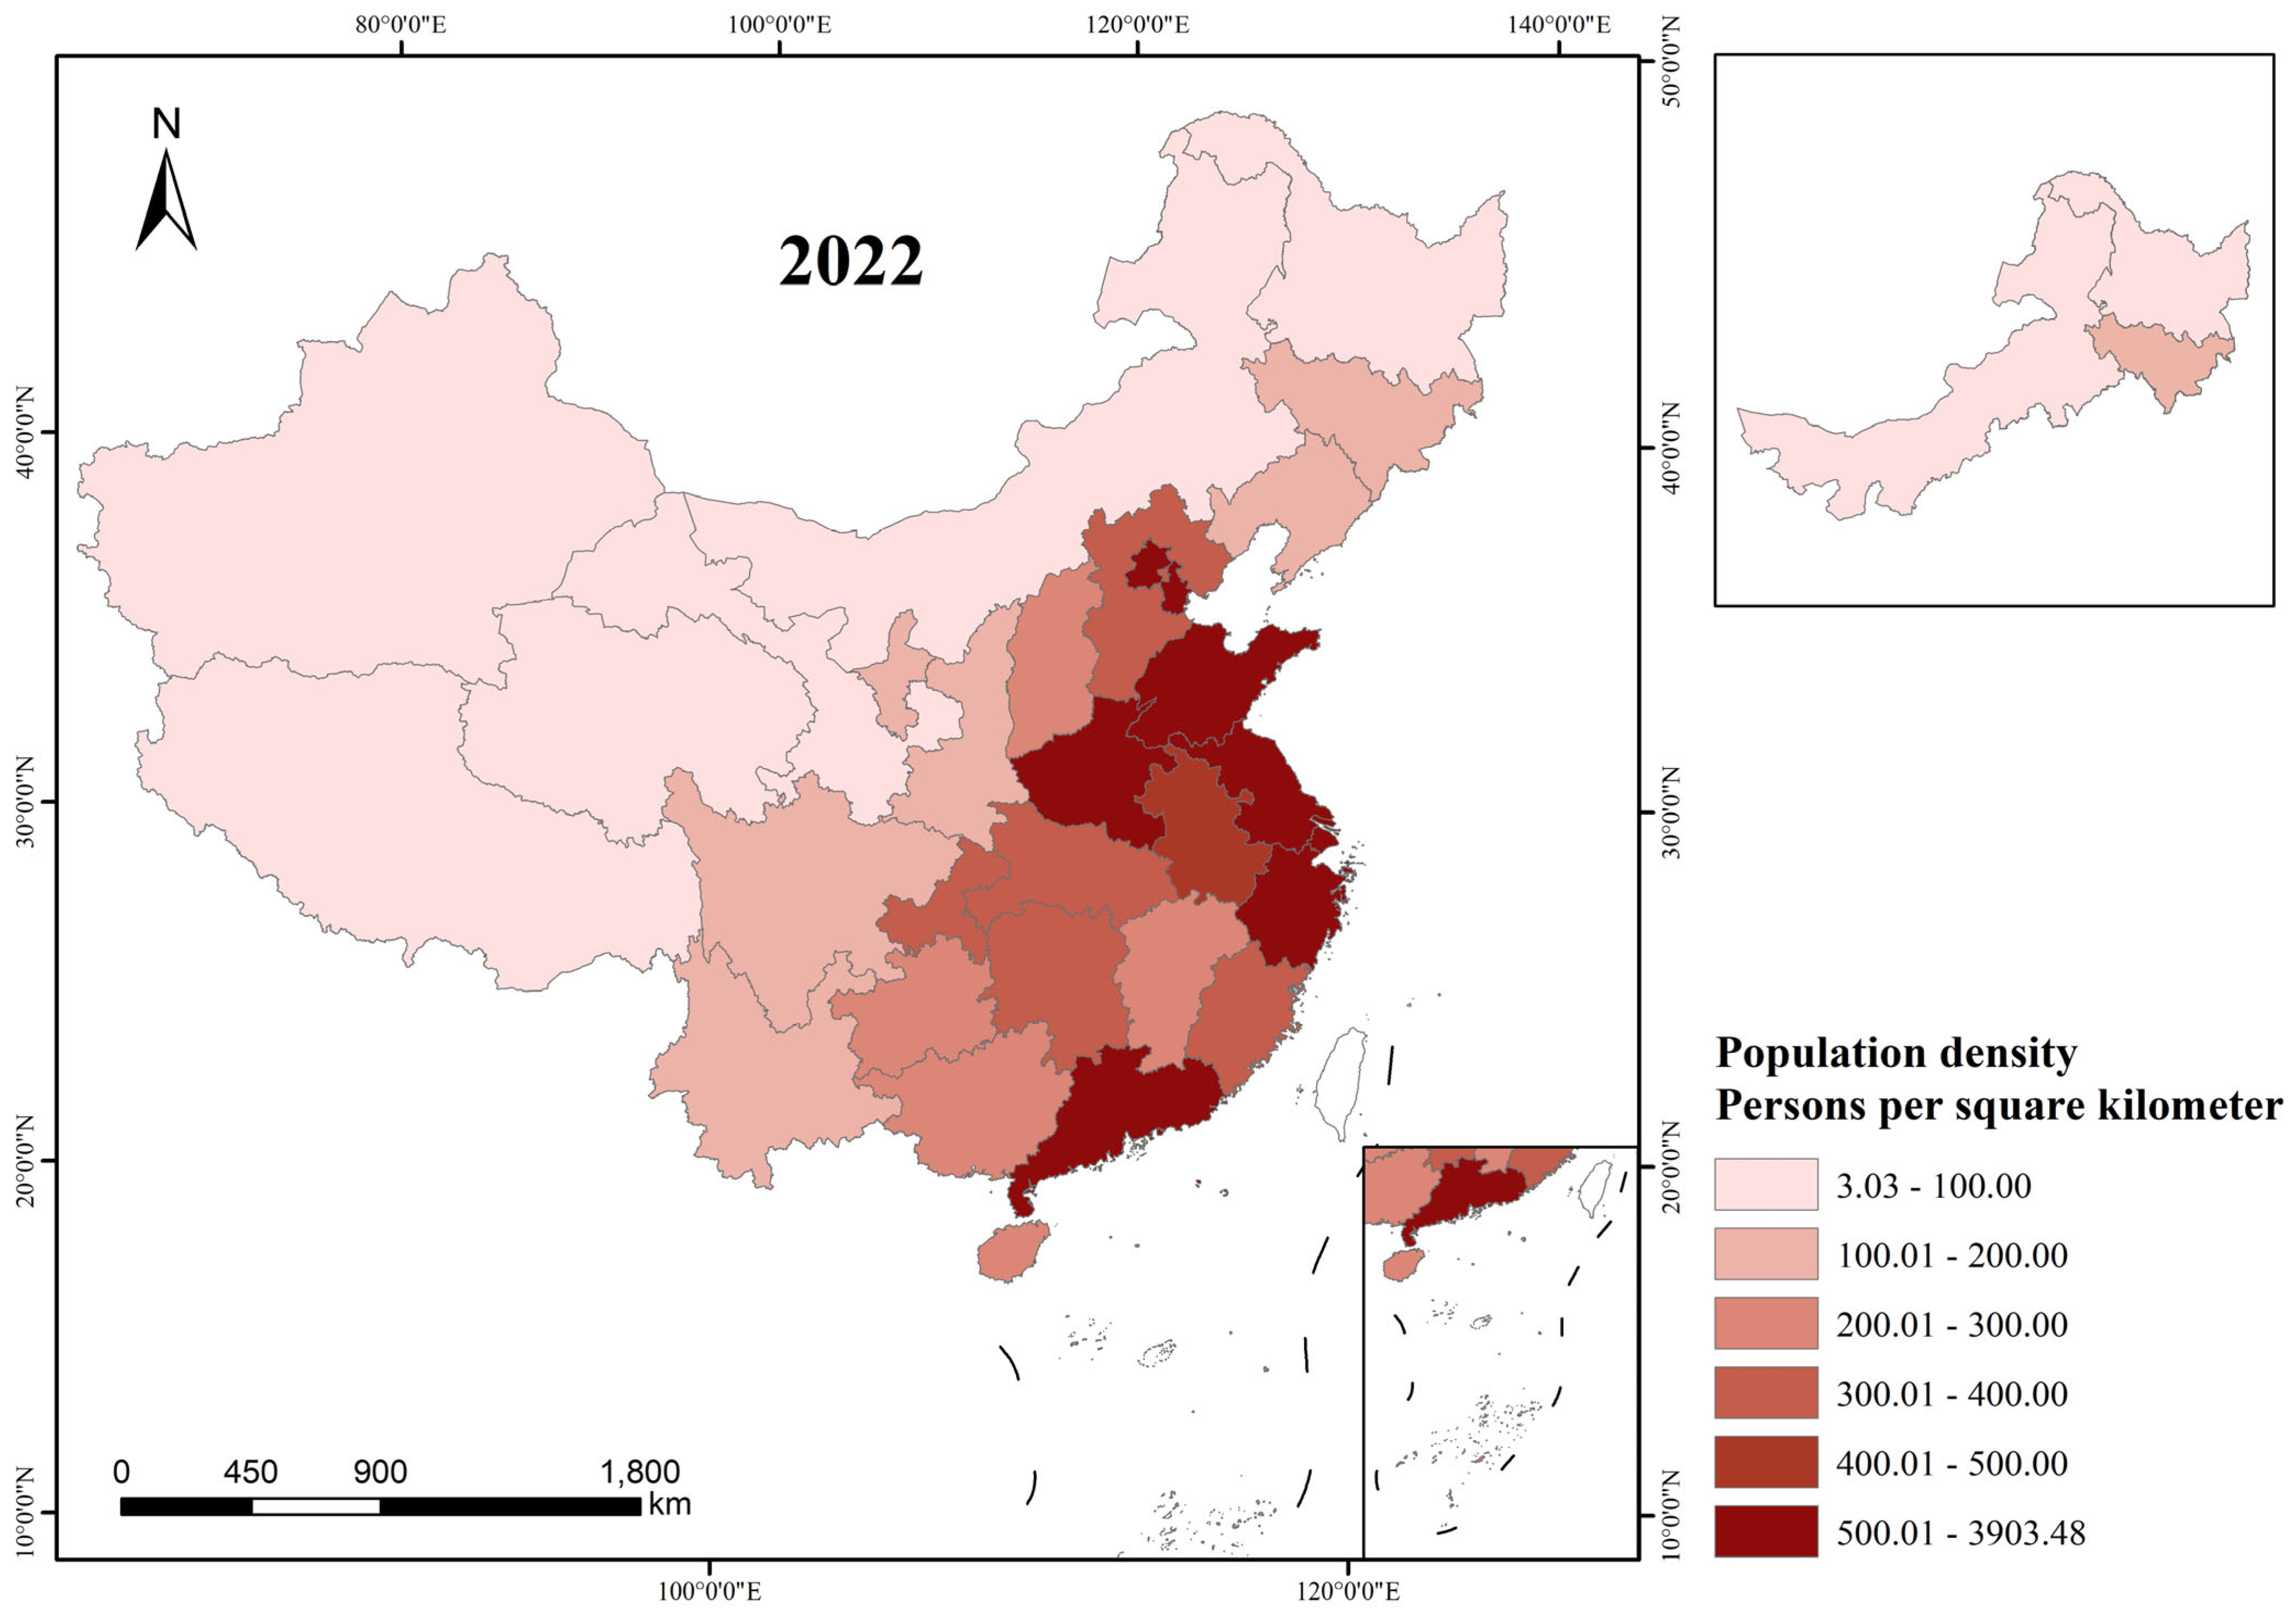
Figure 2 shows the distribution of the population density in China in 2022, with Heilongjiang Province having a population density of 66 people per km
2. This highlights the relatively sparse distribution of the population in this province, which is characterized by a large geographical area. Jilin Province has a population density of 125 people per km
2, which is slightly higher than that of Heilongjiang Province, but it still belongs to the sparsely populated category. The Inner Mongolia Autonomous Region has the lowest population density, with only 20 people per km
2, demonstrating the extremely sparse distribution of the population in this region, which is also characterized by a large geographical area (
Figure 3).
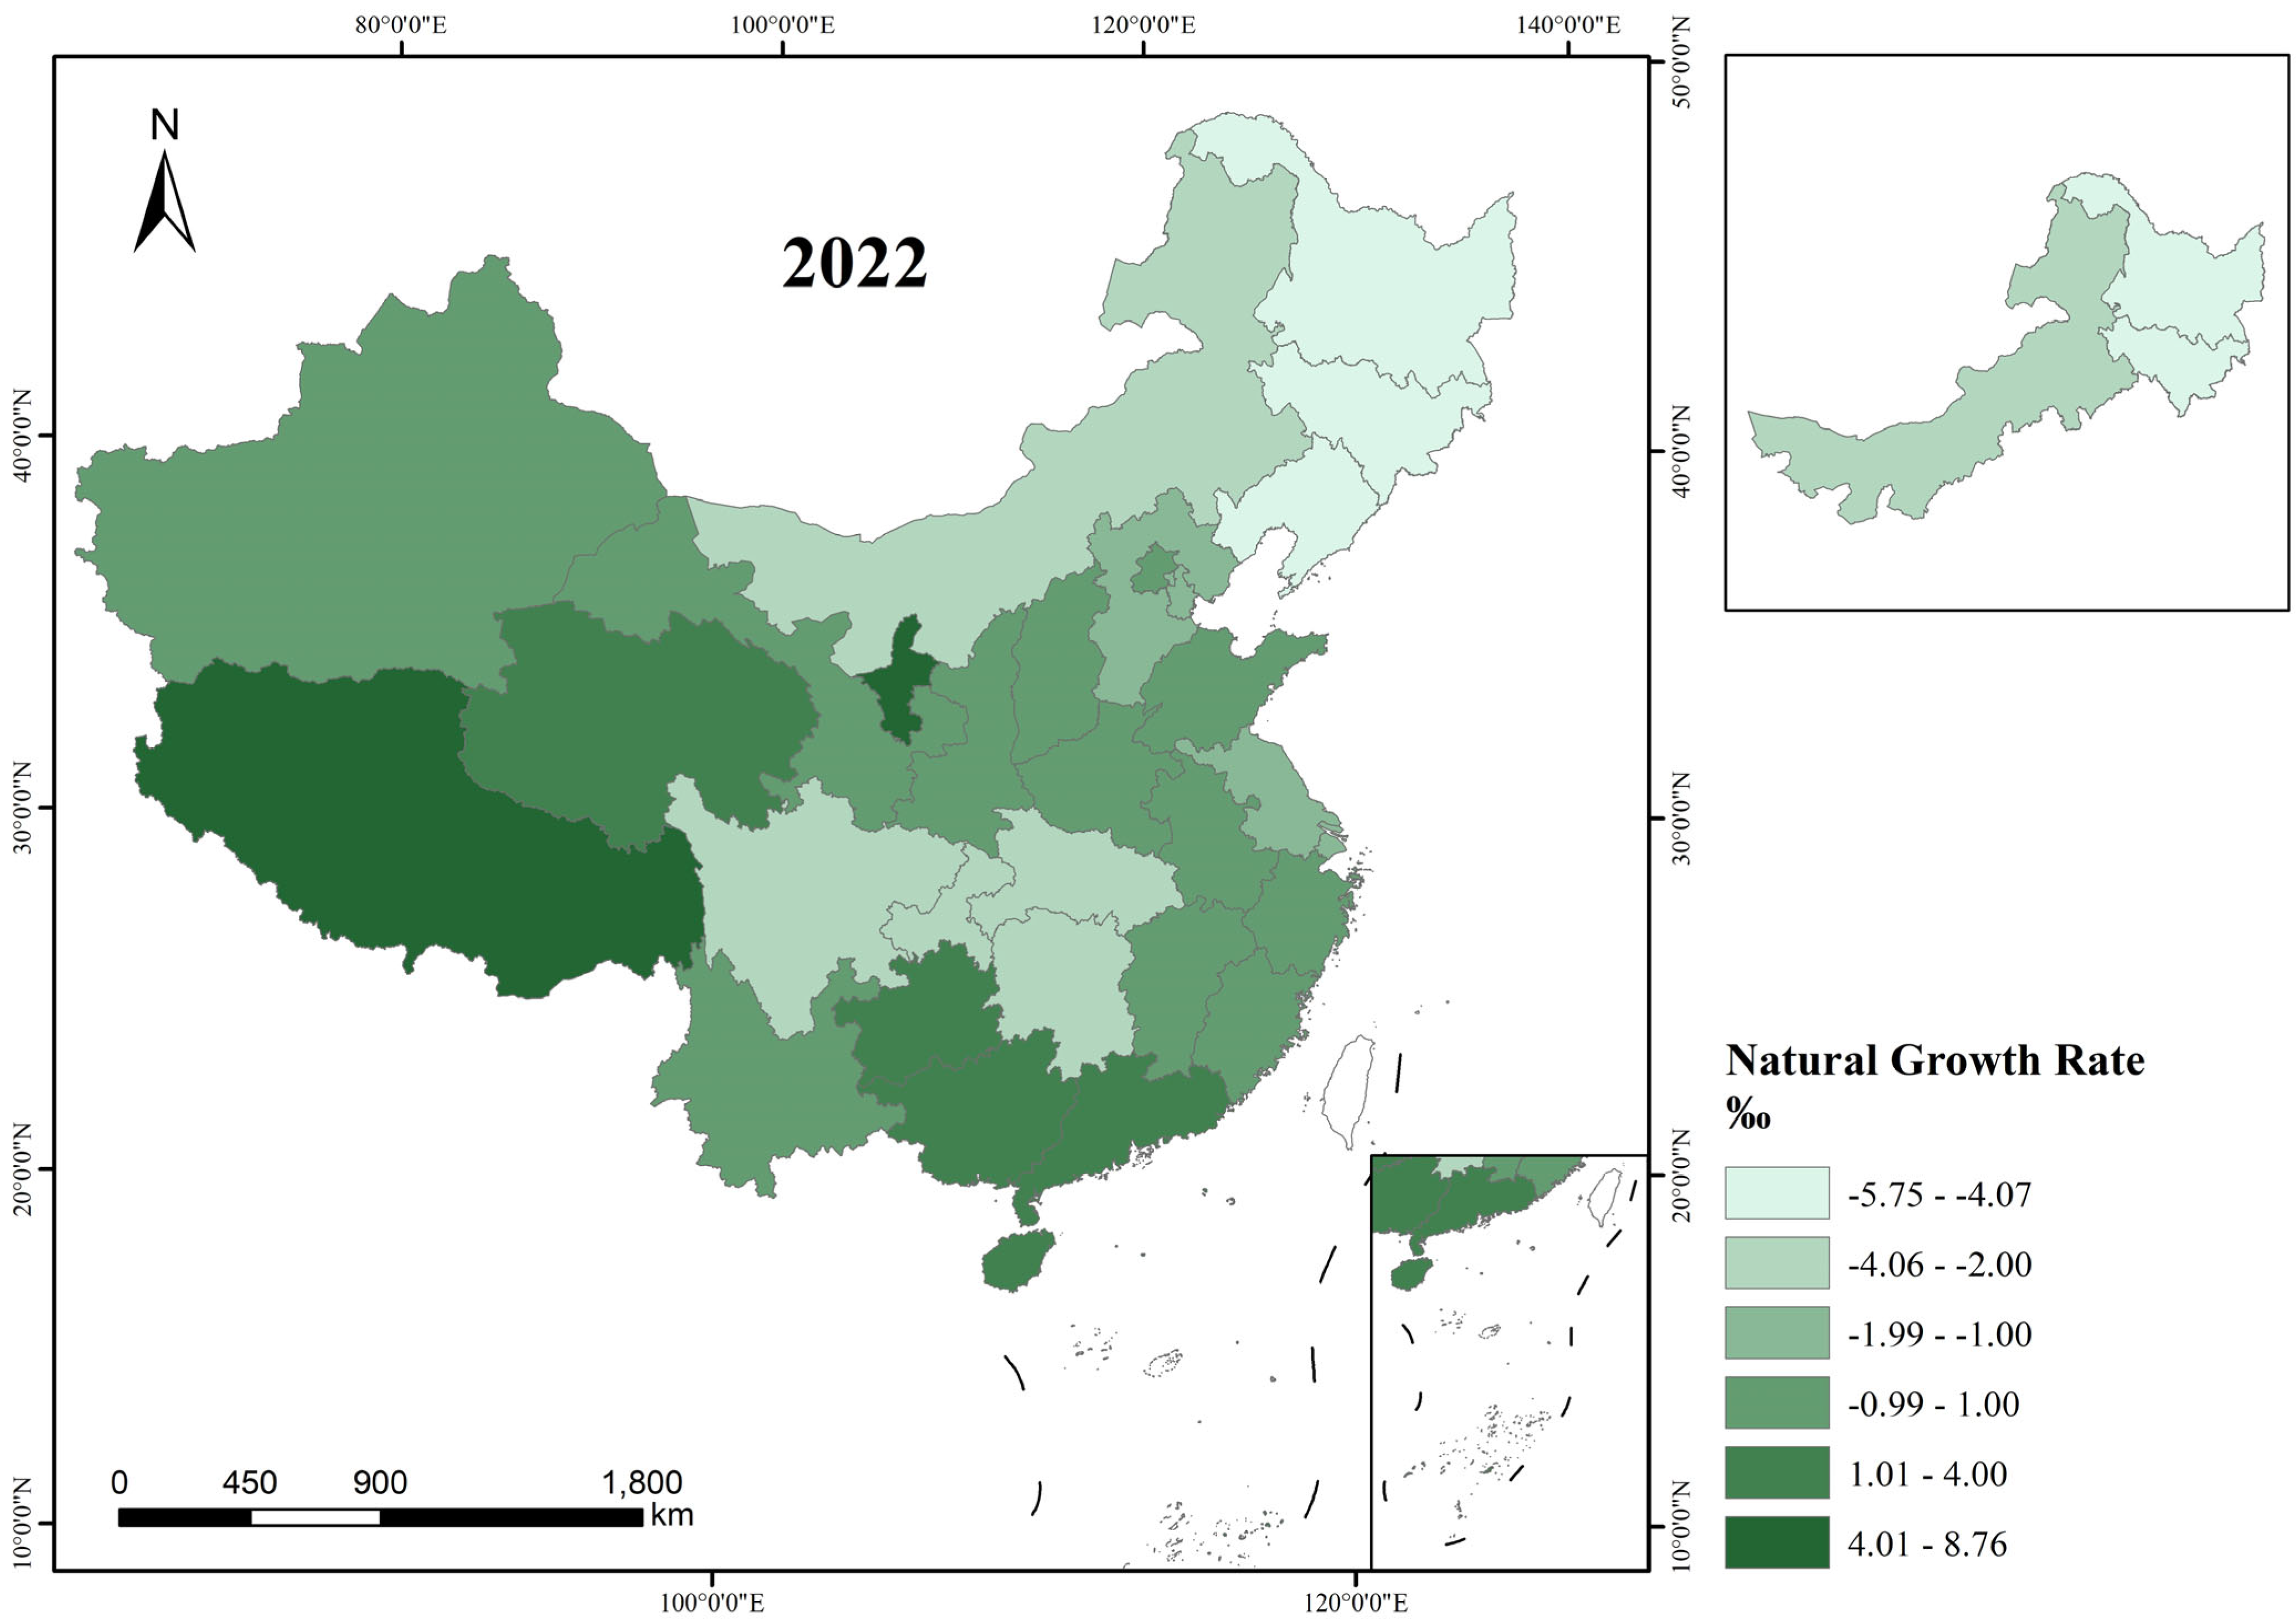
During the period from 2000 to 2022, the natural population growth rates of Heilongjiang, Jilin and Inner Mongolia showed more distinctive trends. Heilongjiang Province maintained a mostly positive growth trend, with growth rates as high as 8% in some years, reflecting the sustained momentum and vitality of its population. In contrast, Jilin Province and the Inner Mongolia Autonomous Region had generally low rates of natural population growth and repeatedly exhibited negative growth (e.g., the rate in Inner Mongolia was as low as −8%, and that of Jilin was as low as −6%). This underscores the serious challenges and pressures that these regions face in terms of population growth.
Figure 3 depicts the distribution of China’s natural population growth rate in 2022. Specifically, Heilongjiang Province showed a natural population growth rate of −5.75 per thousand, indicating that this province experiences negative population growth in its natural state. This can be mainly attributed to a decline in the birth rate, an increase in the death rate or a combination of the two. The natural population growth rate in Jilin Province was also negative—specifically −4.07‰—indicating that this area is also experiencing a population decline and is in urgent need of effective measures to stimulate population growth. Although the natural population growth rate in the Inner Mongolia Autonomous Region was relatively low, at −2.25 per thousand, it still exhibits a negative growth state and also requires great attention and corresponding countermeasures to address the challenge of population decline (
Figure 4).
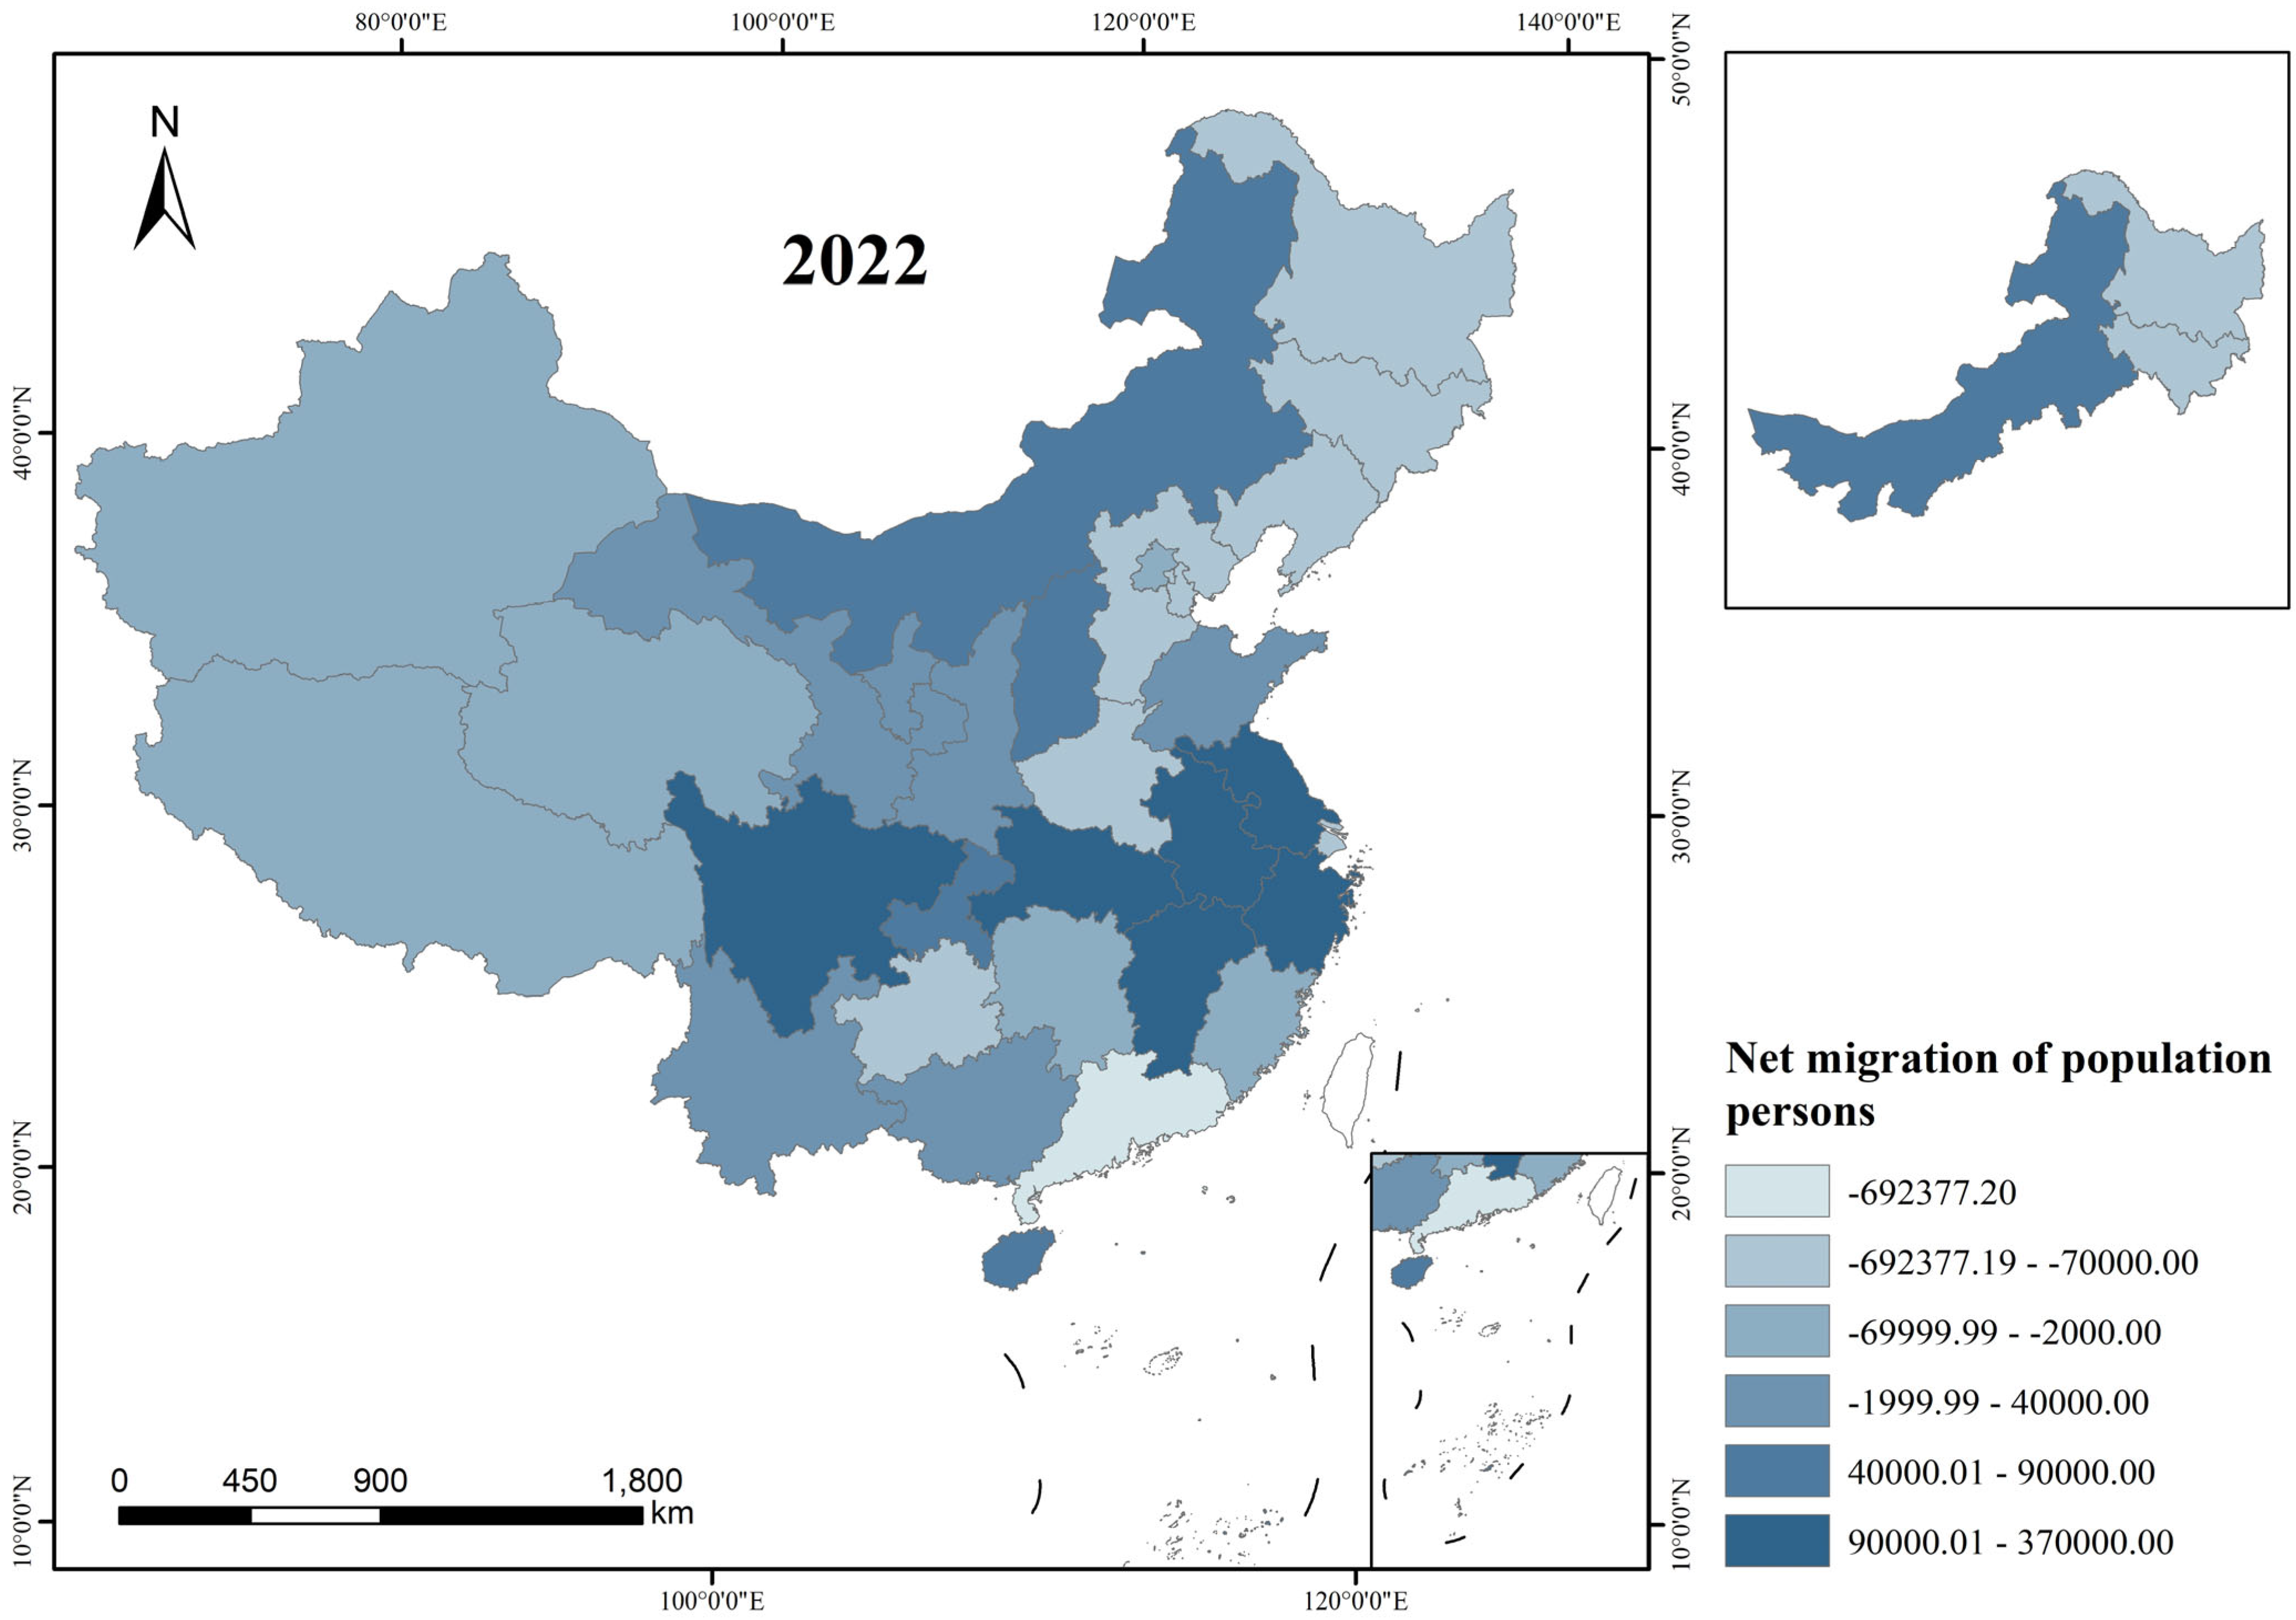
In the period 2000 to 2022, the population migration status in Heilongjiang Province, Jilin Province and the Inner Mongolia Autonomous Region exhibited significant volatility. Specifically, Heilongjiang Province showed negative population migration, i.e., a net population outflow, in most years, and this trend was particularly pronounced in 2015 and 2020, highlighting the challenges that it faces in population attraction and retention. Jilin Province shows similar population migration trends but with relatively smaller fluctuations. In contrast, the scale of population migration in the Inner Mongolia Autonomous Region is characterized by certain bidirectional changes, with both positive (i.e., inflow of population) and negative (i.e., outflow of population) values. This suggests that this region is relatively active and experiences frequent population migration.
Figure 4 illustrates the net migration of population in China in 2022. The net migration of the population in Heilongjiang Province amounted to −80,312.5, indicating that this province exhibits a net outflow in population migration, which may be due to a combination of economic, social or environmental factors. The net migration of the population in Jilin Province, on the other hand, amounted to −173,337.5 people. This is a large net outflow rate, which further highlights the problem of population decline in Jilin Province; thus, it urgently requires the joint efforts of the government and all sectors of society in order to ensure the reasonable movement of the population. The Inner Mongolia Autonomous Region showed net migration amounting to 64,000 people, exhibiting a net inflow pattern, in contrast to the other two regions. This shows that the Inner Mongolia Autonomous Region has a certain degree of attractiveness in terms of population relocation. However, there is also a need to carefully assess the sustainability of this net inflow and to explore whether it can exert positive impacts on the economic and social development of the Inner Mongolia Autonomous Region (
Figure 5).
3.2. Data Sources
The data examined in this study mainly consist of statistical data and they cover two categories: economic and social indicators and population data.
(1) The data on economic and social indicators are mainly derived from official data released by the National Bureau of Statistics and various statistical yearbooks, including the Heilongjiang Statistical Yearbook (2000–2022), the Jilin Statistical Yearbook (2000–2022) and the Inner Mongolia Statistical Yearbook (2000–2022). In addition, the tertiary indicators in the Comprehensive Indicator System for High-Quality Economic Development, such as the total amount of imports and exports, the amount of foreign direct investment, and the total number of books in public libraries (in thousands of books), are derived from the Cathay Pacific CASMAR database.
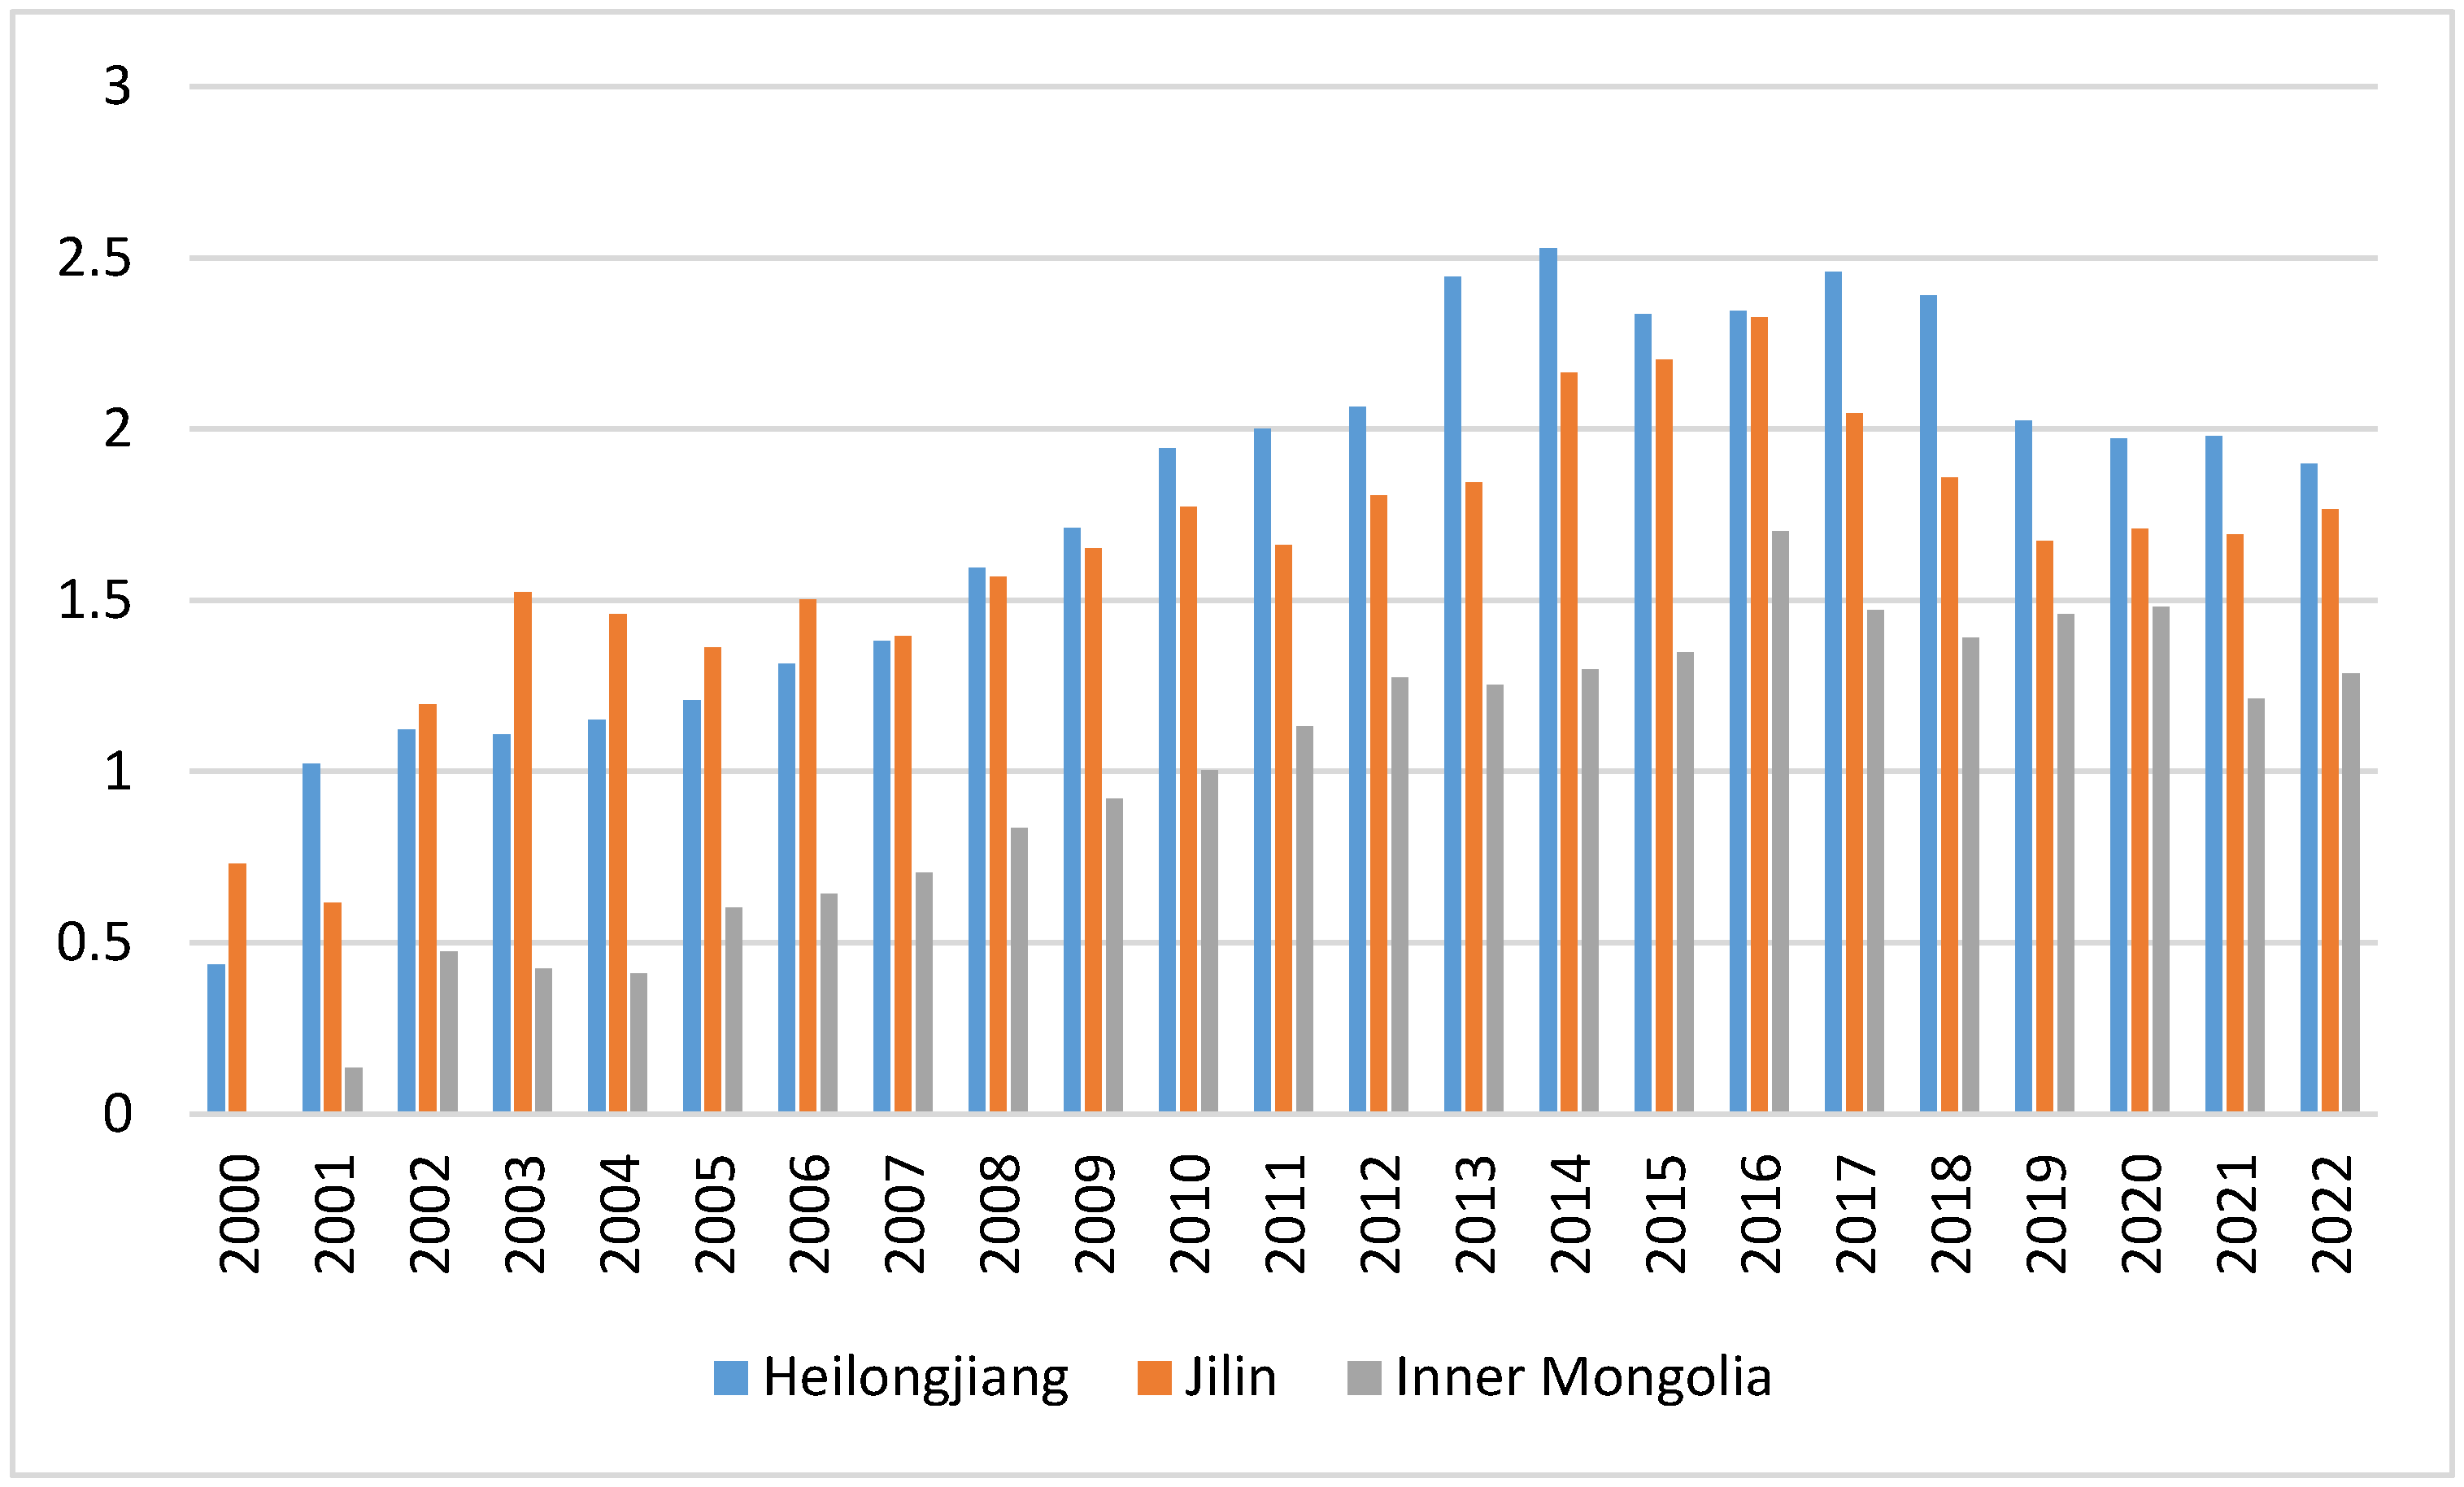
(2) The sources of the population data include the statistical yearbooks of each province and the results of China’s seventh population census. Among them, the data on the population mobility status are derived from specific calculations. In order to ensure the availability and scientificity of the data, the research methods of Liu Rumei (2021) [
61] are applied. The formula for the calculation of the population mobility rate is as follows: the population mobility rate = (the number of population movements ÷ the average size of the population in 2020) × 1000‰. Among these terms, the number of population movements in 2020 is calculated as (number of permanent residents at the end of 2020 − number of permanent residents at the end of 2019) − number of permanent residents at the end of 2019 × natural population growth rate in 2020. Meanwhile, the average size of the population in 2020 is calculated as the average number of permanent residents at the end of 2019 and the end of 2020.
In the process of data collection, if some indicators are missing in the statistical yearbook or bulletins and other information, they are supplemented by using methods such as the mean value method or linear interpolation method, based on the number of missing values and the distribution pattern. If there are too many missing values or it is difficult to supplement them, the sample is excluded.
(3) The digital elevation model data (DEM) are derived from the National Aeronautics and Space Administration (NASA) GTOPO30 production. Using ArcGIS 10.7, all spatial geographic data are transformed into the uniform projection coordinate system of Krasovsky_1940_Albers and resampled at a spatial resolution of 1000 m.
3.3. Variable Selection and Model Construction
(1) Variable selection
In the relationship between the impact of population outflow on economic development, population outflow is the core explanatory variable, economic growth and the high-quality development of the economy are the explanatory variables and capital accumulation (K) and labor resources (L) are the control variables (see
Table 1).
(2) Model construction
Regarding the real situation, it can be seen that Heilongjiang Province experiences the largest population outflow, followed by Jilin and Inner Mongolia. From an economic point of view, the outflowing labor force pursues the maximization of its interests, so as to improve the well-being of individuals and families. However, the economic growth of key state-owned forest areas is significantly lower than that of the eastern and coastal areas. Previous studies have shown that the negative impact of population outflow on local economic growth may be greater in areas that exhibit lagging economic development. Thus, an analysis is conducted in order to explore the impact of population outflow on regional economic growth in key state-owned forest areas. The following model is used to assess this impact:
where:
represents the gross domestic product of region i at time t.
represents the total investment in fixed assets in region i at time t.
represents the number of employed people at the end of the year in region i at time t.
represents the population outflow from region i at time t, measured as the number of individuals or the rate of outflow.
is the error term, capturing unobserved factors that may affect GDP.
The variables , , and are expected to have various distributions depending on the economic and demographic characteristics of the regions. Typically, and might follow non-negative distributions, while could be either positive (indicating outflow) or negative (indicating inflow) or zero. The error term is often assumed to follow a normal distribution with mean zero and constant variance (homoscedasticity).
When exploring the multi-dimensional drivers of high-quality economic development, the impact of population outflow, as a key variable, cannot be ignored. Specifically, the outflow of the population has a significant impact on the realization of high-quality economic development in terms of optimizing resource allocation, promoting technological innovation and diffusion and accelerating the diversification of the market demand. This process not only enhances the flexibility of the labor market and promotes the upgrading and transformation of the industrial structure, but also stimulates economic growth through the exchange and integration of knowledge and skills. Thus, it is necessary to explore the impact of population outflow from key state-owned forest areas in China on the high-quality development of the economy. The following model is used to assess this impact:
where:
represents the index of high-quality economic development for region i at time t.
The interpretation and distribution characteristics of , , and remain the same as in the previous model.
3.4. Research Methods
3.4.1. Construction of an Evaluation System for Indicators of the Level of High-Quality Economic Development
In the process of constructing the assessment system, the performance of the region in the five key areas of innovation, coordination, greenness, openness and sharing was taken into account, aiming at a comprehensive assessment of the level of high-quality economic development. We mainly refer to the comprehensive indicator system framework proposed by scholars such as Sun Hao, Yang Ling, and He Xionglang. When selecting the basic indicators, considering their independence, representativeness and data accessibility, in terms of form, the proportion indicator, structural indicator, intensity indicator and average indicator are generally used, and most of the total indicators are not used to minimize the error caused by the difference in the number of units and the scope; in terms of attributes, the basic indicators need to directly indicate the relationship with the level of high-quality development, and the positive and negative indicators are generally used, not the moderate indicators, the positive and negative indicators and the moderate indicators are not used. In terms of attributes, basic indicators should directly indicate the relationship with the level of high-quality development and generally use positive and negative indicators, not moderate indicators. Positive (negative) indicators indicate that the indicator has a positive (negative) effect on high-quality development, and the larger the value of the indicator, the higher (lower) the level of high-quality development. In addition, in the process of constructing basic indicators, the core indicators of each system should be selected in accordance with its objectives. Specific indicators are shown in
Table 2.
3.4.2. Principal Component Analysis (PCA)
The evaluation of the comprehensive level of high-quality economic development mostly uses measures such as the entropy weight method [
62], entropy weight TOPSIS (Technique for Order Preference by Similarity to Ideal Solution) [
63] and the principal component analysis method [
64]. The entropy TOPSIS method and the composite index method cannot avoid the high correlation between the basic indicators, nor can they reflect the relationship between the related indicators well, which may lead to the structural problem of weighting and fail to comprehensively and objectively reflect the level of high-quality development of each province. The method of Principal Component Analysis (PCA) utilizes the method of dimensionality reduction, retains the information contained in the original data to the greatest extent possible, and simplifies multiple indicators with correlation, which well avoids the problem of high correlation between the basic indicators, and embodies the synthesis technology of the indicators; in terms of determining the structure of the weights, the method of PCA determines the weights according to the characteristics of the data itself and is not a human subjective judgment, which better guarantees the objectivity of the determination of the weights. It guarantees the objectivity of weight determination and the weight structure formed by this method can fully reflect the degree of contribution of each index to the comprehensive index in the evaluation system [
65]. Based on this, this paper adopts the principal component analysis method to determine the weight structure of each basic indicator to synthesize the target and further adopts the same method to synthesize the composite indicator to evaluate the level of high-quality development of the economy of China’s three provinces and regions, namely, Heilongjiang, Jilin and Inner Mongolia, during the period from 2000 to 2022.
PCA is an objective weighting method that transforms multiple variables into one or a few uncorrelated variables through dimensionality reduction [
66], and it is suitable for complex evaluation systems with a large number of indicators [
67]. Assuming that there is a region with b years totaling a× b samples, taking the value of
m, there is an
n indicator, generating the initial sample matrix
X as follows:
(1) The data are standardized to avoid bias in the results due to differences in the orders of magnitude and units; this is achieved with the following formula:
(2) The data are normalized to obtain the standard sample matrix. Then, its corresponding correlation coefficient matrix R and its eigenvalues with regularized eigenvectors
are calculated; from this, the principal components
are obtained as follows:
(3) According to the principle in which the cumulative percentage must be greater than 80% and the eigenvalue must be greater than 1, the first q principal components
,
, …,
are determined and used to reflect the indicator information. These first q principal components are weighted and summed, and the weight coefficient is the initial eigenvalue variance percentage of the corresponding principal components. The result is calculated as the comprehensive score
F for the research object, using the following formula:
where
denotes the standardized value of the indicator data,
denotes the actual value of the indicator data,
denotes the mean value of the jth indicator data,
denotes the standard deviation of the jth indicator data, and
denotes the eigenvector corresponding to the eigenvalue.
The specific steps of principal component analysis are as follows. First, it is necessary to standardize the data. The second step is to judge whether the indicators and data are suitable for factor analysis. The KMO (Kaiser-Meyer-Olkin) value is 0.755; as this is greater than 0.6, it is suitable. In the third step, the eigenvalue must be greater than 1. There are four that meet this requirement, but the cumulative contribution rate is not satisfactory. In the fourth step, variables 4 and 7, i.e., technology transaction activity and the energy consumption elasticity coefficient, have uniqueness values greater than 0.6. This indicates that they are abnormal and need to be eliminated. Then, the second step is repeated and the uniqueness value is less than 0.6, which is normal. The fifth step involves predicting the principal components. The STATA software (Stata 17.0) is used to automatically remove the principal components with eigenvalues of less than 1, and it predicts F1, F2, F3, and F4. The sixth step involves calculating the comprehensive index, i.e., the level of high-quality economic development.
Measuring the level of high-quality economic development from 2000 to 2022, it is found that Heilongjiang Province achieved the highest value, followed by Jilin Province and finally Inner Mongolia. In terms of time, the high-quality economic development levels of China’s key state-owned forest areas gradually increased from 2000 to 2014, while it slowly decreased from 2014 to 2022. Among these areas, the rapid resource consumption, low environmental awareness and imbalanced industrial structure in Inner Mongolia led to its considerably low level of high-quality economic development (
Figure 6).
3.4.3. Fixed-Effects Model
When exploring the effects of outflow on the economic evolution of outlying regions, previous studies have generally favored non-quantitative, descriptive analyses due to the limited availability of data. In this study, we focus on a specific region—the provinces where China’s key state-owned forest areas are located—and aim to assess the specific impacts of the outflow on its economic growth. We use the balanced panel data model as the core analytical tool in order to achieve the precise quantification of the impact mechanism.
The general mathematical expression of the balanced panel data model is
where:
represents the dependent variable (e.g., GDP or EHQI).
are the fixed effects, capturing unobserved, time-invariant characteristics of region i.
represents the vector of explanatory variables (including K, L, and FLO).
are the coefficients to be estimated.
is the error term.
In preprocessing the indicators, natural logarithmic transformation is often used to smooth the data. The direct application of logarithmic transformation is not applicable in this study for the following reasons. One is the presence of negative numbers and zeros in the data variables, since the domain of definition of the logarithmic function is positive real numbers and negative numbers do not have logarithms. Conventional methods of dealing with negative data (e.g., uniformly adding a certain value and then transforming it to a positive number before logarithmic transformation) may introduce bias and lead to a distorted interpretation of the data [
68]. Second, population inflow is positive and population outflow is negative and both positive and negative numbers exist in the data. If there are both positive and negative numbers in a set of data, logarithmic processing cannot be carried out directly. Adjusting for negative numbers alone will change the data’s original internal logical relationships and economic significance and other important attributes. Third, after the PCA, whether to carry out logarithmic transformation needs to be considered comprehensively. It is also reasonable to do regression directly with principal component scores (new variables after principal component analysis). Principal component analysis itself is a dimensionality reduction technique that transforms the original variables into a set of uncorrelated principal components. It is reasonable to apply directly to the model for sets containing positive and negative data. Therefore, to ensure the accuracy and reliability of the results, this study follows the principle of rigor and directly uses the original values for analysis.
3.5. Descriptive Statistics
The data examined in this study are the balanced panel data from 2000 to 2022. The descriptive statistics in
Table 3 show that there are negative values in the number of outflows and the rate of outflows. This can be interpreted as indicating a net population outflow because the outflows are larger than the inflows, while the same positive values can be interpreted as indicating a net population inflow. This variable is the central variable in the existing literature on population mobility.
In order to comprehensively analyze the multifaceted impacts of population exodus on economic development, two core dimensions are examined: one is the traditional economic growth dimension, i.e., exploring the specific effects of the exodus on economic growth and the other is the high-quality development of the economy, analyzing in detail whether or not the exodus has had an impact on the high-quality development of the economy.
4. Results
Regarding the impact of the population exodus on high-quality economic development, we adopt a dual analytical perspective, focusing on the provinces where the key state-owned forest areas are located. In this way, we comprehensively explore the multi-dimensional impact of the population exodus on the economy. Specifically, the analytical framework is broken down into two major dimensions. On the one hand, it focuses on economic growth from the traditional economic perspective and an in-depth analysis is conducted on the role of population outflow in the existing economic growth. On the other hand, it shifts to the dimension of high-quality economic development to explore the role of the population outflow in the process of high-quality economic development; we also use quantitative means to reveal the intrinsic linkages and impact mechanisms.
4.1. Impact of Population Exodus on Economic Growth
In
Table 4, columns (1) and (3) present the results of the ordinary least squares estimation of the impact of the “number of outflows” and the “rate of outflows” on economic growth. The results show that the estimated coefficient of the number of outflows on economic growth is negative, i.e., they are negatively correlated and insignificant and the coefficient of the outflow rate on economic growth is positive and insignificant; therefore, it is not statistically significant.
Meanwhile, columns (2) and (4) in
Table 4 show the results of the fixed-effects model estimation of the impact of the “number of outflows” and the “outflow rate” on economic growth. The results show that the estimated coefficients of the number of outflows and the rate of outflows on economic growth are positive, i.e., they are positively correlated and insignificant; therefore, they are not statistically significant.
4.2. Impact of Population Exodus on High-Quality Economic Development
In
Table 5, columns (5) and (7) show the results of the ordinary least squares estimation of the impact of the number of population outflows and the rate of population outflows on the high-quality development of the economy. The results show that the estimated coefficient of the number of outflows on economic growth is −0.0060, with a significance level of less than 0.05, while the estimated coefficient of the rate of outflows on economic growth is −18.7661, with a significance level of less than 0.05. In other words, an increase of 5 percent in the net inflow of people reduces the economic and social quality of the economy by 18.77 percent.
Meanwhile, columns (6) and (8) in
Table 5 show the results of the fixed-effects model estimation of the impact of the number of population outflows and the rate of population outflows on the high-quality development of the economy. The results show that the estimated coefficients of the number of population outflows and the rate of population outflows on economic growth are negative. The estimated coefficient of the number of outflows on economic growth is −0.0069 and the significance level is less than 0.01, while the estimated coefficient of the outflow rate on economic growth is −20.7041 and the significance level is less than 0.01. In other words, for every 1 percent increase in the net inflow of the population, the high-quality development of the economy and society decreases by 20.70 percent.
Table 5 provides detailed insights into the far-reaching impacts of the number of outflows and mobility rates on several aspects of high-quality economic development. It is clear from this table that there is a significant negative correlation between the phenomenon of population outflow and high-quality economic development. This result implies that, to some extent, population outflow constitutes a constraint on high-quality economic development. Meanwhile, the regression analysis considers the total investment in social fixed assets, which is a core indicator of capital accumulation, and the size of the employed population at the end of the year, which is a key variable representing the status of labor resources. The results show a significant positive effect, which verifies that the effective accumulation of capital and the sufficient supply of labor contribute to the development of a high-quality economy.
5. Discussion
An in-depth assessment of the state of high-quality economic development in Heilongjiang Province, Jilin Province and the Inner Mongolia Autonomous Region was conducted using a comprehensive evaluation system. Data from 2000 to 2022 reveal that Heilongjiang Province has performed particularly well in promoting high-quality economic development, followed by Jilin Province, while Inner Mongolia exhibits the least progress. The analysis further revealed that, from 2000 to 2014, the level of high-quality economic development in these key state-owned forest areas showed a steady rise. However, the pace of this growth slowed down significantly between 2014 and 2022.
Next, an in-depth discussion is presented regarding the economic impact of population outflow from forest areas. Specifically, Heilongjiang Province experienced a net population inflow in 2000 and 2010 only, with a net outflow in the remaining years. Meanwhile, the population migration trend in Jilin Province and the Inner Mongolia Autonomous Region shifted to a net outflow after 2010 and from 2011 onwards, respectively. This lasted from 2021 to 2022 when a positive trend regarding the net inflow of the population was again observed. This reversal suggests that it is necessary to deepen the relevant research and formulate more targeted regional development strategies. This is essential to determine whether the population outflow poses an obstacle to the realization of comprehensive and high-quality development in these key state-owned forest areas. Based on this, we constructed several regression models for in-depth analysis and systematically explored the potential impact of population outflow on economic growth and high-quality development in the studied areas.
- (1)
Impact of population outflow on economic growth
After an exhaustive analysis of the regression results, we reach the following conclusion: in key state-owned forest areas, neither the number of population outflows nor the mobility rate has a significant direct impact on economic development. This finding suggests that, in the macroeconomic structure of key state-owned forest areas, population outflow is not the dominant force driving regional economic growth. Furthermore, as an important indicator of capital accumulation, the regression coefficient of total investment in social fixed assets is significant and positive, clearly indicating the positive role and centrality of capital accumulation in driving economic growth. Meanwhile, the regression result regarding the size of the employed population at the end of the year, as a core variable reflecting labor resources, is also significant and positive. This not only verifies the significant contribution of labor resources to economic growth but also further highlights its fundamental role in the process of achieving economic prosperity. Therefore, in the key state-owned forest areas, the effective accumulation of capital and the rational allocation of labor resources are the key factors driving economic growth. It is worth noting that, although the population remains an important consideration for economic growth, its significance is gradually diminishing. Statistical data show that there is a positive correlation between population growth and economic growth (with a positive coefficient), but the significance level of this relationship is low; this implies that solely increasing the population size tends to have a limited driving effect on economic growth. In the macroeconomic context of key state-owned forest areas, the number of population outflows and their mobility rates do not have a significant direct impact on economic development; this further confirms that, although the size of the population is an important factor in economic growth, it is not the main driving force in these specific regions.
- (2)
Impact of population outflow on high-quality economic development
When exploring the topic of high-quality economic development, the impact of population outflow presents a more complex situation. We performed an in-depth analysis of the multi-dimensional impact of the number of population outflows and the mobility rate on high-quality economic development. It shows that there is a significant and negative correlation between population outflow and high-quality economic development. Specifically, when the number of population outflows increases, the indicators of high-quality economic development instead show a downward trend (a negative coefficient and high significance level). This finding suggests that an increase in population outflows does not have the expected positive impact on high-quality economic development, but rather creates a constraint. At the stage of pursuing high-quality economic development, relying solely on an increase in the population size is no longer an effective strategy. At the same time, the regression results regarding the total investment in social fixed assets and the size of the employed population at the end of the year are significant and positive. This again proves that the effective accumulation of capital and an abundant labor force positively promote the high-quality development of the economy. Further analysis reveals that an increase in population outflow, regardless of its direction, exerts a certain negative impact on the high-quality development of the economy, implying that the over-expansion of the scale of population outflows may impose constraints on both the quality and quantity of economic development. This finding emphasizes that both over-concentration and mass exodus may adversely affect the economic stability and high-quality development of a given region, thus highlighting the complexity and importance of population flow management.
The challenges posed by the current population exodus can no longer be addressed through economic growth alone and a new path must be taken in pursuit of high-quality economic development. Setting high standards and strict requirements is an effective means to narrow the economic gap with developed regions and avoid the aggravation of the “Matthew effect”, i.e., to avoid the further marginalization of resources due to the economic lag, thus forming a vicious cycle of poverty and backward development. Therefore, in the provinces in which China’s key state-owned forest areas are located, improving the quality of the economy is the key to addressing the dual issue of poverty and backward development. Moreover, against the macro background of economic transformation, the role of demographic factors in economic growth was analyzed in depth. This shows that forest areas need to transition from the traditional model of crude growth and manpower-related tactics to a development model that emphasizes improving the quality of the population. With the development of the economy, the role of human capital in promoting sustainable economic development has become increasingly prominent [
71]. Some scholars have revealed that household registration policies negatively regulate the impact of cross-regional human capital allocation on sustained regional economic development [
72]. However, an in-depth exploration of the economic impacts of the exodus of the population from forest areas is still lacking. The present study fills this research gap. We also point out that the transition of the forest region’s economy to high-quality development not only contributes to economic growth but is also the key to realizing a fundamental shift in the economic model. In the process of economic transformation, improving the quality of the population becomes a crucial topic. For forest areas, it is particularly important to obtain high-value human capital, i.e., a high-quality population. The high quality of the population is reflected in improvements in the education level, enhancements in the capacity for innovation and the enrichment of professional skills, which contribute to the high-quality development of the economy. Therefore, it is recommended that the government and society should increase their investment in population quality improvement, covering education, training and talent acquisition. In response to the constraints posed by the population size on high-quality economic development, the government should make timely adjustments to its population policy, shifting from a focus on quantitative growth to a focus on quality enhancement. This should include measures to optimize the composition of the population, improve its quality, guide the flow of people in a reasonable manner and optimize the allocation of human resources.
Although this study has achieved innovative results in exploring the impact of population outflow in the process of high-quality economic development in the provinces where China’s key state-owned forest areas are located (Heilongjiang, Jilin and Inner Mongolia Autonomous Regions), it still has some limitations. First, the data in this study are mainly derived from official statistics and although these data have a high degree of authority and reliability, due to the limitations of the statistical caliber and data collection methods, they may not be able to comprehensively capture all the details of the outflow of population and its impact on the economy. For example, data on informal migration and non-household migration populations may not be fully included in the analysis, which to some extent affects the comprehensiveness of the results. Second, this study mainly focuses on the impact of population outflow on the economy and fails to explore in-depth other factors that may affect the high-quality development of the economy, such as policy changes, technological progress and resource allocation. Future research could further expand data sources to include more data on the informal migration of the population and comprehensively examine the impact of multiple factors on high-quality economic development in forested areas, in order to provide a more comprehensive and in-depth analysis and more accurate policy recommendations.
6. Conclusions
Based on an in-depth analysis of the current special stage of economic development in forest areas, this paper points out that focusing solely on economic growth is no longer sufficient to cope with the current multiple challenges and that it is necessary to shift to the pursuit of a high-quality economic development path. Through an empirical study of Heilongjiang Province, Jilin Province and Inner Mongolia Autonomous Region (the provinces where China’s key state-owned forest areas are located), this paper constructs a set of high-quality economic development indicator system based on the core concept of green development and comprehensively evaluates the status of high-quality economic development from 2000 to 2022. The results of the study show that there are significant differences in the impact of population exodus from forest areas on economic growth and economic high-quality development. Specifically, in terms of economic growth, the direct impact of the number of population outflows and mobility rate on the economic development of forest areas is not significant. This suggests that population outflow is not the dominant force driving economic growth in the macroeconomic structure of key state-owned forest areas. On the contrary, the effective allocation of capital accumulation (as indexed by the total investment in social fixed assets) and labor resources (as indexed by the size of the employed population at the end of the year) are the key factors driving economic growth. This finding underscores the importance of capital and labor in the economic development of forest areas and suggests that policymakers should focus on optimizing capital investment and labor resource allocation. However, in terms of high-quality economic development, there is a significant negative correlation between population outflow and high-quality economic development. As the number of population outflows increases, the indicator of high-quality economic development shows a decreasing trend. This result suggests that population outflow has a significant constraining effect on economic high-quality development in forest areas and that excessive population outflow may have a negative impact on the quality and quantity of the economy. This finding highlights the complexity and importance of population flow management, suggesting that in the pursuit of high-quality economic development in forest areas, population flow needs to be rationally guided to avoid the negative impact of excessive population outflow on the economy.
The innovations of this study are: first, it constructs an indicator system for high-quality economic development based on the core concept of green development, which provides a scientific basis for evaluating the high-quality economic development of forest areas; second, it focuses on the phenomenon of population exodus in forest areas and analyzes in depth the specific impacts of population exodus on the economy from the dual perspectives of economic growth and high-quality economic development, which fills in the gaps in this research field. In addition, this study puts forward targeted suggestions and countermeasures, which are of great significance in enriching the knowledge of re-regional development in forest areas, promoting the harmonious and sustainable development of forest areas and helping the implementation of the rural revitalization strategy. In summary, this study shows that the transition of the forest area economy to high-quality development is not only a necessary choice to cope with the current multiple challenges but also the key to realizing the fundamental transformation of the economic model. In the transition process, attention should be paid to improving the quality of the population, optimizing the population structure and reasonably guiding the population flow in order to achieve high-quality economic development. At the same time, the government should formulate a development strategy with high standards and strict requirements to gradually narrow the economic gap with less developed regions, avoid the aggravation of the “Matthew effect”, and lay a solid foundation for the sustainable development of the forest economy.


