Abstract
Urban parks are fundamental to building sustainable and inclusive cities, yet the mechanisms linking their spatial configuration to human activities and social functions remain insufficiently understood. A scalable multimodal framework is developed to quantify how spatial visibility is associated with patterns of park use and the provision of social ecosystem services. A total of 94,635 geo-tagged user-generated images from 148 parks in Vancouver, Canada, were analyzed using the Contrastive Language-Image Pretraining (CLIP) model to classify user activities into six behavioral categories. Concurrently, airborne LiDAR data and space syntax analysis were used to derive three visibility metrics—Mean Isovist Area (MIA), reflecting internal openness; Mean Visual Integration (MVI), indicating visual connectivity within the park interior; and External Isovist Ratio (EIR), representing edge openness and boundary visibility. The results indicate that EIR exhibits the strongest and most consistent relationships with user activity patterns, positively associated with family recreation, social vibrancy, and physical activity, while negatively linked to nature immersion and quiet relaxation. MIA shows moderate associations with socially interactive and child-oriented activities, whereas MVI contributes little explanatory power compared to localized visibility conditions. These findings highlight spatial visibility as a critical design attribute that is closely associated with human–forest interactions. By illustrating that moderate visual openness and edge permeability are associated with more inclusive and multifunctional patterns of park use, actionable insights are provided for urban park planning and design, and the promotion of social sustainability.
1. Introduction
Urban parks, as a vital component of urban green infrastructure, are increasingly recognized, not only for their ecological functions but also for their essential roles in supporting human health and well-being [1,2]. They provide multifunctional landscapes that are associated with higher levels of recreational activities, social interaction, and a sense of community [3], thereby helping strengthen public health and social connectedness [4,5]. These benefits are closely linked to the spatial design of urban parks, especially the arrangement of vegetation [6,7]. The placement of trees is related to differences in ecological functions and also to variations in sightlines and activity zones, which are in turn associated with how people use urban parks [8,9]. For example, denser clusters of trees may promote solitude and a feeling of natural immersion, while open spaces in parks facilitate active recreation and social gatherings [10,11].
Existing research shows that vegetation layout is connected with differences in the visual quality of urban park spaces [8,12,13]. However, few studies have measured how visibility patterns in urban parks, created by trees, are related to user activity. Traditional studies of park usage have relied on on-site observations and surveys [14,15,16]. Although these methods provide valuable insights, they are limited in scale and quantitative precision. The rise of geospatial technologies and volunteered geographic information has enabled large-scale analysis of human–environment interactions [17,18]. GPS data, mobile tracking, and social media content have increasingly been used to infer patterns of park visitation and preferences [19,20]. User-Generated Images (UGI) from platforms like Google Maps offer rich, place-based visual data on how urban parks are used [21]. Deep learning models have enabled the semantic classification of such images, translating unstructured user-generated photos into analyzable indicators of park use and spatial perception. For example, OpenAI’s CLIP model learns from a shared embedding space of images and text by training on millions of images–caption pairs and allows zero-shot image classification from natural language prompts, enabling the identification of activity scenes such as “people playing sports” [22].
In parallel, space syntax theory provides a comprehensive framework for quantifying spatial configurations [23,24]. It conceptualizes how a built layout relates to social behavior by facilitating or constraining user movement and interaction [24]. Methods such as Visibility Graph Analysis (VGA) and Isovist Analysis calculate the visibility of the environment from each point in space [25,26]. A local isovist measures the visible area from a single vantage point, whereas a VGA-based global analysis links multiple observation points into a network to derive metrics of overall spatial openness and connectivity [25]. The most common global metric is Visual Integration, which indicates how visually “central” a location is to the entire space [24,25]. Prior studies have discovered that integrated or visible areas are associated with more people and activity in buildings and plazas [27], highlighting that open sightlines and connectivity are key to supporting engagement. However, these analyses have rarely addressed urban parks, where dense vegetation and irregular boundaries complicate the interpretation of visibility. Furthermore, while space syntax has been applied to landscape design to optimize planting layouts [8], few existing studies have combined space-syntax visibility metrics with image-based activity to link the form and function of urban parks.
Despite increasing interest in the spatial–behavioral dynamics of UGS, several critical research gaps remain: First, while vegetation structure has been linked to the movement and perception of park users [8,9], few studies have systematically examined how visibility metrics relate to different types of user activity within urban parks [11,22]. Second, although UGIs offer a unique perspective on real-world user experiences [21,28], their semantic content remains underused in landscape behavioral research. The potential of CLIP-powered classification for large-scale behavioral analysis in UGS has not been fully utilized [22]. Third, the integration of spatial visibility modeling, such as Mean Isovist Area (MIA), Mean Visual Integration (MVI), and External Isovist Ratio (EIR), with image-derived user activity has not been explored [6,10,20]. Thus, it is difficult to assess how spatial design is linked to user engagement in urban parks. To fill these gaps, a new multimodal framework that combines LiDAR-informed space syntax metrics with CLIP-based image classification is deployed. Using 148 urban parks in Vancouver, Canada, the association between spatial visibility and user activity is examined. The study is guided by the following question: To what extent do LiDAR-derived visibility metrics (MIA, MVI, and EIR) correlate with user activity identified from large-scale user-generated images across Vancouver parks?
By addressing these questions, this research advances the understanding of visibility and behavior in urban green infrastructure and provides practical guidance for urban park managers, planners, and policymakers aiming to design inclusive, perceptually engaging, and multifunctional tree-filled spaces that enhance social well-being.
2. Methodology
2.1. Study Areas
The City of Vancouver, situated on Canada’s West Coast (49°13′ N to 49°32′ N latitude, and 122°57′ W to 123°31′ W longitude), spans about 115 km2 and had a population of 662,248 as of the 2021 Census [29]. It is known for its dedication to green infrastructure, resulting in a network of 251 urban parks managed by the City of Vancouver.
2.2. User-Generated Imagery Collection and Processing
For the user-generated imagery (UGI) dataset, publicly available photographs uploaded by users to Google Maps (https://www.google.com/maps/ (accessed on 22 February 2025)) of urban parks in Vancouver were collected using a customized web-scraping script. The retrieval included the entire archive of images available before 22 February 2025, resulting in an initial dataset of 97,629 photographs showing diverse park scenes. A preliminary filtering process was carried out by applying urban park selection criteria to exclude [30]: (1) Parks with an area smaller than 0.25 hectares, as such small parcels generally lack internal spatial differentiation and do not show significant variability in visibility or configuration metrics due to edge effects dominating the space. (2) Parks with fewer than 100 UGIs, to ensure enough data for reliable behavioral analysis. (3) Stanley Park was excluded because of its exceptional size, extensive forest coverage, and multifunctional character, which make it a statistical and spatial outlier. After screening, 148 parks and 94,635 images remained for analysis.
2.3. Research Framework
An integrated, multi-modal framework was used to explore the relationship between spatial visibility and user activity in Vancouver’s urban parks (Figure 1). Here is a summary of the several key stages:
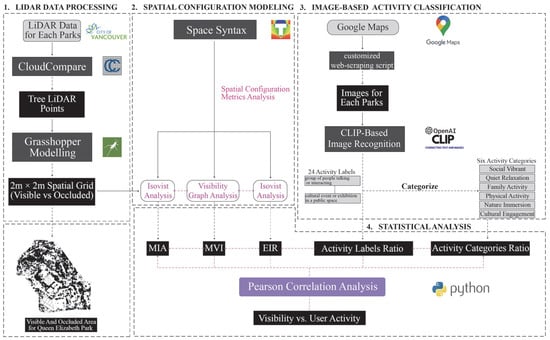
Figure 1.
Research Workflow.
- 1.
- LiDAR data processing: High-resolution airborne LiDAR data were processed to retain tree canopy points and geo-aligned with urban park boundaries for visibility analysis [31].
- 2.
- Spatial configuration modeling: The filtered LiDAR point cloud was used to generate three key visibility metrics—Mean Isovist Area (MIA), representing the average visible area from internal viewpoints and thus internal openness; Mean Visual Integration (MVI), capturing global visual connectivity within the park; and External Isovist Ratio (EIR), expressing the proportion of park area visible from its perimeter and therefore edge transparency [25].
- 3.
- Image-based user activity classification: 94,635 geotagged user-uploaded photographs were collected from Google Maps associated with the 148 urban parks. These images represent the complete set of publicly accessible geotagged photographs available on the platform at the time of data collection, and no sampling or down-selection was performed. Using the CLIP model, these images were semantically classified based on natural language prompts to infer the predominant user activity of the studied urban parks [22].
- 4.
- Statistical correlation analysis: Pearson correlation analyses were conducted to test the relationships between the visibility metrics and the proportions of image-derived user activity [32].
2.4. Spatial Data Processing and Configuration Metrics Analysis
2.4.1. LiDAR Data Collection and Processing
In December 2024, high-resolution LiDAR point cloud data were obtained from the City of Vancouver’s open data portal to quantify the spatial configuration of urban parks. The most recent published LiDAR dataset (2022) is characterized by a mean density of approximately 49 points per square meter, a sidelap of at least 60% in both North–South and East–West directions, and a vertical accuracy of 0.081 m (95% confidence), based on aerial surveys conducted on 7 and 9 September 2022 [33]. These parameters provide dense and precise coverage that is suitable for fine-grained urban park visibility modeling. For the purposes of this study, pedestrian-scale visibility is the main focus, and the relevant obstacles are vegetation elements that extend above approximately eye level and obstruct the line of sight.
The raw LiDAR point clouds were initially pre-processed in CloudCompare (v2.13). Since the Vancouver 2022 LiDAR dataset was pre-classified by land cover, high-vegetation points (ASPRS class code 5, indicating vegetation taller than 2 m) were directly extracted using the Filter by Value function based on the Classification scalar field. Using a 2 m height threshold aligns with previous LiDAR-based visibility studies at the pedestrian scale and reflects the notion that vegetation above roughly eye level acts as an opaque screen for most park users. The resulting high-vegetation point clouds were then exported as ASCII files for later visibility modeling. Each urban park was divided into 2 m × 2 m grid cells, with each cell labeled as either tree canopy or open space based on the presence of high-vegetation LiDAR points, creating a binary canopy map. The 2 m grid spacing provides sufficient geometric detail to resolve paths, lawns, and tree rows while remaining computationally tractable for citywide analysis; it falls within the 1–3 m range commonly adopted in pedestrian-scale visibility modeling [23,25,26]. For later visibility modeling, the tree canopy areas were treated as opaque features that block line of sight, ensuring that isovist computations would realistically account for vegetation occlusion (Figure 2).
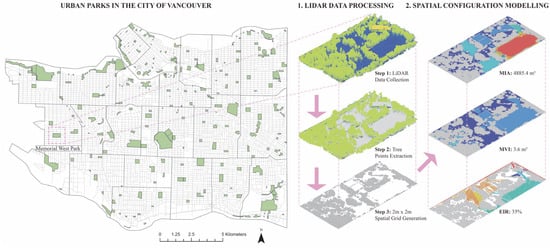
Figure 2.
Overall Study Area & Exemplar Spatial Configuration Modeling Process.
2.4.2. Three Spatial Configuration Metrics
Mean Isovist Area (MIA) represents the average visible area from a specific observation point within an urban park, measured in square meters (m2) [23,25,26]. It measures how much open view is available from different locations: larger isovist areas are typically connected with broader visual fields and a greater feeling of spatial openness, while smaller values are frequently associated with more limited visibility and a higher sense of enclosure [26]. To determine MIA, vector-based plan layouts of each park were imported into Depthmap (v10) and scaled for measurement accuracy. A consistent grid of observation points, spaced 2 m apart, was created across each park, with each point serving as a viewpoint for isovist analysis. A 360-degree isovist was generated at each point, and its area, automatically calculated in Depthmap (v10), represented the local visibility. The polygon’s area, also automatically calculated, reflected the visibility at that specific node. After calculating isovist areas for all grid points in a park, these values were averaged to obtain the park’s overall MIA.
Mean Visual Integration (MVI) assesses visual accessibility in urban parks by applying key ideas from space syntax theory [23,24,25]. MVI measures how visually connected each point is within the park’s overall visibility network, which is defined by the average number of visual “steps” (changes in viewing position) needed to reach all other locations in the space [24]. Higher integration values indicate greater visual coherence, meaning the point is easily seen from many places and can view many places itself. Lower values suggest a location is visually isolated or segregated. MVI was calculated using Depthmap (v10) through a Visibility Graph Analysis (VGA). The layout of each park was imported into the software and overlaid with a 2 m grid of visibility nodes, matching the MIA resolution. The software then computed a visual integration value for each node based on visibility connections. These values were collected and averaged to determine a park-level MVI.
External Isovist Ratio (EIR) assesses the degree of visual permeability from the urban park’s outer edge into its interior [23]. EIR was developed as a boundary-focused visibility metric to quantify how visible or occluded an urban park is when viewed from its perimeter, essentially, the proportion of the park’s visible area from outside [23]. EIR reflects the potential for visual interaction between the urban park and its adjacent urban surroundings. Higher EIR values indicate stronger edge transparency and visual openness, while lower values suggest a visually isolated or enclosed urban park edge. The EIR analysis was done by placing observation points at regular intervals along each urban park’s boundary and computing inward isovists. Two boundary layers were created in Rhino to restrict outward sightlines and simulate external observation points. Points were sampled every 2 m along the inner perimeter and imported into Depthmap (v10) as external viewpoints. A 360-degree isovist polygon was generated at each perimeter point to constrain any line of sight that would exit the urban park at its boundary. The resulting polygon, therefore, represents the portion of the park’s interior visible from that specific edge point. Depthmap (v10) computed the area of each such constrained isovist. The visible areas were then summed from all perimeter viewpoints and divided by the total area of the urban park to reveal the External Isovist Ratio for that urban park.
2.5. CLIP Semantic Classification of Park Activities: Six Categories and 24 Prompts
2.5.1. CLIP Model and Recognition Process
OpenAI’s CLIP model (ViT-B/32) was deployed to analyze urban park images. CLIP is a vision-language model that embeds images and text into a shared space, allowing zero-shot image classification with natural-language prompts. Its flexible, prompt-driven method is ideal for complex, context-rich urban scenes. Cosine similarity between image and text embeddings is calculated by CLIP to evaluate their semantic match [22].
2.5.2. Prompt Design and Labeling Process for Park Activities
All selected images were coded using 24 activity prompts that were developed through an iterative prompt-engineering process and then grouped into six broader activity categories capturing the main dimensions of park use reported in the environmental-behavior and urban design literature [14,15,34]. A larger pool of candidate phrases was generated based on prior observational studies, field notes, and manual inspection of a pilot subset of images. To ensure that each prompt described a visually recognizable and concrete scene, the wording was refined to emphasize observable actions and configurations (e.g., “children running and playing” rather than a more abstract “active play”) and overly generic phrases were removed. These 24 finalized prompts were then clustered into conceptually coherent sets that are mutually exclusive at the category level but internally homogeneous in terms of use type. The resulting six categories were further refined through iterative discussion among three researchers to ensure interpretability and consistency at the park scale, so that semantically related prompts would be to the same park-level index and semantic overlap between categories was reduced.
Each park activity category was operationalized through four representative activities, which served as semantic prompts for image-text matching in CLIP. The six park activity categories and their related representative activity prompts are listed below (see Figure 3 for examples of each):
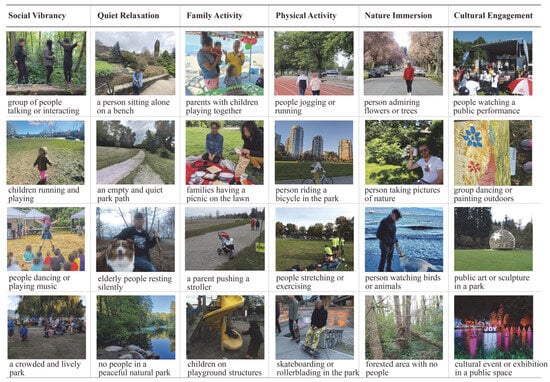
Figure 3.
Park Activities: Six Categories and 24 Prompts.
- Social Vibrancy: Reflects dynamic, interactive environments characterized by group activity, social gatherings, and playful energy. Prompts: “Group of people talking or interacting”, “Children running and playing”, “People dancing or playing music”, “A crowded and lively park”.
- Quiet Relaxation: Represents tranquil, low-activity settings where individuals are alone or quietly relaxing. Prompts: “A person sitting alone on a bench”, “An empty and quiet park path”, “Elderly people resting silently”, “No people in a peaceful natural park”.
- Family Activity: Denotes family-centered environments where child-focused activities are dominant. Prompts: “Parents with children playing together”, “Families having a picnic on the lawn”, “A parent pushing a stroller”, “Children on playground structures”.
- Physical Activity: Characterizes vigorous physical activity scenes involving individual or group exercise. Prompts: “People jogging or running”, “Person riding a bicycle in the park”, “People stretching or exercising”, “Skateboarding or rollerblading in the park”.
- Nature Immersion: Highlights scenes where interaction with or immersion in nature is the central theme. Prompts: “Person admiring flowers or trees”, “Person taking pictures of nature”, “Person watching birds or animals”, “Forested area with no people”.
- Cultural Engagement: Identifies parks as venues for cultural display, community art, or public performances. Prompts: “People watching a public performance”, “Group dancing or painting outdoors”, “Public art or sculpture in a park”, “Cultural event or exhibition in a public space”.
Each chosen image was paired with one park activity prompt by the CLIP model and then sorted into six activity categories. Specifically, natural language prompts were transformed into text embeddings, and cosine similarity scores between these and each image embedding were calculated. For each image, a single “winner-take-all” label was retained by assigning the image to the prompt with the highest similarity score (top-1 label). This single-label design was adopted to avoid inflation of counts for images containing multiple activities and ensure a consistent aggregation scheme when park-level proportions for the six activity categories were computed. To assess the robustness of the findings to classifier confidence, a high-confidence image subset based on CLIP similarity scores was constructed. For each image, the top-1 similarity across the 24 prompts and identified the 80th percentile threshold over all valid predictions was recorded. Images with top-1 similarity ≥ the 80th percentile threshold were retained, park-level proportions for the six activity categories were recalculated using this subset, and the main correlations between MIA, MVI, EIR and the six indices were re-estimated (Supplementary Table S1). Finally, to quantify classification performance, CLIP-predicted labels on a stratified random sample were validated. For each of the 24 labels, 20 to 30 images were randomly selected and manually assigned a single dominant activity label, after which label-wise precision, recall, and F1-score, as well as macro-averaged metrics and overall accuracy, were computed. In this stratified human-coding validation (n = 573 images), CLIP achieved an overall accuracy of 0.79 and a macro-averaged F1-score of 0.77 across the 24 activity prompts, indicating reasonably good agreement with human judgements (Supplementary Table S2). To give readers a qualitative sense of how CLIP performs on complex park scenes, representative successes and failures from the validation sample were inspected (Supplementary Table S3).
2.6. Statistical Analysis
After deriving spatial configuration metrics and classifying user-generated images for each park, statistical analyses were performed to explore the correlations between the parks’ spatial configuration and user activity. Pearson correlation analysis was chosen as the primary method because of its ability to measure the strength and direction of linear associations between continuous variables [32,35]. The analysis was conducted at the park level (n = 148), with each park representing a single dataset. Each image was assigned one of 24 activity labels based on the highest similarity score with its corresponding prompt. Images sharing the same activity label were aggregated within each park, and their counts were divided by the total number of park images to determine the relative proportion of that activity. This procedure provides more comprehensive insights into specific behavioral patterns observed within the park environments. Finally, the 24 activities were grouped into the six activity categories, and the proportions were summed to obtain the relative share of each activity category across the dataset. This aggregation yields a generalized assessment of perceived park atmosphere.
Using these aggregated variables, two sets of pairwise correlation analyses were conducted. The first set examined the correlations between the three spatial metrics and the proportions of images in each of the six park activity categories. The second set extended this analysis to the 24 specific user activities, enabling a finer-grained evaluation of how spatial configuration may be linked to different types of observed activities. An adapted interpretation of Pearson correlation coefficients was employed, acknowledging the complexity and multifaceted nature of behavioral patterns in urban parks. Following standards in behavioral and environmental research [32,36], correlations with |r| < 0.30 were classified as weak, those between 0.30 and 0.50 as moderate, and those greater than 0.50 as strong. Given the cross-sectional and observational design of the study, all reported relationships are interpreted as associations rather than causal effects. To address inflation of Type I error due to multiple comparisons, p-values were adjusted using the Benjamini–Hochberg false discovery rate (FDR) procedure for both the six activity indices and the 24 label-level correlations (Supplementary Tables S4 and S5). For key park-level associations between visibility metrics and the six activity indices, 95% confidence intervals for Pearson correlation coefficients were estimated using a non-parametric bootstrap (2000 resamples with replacement). Bootstrap-based confidence intervals for the six activity indices are summarized in Supplementary Table S6, and full label-level correlation results with FDR-adjusted p-values are reported in Supplementary Table S5.
To examine whether the visibility–activity associations were disproportionately influenced by parks with very few or very many user-generated images, a simple common-support analysis was performed based on park-level image counts. For each park, the total number of classified images was calculated, and the 25th and 75th percentiles of this distribution were identified (74 parks). A common-support subset of parks with image counts within this interquartile range was then defined, excluding parks with extremely sparse or abundant imagery. Within this subset, Pearson correlations between the three visibility metrics and the six activity indices were recomputed, with the same Benjamini–Hochberg FDR adjustment as in the main analysis.
2.7. Park-Level Multivariable Models
To assess whether the visibility metrics retained unique associations with park use after accounting for basic structural and neighborhood characteristics, park-level multivariable models for the six activity indices were estimated. For each index, a linear regression model was specified with the park-level activity index as the dependent variable, and the three visibility metrics as key predictors.
As potential confounders, park area (hectares, log-transformed), the total count of recreational amenities such as playgrounds, sports courts, picnic facilities, and washrooms, population density, and median income within a 500 m buffer of each park were included. All continuous predictors were z-standardized (mean = 0, standard deviation = 1) prior to modeling to facilitate comparison of effect sizes and reduce multicollinearity. Models were estimated using ordinary least squares in R (version 4.4.2). Residual plots were inspected to confirm approximate normality and homoscedasticity, and variance inflation factors (VIFs) were below commonly used thresholds, suggesting limited multicollinearity among predictors.
To examine whether spatial autocorrelation in model residuals could bias statistical inference, spatial dependence in the park-level models was tested. Park polygons were converted to centroids, and a row-standardized spatial-weights matrix was constructed using the five nearest neighboring parks based on centroid-to-centroid distances. For each of the six models, Moran’s I statistics on standardized residuals were computed using a permutation test with 499 randomizations. These diagnostics were used to evaluate whether substantial residual spatial clustering remained after controlling for visibility metrics and structural covariates. Standardized coefficients, 95% confidence intervals, p-values, and R2 values are reported, with emphasis on whether EIR, MIA, and MVI remain significantly associated with activity indices after adjustment for potential confounding variables.
3. Results
3.1. Park Distribution Patterns
Figure 4 presents the distribution of citywide image counts and the three spatial visibility metrics, MIA, MVI, and EIR, across Vancouver’s 148 urban parks. The top panel displays the number of user-generated images for each park, highlighting an example park with its associated images. The remaining three panels illustrate the corresponding spatial metrics for that park: MIA indicates average local visual openness, MVI reflects overall spatial integration, and EIR measures boundary-level visual permeability. The maps and diagrams offer an overview of how user engagement and visibility characteristics are spatially distributed, serving as a reference for the upcoming statistical analyses.
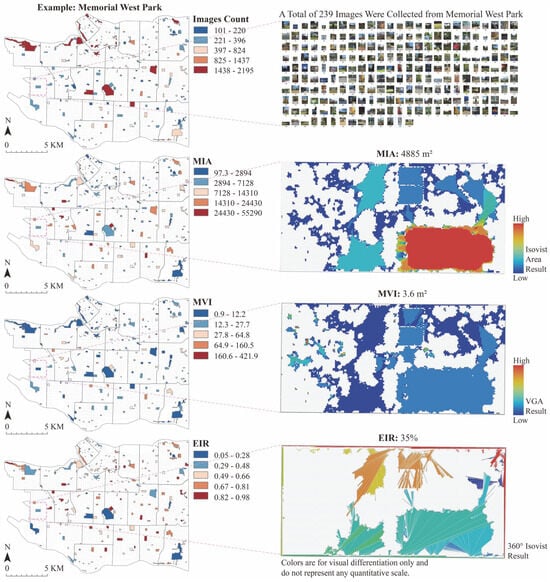
Figure 4.
Spatial Distribution of Visibility Metrics and UGI Counts Across Vancouver Parks.
Table 1 summarizes the descriptive statistics of user-generated image classifications across 148 urban parks in Vancouver. On average, Quiet Relaxation (M = 25.24%, SD = 7.53) and Nature Immersion (M = 23.94%, SD = 10.24) were the most common activity categories, together making up nearly half of all images. In contrast, Family Activity (M = 10.09%, SD = 7.07) and Physical Activity (M = 9.22%, SD = 5.74) were the least represented, although some parks showed relatively high proportions of these, with maxima of 43.09% and 50.66%, respectively. Social Vibrancy showed moderate prevalence (M = 15.52%, SD = 8.14), but varied considerably across parks (range: 1.34%–42.53%). In total, 23,115 time-stamped images were identified. The median capture year was 2023 (IQR 2021–2024), and approximately 83% of images were taken between 2020 and 2025. At the park level, parks with at least one dated image had a median of 73 time-stamped photos (IQR 34–148), a median earliest year of 2016 and latest year of 2025; about 89% of these parks had ≥80% of their dated images from 2018 onward, and over half had ≥95% from 2018 onward. Overall, these patterns indicate that most images are broadly contemporaneous with the 2022 LiDAR snapshot, although some park-level temporal mismatch remains possible. Year-wise and per-park temporal statistics are reported in Supplementary Tables S7 and S8.

Table 1.
Descriptive statistics of activity categories in 148 Vancouver urban parks.
3.2. Correlation Between Spatial Configuration and User Activity
Figure 5 presents the Pearson correlation coefficients between the three spatial metrics (MIA, MVI, EIR) and the six main park activity categories across the 148 parks. EIR was found to demonstrate the strongest and most varied relationships with park activity categories. It was positively correlated with Family Activity (r = 0.33, p_FDR < 0.001), Social Vibrancy (r = 0.31, p_FDR < 0.001), and Physical Activity (r = 0.30, p_FDR < 0.001). In contrast, EIR was negatively correlated with Nature Immersion (r = −0.31, p_FDR < 0.001) and Quiet Relaxation (r = −0.30, p_FDR < 0.001). MIA showed subtler links with the park activity categories. It exhibited weak positive associations with Social Vibrancy (r = 0.18) and Physical Activity (r = 0.16), but these did not remain statistically significant after false-discovery-rate (FDR) adjustment (Supplementary Table S4). Conversely, MIA had a weak negative correlation with Cultural Engagement (r = −0.21, p_FDR ≈ 0.04). MVI exhibited weak correlations across all park activity categories, which was interpreted as indicating that the overall visual connection of the urban park’s layout is not a major factor associated with these categories. A minor positive link between MVI and Physical Activity (r = 0.13, p > 0.1) was observed, but this did not reach statistical significance. The magnitude and precision of these associations were further supported by non-parametric bootstrap confidence intervals, which excluded zero for Social Vibrancy (r = 0.31, 95% CI [0.15, 0.45]), Family Activity (r = 0.33, 95% CI [0.21, 0.44]), Physical Activity (r = 0.30, 95% CI [0.17, 0.41]), Quiet Relaxation (r = −0.30, 95% CI [−0.43, −0.16]), and Nature Immersion (r = −0.31, 95% CI [−0.48, −0.14]) (Supplementary Table S6).
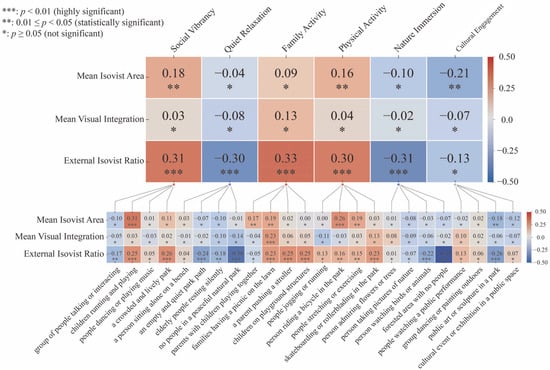
Figure 5.
Correlations Between Spatial Configuration and User Activity.
To test whether visibility–activity associations were driven by parks with extremely low or high image volumes, the correlations on a common-support subset of parks with intermediate image counts were re-estimated. Within this subset, EIR remained moderately associated with Social Vibrancy, Family Activity, Physical Activity, Nature Immersion, and Quiet Relaxation after FDR adjustment, while its association with Cultural Engagement remained non-significant. MIA continued to show a modest positive association with Social Vibrancy and a negative association with Cultural Engagement, and all MVI–activity correlations remained weak and non-significant (Supplementary Table S11). These results indicate that the main visibility–activity patterns are not driven solely by parks with extreme image volumes.
To better understand spatial metrics and user activity, the correlation between the spatial metrics and a detailed set of 24 user activity labels was also examined. For these label-level analyses, p-values were likewise adjusted using the Benjamini–Hochberg FDR procedure, and full results are reported in Supplementary Table S5. These correlations were found to support and extend the broader patterns mentioned above. For EIR, the user activity label correlations were broadly in line with the park activity categories results, highlighting EIR’s strong association with urban park atmosphere. EIR exhibited strong negative correlations with labels reflecting solitary and nature-focused scenes. For example, “no people in a peaceful natural park” had a moderate negative correlation (r = −0.38, p_FDR < 0.001), and “forested area with no people” showed an even stronger link (r = −0.45, p_FDR < 0.001). In contrast, EIR demonstrated moderate positive correlations with various scenes of social and physical activity. Labels like “a crowded and lively park” (r = 0.26, p_FDR < 0.05), “families having a picnic on the lawn” (r = 0.23, p_FDR < 0.05), “a parent pushing a stroller” (r = 0.25, p_FDR < 0.05), “children on playground structures” (r = 0.25, p_FDR < 0.05), “children running and playing” (r = 0.25, p_FDR < 0.05), and “skateboarding or rollerblading in the park” (r = 0.23, p_FDR < 0.05) were all positively associated with higher EIR. EIR was also negatively related to labels such as “an empty and quiet park path” (r = −0.24, p_FDR < 0.05), “person watching birds or animals” (r = −0.22, p_FDR < 0.05), and “public art or sculpture in a park” (r = −0.26, p_FDR < 0.05), indicating that more opaque edges are more likely to host secluded, contemplative, or culturally focused scenes. Taken together, these label-level results show that, after FDR adjustment, higher edge transparency remains selectively associated with a subset of highly visible, dynamic, and socially oriented activities, and inversely linked with unpeopled or inward-focused nature scenes.
For MIA, the strongest positive correlation was with images of “children running and playing” (r = 0.31, p_FDR < 0.01), and weaker positive correlations were observed with labels such as “people stretching or exercising” (r = 0.21, p_FDR < 0.05) and “skateboarding or rollerblading in the park” (r = 0.21, p_FDR < 0.05). MIA also showed negative associations with labels emphasizing enclosure or unpeopled nature, including “an empty and quiet park path” (r = −0.23, p_FDR < 0.05), “no people in a peaceful natural park” (r = −0.32, p_FDR < 0.01), “forested area with no people” (r = −0.34, p_FDR < 0.01), and “public art or sculpture in a park” (r = −0.23, p_FDR < 0.05). Other weak correlations involving MIA did not remain significant after FDR correction. For MVI, only one notable positive correlation appeared with “families having a picnic on the lawn” in the raw analysis, but this and other MVI-label associations were not statistically significant after FDR adjustment. Overall, MVI’s limited correlations were interpreted as suggesting that internal visual connectivity is not strongly associated with most specific activities, except that it points to locations where social gathering may happen.
3.3. Unique Associations After Adjustment for Park and Neighborhood Covariates
Park-level multivariable models confirmed that EIR remained as the visibility metric that is most strongly associated with activity indices after adjusting for basic park and neighborhood characteristics (Supplementary Table S9). For Social Vibrancy, the standardized coefficient for EIR was positive and statistically significant (β = 0.018, 95% CI: 0.002–0.034, p = 0.030), whereas the standardized coefficient for MIA and MVI were small and non-significant (|β| ≤ 0.004, p ≥ 0.56). For Family Activity, EIR also retained a positive association (β = 0.026, 95% CI: 0.012–0.039, p < 0.001), while MIA and MVI again showed weak and non-significant coefficients (|β| ≤ 0.006, p ≥ 0.38). A similar pattern was observed for Physical Activity, where EIR was positively associated with the activity index (β = 0.014, 95% CI: 0.003–0.025, p = 0.016), and MIA and MVI remained non-significant (|β| ≤ 0.003, p ≥ 0.52).
In contrast, the models for Nature Immersion and Quiet Relaxation yielded negative coefficients for EIR. Parks with higher EIR tended to have lower relative shares of nature-immersion imagery (β = −0.034, 95% CI: −0.055 to −0.014, p = 0.001) and quiet-relaxation imagery (β = −0.022, 95% CI: −0.037 to −0.007, p = 0.004) once park area, amenity counts, and neighborhood context were held constant. For Cultural Engagement, the coefficient for EIR was close to zero and non-significant (β = −0.001, p = 0.915). Across all models, the control variables showed weaker and less consistent associations: park area, amenity counts, population density, and median income were generally small in magnitude (|β| ≤ 0.02) and only occasionally reached significance.
Tests for residual spatial autocorrelation indicated little evidence of remaining spatial clustering after accounting for visibility and park-level covariates. Moran’s I values for the six park-level models ranged from −0.08 to 0.01, and all permutation-based p-values exceeded 0.10, suggesting that residual spatial dependence was weak and not statistically significant (Supplementary Table S10).
Although several standardized coefficients for EIR are statistically significant, their magnitudes are modest (β values on the order of 0.01–0.03). This indicates that spatial visibility accounts for only a limited portion of the between-park variation in activity indices and should be interpreted as one contributing factor among many, rather than a dominant determinant of park use.
4. Discussion
4.1. Spatial Openness and Edge Transparency as Key Correlates of Urban Park Use
The results indicate that EIR is the visibility metric most strongly associated with user activity in Vancouver’s urban parks, followed by MIA, whereas internal MVI plays a comparatively minor role. Parks with high edge visibility (high EIR) are more frequently associated with images of social interaction, family use, and physical activity. By contrast, low edge visibility (low EIR) is more often linked to scenes of nature immersion and quiet relaxation. This pattern suggests that greater edge transparency and external visibility are connected to more active social engagement, as visually open parks tend to feel more accessible and safer to a broad range of users including families, athletes, and casual visitors and make their activities more visible to passersby. This interpretation is consistent with Jacobs’s notion of “eyes on the street,” a classic theoretical cornerstone in urban design, as well as other traditional urbanist observations [15,34] and is further supported by recent empirical studies showing that visually accessible and inviting green spaces enhance perceived safety, support a wider variety of activities, and are positively associated with public happiness [37,38]. Conversely, lower edge transparency and external visibility are typically associated with more peaceful, secluded environments that emerge in hidden locations away from the city’s hustle, where users can experience a sense of escape.
The positive associations between EIR and socially oriented activity indices, and the negative associations with nature-immersion and quiet-relaxation indices, remain evident after controlling for park area, amenity provision, and neighborhood demographics in park-level multivariable models (Table 2). This indicates that edge transparency is not merely a proxy for larger or better-equipped parks but reflects a distinct dimension of spatial configuration related to how parks are socially utilized. At the same time, the standardized effect sizes for EIR in these models are modest in magnitude, even when statistically significant. Thus, edge transparency should be understood as a meaningful but not exclusive correlate of social and physically active use, operating alongside a broader constellation of design, maintenance, programming, and neighborhood factors that also shape park use. These visibility–activity relationships are robust to multiple-testing control and uncertainty in effect-size estimation: the key EIR–activity correlations remain statistically significant after false-discovery-rate (FDR) adjustment, and their bootstrap 95% confidence intervals consistently exclude zero, whereas most weaker associations involving MIA and all associations involving MVI do not.
Table 2.
Standardized coefficients from park-level linear models relating edge transparency and covariates to three activity indices.
Each column corresponds to a separate linear regression model. Values are standardized coefficients (β), with p-values in parentheses. All predictors were z-standardized; park area was log-transformed before standardization. Full models including MIA and MVI for all six activity indices are reported in Supplementary Table S9.
Urban parks with broad internal openness (high MIA) were moderately linked to dynamic, child-friendly, and movement-focused uses, supporting studies that emphasize the importance of visible lawns and playgrounds for encouraging active and social activities [12,39,40]. In contrast, more enclosed or segmented urban parks (low MIA) were often associated with cultural and personal nature experiences. A reasonable interpretation is that cultural installations or performances often occur in more enclosed, human-scale settings like amphitheaters or gardens rather than in open fields. Therefore, very high openness in a park may sometimes be linked to fewer intimate spaces needed for specific art installations, indicating that parks with multiple zones and visual diversity might better serve different user needs [41,42]. Overall, although the correlations with MIA were modest, they support the idea that open spaces are more connected to active and social activities, while more secluded areas tend to foster cultural or contemplative experiences.
While important for wayfinding, visual integration showed limited explanatory power in this context. This finding contributes to the nuanced picture emerging in recent years: although space syntax theory predicts that higher integration is correlated with higher activity [23], observed behavior in parks appears to be more strongly associated with localized openness, edge conditions, and perceptual cues than with global visual connectivity [12].
Taken together, the findings indicate that visibility functions not only as a geometric attribute of urban park design but also as a perceptual and behavioral correlate of urban park usage. Highly visible park environments were more often associated with greater exposure, higher user presence, and more active participation, whereas visually secluded environments were more often associated with introspection and ecological engagement. These patterns are consistent with landscape preference and attention restoration theories, which emphasize the human inclination toward varied spatial affordances that support fascination and tranquility [43,44,45]. The data-driven results echo these theoretical perspectives: urban parks providing clear sightlines were typically lively and populated, whereas those offering hidden refuge spaces were more often appreciated for quietness and nature.
4.2. Implications for Urban Park Planning and Policy
From a planning and design perspective, these findings are corroborated by studies conducted in cities across the globe. Although the analyses are correlational and cannot establish causal effects, the observed patterns can still inform hypothesis-driven design strategies about how visibility may relate to park use. Spatial visibility should be a central criterion in optimizing multifunctional park use [12,21,28]. The results point to strategies: if the goal is to support social cohesion and lively activity, an urban park’s design should include highly visible zones in some sections. For instance, situating playgrounds, picnic lawns, or sports courts in areas with high EIR, such as along the urban park edge or with a visually prominent internal clearing, is likely to be associated with higher levels of usage, as these activities become more visible and thus inviting to others. This strategy resonates with the recommendations of Jan Gehl and colleagues who advocate for designing “people-friendly” spaces that encourage optional activities through openness and sightlines [14]. An open edge or a permeable boundary with low hedges instead of high fences that creates transparent sightlines from the street may be perceived as lowering the threshold for entry, aligning with Jacobs’s notion that a safe and lively urban park is one that people can observe and monitor even from outside [34]. The findings provide empirical support for these ideas: urban parks that are more visually accessible from their surroundings have better evidence of social and recreational uses.
Nevertheless, if the objective is to promote psychological restoration, nature connection, and a sense of escape, then intentionally designing low-visibility zones is equally important. Landscape architects can create verdant enclaves or shielded gardens within an urban park by using vegetation and topography to block views and noise. These areas should be buffered from the busiest parts of the urban park, and outside glances should resonate with the “room” concept in landscape design, where trees or shrubs enclose a small haven. The data show that such conditions correlate with users finding solitude and immersion, supporting the Kaplan & Kaplan [43] suggestion that opportunities for “being away” and experiencing nature are crucial in urban green spaces. The challenge is balancing these needs within a single urban park. Our results suggest that visual zoning can be a practical approach: a larger urban park can be zoned into a highly open, visibly porous section for active uses and community interaction, and a more secluded section for contemplative, nature-oriented uses. These zones can coexist and even complement each other, offering diversity in user experiences.
For urban park management, the use of CLIP-based semantic classification demonstrated in this study offers practical utility for ongoing monitoring of public space use. Traditionally, understanding how different urban park areas are used required labor-intensive field observations or surveys [14,15,16]. While rich in insight, those methods are limited in temporal scope and frequency. In contrast, the approach of analyzing crowdsourced images provides a continuous stream of data reflecting user experiences. Government agencies could potentially deploy this approach with appropriate privacy safeguards to gauge whether interventions work. The approach used in this study is a cost-effective complement to periodic site observations because urban park users voluntarily provide the data through photo uploads, and the analysis can be automated.
However, reliance on user-generated images also raises concerns of spatial, demographic, and activity-type biases. Images tend to overrepresent visually appealing activities and popular parks, while underused community parks, often in greater need of investment, may be overlooked. If uncorrected, such biases risk exacerbating inequities in resource allocation, echoing concerns in data justice that “what is seen gets funded, while what is unseen is neglected.” To avoid these pitfalls, future applications should combine image-based analytics with on-site surveys and equity audits, ensuring that data-driven decisions are more inclusive.
Thus, image-based metrics can serve as a responsive and scalable tool for park management, but they must be interpreted cautiously and supplemented with complementary datasets and observations. This resonates with the ethos of Gehl’s Public Spaces, Public Life surveys, which sought to inform urban design empirically; this line of research is extended in the present study by using digital data, while also recognizing the responsibility to correct for representational biases to achieve equitable urban park planning [46].
Another implication concerns community engagement. Visibility, both actual and perceived, is often reported as being associated with whether people feel safe in an urban park. The present study highlights that open, visible urban parks correlate with more usage, supporting the idea that enhancing visibility through lighting, pruning, and sightline maintenance may be tied to improvements in an urban park’s public image. Park planners should consider sightlines as a design element akin to pathways or furniture. For example, when renovating an urban park, attention should be paid to how planting arrangements or new structures might obstruct or open critical views. Strategic cutbacks of underbrush near entrances, transparent fencing, or elevation changes can create inviting “previews” of the urban park from the outside, potentially drawing in curious passers-by. At the same time, planners should identify areas where preserving or creating seclusion is desirable and manage vegetation there accordingly. This translates to a nuanced stance on urban park visibility in design guidelines: neither uniformly open nor uniformly closed, but intentionally varied to support multiple functions.
Finally, the importance of interdisciplinary thinking in urban park design is highlighted by this study. The spatial analysis and the user perception data tell part of the story, revealing actionable connections. Planners and designers should collaborate with data scientists and ecologists to map visibility and use patterns when planning new urban parks or major retrofits. This could guide early design decisions toward urban park configurations that meet the desired objectives. The results of this study support the integration of spatial visibility metrics into urban park management strategies, to enhance both ecological connectivity and user experiences. Municipal authorities and urban park practitioners are encouraged to design planting schemes and edge treatments that optimize visibility, supporting social interaction, safety, and psychological restoration. By integrating these insights into urban park planning and management guidelines, cities can foster urban parks that are more multifunctional, inclusive, and resilient, ultimately better supporting community needs.
4.3. Limitations and Future Prospects
A first set of limitations arises from the nature of the UGI data and the CLIP-based classification pipeline. Although CLIP offers scalable, flexible recognition for complex urban scenes, it inevitably inherits biases from its pre-trained corpus and from the specific prompt set used in this study. The UGI dataset is also demographically and behaviorally selective: images are more likely to be contributed by younger, tech-savvy visitors and tourists, and to portray visually salient, social, or leisure-oriented scenes, whereas routine, solitary, or less photogenic activities are underrepresented. Moreover, many park photos plausibly contain co-occurring activities, yet our pipeline adopts a single, “winner-take-all” label per image to avoid inflating counts. This design simplifies inherently multi-faceted scenes and can lead to misclassifications, particularly among semantically related prompts. Our human-coded validation suggests that most errors remain within the same broader activity category and that the main EIR–activity patterns are robust in a high-confidence subset. In the stratified validation sample (n = 573), CLIP achieved an overall accuracy of 0.79 and a macro-averaged F1-score of 0.77 across the 24 prompts, indicating that the aggregated six-category indices capture the main behavioral distinctions with reasonable reliability despite this residual noise (Supplementary Table S2). Capture dates were available only for a subset of images; although the time-stamped subset indicates that most images are broadly contemporaneous with the 2022 LiDAR snapshot, and common-support checks based on image volume yield similar visibility–activity associations, some temporal and selection biases remain. Future research should therefore complement image-based analytics with on-site surveys, systematic behavioral observations, and potentially multi-platform UGI sources, and further expand human validation (e.g., multi-label coding or repeated annotation) to better characterize classifier errors and ensure that a fuller spectrum of urban park uses is captured.
A second limitation concerns residual confounding and the observational design. Our park-level multivariable models adjust for several basic structural and neighborhood characteristics, including park area, amenity provision, population density, and median income, and Moran’s I diagnostics on model residuals do not indicate strong residual spatial autocorrelation once these covariates and visibility metrics are included. Nevertheless, unobserved contextual factors, such as detailed accessibility patterns, event programming, perceived safety, or maintenance regimes, may still influence both visibility and park use in ways that are not captured by our covariate set. In addition, the cross-sectional nature of the data precludes any firm causal claims about visibility “driving” particular forms of activity or “shaping” specific types of atmospheres. For these reasons, all reported relationships should be interpreted as associations rather than causal effects. Building on this framework, future work could incorporate richer covariates (e.g., fine-grained accessibility measures, crime or maintenance records, temporal variation in programming) and employ longitudinal, quasi-experimental, or intervention designs to disentangle visibility effects more clearly from broader environmental and social determinants of park use.
A third limitation relates to the modeling choices made in constructing the visibility metrics. The LiDAR-based visibility pipeline was implemented using a specific parameter configuration, namely a 2 m grid resolution for isovists, a 2 m canopy height threshold to define vegetation obstacles, and 2 m perimeter sampling for EIR with isovists clipped to the park interior. These settings follow common practice in pedestrian-scale visibility modeling and were chosen to balance geometric fidelity with computational feasibility at the city-park scale, but alternative grid spacings, canopy thresholds, or edge-sampling schemes were not systematically evaluated. It is therefore possible that some aspects of the reported associations are sensitive to these modeling choices. Future research could explicitly conduct sensitivity analyses, such as varying grid resolution, experimenting with alternative vegetation classifications, or testing different field-of-view constraints for edge observers, to assess the stability of visibility metrics and the robustness of visibility–activity relationships under different parameter configurations. Such analyses would clarify which components of the pipeline are most influential and help refine visibility-aware design guidelines for urban parks.
5. Conclusions
In conclusion, a multimodal approach integrating spatial visibility analysis with large-scale image-based semantic classification was employed to examine associations between the spatial configuration of urban parks, particularly boundary visibility, and patterns of human use. The findings indicate that parks with high external visibility at their edges are more often connected with vibrant social interaction, active recreation, and more inclusive use, while visually enclosed and secluded environments are more often associated with nature-oriented, contemplative experiences. Evidence-based implications for urban park management and landscape planning are thereby provided: design strategies that balance visual openness and spatial refuge are likely to be associated with better accommodation of diverse user preferences and with higher levels of social ecosystem services. Overall, the present research highlights that spatial visibility is not merely a geometric property of urban park design, but a powerful ecological and social planning parameter. By incorporating visibility considerations into urban park design and management, cities can improve the multifunctionality, social value, and long-term sustainability of urban green infrastructure.
Supplementary Materials
The following supporting information can be downloaded at: https://www.mdpi.com/article/10.3390/f16121874/s1. Table S1: Pearson correlations between visibility metrics and six park-level activity indices using a high-confidence image subset (top-1 similarity ≥ 80th percentile); Table S2: Precision, recall, and F1-score for CLIP-predicted activity labels; Table S3: Examples of CLIP successes and failures in the validation sample; Table S4: Raw p-values and FDR-adjusted p-values for correlations between the three visibility metrics and six activity categories; Table S5: Raw p-values and FDR-adjusted p-values for correlations between the three visibility metrics and 24 activity labels; Table S6: Bootstrap confidence intervals for associations between visibility metrics and six activity categories; Table S7: Temporal distribution of user-generated images with valid capture dates between 2010 and 2025; Table S8: Per-park temporal coverage of user-generated images; Table S9: Standardized coefficients from park-level linear models for six activity indices; Table S10: Moran’s I diagnostics for residual spatial autocorrelation in park-level models; Table S11: Pearson correlations between visibility metrics and six activity indices for the common-support subset of parks (image counts between the 25th and 75th percentiles; N = 74 parks).
Author Contributions
Conceptualization, Y.L. and Y.C.; Methodology, Y.L., Y.C. and S.Z. (Shuhan Zhou); Software, Y.L. and S.Z. (Shuhan Zhou); Validation, Y.C. and K.C.; Formal analysis, Y.L., Y.C. and K.C.; Investigation, Y.L., Y.C. and S.Z. (Shuhan Zhou); Resources, S.Z. (Shuang Zhao) and M.C.; Data curation, Y.C., S.Z. (Shuhan Zhou) and K.C.; Writing—original draft preparation, Y.L.; Writing—review and editing, S.Z. (Shuang Zhao), Y.C. and M.C.; Visualization, Y.L., S.Z. (Shuhan Zhou) and K.C.; Supervision, M.C. and S.Z. (Shuang Zhao); Project administration, Y.L.; Funding acquisition, S.Z. (Shuang Zhao) and M.C. All authors have read and agreed to the published version of the manuscript.
Funding
This research received no external funding.
Data Availability Statement
The data presented in this study is available from the corresponding author upon reasonable re-quest.
Acknowledgments
We would like to thank the editors and anonymous referees for their constructive suggestions and comments that helped improve this paper’s quality.
Conflicts of Interest
The authors declare no conflicts of interest.
Abbreviations
The following abbreviations are used in this manuscript:
| CLIP | Contrastive Language-Image Pretraining |
| MIA | Mean Isovist Area |
| MVI | Mean Visual Integration |
| EIR | External Isovist Ratio |
| UGI | User-Generated Images |
| VGA | Visibility Graph Analysis |
References
- Hanson, H.I.; Eckberg, E.; Widenberg, M.; Alkan Olsson, J. Gardens’ Contribution to People and Urban Green Space. Urban For. Urban Green. 2021, 63, 127198. [Google Scholar] [CrossRef]
- Jennings, V.; Baptiste, A.K.; Osborne Jelks, N.; Skeete, R. Urban Green Space and the Pursuit of Health Equity in Parts of the United States. Int. J. Environ. Res. Public Health 2017, 14, 1432. [Google Scholar] [CrossRef]
- Lopes, M.N.; Camanho, A.S. Public Green Space Use and Consequences on Urban Vitality: An Assessment of European Cities. Soc. Indic. Res. 2013, 113, 751–767. [Google Scholar] [CrossRef]
- Dadvand, P.; Hariri, S.; Abbasi, B.; Heshmat, R.; Qorbani, M.; Motlagh, M.E.; Basagaña, X.; Kelishadi, R. Use of Green Spaces, Self-Satisfaction and Social Contacts in Adolescents: A Population-Based CASPIAN-V Study. Environ. Res. 2019, 168, 171–177. [Google Scholar] [CrossRef] [PubMed]
- Yang, M.; Nie, W.; Wu, R.; Yan, H.; Tian, S.; Wang, K.; Shi, L.; Cheng, X.; Ji, T.; Bao, Z. Towards More Equitable Cooling Services of Urban Parks: Linking Cooling Effect, Accessibility and Attractiveness. J. Environ. Manag. 2024, 370, 122475. [Google Scholar] [CrossRef]
- Fang, C.-F.; Ling, D.-L. Investigation of the Noise Reduction Provided by Tree Belts. Landsc. Urban Plan. 2003, 63, 187–195. [Google Scholar] [CrossRef]
- Herath, P.; Bai, X.; Jin, H.; Thatcher, M. Does the Spatial Configuration of Urban Parks Matter in Ameliorating Extreme Heat? Urban Clim. 2024, 53, 101756. [Google Scholar] [CrossRef]
- Mahmoud, A.H.; Omar, R.H. Planting Design for Urban Parks: Space Syntax as a Landscape Design Assessment Tool. Front. Archit. Res. 2015, 4, 35–45. [Google Scholar] [CrossRef]
- Schroeder, H.W.; Orland, B. Viewer Preference for Spatial Arrangement of Park Trees: An Application of Video-Imaging Technology. Environ. Manag. 1994, 18, 119–128. [Google Scholar] [CrossRef]
- Jennings, V.; Bamkole, O. The Relationship between Social Cohesion and Urban Green Space: An Avenue for Health Promotion. Int. J. Environ. Res. Public Health 2019, 16, 452. [Google Scholar] [CrossRef]
- Mateer, T.J. Developing Connectedness to Nature in Urban Outdoor Settings: A Potential Pathway through Awe, Solitude, and Leisure. Front. Psychol. 2022, 13, 940939. [Google Scholar] [CrossRef] [PubMed]
- Liu, C.; Wang, T.-Y.; Yuizono, T. Assessing the Landscape Visual Quality of Urban Green Spaces with Multidimensional Visual Indicators. Urban For. Urban Green. 2025, 106, 128727. [Google Scholar] [CrossRef]
- Tabrizian, P.; Baran, P.K.; Smith, W.R.; Meentemeyer, R.K. Exploring Perceived Restoration Potential of Urban Green Enclosure through Immersive Virtual Environments. J. Environ. Psychol. 2018, 55, 99–109. [Google Scholar] [CrossRef]
- Gehl, J. Life Between Buildings: Using Public Space; Island Press: Washington, DC, USA, 2011. [Google Scholar]
- Whyte, W.H. The Social Life of Small Urban Spaces; Project for Public Spaces: Brooklyn, NY, USA, 1980. [Google Scholar]
- Yuan, F.; Chen, M. A Systematic Review of Measurement Tools and Senior Engagement in Urban Nature: Health Benefits and Behavioral Patterns Analysis. Health Place 2025, 91, 103410. [Google Scholar] [CrossRef] [PubMed]
- Goodchild, M.F. Citizens as Sensors: The World of Volunteered Geography. Geojournal 2007, 69, 211–221. [Google Scholar] [CrossRef]
- Tulloch, D. Crowdsourcing Geographic Knowledge: Volunteered Geographic Information (VGI) in Theory and Practice. Int. J. Geogr. Inf. Sci. 2014, 28, 847–849. [Google Scholar] [CrossRef]
- Heikinheimo, V.; Tenkanen, H.; Bergroth, C.; Järv, O.; Hiippala, T.; Toivonen, T. Understanding the Use of Urban Green Spaces from User-Generated Geographic Information. Landsc. Urban Plan. 2020, 201, 103845. [Google Scholar] [CrossRef]
- Van den Homberg, M.; Susha, I. Characterizing Data Ecosystems to Support Official Statistics with Open Mapping Data for Reporting on Sustainable Development Goals. ISPRS Int. J. Geo-Inf. 2018, 7, 456. [Google Scholar] [CrossRef]
- Chen, M.; Cai, Y.; Guo, S.; Sun, R.; Song, Y.; Shen, X. Evaluating Implied Urban Nature Vitality in San Francisco: An Interdisciplinary Approach Combining Census Data, Street View Images, and Social Media Analysis. Urban For. Urban Green. 2024, 95, 128289. [Google Scholar] [CrossRef]
- Radford, A.; Kim, J.W.; Hallacy, C.; Ramesh, A.; Goh, G.; Agarwal, S.; Sastry, G.; Askell, A.; Mishkin, P.; Clark, J.; et al. Learning Transferable Visual Models from Natural Language Supervision. arXiv 2021, arXiv:2103.00020. [Google Scholar] [CrossRef]
- Hillier, B. Space Is the Machine: A Configurational Theory of Architecture; Cambridge University Press: Cambridge, UK, 1996. [Google Scholar]
- Hillier, B.; Hanson, J. The Social Logic of Space; Cambridge University Press: Cambridge, UK, 1984; ISBN 978-0-521-36784-4. [Google Scholar]
- Turner, A.; Doxa, M.; O’Sullivan, D.; Penn, A. From Isovists to Visibility Graphs: A Methodology for the Analysis of Architectural Space. Environ. Plan. B Plan. Des. 2001, 28, 103–121. [Google Scholar] [CrossRef]
- Wiener, J.M.; Franz, G.; Rossmanith, N.; Reichelt, A.; Mallot, H.A.; Bülthoff, H.H. Isovist Analysis Captures Properties of Space Relevant for Locomotion and Experience. Perception 2007, 36, 1066–1083. [Google Scholar] [CrossRef]
- Wineman, J.D.; Peponis, J. Constructing Spatial Meaning: Spatial Affordances in Museum Design. Environ. Behav. 2010, 42, 86–109. [Google Scholar] [CrossRef]
- Wei, J.; Yue, W.; Li, M.; Gao, J. Mapping Human Perception of Urban Landscape from Street-View Images: A Deep-Learning Approach. Int. J. Appl. Earth Obs. Geoinf. 2022, 112, 102886. [Google Scholar] [CrossRef]
- Government of Canada; Statistics Canada. Focus on Geography Series, 2021 Census—Greater Vancouver (Census Division). Available online: https://www12.statcan.gc.ca/census-recensement/2021/as-sa/fogs-spg/Page.cfm?lang=E&topic=1&dguid=2021A00035915 (accessed on 27 May 2025).
- Veitch, J.; Salmon, J.; Ball, K. Children’s Active Free Play in Local Neighborhoods: A Behavioral Mapping Study. Health Educ. Res. 2008, 23, 870–879. [Google Scholar] [CrossRef]
- Hu, T.; Wei, D.; Su, Y.; Wang, X.; Zhang, J.; Sun, X.; Liu, Y.; Guo, Q. Quantifying the Shape of Urban Street Trees and Evaluating Its Influence on Their Aesthetic Functions Based on Mobile Lidar Data. ISPRS J. Photogramm. Remote Sens. 2022, 184, 203–214. [Google Scholar] [CrossRef]
- Chen, M.; Liu, Y.; Liu, F.; Chadha, T.; Park, K. Measuring Pedestrian-Level Street Greenery Visibility through Space Syntax and Crowdsourced Imagery: A Case Study in London, UK. Urban For. Urban Green. 2025, 105, 128725. [Google Scholar] [CrossRef]
- LiDAR 2022. Available online: https://opendata.vancouver.ca/explore/dataset/lidar-2022/ (accessed on 27 May 2025).
- Row, A.T.; Jacobs, J. The Death and Life of Great American Cities; Vintage: New York, NY, USA, 1992. [Google Scholar]
- Mukaka, M. A Guide to Appropriate Use of Correlation Coefficient in Medical Research. Malawi Med. J. 2012, 24, 69–71. [Google Scholar]
- Schober, P.; Boer, C.; Schwarte, L.A. Correlation Coefficients: Appropriate Use and Interpretation. Anesth. Analg. 2018, 126, 1763. [Google Scholar] [CrossRef] [PubMed]
- Bahr, S. The Relationship between Urban Greenery, Mixed Land Use and Life Satisfaction: An Examination Using Remote Sensing Data and Deep Learning. Landsc. Urban Plan. 2024, 251, 105174. [Google Scholar] [CrossRef]
- Chen, C.; Li, H.; Luo, W.; Xie, J.; Yao, J.; Wu, L.; Xia, Y. Predicting the Effect of Street Environment on Residents’ Mood States in Large Urban Areas Using Machine Learning and Street View Images. Sci. Total Environ. 2022, 816, 151605. [Google Scholar] [CrossRef]
- Al-Saedi, D.F.S.; Chamani, A. Integrating Public Perception and Quantitative Metrics for Improved Urban Park Planning in Isfahan, Iran. Trees For. People 2024, 18, 100729. [Google Scholar] [CrossRef]
- Zhang, F.; Zhou, B.; Liu, L.; Liu, Y.; Fung, H.H.; Lin, H.; Ratti, C. Measuring Human Perceptions of a Large-Scale Urban Region Using Machine Learning. Landsc. Urban Plan. 2018, 180, 148–160. [Google Scholar] [CrossRef]
- Chen, N.; Wang, L.; Xu, T.; Wang, M. Perception of Urban Street Visual Color Environment Based on the CEP-KASS Framework. Landsc. Urban Plan. 2025, 259, 105359. [Google Scholar] [CrossRef]
- Liu, Y.; Chen, M.; Wang, M.; Huang, J.; Thomas, F.; Rahimi, K.; Mamouei, M. An Interpretable Machine Learning Framework for Measuring Urban Perceptions from Panoramic Street View Images. Iscience 2023, 26, 106132. [Google Scholar] [CrossRef] [PubMed]
- Kaplan, R.; Kaplan, S. The Experience of Nature: A Psychological Perspective; Cambridge University Press: New York, NY, USA, 1989; p. 340. ISBN 978-0-521-34139-4. [Google Scholar]
- Ulrich, R.S. Aesthetic and Affective Response to Natural Environment. In Behavior and the Natural Environment; Altman, I., Wohlwill, J.F., Eds.; Springer: Boston, MA, USA, 1983; pp. 85–125. ISBN 978-1-4613-3541-2. [Google Scholar]
- Wang, Z.; Zhou, R.; Rui, J.; Yu, Y. Revealing the Impact of Urban Spatial Morphology on Land Surface Temperature in Plain and Plateau Cities Using Explainable Machine Learning. Sustain. Cities Soc. 2025, 118, 106046. [Google Scholar] [CrossRef]
- Hu, Y.; Chen, M.; Cai, Y. Comparative Analysis of Greenery Inequalities in New York and London: Social-Economic and Spatial Dimensions. Urban For. Urban Green. 2025, 112, 128939. [Google Scholar] [CrossRef]


Disclaimer/Publisher’s Note: The statements, opinions and data contained in all publications are solely those of the individual author(s) and contributor(s) and not of MDPI and/or the editor(s). MDPI and/or the editor(s) disclaim responsibility for any injury to people or property resulting from any ideas, methods, instructions or products referred to in the content. |
© 2025 by the authors. Licensee MDPI, Basel, Switzerland. This article is an open access article distributed under the terms and conditions of the Creative Commons Attribution (CC BY) license (https://creativecommons.org/licenses/by/4.0/).