Abstract
Red deer (Cervus elaphus), as a highly vocal species, provide versatile ecosystem functions beyond grazing. Their flexible use of different habitats allows them to occupy a variety of ecosystems. As global efforts to conserve biodiversity increase, there is a growing need for new approaches to continuous wildlife monitoring. Bioacoustics is a rapidly developing field that provides valuable data, especially in environments that are difficult to access. The spatial occupancy of red deer in Kopački Rit Nature Park was investigated using passive acoustic devices during the rutting season (September–October) in 2023 and 2024. A total of 332,302 recordings were collected with AudioMoth devices configured to record for 1 min every 5 min over a 10-day period. A recognition model was trained on the Arbimon platform, and a random forest model was applied to the detection data. The occupancy model revealed differences in spatial occupancy between the two years. Although none of the tested covariates showed statistically significant effects, the observed differences likely reflect unmeasured ecological dynamics, such as hydrological variability and resource availability. These findings highlight the potential of passive acoustic monitoring as a reliable, non-invasive approach for large mammal studies.
1. Introduction
Animal communication consists of a variety of signals transmitted from one animal to another during their daily activities [1]. Most animal vocalisations exhibit highly distinctive features and often contain species-specific characteristics [2]. Improvements in technology enable us to record and analyse these signals, which can help us understand animal activities and distribution in various ecosystems. Application of this methodology allows better insight into ongoing environmental changes, population biology, and animal behaviour [3,4]. Additionally, receiving audio signals from various distances provides scientists with discreet detection and observation without disturbing target species or ecosystems [5]. With increasing global awareness of biodiversity conservation, due to terrestrial biodiversity loss from land use [6], there is a need for new ways of continuous monitoring. In recent years, passive acoustic monitoring (PAM) devices have been frequently used for biodiversity studies across various ecosystems, for understanding the vocalisations of species or multiple taxa, or for assessing ecosystem health [7,8]. This method generates high-resolution recordings, offering insight into biodiversity monitoring across time scales, enabling temporal studies of species dynamics to a level that was not previously feasible [9,10]. Acoustic data acquired by PAM enable us to study temporal variability of species detections and soundscape characteristics shaped by natural cycles. For instance, in different ecosystems, daily animal vocal activity can vary between dawn and dusk, creating pronounced cycles in the acoustic environment [11]. Although PAM has some technological and biological limitations, it enables continuous monitoring in remote locations while providing long-term biodiversity data [12]. Also, PAM enables data collection during extreme conditions when field accessibility is reduced, for example, during floods or the rainy season. These periods are important for the distribution and life cycle stages of birds or mammals [13].
Kopački Rit is one of the largest and best-preserved fluvial marsh floodplains in Europe, shaped by seasonal flooding. The area consists of a mosaic of plant communities distributed according to their tolerance to water level fluctuations. It supports great biodiversity with valuable, rare, and endangered species. For this reason, the area is under the Ramsar Convention and is part of the NATURA 2000 ecological network. Additionally, part of Kopački Rit is classified as a Special Zoological Reserve [14,15].
Red deer (Cervus elaphus) is a highly vocal species in Kopački Rit, especially during the mating season. During the breeding season, males exhibit a special behavioural pattern, using acoustic communication to advertise their territory and attract females [16]. Although red deer is classified as “Least Concern” on the IUCN Red List due to stable or increasing populations across much of Europe, local populations can face pressures from habitat loss, fragmentation, overabundance in predator-free systems, and anthropogenic disturbance. In floodplain ecosystems like Kopački Rit, hydrological alterations and human activities further modulate their ecological impact. The species provides versatile ecosystem functions beyond grazing. It has adapted to various habitats and inhabits forests as well as flood areas. Although its primary habitats are steppes and open deciduous forests, wetlands can also be suitable due to their rich and diverse food sources [17,18]. Fløjgaard et al. [19] reported that red deer activities contribute to maintaining plant species richness in grasslands and mosaic vegetation structures. However, in the absence of apex predators, the increasing herbivore population, especially in winter, can create high pressure on trees, to the extent of preventing their regeneration in some areas [20]. Their selective foraging on some tree species and avoidance of herbaceous plants can cause shifts in plant composition and affect plant community type conversion in floodplains [21].
The loss of the wolf as a predator in Kopački Rit, due to extensive hunting and habitat loss, has allowed the development of a larger red deer population. As mentioned before, their increase in numbers can have a significant ecological impact on the habitat and ultimately on the biodiversity of the area. Therefore, wildlife management is needed. Knowing red deer spatial distribution, activity, and ecological preferences would help us achieve better population management and provide a basis for sustainable development or area conservation [22].
Therefore, effective monitoring and informed management of red deer populations are essential components of biodiversity conservation in floodplain ecosystems such as Kopački Rit. This study aims to demonstrate the applicability of bioacoustic monitoring for seasonal red deer distribution assessment in Kopački Rit Nature Park, with direct relevance to conservation management. Specifically, we address the following questions:
- What is the spatial occupancy pattern of red deer during the rutting season, and how does it differ between the 2023 and 2024 rutting periods?
- To what extent do key habitat covariates (e.g., land cover, distance to water) explain this spatial distribution?
- What are the daily activity patterns of red deer, and how can they inform non-invasive monitoring protocols in protected floodplain ecosystems?
2. Materials and Methods
2.1. Study Area
The study area, Kopački Rit Nature Park, is situated in the northeastern part of Croatia, in a floodplain around the confluence of the Danube and Drava Rivers, between 45°32′ and 45°47′ northern latitude and 18°45′ and 18°59′ eastern longitude, with a surface area of about 231 km2 and an altitudinal range from 78 to 86 m a.s.l. (Figure 1). The climate is warm temperate and humid, with warm summers, classified as Cfb type [23]. Air temperatures range from −25.1 to 39.4 °C, with an average annual temperature of 11.0 °C, which is typical for the continental climate of the Pannonian region [24]. The annual average precipitation is 695.9 mm, with the majority occurring mainly from April to September [24,25].
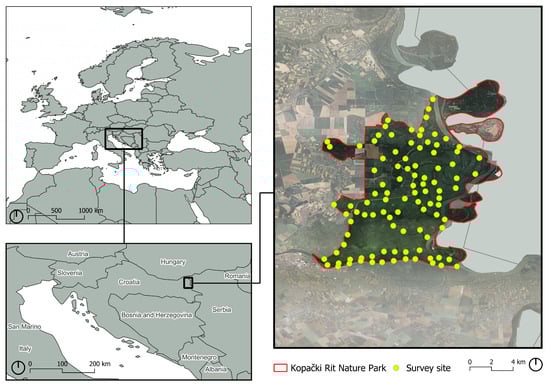
Figure 1.
Location of AudioMoth devices in Kopački Rit Nature Park.
The water regime is influenced by the Danube and Drava rivers. Floods can last between 64 and 249 days, and as the water recedes, various habitats are formed. These habitats include oligotrophic to mesotrophic standing waters, natural eutrophic lakes, alluvial meadows of river valleys, alluvial forests, and riparian mixed forests, which support diverse wildlife [26].
Kopački Rit has great biodiversity, consisting of many valuable, rare, and endangered species. Biodiversity exceeds 2000 different species, including animal species (birds, mammals, fish, amphibians, and reptiles) and around 572 species of vascular plants [25,27].
2.2. Bioacoustics Setup and Data Collection
Bioacoustic data were collected by deploying 100 AudioMoth (version 1.0.0) devices (Open Acoustic Devices, Southampton, UK), evenly distributed across Kopački Rit (Figure 1), during September–October 2023 and 2024. Deployment sites were separated by at least 300 m to ensure spatial independence and placed at a height of 2 m. All devices were placed in sealed plastic bags to protect them from weather conditions.
The 10-day deployment window was strategically aligned with the peak rutting period (September–October), when vocal activity of male red deer (Cervus elaphus) is most intense and detectable. While this design maximises detection reliability, it inherently limits inference to seasonal patterns rather than annual occupancy dynamics. Future studies should consider multi-season or year-round monitoring to capture full behavioural and ecological variability. The 300 m spacing between AudioMoth devices was chosen based on empirical studies on sound attenuation in dense floodplain vegetation (e.g., [28]), which indicate that signal propagation for low-frequency deer calls rarely exceeds 250–300 m under such conditions. These spacing aims to minimise spatial autocorrelation, though we acknowledge that complete independence cannot be guaranteed in highly heterogeneous terrain.
AudioMoth devices were configured using the Arbimon Companion App (v2.6.0; Rainforest Connection, available at https://play.google.com/store/apps/details?id=org.rfcx.companion&hl=bs, accessed 10 December 2024). They were set to record for 1 min every 5 min over 24 h, with a 48 kHz sample rate and medium-level gain. These settings produced 288 recordings per day, each file sized at 5760 kB. Each device was labelled with its identification number, altitude, latitude, and longitude of the placement location. The collected data were analysed using the ARBIMON (https://arbimon.rfcx.org/, accessed 10 December 2024) visualiser feature to examine audio spectrograms for red deer vocalisation calls. Identified template calls were labelled and stored on the platform for later analysis. Audio recordings were analysed across multiple temporal scales: (i) hourly activity patterns using the time-period relative abundance index (ITRA) [29], (ii) daily detection/non-detection histories for occupancy modelling, and (iii) interannual comparisons between the 2023 and 2024 rutting seasons. Note that data were not collected at weekly or monthly resolution, as deployments were restricted to a 10-day period each year to coincide with peak vocal activity. Additionally, a playlist of recordings was created on the platform for the days under study. The Pattern Matching (PM) feature on the Arbimon platform [30] enabled us to search the collected data for sound templates of the target species. In this way, we detected time-localised signals with correlation equal to or greater than a user-assigned threshold [31]. Subsequently, we validated the PM detections as presence or absence data using spectrogram images and audio to create a training set [32]. The created training set (Table 1) was used for automatic species recognition with the random forest model for the remainder of the audio data set.

Table 1.
Red deer (Cervus elaphus) model validation details for Random Forest Models.
The random forest model was trained on a manually verified dataset comprising 162 spectrogram clips (41 confirmed red deer calls and 121 negatives). Model performance was evaluated using 5-fold cross-validation, yielding an overall accuracy of 75.1% and precision of 75.6% (Table 1). All automated detections used in occupancy analysis were subsequently validated by two independent observers through visual and auditory inspection of spectrograms to minimise false positives.
2.3. Occupancy Model
The occupancy of red deer was modelled using single-species occupancy with observation and habitat covariates. Statistical analyses were performed in the R (v4.5.0) statistical programme [33] using the packages dplyr [34] for data manipulation, ggplot2 [35], ggspatial [36], viridis [37], terra [38], and raster [39] for visualisation in the R environment. For the analysis of occurrence and abundance, we used the unmarked package [40] in the R environment. To produce detection history, we summarised the acoustic data to a day-level temporal resolution of presence or absence for all research sites. The model was developed with covariates representing different habitats associated with the research sites [41]. Spatial distribution data were based on the summary of presence data per device during the research period. Occupancy and detection are considered to be influenced by environmental variables. For this study, deciduous forest, recovered land, wetland, and distance from water were used as the environmental variables influencing the coverage rate. The deciduous forest, recovered land, and wetland datasets were generated using the CORINE (CLC2018; v2020/07) land use layer [42]. The distance from water represents the shortest distance to a water source.
The time-period relative abundance index was used to calculate the ITRA value of red deer for each hour on research days according to [29]. Circular histograms were constructed based on the calculated values.
3. Results
AudioMoth devices generated a total of 332,302 recordings available for the analysis of red deer (Cervus elaphus) detection. The model used in the study had an accuracy and precision of 76%. This resulted in 28.44% presence and 71.56% absence detection, with an average detection of 65 ± 7 SD per day. Occupancy models were fitted separately for each year to compare spatial occupancy between the 2023 and 2024 rutting seasons. Results are shown in Table 2. Research into environmental factors influencing red deer occupancy and detection in 2023 showed no significant influence. Based on the vocal analysis, deciduous forests, recovered land, and wetlands have a negative correlation, indicating a low presence of red deer in these habitats.
Table 2.
Occupancy model results for estimating the occurrence of red deer (Cervus elaphus) in Kopački Rit. The model predictors are deciduous forest, recovered land, wetland, and distance from water.
Deciduous forest showed a relatively strong negative effect (−2.263) compared to recovered land and wetland (−0.938 and −1.125). A non-significant positive correlation was observed for distance from water (p = 0.304), suggesting that red deer may prefer habitats further from open water. In 2024, similar negative values were recorded for deciduous forest, recovered land, and wetland (−0.786, −0.520, −0.480), while distance from water remained positively associated with occupancy (0.155). Detection probability was negatively correlated with all covariates, although only the effect of distance from water was non-significant in 2024.
Spatial distribution in 2023 and 2024 is shown in Figure 2. The maximum number of detections in 2023 was observed in the south-western part (n = 1372) and central part (n = 1086) of the park area. Fewer than 40 detections were also observed in one southern area. In 2024, the overall pattern remained similar to the previous year. The detection intensity at sites in the south-western and central parts was reduced by approximately 50% (n ≈ 600), and spatial distribution appeared more evenly spread across additional stations.
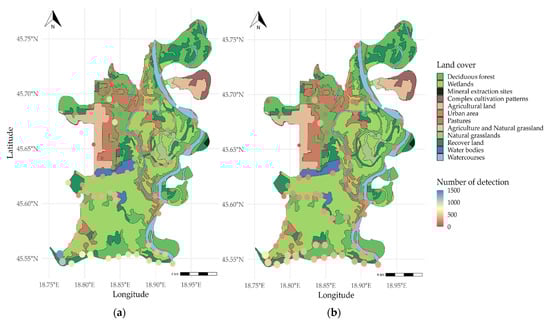
Figure 2.
Spatial distribution of red deer (Cervus elaphus) in different years: (a) 2023; (b) 2024—land cover types (derived from [42]) are shown as a semi-transparent basemap to contextualise detection locations (which are marked on the map as circles).
Occupancy probability results for 2023 showed the highest values in the central and eastern parts of Kopački Rit, reaching a maximum of 0.999, while the southern section exhibited the lowest value of 0.586. In 2024, heterogeneity was observed across the surveyed area, with the highest occupancy at 0.960 and the lowest at 0.667. Occupancy probability results are shown in the next figure.
Acoustic data analysis of daily activity rhythms (Figure 3) showed that red deer are active between 6:00, 7:00 and 18:00 h, with a maximum ITRA value of 0.05. After 18:00 until 6:00, red deer activity decreased, with a minimal ITRA value of 0.01. Reduced activity was also observed from 10:00 to 12:00.
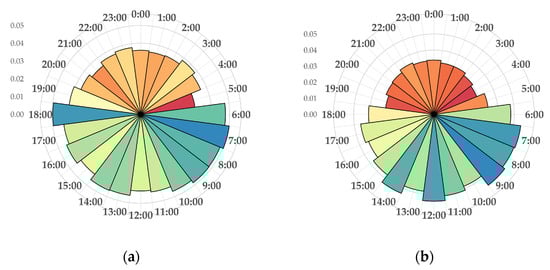
Figure 3.
Daily activity rhythms of red deer (Cervus elaphus) in different years: (a) 2023; (b) 2024. The vertical coordinates are ITRA values (which are indicated on the diagram by grey background circles).
4. Discussion
European red deer (Cervus elaphus), as a typical forest animal, can serve as a suitable model species due to its crucial role in the functioning of the forest ecosystem. These ungulates directly influence forest dynamics and plant communities through their browsing activities [43]. According to available data [26,44], the current population of red deer is around 1400 and is considered stable. Ionesco et al. [45] reported a 95.7% increase in the hunting of red deer in Croatia from 2012 to 2022. Based on this, monitoring of this species is necessary.
Our study addressed three specific research questions: (1) the spatial occupancy pattern of red deer during the rutting season and its differences between 2023 and 2024; (2) the influence of key habitat covariates on this distribution; and (3) the daily activity rhythms and their ecological implications. In response to the first question, we observed a clear shift in spatial occupancy between 2023 and 2024, from localised hotspots in the southwestern and central parts of the park to a more spatially heterogeneous distribution in 2024. This difference in spatial occupancy between 2023 and 2024 likely reflects adaptive behavioural responses to differing ecological conditions, particularly hydrological dynamics, which strongly shape floodplain habitats such as Kopački Rit. Given that data were collected during only two consecutive rutting seasons, our findings should be interpreted as a descriptive comparison between years, rather than evidence of a long-term interannual trend.
Regarding the second question, none of the tested covariates (deciduous forest, recovered land, wetland, and distance from water) showed statistically significant effects on red deer occupancy in either year. This limited explanatory power may stem not from ecological irrelevance, but from unmeasured or poorly resolved environmental drivers. For instance, fine-scale variations in flood depth, soil moisture, understory density, or human disturbance (e.g., demining operations in the southern sector) were not captured by our CORINE-based land cover variables. Moreover, detection probability itself was likely influenced by acoustic masking due to dense vegetation [46] and ambient noise (wind, water flow, bird choruses) [28,32,47], which can decouple acoustic presence from true occupancy—especially in wetland and recovered land habitats.
This leads us to methodological reflections directly relevant to interpretation. Our monitoring was confined to a 10-day window during the rutting season (September–October) in each year. While this timing maximises vocal detectability during peak calling activity, it inherently limits inference to seasonal (not annual) patterns. Consequently, the comparison between 2023 and 2024 should be viewed as a preliminary indication of interannual variability, not a robust trend. Furthermore, although our AudioMoth devices were spaced 300 m apart, consistent with empirical estimates of sound attenuation in dense floodplain vegetation [28], complete spatial independence cannot be guaranteed, and detection heterogeneity remains a key source of uncertainty.
For the third research question, a bimodal daily activity pattern was confirmed, with acoustic peaks in the morning (06:00–08:00) and evening (18:00–19:00), consistent with established red deer behaviour [48] and observations in related species [29]. However, the reduced dusk activity in 2024 suggests sensitivity to environmental or anthropogenic context, as seen in protected areas with minimal human interference [49]. Habitat composition likely modulates this rhythm by altering the trade-off between foraging and cover [50], especially in the heterogeneous mosaic of Kopački rit.
When comparing different habitats (farmland, forest, and wetland), Månsson et al. [51] emphasise the importance of wetlands, which provide food and shelter for red deer. Furthermore, red deer are considered an open plains/forest edge species that actively forage in the plains at night while spending the day in forests [50,52]. Accordingly, red deer choose areas closer to the forest edge while using coniferous or deciduous forests to minimise the distance between food and shelter [53]. Our findings indicate that red deer in Kopački Rit use different habitats relatively evenly, which aligns with the resource richness and habitat heterogeneity within the park. Negative values for occupancy and detection in deciduous forests, recovered land, and wetlands could be observed due to vegetation structures that may affect signal propagation [46]. In addition, we found that distance from water influences occupancy. Red deer tend to stay in areas further from open water sources. In floodplains such as Kopački Rit, regular flooding enriches the soil with nutrients and enables rapid vegetation growth, providing abundant food resources for red deer [17]. When floods become more frequent and extreme, red deer can retreat further inland to higher ground, where willow and poplar forests are ideal for brushwood and bark.
In 2023, wetland and water distance had a statistically significant negative effect on detection (−0.186 and −0.200). Nevertheless, Ugarković et al. [54] stated that wetlands, especially microdepressions within them, are favourable for red deer because they provide shelter and forage. However, flooding alters site ecology and affects red deer behaviour by changing their rhythm and behavioural patterns, causing frequent migrations during flood periods [55]. Additionally, habitat conditions and background noise can affect acoustic signal propagation, making devices less effective [28]. Aide et al. [32] emphasise that intense background noise, either from other species or weather conditions, could result in misidentification and false recognition. Dense vegetation also weakens acoustic signal propagation. Results in 2024 showed a weaker and non-significant effect on detection. Changes in soundscape dynamics, environmental conditions, or overall lower vocal activity affected results similarly to the previous year. Recovered land had a near-significant effect on detection, which may be due to differences in vegetation structure in these transitioning habitats that affect sound propagation. This finding aligns with research in acoustic ecology; Francis et al. [47] stated that such environments often lower detectability for terrestrial mammals due to both biotic and abiotic noise interference.
The spatial distribution showed temporal variability in red deer activity in wetland habitats. Our spatial occupancy probability results could provide insight into the distribution of red deer in Kopački Rit Nature Park. We can predict their seasonal migrations with different covariates (e.g., ecological and environmental) that can influence their spatial behaviour [56]. The results of detections in 2023 indicate a higher concentration in the southern and southwestern parts of the study area. This could reflect a preferred habitat of red deer based on vegetation structure, seasonal resource availability, or disturbance avoidance. In the following year, a more homogeneous distribution of detections was observed, suggesting a broader spatial use of the research area. The shift from localised hotspots in 2023 to a wider distribution in 2024 may be interpreted as adaptive behavioural responses to habitat conditions. This is in line with Rech et al. [57], who found that large grazers exhibit flexible space use strategies in heterogeneous floodplain ecosystems. Their habitat preferences shift seasonally in response to ecological conditions. However, it should be noted that large grazers also have an impact on nature’s evolution and dynamics [58].
Donovan et al. [59] researched the occupancy model and showed its tremendous flexibility in estimating species abundance and distribution patterns. Occupancy modelling and the probability of site occupancy are influenced not only by habitat availability but also by habitat selection. Occupancy probability of red deer in Nature Park Kopački Rit (Figure 4) ranges from 0.586 to 0.999. In 2023, occupancy was strongly concentrated in the central and eastern areas. However, occupancy became more heterogeneous in 2024, with high-probability patches spread across a wider portion of the researched landscape. The persistence of low occupancy in the southern floodplain across both years may be due to human activities such as forest management and demining operations carried out during this period. Nevertheless, these results showed year-to-year differences in occupancy probability, which demonstrates flexible spatial use of the floodplain landscape. These spatial shifts likely reflect the response of red deer to annual ecological variability. Hydrological conditions, vegetation dynamics, and availability of foraging habitats may have influenced the differences between years. This is in line with Van Moorter et al. [60], who demonstrated that the spatiotemporal scales of moose (Alces alces) movements correspond with resource availability. Alves et al. [53] showed that red deer select their habitat based on water, ecotone, and topographic characteristics. Furthermore, they concluded that continuous forest fragmented into smaller patches bordered by open areas is favourable due to its high availability of quality food. The size of scale heterogeneity affects red deer movement [61]. It is important to note that red deer as a species have a wide home range, which can be approximately 3600 ha for males and 840 ha for females [49,62]. Overall, our results showed that the occupancy model is a viable approach for studying red deer distribution and habitat use, even in complex landscapes such as floodplain forests.
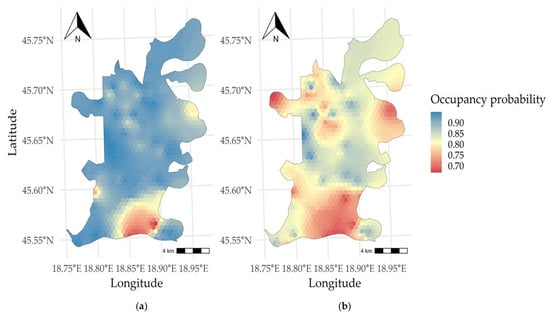
Figure 4.
Predicted occupancy probability of red deer (Cervus elaphus) in different years: (a) 2023; (b) 2024.
5. Conclusions
This study demonstrates that passive acoustic monitoring can effectively capture the spatiotemporal dynamics of red deer (Cervus elaphus) during the rutting season in complex floodplain ecosystems such as Kopački Rit. As the first application of this approach to red deer in Croatia, it provides a methodological foundation for non-invasive, large-scale wildlife monitoring in challenging wetland environments. However, the limited temporal scope, restricted to two 10-day periods, underscores the need for multi-year and multi-seasonal deployments to robustly assess ecological trends. Integrating acoustic sensors with environmental monitoring (e.g., water level, noise, vegetation) would further enhance detection reliability and ecological inference. We recommend the adoption of bioacoustic systems into the park’s routine surveillance framework, enabling adaptive management of red deer populations in response to hydrological change and human pressures.
Author Contributions
Conceptualization, D.D., I.P. and I.M.; methodology, D.D. and I.P.; validation, D.D., S.O., V.R., I.M., D.R. and T.F.; formal analysis, D.D. and I.P.; investigation, D.D., S.O., T.F., A.S., H.E. and I.M.; resources, S.O., V.R. and I.M.; data curation, D.D., I.P. and D.R.; writing—original draft preparation, D.D. and I.P.; writing—review and editing, D.D., S.O., I.M., A.S., V.R. and I.P.; visualisation, D.D.; supervision, I.M. and I.P.; funding acquisition, I.M. All authors have read and agreed to the published version of the manuscript.
Funding
This research was supported by the Tech4All programme—Nature Guardian, under project “Wetland and wildlife monitoring using technology and acoustics”.
Data Availability Statement
The data obtained in the survey can be retrieved from the corresponding author upon reasonable request.
Acknowledgments
We would like to express our gratitude to the RFCx and WildMon teams for their continuous support and dedicated data management, and to the Nature Park Kopački Rit team (Marin Škoro, Marija Vereš, and Kristina Romanjek) for their committed work in the deployment of devices, all of which greatly contributed to the success of this study.
Conflicts of Interest
The authors declare no conflicts of interest.
Abbreviations
The following abbreviations are used in this manuscript:
| PAM | Passive acoustic device |
| PM | Pattern matching |
| ITRA | Time-period relative abundance index |
References
- Green, S.; Marler, P. The Analysis of Animal Communication. In Social Behavior and Communication; Springer Science: New York, NY, USA, 1979; pp. 73–158. ISBN 978-1-4615-9118-4. [Google Scholar]
- Frommolt, K.-H.; Bardeli, R.; Clausen, M. Computational Bioacoustics for Assessing Biodiversity; BfN-Skripten; Bundesamt für Naturschutz (BfN)—Federal Agency for Nature Conservation: Bonn, Germany, 2008. [Google Scholar]
- Penar, W.; Magiera, A.; Klocek, C. Applications of Bioacoustics in Animal Ecology. Ecol. Complex. 2020, 43, 100847. [Google Scholar] [CrossRef]
- Paterson, J.E.; Bortolotti, L.E.; Kowal, P.D.; Pidwerbesky, A.J.; James, H. Devries Predicting the Effects of Land Cover Change on Biodiversity in Prairie Canada Using Species Distribution Models. Biol. Conserv. 2024, 298, 110754. [Google Scholar] [CrossRef]
- Obrist, M.K.; Pavan, G.; Sueur, J.; Riede, K.; Llusia, D.; Márquez, R. Bioacoustics Approaches in Biodiversity Inventories. In Manual on Field Recording Techniques and Protocols for All Taxa Biodiversity Inventories and Monitoring; Abc Taxa: Brussels, Belgium, 2010; Volume 8, pp. 68–99. [Google Scholar]
- Jaureguiberry, P.; Titeux, N.; Wiemers, M.; Bowler, D.E.; Coscieme, L.; Golden, A.S.; Guerra, C.A.; Jacob, U.; Takahashi, Y.; Settele, J.; et al. The Direct Drivers of Recent Global Anthropogenic Biodiversity Loss. Sci. Adv. 2022, 8, eabm9982. [Google Scholar] [CrossRef]
- Odom, K.J.; Araya-Salas, M.; Morano, J.L.; Ligon, R.A.; Leighton, G.M.; Taff, C.C.; Dalziell, A.H.; Billings, A.C.; Germain, R.R.; Pardo, M.; et al. Comparative Bioacoustics: A Roadmapfor Quantifying and Comparing Animalsounds across Diverse Taxa. Biol. Rev. 2021, 96, 1135–1159. [Google Scholar] [CrossRef]
- Kershenbaum, A.; Akçay, Ç.; Babu-Saheer, L.; Barnhill, A.; Best, P.; Cauzinille, J.; Clink, D.; Dassow, A.; Dufourq, E.; Growcott, J.; et al. Automatic Detection for Bioacoustic Research: A Practical Guide from and for Biologists and Computer Scientists. Biol. Rev. 2025, 100, 620–646. [Google Scholar] [CrossRef] [PubMed]
- Desjonquères, C.; Villén-Pérez, S.; De Marco, P.; Márquez, R.; Beltrán, J.F.; Llusia, D. Acoustic Species Distribution Models (aSDMs): A Framework to Forecast Shifts in Calling Behaviour under Climate Change. Methods Ecol. Evol. 2022, 13, 2275–2288. [Google Scholar] [CrossRef]
- Rappaport, D.I.; Royle, J.A.; Morton, D.C. Acoustic Space Occupancy: Combining Ecoacoustics and Lidar to Model Biodiversity Variation and Detection Bias across Heterogeneous Landscapes. Ecol. Indic. 2020, 113, 106172. [Google Scholar] [CrossRef]
- Sueur, J.; Farina, A. Ecoacoustics: The Ecological Investigation and Interpretation of Environmental Sound. Biosemiotics 2015, 8, 493–502. [Google Scholar] [CrossRef]
- Ross, S.R.P.-J.; O’Connell, D.P.; Deichmann, J.L.; Desjonquères, C.; Gasc, A.; Phillips, J.N.; Sethi, S.S.; Wood, C.M.; Burivalova, Z. Passive Acoustic Monitoring Provides a Fresh Perspective on Fundamental Ecological Questions. Funct. Ecol. 2023, 37, 959–975. [Google Scholar] [CrossRef]
- Szymański, P.; Olszowiak, K.; Wheeldon, A.; Budka, M.; Osiejuk, T.S. Passive Acoustic Monitoring Gives New Insight into Year-Round Duetting Behaviour of a Tropical Songbird. Ecol. Indic. 2021, 122, 107271. [Google Scholar] [CrossRef]
- Mihaljević, M.; Getz, D.; Tadić, Z.; Živanović, B.; Gucunski, D.; Topić, J.; Kalinović, I.; Mikuska, J. Kopački Rit: Pregled Izstraživanja i Bibliografija; Biblioteka Slavonije i Baranje; Hrvatska akademija znanosti i umjetnosti: Osijek, Croatia, 1999; ISBN 978-953-154-343-9. [Google Scholar]
- Ramsar. Information Sheet on Ramsar Wetlands—Nature Park Kopacki Rit; Ramsar Convention Secretariat: Gland, Switzerland, 2007. [Google Scholar]
- Reby, D.; McComb, K. Vocal Communication and Reproduction in Deer. In Advances in the Study of Behavior; Elsevier: Amsterdam, The Netherlands, 2003; Volume 33, pp. 231–264. ISBN 978-0-12-004533-4. [Google Scholar]
- Vratarić, P.; Grubešić, M.; Krapinec, K.; Getz, D. Hunting management in floodplain forests. In Floodplain Forests in Croatia, 1st ed.; Vukelić, U.J., Ed.; Akademija šumarskih znanosti: Zagreb, Croatia, 2005; Volume 1, pp. 352–376. [Google Scholar]
- Kuijper, D.P.J.; Cromsigt, J.P.G.M.; Churski, M.; Adam, B.; Jędrzejewska, B.; Jędrzejewski, W. Do Ungulates Preferentially Feed in Forest Gaps in European Temperate Forest? For. Ecol. Manag. 2009, 258, 1528–1535. [Google Scholar] [CrossRef]
- Fløjgaard, C.; Barba, M.D.; Taberlet, P.; Ejrnæs, R. Body Condition, Diet and Ecosystem Function of Red Deer (Cervus elaphus) in a Fenced Nature Reserve. Glob. Ecol. Conserv. 2017, 11, 312–323. [Google Scholar] [CrossRef]
- Machar, I.; Cermak, P.; Pechanec, V. Ungulate Browsing Limits Bird Diversity of the Central European Hardwood Floodplain Forests. Forests 2018, 9, 373. [Google Scholar] [CrossRef]
- Kellogg, C.H.; Bridgham, S.D. Disturbance, Herbivory, and Propagule Dispersal Control Dominance of an Invasive Grass. Biol. Invasions 2004, 6, 319–329. [Google Scholar] [CrossRef]
- Apollonio, M.; Belkin, V.V.; Borkowski, J.; Borodin, O.I.; Borowik, T.; Cagnacci, F.; Danilkin, A.A.; Danilov, P.I.; Faybich, A.; Ferretti, F.; et al. Challenges and Science-Based Implications for Modern Management and Conservation of European Ungulate Populations. Mamm. Res. 2017, 62, 209–217. [Google Scholar] [CrossRef]
- Šegota, T.; Filipčić, A. Köppenova Podjela Klime i Hrvatsko Nazivlje. Geoadria 2003, 8, 17–37. [Google Scholar] [CrossRef]
- Cvitan, L. Početne Naznake O Prostornoj Raznolikosti Klime Šireg Područja Parka Prirode Kopački Rit. Hrvat. Meteorološki Časopis 2014, 48/49, 63–91. [Google Scholar]
- Tadic, L.; Bonacci, O.; Dadic, T. Dynamics of the Kopački Rit (Croatia) Wetland Floodplain Water Regime. Environ. Earth Sci. 2014, 71, 3559–3570. [Google Scholar] [CrossRef]
- Benčina, L.; Rožac, V.; Bolšec, B. Plan Upravljanja Parkom Prirode Kopački Rit; Kopački rit Park prirode Nature Park: Kopačevo, Croatia, 2010. [Google Scholar]
- Ozimec, S.; Deže, D. Effects of Climate Change on the Habitat Diversity in Kopački Rit Nature Park (Croatia). In Proceedings of the Role and Status of Modern Agriculture in Climate Change; Faculty of Agrobiotechnical Sciences Osijek: Osijek, Croatia, 2023; p. 45. [Google Scholar]
- Entling, M.H.; Ehlers, P.T.; Edo, M.; Rösch, V. Influence of Distance, Frequency, Habitat and Angle of Incidence on Sound Levels in Passive Acoustic Monitoring with AudioMoth Recorders. Ann. Appl. Biol. 2025, 1, aab.70042. [Google Scholar] [CrossRef]
- Liu, Y.; Huang, K.; Wang, X.; Krzton, A.; Xia, W.; Li, D. Research on Space Occupancy, Activity Rhythm and Sexual Segregation of White-Lipped Deer (Cervus albirostris) in Forest Habitats of Jiacha Gorge on Yarlung Zangbo River Basin Based on Infrared Camera Technology. Biology 2023, 12, 815. [Google Scholar] [CrossRef]
- AI Empowered Biodiversity Research & Conservation Action. Available online: https://arbimon.org/ (accessed on 10 April 2025).
- LeBien, J.; Zhong, M.; Campos-Cerqueira, M.; Velev, J.P.; Dodhia, R.; Ferres, J.L.; Aide, T.M. A Pipeline for Identification of Bird and Frog Species in Tropical Soundscape Recordings Using a Convolutional Neural Network. Ecol. Inform. 2020, 59, 101113. [Google Scholar] [CrossRef]
- Aide, T.M.; Corrada-Bravo, C.; Campos-Cerqueira, M.; Milan, C.; Vega, G.; Alvarez, R. Real-Time Bioacoustics Monitoring and Automated Species Identification. PeerJ 2013, 1, e103. [Google Scholar] [CrossRef] [PubMed]
- R Core Team. A Language and Environment for Statistical Computing 2025. Open J. Soil Sci. 2025, 15, 4. [Google Scholar]
- Wickham, H.; François, R.; Henry, L.; Müller, K.; Vaughan, D. dplyr: A Grammar of Data Manipulation. R Package Version 1.1.4. 2024. Available online: https://dplyr.tidyverse.org/ (accessed on 21 April 2024).
- Wickham, H. Ggplot2: Elegant Graphics for Data Analysis, 2nd ed.; Springer International Publishing: Cham, Switzerland, 2016; ISBN 978-3-319-24277-4. [Google Scholar]
- Dunnington, D. Ggspatial: Spatial Data Framework for Ggplot2, 1.1.10; R Core Team: Vienna, Austria, 2017. [Google Scholar]
- Garnier, S.; Ross, N.; Rudis, B.; Sciaini, M.; Camargo, A.P.; Scherer, C. Viridis: Colorblind-Friendly Color Maps for R, version 0.6.5; R Core Team: Vienna, Austria, 2024. [Google Scholar]
- Hijmans, R.J.; Bivand, R.; Chirico, M.; Cordano, E.; Dyba, K.; Pebesma, E.; Sumner, M.D. terra: Spatial Data Analysis. R Package Version 2.3-21. Available online: https://rspatial.r-universe.dev/terra (accessed on 24 April 2024).
- Robert, J. Hijmans Raster: Geographic Data Analysis and Modeling. Available online: https://rspatial.org/raster (accessed on 28 March 2025).
- Fiske, I.; Chandler, R. Unmarked: An R Package for Fitting Hierarchical Models of Wildlife Occurrence and Abundance. J. Stat. Softw. 2011, 43, 1–23. [Google Scholar] [CrossRef]
- Donini, V.; Pedrotti, L.; Ferretti, F.; Iacona, E.; Lorenzetti, L.; Cozzi, F.; Corlatti, L. Spatial and Temporal Relationships Between Roe and Red Deer (Cervus elaphus) in an Alpine Area. Ecol. Evol. 2025, 15, e70777. [Google Scholar] [CrossRef] [PubMed]
- The Copernicus Land Monitoring Service. Available online: https://land.copernicus.eu/en (accessed on 12 April 2025).
- Pellerin, M.; Saïd, S.; Richard, E.; Hamann, J.-L.; Dubois-Coli, C.; Hum, P. Impact of Deer on Temperate Forest Vegetation and Woody Debris as Protection of Forest Regeneration against Browsing. For. Ecol. Manag. 2010, 260, 429–437. [Google Scholar] [CrossRef]
- Florijančić, T.; Bošković, I.; Ozimec, S.; Lužaić, R.; Prlić, D.; Tucak, K. Program Zaštite Divljači Za Posebni Zoološki Rezervat “Kopački Rit” za Razdoblje 1. Travnja 2019.–31. Ožujka 2029; Javna ustanova Park prirode Kopački rit: Kopačevo, Croatia, 2019. [Google Scholar]
- Ionescu, O.; Hardalau, D.; Bakševičius, M.; Manton, M.; Popovici, D.-C.; Codrean, C.; Ionescu, G.; Iordache, D. Tracking Population Trends: Insights from Deer Hunting Harvests in the Baltics, Central, and Eastern Europe. Cent. Eur. For. J. 2025, 71, 83–96. [Google Scholar] [CrossRef]
- Boycott, T.J.; Gao, J.; Megan, D. Gall Deer Browsing Alters Sound Propagation in Temperate Deciduous Forests. PLoS ONE 2019, 14, e0211569. [Google Scholar] [CrossRef]
- Francis, C.D.; Phillips, J.N.; Barber, J.R. Background Acoustics in Terrestrial Ecology. Annu. Rev. Ecol. Evol. Syst. 2023, 54, 351–373. [Google Scholar] [CrossRef]
- Reimoser, S. Influence of Anthropogenic Disturbances on Activity, Behavior and Heart Rate of Roe Deer (Capreolus capreolus) and Red Deer (Cervus elaphus), in Context of Their Daily and Yearly Patterns. In Deer: Habitat, Behavior and Conservation; Nova Publishers: Hauppauge, NY, USA, 2014. [Google Scholar]
- Kamler, J.F.; Jędrzejewska, B.; Jędrzejewski, W. Activity Patterns of Red Deer (Cervus elaphus) in Białowieża National Park, Poland. J. Mammal. 2007, 88, 508–514. [Google Scholar] [CrossRef]
- Godvik, I.M.; Loe, L.E.; Vik, J.O.; Veiberg, V.; Langvatn, R.; Mysterud, A. Temporal Scales, Trade-Offs, and Functional Responses in Red Deer (Cervus elaphus) Habitat Selection. Ecology 2009, 90, 699–710. [Google Scholar] [CrossRef]
- Månsson, J.; Nilsson, L.; Felton, A.M.; Jarnemo, A. Habitat and Crop Selection by Red Deer (Cervus elaphus) in Two Different Landscape Types. Agric. Ecosyst. Environ. 2021, 318, 107483. [Google Scholar] [CrossRef]
- Corbet, G.B.; Ovenden, D. The Mammals of Britain and Europe; Collins: London, UK, 1980; ISBN 978-0-00-219772-4. [Google Scholar]
- Alves, J.; Alves Da Silva, A.; Soares, A.M.V.M.; Fonseca, C. Spatial and Temporal Habitat Use and Selection by Red Deer (Cervus elaphus): The Use of Direct and Indirect Methods. Mamm. Biol. 2014, 79, 338–348. [Google Scholar] [CrossRef]
- Ugarković, D.; Šprem, N.; Kelava Ugarković, N.; Oršanić, M. Flooding as a Cause of Ungulate Mortality in Floodplain Forests in Croatia. J. For. Res. 2020, 31, 1045–1052. [Google Scholar] [CrossRef]
- Jones, P.D.; Strickland, B.K.; Demarais, S.; McKinley, W.T.; Ernst, J.R.; Jessica, K. Seasonal Flooding Effects on Deer in the Mississippi River Batture. J. Wildl. Manag. 2019, 83, 1117–1130. [Google Scholar] [CrossRef]
- Fontana, R.; Calabrese, L.; Lanzi, A.; Armaroli, E.; Pelliccioni, E.R. Spatial Behavior of Red Deer (Cervus elaphus) in Northern Apennines: Are We Managing Them Correctly? Anim. Biotelemetry 2022, 10, 30. [Google Scholar] [CrossRef]
- Rech, B.J.; Buitenwerf, R.; Ruggiero, R.; Trepel, J.; Waltert, M.; Svenning, J.-C. What Moves Large Grazers? Habitat Preferences and Complementing Niches of Large Herbivores in a Danish Trophic Rewilding Area. Environ. Manag. 2025, 75, 1665–1679. [Google Scholar] [CrossRef]
- Boone, R.B. Weather and Climate Impacts on Browsing and Grazing Ungulates. In The Ecology of Browsing and Grazing II; Gordon, I.J., Prins, H.H.T., Eds.; Springer International Publishing: Cham, Switzerland, 2019; Volume 239, pp. 197–213. ISBN 978-3-030-25864-1. [Google Scholar]
- Donovan, T.; Hines, J.; MacKenzie, D. Occupancytuts: Occupancy Modelling Tutorials with RPresence. Methods Ecol. Evol. 2024, 15, 477–483. [Google Scholar] [CrossRef]
- Van Moorter, B.; Bunnefeld, N.; Panzacchi, M.; Rolandsen, C.M.; Solberg, E.J.; Sæther, B. Understanding Scales of Movement: Animals Ride Waves and Ripples of Environmental Change. J. Anim. Ecol. 2013, 82, 770–780. [Google Scholar] [CrossRef] [PubMed]
- Martin, J.; Tolon, V.; Morellet, N.; Santin-Janin, H.; Licoppe, A.; Fischer, C.; Bombois, J.; Patthey, P.; Pesenti, E.; Chenesseau, D.; et al. Common Drivers of Seasonal Movements on the Migration—Residency Behavior Continuum in a Large Herbivore. Sci. Rep. 2018, 8, 7631. [Google Scholar] [CrossRef] [PubMed]
- Jarnemo, A.; Nilsson, L.; Wikenros, C. Home Range Sizes of Red Deer (Cervus elaphus) in Relation to Habitat Composition: A Review and Implications for Management in Sweden. Eur. J. Wildl. Res. 2023, 69, 92. [Google Scholar] [CrossRef]
Disclaimer/Publisher’s Note: The statements, opinions and data contained in all publications are solely those of the individual author(s) and contributor(s) and not of MDPI and/or the editor(s). MDPI and/or the editor(s) disclaim responsibility for any injury to people or property resulting from any ideas, methods, instructions or products referred to in the content. |
© 2025 by the authors. Licensee MDPI, Basel, Switzerland. This article is an open access article distributed under the terms and conditions of the Creative Commons Attribution (CC BY) license (https://creativecommons.org/licenses/by/4.0/).