Abstract
Unraveling large-scale species richness patterns and drivers is central to ecology. While climate, soil, topography, and human activities are widely recognized as key drivers, their relative contributions to Pinus L. diversity (especially in Europe) remain inconclusive due to scale dependence and methodological variations. This study integrates distribution data for 17 European Pinus species along with climatic, soil, topographic, and anthropogenic variables and employs Random Forest and Structural Equation Modeling to analyze spatial patterns of overall, wide-ranged, and narrow-ranged species richness, quantifying factor importance and driving pathways. Additionally, diversity hotspots were identified using the complementarity algorithm and top 5% richness methods. Results indicate higher species richness in topographically complex western Europe. Climatic seasonality emerges as the primary direct driver of overall and wide-ranged species richness. Human activities exert strong positive direct effects on all species groups and produce substantial indirect effects by altering the environment, with a relatively prominent influence on narrow-ranged species richness patterns. Although existing European Pinus hotspots are generally well-protected, conservation gaps in southwestern Europe necessitate targeted strategies. This study elucidates the regulatory mechanisms of Pinus species richness patterns across different distribution ranges, highlighting the need for differentiated conservation under ongoing climate change and anthropogenic pressures.
1. Introduction
Identifying the spatial distribution patterns of large-scale species richness and their driving mechanisms is one of the core issues in ecology and biogeography [1]. Multiple hypotheses have been proposed to explain the formation of species richness spatial patterns. Among these, climate-related hypotheses (e.g., the energy hypothesis, water–energy dynamic hypothesis, climatic seasonality hypothesis, and climatic stability hypothesis) are recognized as key theories for elucidating large-scale species richness patterns [2,3,4,5,6,7,8]. Additionally, several theoretical hypotheses centered on factors including habitat heterogeneity [9,10,11,12,13,14], soil properties [15], and human activities [16,17,18,19] have also attracted substantial attention. Existing research indicates that species richness patterns are typically driven by multiple factors, including climate, soil, topography, and human activities [20,21,22,23,24,25], with the relative influence of these factors varying with the geographical range of the species [20,23,26,27,28]. Therefore, when investigating the distribution patterns of species richness and their influencing mechanisms, it is critical to comprehensively consider the interrelationships between these factors and species richness.
Pinus L., comprising 113 species, is the largest coniferous genus in the Northern Hemisphere and the most widely distributed tree genus [29,30]. It forms a key component of vegetation across most regions of the Northern Hemisphere and plays a critical role in regulating both regional and global climates [30]. Studies indicate that Pinus has a deep evolutionary history, with 90% of its extant species originating in the Miocene epoch [31]. The diversity centers of Pinus species are primarily located in the mid-to-low latitudes of North America, Europe, and East Asia [30,31,32]. Notably, Pinus is an important component of the European tree flora and plays a crucial role in the evolution of vegetation dynamics [30]. Hence, Europe serves as an ideal region for investigating the distribution patterns of Pinus species richness and their underlying drivers.
Previous studies have primarily analyzed the spatial distribution patterns of Pinus species richness at both global and regional scales [20,31,32]. While global studies on Pinus [31,32] have elucidated broad biogeographic patterns and drivers, they lack insights into the region-specific mechanisms shaping Pinus richness in Europe. The study on Pinus in China [20] identified historical climate change as the dominant driver of overall species richness. However, Europe possesses a unique ecological context characterized by distinct west–east topographic complexity (mountains versus plains) and long-term anthropogenic disturbances, which remain underexplored. Additionally, generic tree richness studies in Europe [7,33] mostly focus on broad taxonomic groups and often overlook the lineage-specific responses of Pinus—an ecologically critical genus with prominent fire adaptation syndromes and niche conservatism [34].
The development of Random Forest (RF) and Structural Equation Modeling (SEM) offers more effective methods for addressing these challenges. RF, a powerful non-parametric machine learning algorithm, improves predictive accuracy by aggregating multiple decision trees [35]. This method can effectively handle nonlinear and complex relationships between variables while quantifying the relative importance of each predictor variable, thereby enhancing the model’s explanatory power [36,37,38]. SEM functions as a key tool for exploring multivariate causal relationships and has been widely applied in various ecological studies [39,40,41,42]. It can not only simultaneously handle complex relationships among multiple independent and dependent variables but also incorporate direct and indirect effects, clearly illustrating path associations between variables, thereby accurately revealing the inherent logic of driving mechanisms [43,44]. This approach is particularly applicable to analyzing the complex processes shaping Pinus species richness patterns.
Given the significant ecological functions and conservation value of Pinus species in Europe, this study compiled distribution data for 17 Pinus species and integrated multiple influencing factors, including climate, soil, topography, and human activities. By employing RF and SEM, we offer novel insights into the geographical distribution patterns of species richness and their underlying driving mechanisms. The specific objectives of this study are: (a) to reveal the geographical distribution characteristics of overall, wide-ranged, and narrow-ranged Pinus species richness, and compare their spatial distribution differences; (b) to quantify the relative importance of environmental and anthropogenic factors for the species richness patterns of the three Pinus groups, and clarify the strength and direction of driving pathways; and (c) to identify diversity hotspots of the three Pinus groups and evaluate the effectiveness of existing conservation measures. Our research results not only advance our understanding of the regulatory mechanisms underlying species richness patterns but also offer critical scientific support for developing conservation strategies to mitigate biodiversity loss amid global climate change.
2. Materials and Methods
2.1. Distributions of Pinus in Europe
We integrated distribution data for European Pinus species from the Chorological maps [45] and the EU-Forest dataset [46], with supplementary records from the Global Biodiversity Information Facility (GBIF, https://doi.org/10.15468/dl.bwc7mh, accessed on 7 May 2025) [47]. For the Chorological maps, we strictly excluded distribution records falling outside the natural range of each Pinus species to avoid non-native occurrences. After compiling data from all three sources, we applied a spatial thinning procedure at 5-km resolution—retaining only one occurrence record per species per 5-km grid cell—to reduce sampling bias, spatial autocorrelation, and overrepresentation of high-sampling areas (e.g., intensive plantation regions). Ultimately, this study retained a total of 353,854 occurrence records for 17 Pinus species (Table S1).
To mitigate the impact of area on the estimation of species richness and the ensuing statistical analysis, we converted the distribution data into 50 × 50 km grid cells, excluding those with a land area less than 1250 km2 [25]. In calculating species richness, we used the number of Pinus species present in each grid cell as the species richness value for that grid. A total of 3424 grid cells were included in subsequent analyses. To further explore the latitudinal pattern of Pinus species richness, we analyzed the Latitudinal Diversity Gradient (LDG)—a classic biogeographical pattern describing the change in species richness with latitude. We used the Locally Weighted Scatterplot Smoothing (LOWESS) method to fit the relationship between latitude and species richness. In addition, to evaluate spatial distribution differences in Pinus species richness across Europe, we divided grid cells containing Pinus species into 16 bioregions (One Earth, 2020, https://www.oneearth.org/bioregions/, accessed on 20 April 2025) and calculated species richness values for each regional grid cell (see Figure S1 for the spatial distribution map and bioregion names).
By counting the number of grid cells occupied by each species, we estimated the distribution range of each species and subsequently categorized all species into wide-ranged and narrow-ranged groups. Using the previous classification method [20,27,48,49], we first ranked all species in descending order based on their distribution range sizes. The top 25% of species (5 out of 17) were classified as wide-ranged species, with distribution ranges spanning 553–3189 grid cells. The bottom 50% of species (9 out of 17) were classified as narrow-ranged species, with distribution ranges of 41–355 grid cells. Notably, the remaining 3 species fell into the intermediate species category, with distribution ranges of 385–451 grid cells. Due to the lack of distinct ecological traits or distribution patterns that would support an independent analytical group, and to maximize the ecological contrast in driver analyses, the intermediate species were only included in the ‘overall species richness’ analysis and excluded from group-level (wide-ranged vs. narrow-ranged) comparisons. The distribution records for wide-ranged and narrow-ranged species accounted for 91.73% and 2.09% of the total dataset, respectively. Detailed classification results for each species are presented in Supplementary Table S1.
2.2. Environmental and Anthropogenic Variables
To comprehensively explore how environmental factors and human activities influence the species richness pattern of European Pinus, this study selected climate, soil, topography, and human activities as four variable categories, encompassing 37 factors for analysis. These predictive factors represented hypotheses related to contemporary climate, historical climate change, soil characteristics, habitat heterogeneity, and human activities (Table S2). Variables related to contemporary climate were classified into three groups: environmental energy, water availability, and climatic seasonality. All climate data were sourced from the CHELSA database (https://chelsa-climate.org/) and the Consultative Group for International Agricultural Research (CGIAR, http://www.cgiar-csi.org/), with a spatial resolution of 30 arc seconds (approximately 1 km at the equator). Water deficit (WD) was quantified as the difference between potential evapotranspiration (PET) and annual actual evapotranspiration (AET). Additionally, climate data for the Last Glacial Maximum (LGM) were downloaded from the WorldClim database (https://worldclim.org/) and derived from the average of three widely used Global Climate Models (GCMs): CCSM4, MIROC-ESM, and MPI-ESM-P, with a spatial resolution of 2.5 arc minutes. We calculated the temperature absolute anomaly (TA) and precipitation absolute anomaly (PA) since the LGM to characterize historical climate change. TA and PA were computed as the absolute differences between LGM and contemporary temperatures and precipitations, respectively [27,48,50].
Soil data were sourced from the SoilGrids database (https://soilgrids.org/), which has a spatial resolution of 1 km. We further divided the soil variables into two groups: soil texture and soil fertility (Table S2). Elevation data were obtained from WorldClim at a resolution of 30 arc seconds. Habitat heterogeneity was evaluated by calculating elevation range (max–min elevation) within each grid cell (ELER). Human Footprint (HFP) data, also with a resolution of 1 km, were derived from research by Mu et al. [51]. By extracting the annual mean of HFP from 2000 to 2018, we effectively characterized the average intensity of human activity disturbance. All environmental and human activity related predictive factors were aggregated into 50 × 50 km grid cells, and the mean and range of each variable within each grid cell were calculated.
2.3. Statistical Analyses
In this study, we first employed correlation analysis to examine pairwise relationships among variables. To mitigate collinearity, we partially excluded variables exhibiting strong correlations (|r| > 0.8) and with a Variance Inflation Factor (VIF) greater than five. Consequently, the initial 37 variables were reduced to 24 across eight categories as following: (1) Environmental energy variables, including mean annual temperature (MAT), mean diurnal temperature range (MDR), isothermality (Iso), and mean temperatures of wettest quarter (MTWEQ); (2) Water availability variables, including annual precipitation (MAP), mean precipitation of warmest quarter (PWAQ), annual actual evapotranspiration (AET), and water deficit (WD); (3) Climatic seasonality variables, including temperature seasonality (TSN) and precipitation seasonality (PSN); (4) Climate change since LGM variables, including temperature absolute anomaly (TA) and precipitation absolute anomaly (PA); (5) Soil texture variables, including bulk density (BDOD), clay content (CLAY), coarse fragments volumetric (CFVO) and silt content (SILT); (6) Soil fertility variables, including cation exchange capacity (CEC), organic carbon density (OCD), organic carbon stock (OCS), organic carbon content (SOC), total nitrogen (N) and pH; (7) Habitat heterogeneity variable, including elevational range (ELER); (8) Human activities variable, including human footprint (HFP).
To compare the relative importance of different factors affecting the species richness of Pinus, we employed a RF to quantify the relative importance and significance of predictive factors in explaining the distribution pattern of species richness. The RF model constructed in this study includes 500 decision trees, with 1000 random permutation tests conducted on the response variable, and all other parameters used the default settings. Percentage Increase in Mean Squared Error (%IncMSE) was selected as the primary metric for quantifying variable importance, and its statistical significance was verified. Statistically significant predictive factors were included in subsequent SEM analyses. Finally, we evaluated the direct and indirect effects of various variables on Pinus species richness using piecewiseSEM. Fisher’s C test was used to assess the goodness-of-fit of modeling results, with subsequent modifications based on path significance (p < 0.05) and model fit (0 ≤ Fisher’s C/df ≤ 2 and 0.05 < p ≤ 1).
The conceptual model of the piecewiseSEM is based on ecological theories and empirical evidence, focusing on the direct and indirect relationships between key factors and Pinus species richness. Core assumptions of the model include: (1) Energy and water availability are fundamental drivers of species richness, as regions with sufficient environmental energy and water resources support higher species coexistence [3,4]. (2) Climatic seasonality regulates richness by influencing species’ niche differentiation, environmental adaptability, and evolutionary dynamics [6,52]. (3) Historical climate change shapes contemporary richness patterns by affecting species migration, refuge dynamics, and long-term persistence [7,8]. (4) Habitat heterogeneity promotes species diversity by creating diverse microenvironments and refugia, reducing interspecific competition [9,10]. (5) Soil properties (texture and fertility) constrain or facilitate species richness by influencing resource availability [53,54]. (6) Human activities impact species richness through direct and indirect pathways: direct pathways include habitat modification (e.g., conservation management, land use), while indirect pathways are achieved by altering environmental factors such as surface energy balance, hydrological cycles, and soil properties [17,55,56,57]. Additionally, interrelationships exist among environmental factors. This conceptual framework captures the complex multi-pathway driving mechanisms of Pinus species richness, reflecting ecologically meaningful causal relationships.
All statistical analyses were performed using R version 4.2.3 (http://www.r-project.org/). We employed the “Hmisc” package for correlation analysis [58], the “car” package for VIF calculation [59], the “randomForest” and “rfPermute” packages for RF [60,61], and the “piecewiseSEM” package for constructing piecewiseSEM [42]. A detailed flowchart of the research methodology was provided in Figure 1.
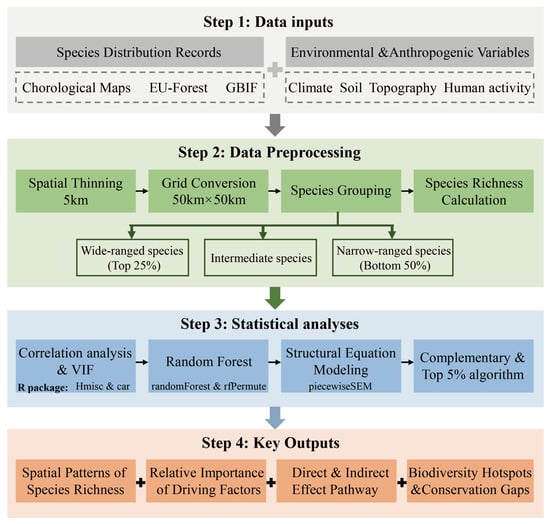
Figure 1.
Flowchart of the research methodology.
This study used the complementary algorithm and top 5% richness hotspot algorithm to identify Pinus diversity hotspots and compare the efficiency of both methods in delineating priority protected areas in Europe [62,63,64,65]. The complementary algorithm, proposed by Dobson et al. [66], is based on the theory of complementary subsets. This algorithm first selects grid cells with the highest species richness and subsequently removes all species contained within those cells from the distribution grid. Then, it selects the grid cells containing the most remaining species and repeats this process until all species are included. Therefore, the core objective of complementary algorithms is to achieve complete species coverage with the minimum number of grid cells. In contrast, the top 5% richness hotspot algorithm adopts a more simplified standard, designating grid cells with species richness in the top 5% as biodiversity hotspots. In addition, using global protected area polygon data from the World Database on Protected Areas (WDPA, https://www.protectedplanet.net), we conducted a spatial overlay analysis of identified diversity hotspots and existing protected areas, defining grid cells outside the protection network as protection gaps. By counting the number and proportion of diversity hotspot grids inside and outside protected areas, this study systematically evaluated the effectiveness of the existing protection system. It should be clarified that the protected area data used in this study include all WDPA polygons, aiming to fully reflect the overall scope of current conservation efforts across Europe.
3. Results
3.1. Geographical Distribution Pattern of Pinus Species Richness
Our results indicated that Pinus species covered 87% of Europe’s land area, with almost no distribution in most regions of Iceland, the Greater Eurasian Tundra, and the Pontic Steppe. The species richness of European Pinus exhibited significant regional differences along the transect from the eastern Baltic Sea coast to the western Black Sea coast. Specifically, its species richness was higher in western Europe and lower in eastern regions, which are predominantly plains (Figure 2a, Figures S1 and S2). Overall, contrary to the widely recognized LDG, Pinus species showed higher species richness in mid-latitude regions (37–60° N) (Figure 2b).
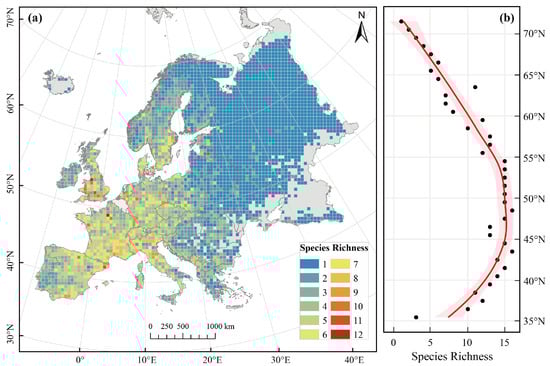
Figure 2.
Spatial distribution pattern and Latitudinal Diversity Gradient (LDG) of overall Pinus L. species richness. (a) Spatial distribution of species richness; (b) LDG derived from Locally Weighted Scatterplot Smoothing (LOWESS) curves (red line), with 95% confidence intervals indicated by shaded areas.
Our study also found that distribution records of the five wide-ranged species accounted for 91.73% of the total dataset (Table S1), indicating that their distribution regions were largely consistent with those of overall species, covering 86% of Europe’s land area. Furthermore, their species richness pattern was highly similar to that of overall species (Pearson’s r = 0.88, p < 0.001), exhibiting a distribution pattern of higher richness in western Europe and lower richness in eastern Europe (Figure 3a). In contrast, distribution records of the nine narrow-ranged species accounted for only 2.09% of the total dataset (Table S1), with these species primarily scattered in the mountains of western Europe (Figure 3b).
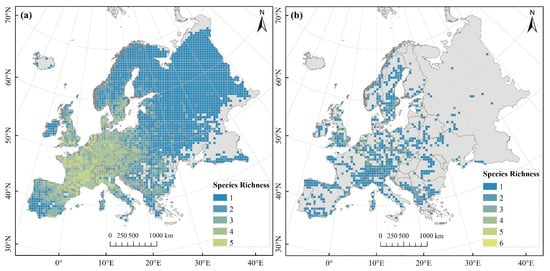
Figure 3.
Species richness patterns of Pinus L. across different geographical ranges. (a) Wide-ranged species; (b) Narrow-ranged species.
3.2. Determinants of Pinus Species Richness Patterns
Random Forest (RF) results indicated that environmental and anthropogenic factors jointly explained 80.34%, 79.40%, and 11.73% of the variance in species richness for overall, wide-ranged, and narrow-ranged species, respectively (Figure 4). In analyses of overall and wide-ranged species, the initially selected predictor variables were statistically significant. Furthermore, climatic seasonality and human activities had a notably more pronounced impact on the richness of overall and wide-ranged species than other variables, with their cumulative relative importance exceeding 56% (Figure 4a,b). In contrast, for narrow-ranged species, only six variables were statistically significant, with human activities identified as a relatively prominent predictor shaping narrow-ranged species richness (Figure 4c).
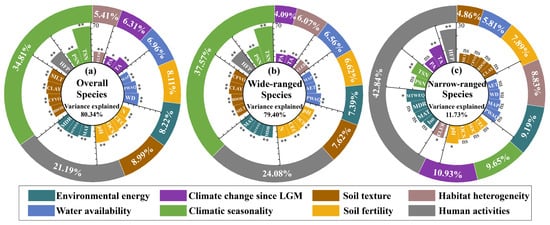
Figure 4.
Importance ranking of environmental and human activities variables from the RF model. (a) Overall species; (b) Wide-ranged species; (c) Narrow-ranged species. Inner radial bar charts illustrate variable importance values. Outer donut charts display weighted importance proportion of composite variables, calculated from the importance weights of all variables. Predictor significance is denoted as * p < 0.05, ** p < 0.01, and ns for p > 0.05.
Structural Equation Modeling (SEM) results showed that SEM explained 65%, 62%, and 13% of the variance in species richness for overall, wide-ranged, and narrow-ranged species, respectively (Figure 5). Specifically, for overall species, environmental energy and historical climate change had significant negative direct effects on species richness, indicated by path coefficients of −0.13 and −0.05, respectively. In contrast, the negative direct effect of soil texture was found to be weak and statistically non-significant. The remaining direct path coefficients were positive, with climatic seasonality exerting the strongest direct effect on species richness, reaching a coefficient of 0.50, followed by human activities and habitat heterogeneity. Notably, human activities had a substantial indirect effect on species richness by affecting other factors, resulting in the highest total effect value for human activities (Figure 5a,b).
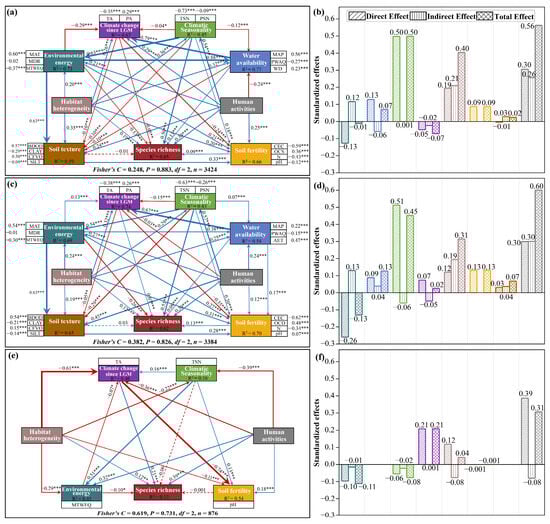
Figure 5.
PiecewiseSEM results and standardized effect statistics for Pinus L. species richness. (a,b) Overall species; (c,d) Wide-ranged species; (e,f) Narrow-ranged species. Arrow labels indicate standardized path coefficients, with arrow thickness reflecting relationship strength. Dashed lines denote non-significant paths (p > 0.05). Solid lines indicate significant paths (p < 0.05), where blue and red lines represent positive and negative relationships, respectively. Path coefficient significance is denoted as * p < 0.05, ** p < 0.01, and *** p < 0.001. The colors of the bar charts in the right panels are consistent with the background colors of the corresponding variable categories in left panels, respectively.
The piecewiseSEM results for wide-ranged species were largely consistent with those for overall species. Although the effects of historical climate change and soil texture on wide-ranged species richness were contrary to those observed for overall species, their influence remained weak. Consequently, our study not only elucidated the direct effects of climatic seasonality on the richness patterns of both overall and wide-ranged species but also emphasized the indirect shaping effects of human activities (Figure 5c,d).
In contrast to overall and wide-ranged species, the model’s path for narrow-ranged species was simpler, with only human activities, historical climate change, habitat heterogeneity, and environmental energy exerting significant direct effects on species richness. However, the model exhibits weak explanatory power. It should be noted that, unlike overall and wide-ranged species, historical climate change exerted a significant positive direct effect on narrow-ranged species richness (0.21) and was one of the dominant variables shaping narrow-ranged species richness patterns. In addition, human activities played a direct and relatively prominent role in explaining the variance in narrow-ranged species richness (Figure 5e,f).
3.3. Diversity Hotspots and Conservation
Based on the top 5% richness algorithm, we identified 171, 169, and 44 hotspot grid cells for overall, wide-ranged, and narrow-ranged species, respectively, encompassing all species within the three Pinus groups. The total absolute areas of these hotspots were 427,500 km2, 422,500 km2, and 110,000 km2, accounting for ~4.34%, ~4.29%, and ~1.12% of Europe’s total land area, respectively. The richness hotspots for overall and wide-ranged species were primarily located in western Europe, exhibiting a concentrated distribution over a substantial area (Figure 6a,c). In contrast, the richness hotspots for narrow-ranged species were scattered throughout western Europe (Figure 6e).
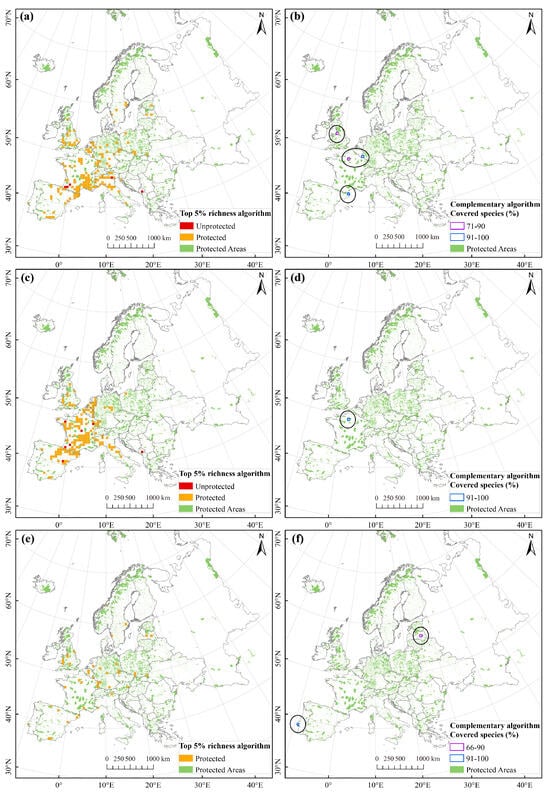
Figure 6.
Hotspots of Pinus L. species richness identified by top 5% richness algorithm and the complementary algorithm. (a,b) Overall species; (c,d) Wide-ranged species; (e,f) Narrow-ranged species. Left panels show results of the top 5% richness algorithm, whereas right panels display results of the complementary algorithm. Black circles highlight hotspot grid cells identified by the complementary algorithm.
The complementary algorithm identified four, one, and two hotspot grid cells for overall, wide-ranged, and narrow-ranged species, respectively. The hotspot grids for overall species were scattered across Great Britain, the Western European Coastal region, and the Western Mediterranean (Figure 6b). In contrast, hotspots for wide-ranged species were highly concentrated, with only a single grid cell in the central Western European Coastal region containing all wide-ranged species (Figure 6d). For narrow-ranged species, the two hotspot grid cells were geographically distant. The eastern hotspot grid was situated on the eastern coast of the Baltic Sea, while the western hotspot grid was located at the westernmost edge of the European continent (Figure 6f).
The analysis of conservation effects revealed that 97.08%, 95.86%, and 100% of the hotspot grids for overall, wide-ranged, and narrow-ranged species, as determined by the top 5% richness algorithm, were covered by nature reserves. Our statistical data indicated that, although all species within the three Pinus groups had been effectively protected, protection gaps remained in the existing protection network. These protection gaps for overall and wide-ranged species mainly occurred in southwestern Europe, including Spain (Iberian Peninsula), France, and the western Balkan Peninsula. Compared to other methods, the complementary algorithm identified fewer hotspot grids, with all cells overlapping with nature reserves and thus encompassing all Pinus species.
4. Discussion
This study found that the geographical distribution pattern of species richness in European Pinus is closely related to topographic characteristics, with significant differences observed between eastern and western Europe. The eastern region is dominated by plains with relatively simple terrain. However, due to agricultural expansion and urbanization, natural habitats here are becoming increasingly fragmented [67]. In contrast, western Europe features a mix of mountains and plains, resulting in more complex terrain (Figure S2). Consequently, overall species and wide-ranged species exhibit higher richness in the western region. Based on these findings, we propose that topographic heterogeneity and refugia history in western European mountains have played a synergistic role in the formation of Pinus diversity hotspots. This inference is consistent with previous research indicating that Pinus is more concentrated in mountainous areas and less prevalent or absent in extensive lowland regions [29]. Mountainous areas, characterized by long-term climate stability and high environmental heterogeneity, serve as the core foundation for generating regional Pinus diversity hotspots [31,68]. Specifically, topographic heterogeneity creates diverse microclimates and habitat types within small spatial scales, reducing interspecific competition by providing differentiated niches and supporting the coexistence of multiple Pinus species [10,14]. Additionally, western European mountains maintained relatively stable climates during Quaternary glacial-interglacial cycles, serving as refugia for Pinus species during the LGM [8,31].
The accumulation of narrow-ranged species in western European mountainous areas can be primarily attributed to the slower rate of climate change during the Quaternary period, which functioned as an important refuge [8]. During the LGM, extensive glaciation covered the Eurasian continent, forcing many species to migrate southward or to higher altitudes, and some even experienced local extinction [7,8]. Following the LGM, as temperatures rose and glaciers retreated, narrow-ranged species were unable to relocate to their potential northern distributions due to dispersal limitations [26]. These observations indicate that the complex landforms and refuge effects of western European mountains have facilitated the differentiation and preservation of narrow-ranged species. In contrast, wide-ranged species, characterized by strong adaptability and dispersal capabilities, occupy most of Europe [33]. Overall, similarities and differences in species richness patterns among the three Pinus groups emphasize the necessity of studying species with varying range sizes, as richness patterns of different groups may be shaped by distinct regulatory mechanisms [20,27,52,69,70].
Our results show that the main conclusions of RF analysis are highly consistent with those derived from SEM. Notably, the driving pathways and standardized effect sizes identified via SEM provide further insights into the relative importance of these processes. Although significant differences exist in how various factors impact Pinus species richness patterns across groups, the substantial contribution (91.73%) of wide-ranged species to the distribution of overall species combinations results in a more coherent driver mechanism for the richness patterns of overall and wide-ranged species [27,49].
Specifically, climatic seasonality exerts the most significant direct effect on the richness of both overall and wide-ranged species. This importance is supported by previous studies on Rhododendron, Gesneriaceae, and Moraceae taxa, which consistently demonstrate that climatic seasonality regulates richness patterns by influencing species’ environmental adaptability, niche differentiation, and evolutionary dynamics [27,52,71,72]. This study hypothesizes that the positive correlation between climatic seasonality and species richness of European Pinus is closely linked to its unique evolutionary history and ecological adaptation strategies. Previous research has indicated that Pinus originated in mid-latitude regions and exhibits notable niche conservatism, which may have facilitated the gradual evolution of extensive climate tolerance in temperate mountainous areas with pronounced seasonal climates [31,32,34]. Furthermore, the adaptation of Pinus to seasonal climates is reflected in its fire adaptation syndrome, which enhances its competitive ability and survival in seasonally variable environments, thereby sustaining high species richness [31,34]. While these macroevolutionary explanations are plausible, they remain indirect. Further phylogenetic or experimental studies would help validate these causal links.
In contrast, this study found that narrow-ranged species richness is weakly and non-significantly affected by short-term climatic seasonality (a proxy for contemporary climate fluctuations) but strongly shaped by long-term climate change since the LGM (characterized by temperature and precipitation absolute anomalies). This indicates that narrow-ranged Pinus species richness patterns are better predicted by historical climate stability and change velocity than by present-day climatic seasonality. This pattern aligns with previous research highlighting that narrow-ranged species—with narrow niche breadths and low genetic diversity—are more sensitive to long-term environmental changes, whereas wide-ranged species are primarily influenced by current climate fluctuations [24,27,28]. Following the LGM, rising temperatures provided ecological space for the northward migration of Pinus species from glacial refugia [7,8], and genetic geographic evidence confirms that the distribution and expansion trajectories of European Pinus species are highly consistent with the upward temperature trend [73], further supporting the critical role of long-term climate change in shaping narrow-ranged species richness.
It is noteworthy that human activities exert a major positive direct effect on the species richness of the three Pinus groups in Europe. This phenomenon may be partially attributed to two key aspects: first, human-mediated gene flow promotes genetic mixing and diversity in Pinus populations, thereby enhancing their environmental adaptability and stress resistance amid intensified climate change and increased biological stress [74]. Second, through the implementation of adaptive management strategies, such as genetic resource conservation and forest structure optimization, humans have supported the expansion of Pinus populations and the maintenance of ecological stability. In addition, considering the extensive use of Pinus in European forestry, this positive direct effect of human activities may also include contributions from intentional planting (e.g., plantations, shelterbelts, urban forests) and assisted migration, particularly in regions with intensive forest management. For narrow-ranged species, the strong human activities effect may reflect both conservation efforts (e.g., habitat restoration in native refugia) and occasional planting of rare species for ecological restoration. Notably, our spatial thinning procedure (one record per species per 5-km grid cell) has minimized the potential bias from concentrated plantations, as high-density plantation records are reduced to a single occurrence per grid cell. However, it is crucial to remain vigilant regarding the potential negative impacts of human activities, including habitat loss and fragmentation caused by anthropogenic disturbances, which remain significant constraints on ecosystem sustainable development [17,75]. Additionally, the indirect positive effect of human activities on the richness of overall and wide-ranged Pinus species via changes in environmental factors (e.g., climate and soil) should not be ignored. Therefore, future research and conservation strategies should focus on the indirect environmental impacts of human activities, providing a scientific basis for the sustainable management of Pinus biodiversity.
A comparison of the complementary algorithm and the top 5% richness algorithm reveals that the complementary algorithm achieves full species coverage with fewer grid cells, exhibiting greater conservation efficiency and representativeness in identifying priority protected areas for European Pinus species. This conclusion is supported by previous studies [76]. Conservation effectiveness analysis indicates that over 95.86% of hotspots identified by the top 5% richness algorithm are covered by nature reserves, while all hotspots identified by the complementary algorithm are incorporated into the conservation system. This suggests that current conservation measures have an overall significant effect on Pinus species conservation. Nevertheless, some hotspots may include managed native stands. This does not diminish their conservation value, as well-managed native plantations can support ecosystem functions and connectivity between natural populations. However, it highlights the need for protected areas to prioritize both natural and sustainably managed native Pinus habitats to sustain long-term diversity, particularly in southwestern Europe where protection gaps exist. Specifically, these gaps are concentrated in Spain, France, and the western Balkan Peninsula. Notably, although narrow-ranged species have been fully protected under both algorithms, their dispersed hotspot distribution poses specific challenges for conservation management. This is particularly true for isolated populations on the Baltic Sea’s east coast and Europe’s westernmost regions, which require targeted in situ conservation strategies to preserve their unique adaptive traits. Furthermore, complementary algorithms offer considerable practical value for protecting limited resources, as they enable full species protection at minimal spatial cost, thereby providing a scientific basis for European forest conservation planning. In summary, while Europe’s current Pinus conservation system is effective, it is crucial to strengthen conservation efforts in southwestern gap areas and prioritize targeted management of narrow-ranged species hotspots.
It is important to note that due to the spatial continuity of environmental gradients and biogeographical processes across Europe, spatial autocorrelation may exist in the residuals of both RF and SEM analyses. Nevertheless, the core conclusions of this study remain robust, as the identified dominant drivers are consistently supported by both analytical frameworks, as well as ecological theories and previous biogeographical studies on Pinus. Future research can further extend our findings by incorporating spatial effects (e.g., spatial eigenvectors or biogeographic region-level random effects) into a spatial SEM framework, thereby improving the accuracy of causal inference by explicitly accounting for spatial dependence. Furthermore, given the limited explanatory power of our models for narrow-ranged species, future studies should integrate more fine-scale environmental data and species-specific ecological traits to better disentangle the effects of environmental and anthropogenic factors on narrow-ranged Pinus species.
5. Conclusions
This study systematically investigates the species richness patterns of European Pinus and their underlying driving mechanisms. The geographical distribution of Pinus species richness in Europe exhibits distinct regional variations: overall and wide-ranged species show higher richness in western Europe, while narrow-ranged species are primarily scattered in mountainous areas of western Europe. These patterns reflect the critical role of topographic heterogeneity and glacial refugia in shaping biodiversity patterns. Furthermore, the drivers of species richness differ significantly among Pinus groups with varying distribution ranges, with the notable promoting effect of human activities highlighting their complex influences. Specifically, climatic seasonality and human activities are the dominant factors regulating the richness of overall and wide-ranged species, whereas narrow-ranged species are mainly influenced by historical climate changes since the Last Glacial Maximum and human activities, underscoring their sensitivity to long-term environmental changes. Although existing conservation measures have effectively protected most Pinus diversity hotspots in Europe, protection gaps remain in southwestern Europe. These findings enhance our understanding of the regulatory mechanisms underlying coniferous species richness patterns and provide critical scientific support for optimizing Pinus conservation strategies in the context of global climate change.
The analytical framework developed in this study—combining RF and piecewiseSEM to quantify the relative importance and causal pathways of multiple drivers, coupled with hotspot identification using complementary and top 5% richness algorithms—exhibits broad cross-taxon and cross-regional applicability. For instance, this approach can be extended to other coniferous genera or angiosperm tree species. Geographically, it can be applied to other biodiversity hotspots to explore consistent or region-specific drivers of species richness patterns. Such studies will contribute to a more generalizable understanding of large-scale biodiversity patterns and their underlying mechanisms, providing a unified scientific basis for global biodiversity conservation and management.
Supplementary Materials
The following supporting information can be downloaded at: https://www.mdpi.com/article/10.3390/f16121836/s1, Figure S1: Distribution of 16 biological regions in Europe and statistical results of Pinus species richness in each region; Figure S2: The topographic map of Europe; Table S1: The categories of Pinus species, and the numbers of grid cells and records; Table S2: All variables and their abbreviations used in our study.
Author Contributions
Conceptualization, J.Y. and H.Z.; methodology, J.Y. and H.Z.; software, J.Y. and X.X.; validation, J.Y. and H.Z.; formal analysis, J.Y. and H.Z.; investigation, J.Y.; resources, H.Z.; data curation, J.Y.; writing—original draft preparation, J.Y., H.Z. and X.X.; writing—review and editing, J.Y., H.Z. and X.X.; visualization, J.Y. and X.X.; supervision, H.Z.; project administration, J.Y.; funding acquisition, H.Z. All authors have read and agreed to the published version of the manuscript.
Funding
This research was funded by the National Water Pollution Control and Treatment Science and Technology Major Project (2017ZX07101) and the Discipline Construction Program of Huayong Zhang, Distinguished Professor of Shandong University, School of Life Sciences (61200082363001).
Data Availability Statement
All of the data used in this analysis were open access. The original sources of data used in this study were publicly available. The distribution data for Pinus species were collected from the Caudullo et al. (2017) [45]; (https://doi.org/10.1016/j.dib.2017.05.007), Mauri et al. (2017) [46]; (https://doi.org/10.1038/sdata.2016.123) and the Global Biodiversity Information Facility (GBIF, https://www.gbif.org/) [47]. The 18 bioclimatic variables were sourced from CHELSA (https://chelsa-climate.org/). AI, PET, and AET were obtained from the Consultative Group for International Agricultural Research (http://www.cgiar-csi.org/). Last Glacial Maximum climate data and elevation data were retrieved from WorldClim (https://worldclim.org/). Soil variables were accessed through SoilGrids (https://soilgrids.org/). Human footprint data were referenced from Mu et al. (2022) [51]; (https://doi.org/10.6084/m9.figshare.16571064). The polygon data for Europen protected areas were acquired from the World Database on Protected Areas (https://www.protectedplanet.net).
Conflicts of Interest
The authors declare no conflicts of interest.
References
- Gaston, K.J. Global Patterns in Biodiversity. Nature 2000, 405, 220–227. [Google Scholar] [CrossRef]
- Wright, D.H. Species-Energy Theory: An Extension of Species-Area Theory. Oikos 1983, 41, 496–506. [Google Scholar] [CrossRef]
- Currie, D.J. Water-Energy Dynamics, Climate, and Prediction of Woody Plant Species Richness: An Interim General Model. Am. Nat. 1991, 137, 27–49. [Google Scholar] [CrossRef]
- O’Brien, E.M. Water-Energy Dynamics, Climate, and Prediction of Woody Plant Species Richness: An Interim General Model. J. Biogeogr. 1998, 25, 379–398. [Google Scholar] [CrossRef]
- O’Brien, E.M.; Field, R.; Whittaker, R.J. Climatic Gradients in Woody Plant (Tree and Shrub) Diversity: Water-Energy Dynamics, Residual Variation, and Topography. Oikos 2000, 89, 588–600. [Google Scholar] [CrossRef]
- Janzen, D.H. Why Mountain Passes Are Higher in the Tropics. Am. Nat. 1967, 101, 233–249. [Google Scholar] [CrossRef]
- Svenning, J.C.; Skov, F. Ice Age Legacies in the Geographical Distribution of Tree Species Richness in Europe. Glob. Ecol. Biogeogr. 2007, 16, 234–245. [Google Scholar] [CrossRef]
- Sandel, B.; Arge, L.; Dalsgaard, B.; Davies, R.G.; Gaston, K.J.; Sutherland, W.J.; Svenning, J.-C. The Influence of Late Quaternary Climate-Change Velocity on Species Endemism. Science 2011, 334, 660–664. [Google Scholar] [CrossRef] [PubMed]
- Tews, J.; Brose, U.; Grimm, V.; Tielbörger, K.; Wichmann, M.C.; Schwager, M.; Jeltsch, F. Animal Species Diversity Driven by Habitat Heterogeneity/Diversity: The Importance of Keystone Structures. J. Biogeogr. 2004, 31, 79–92. [Google Scholar] [CrossRef]
- Stein, A.; Gerstner, K.; Kreft, H. Environmental Heterogeneity as a Universal Driver of Species Richness across Taxa, Biomes and Spatial Scales. Ecol. Lett. 2014, 17, 866–880. [Google Scholar] [CrossRef] [PubMed]
- Fjeldså, J.; Bowie, R.C.K.; Rahbek, C. The Role of Mountain Ranges in the Diversification of Birds. Annu. Rev. Ecol. Evol. Syst. 2012, 43, 249–265. [Google Scholar] [CrossRef]
- Xing, Y.; Ree, R.H. Uplift-Driven Diversification in the Hengduan Mountains, a Temperate Biodiversity Hotspot. Proc. Natl. Acad. Sci. USA 2017, 114, E3444–E3451. [Google Scholar] [CrossRef]
- Dakhil, M.A.; Li, J.; Pandey, B.; Pan, K.; Liao, Z.; Olatunji, O.A.; Zhang, L.; Eid, E.M.; Abdelaal, M. Richness Patterns of Endemic and Threatened Conifers in South-West China: Topographic-Soil Fertility Explanation. Environ. Res. Lett. 2021, 16, 34017. [Google Scholar] [CrossRef]
- Chang, Y.; Gelwick, K.; Willett, S.D.; Shen, X.; Albouy, C.; Luo, A.; Wang, Z.; Zimmermann, N.E.; Pellissier, L. Phytodiversity Is Associated with Habitat Heterogeneity from Eurasia to the Hengduan Mountains. New Phytol. 2023, 240, 1647–1658. [Google Scholar] [CrossRef]
- Zellweger, F.; Braunisch, V.; Morsdorf, F.; Baltensweiler, A.; Abegg, M.; Roth, T.; Bugmann, H.; Bollmann, K. Disentangling the Effects of Climate, Topography, Soil and Vegetation on Stand-Scale Species Richness in Temperate Forests. For. Ecol. Manag. 2015, 349, 36–44. [Google Scholar] [CrossRef]
- Schnitzler, A.; Hale, B.W.; Alsum, E. Biodiversity of Floodplain Forests in Europe and Eastern North America: A Comparative Study of the Rhine and Mississippi Valleys. Biodivers. Conserv. 2005, 14, 97–117. [Google Scholar] [CrossRef]
- Newbold, T.; Hudson, L.N.; Hill, S.L.L.; Contu, S.; Lysenko, I.; Senior, R.A.; Börger, L.; Bennett, D.J.; Choimes, A.; Collen, B.; et al. Global Effects of Land Use on Local Terrestrial Biodiversity. Nature 2015, 520, 45–50. [Google Scholar] [CrossRef]
- Cazalis, V. Species Richness Response to Human Pressure Hides Important Assemblage Transformations. Proc. Natl. Acad. Sci. USA 2022, 119, e2107361119. [Google Scholar] [CrossRef]
- Keck, F.; Peller, T.; Alther, R.; Barouillet, C.; Blackman, R.; Capo, E.; Chonova, T.; Couton, M.; Fehlinger, L.; Kirschner, D.; et al. The Global Human Impact on Biodiversity. Nature 2025, 641, 395–400. [Google Scholar] [CrossRef] [PubMed]
- Yue, J.; Zhang, H.; Zhao, L.; Wang, Z.; Zou, H.; Liu, Z. Historical Climate Change Drives Species Richness Patterns of Pinus L. in China. Biodivers. Conserv. 2025, 34, 2177–2195. [Google Scholar] [CrossRef]
- Guan, Y.; Wu, Y.; Cao, Z.; Wu, Z.; Yu, F.; Yu, H.; Wang, T. Island Biogeography Theory and the Habitat Heterogeneity Jointly Explain Global Patterns of Rhododendron Diversity. Plant Divers. 2024, 46, 565–574. [Google Scholar] [CrossRef] [PubMed]
- Wang, Z.; Fang, J.; Tang, Z.; Shi, L. Geographical Patterns in the Beta Diversity of China’s Woody Plants: The Influence of Space, Environment and Range Size. Ecography 2012, 35, 1057–1184. [Google Scholar] [CrossRef]
- Wang, Z.; Rahbek, C.; Fang, J. Effects of Geographical Extent on the Determinants of Woody Plant Diversity. Ecography 2012, 35, 1160–1167. [Google Scholar] [CrossRef]
- Liu, Y.; Su, X.; Shrestha, N.; Xu, X.; Wang, S.; Li, Y.; Wang, Q.; Sandanov, D.; Wang, Z. Effects of Contemporary Environment and Quaternary Climate Change on Drylands Plant Diversity Differ between Growth Forms. Ecography 2019, 42, 334–345. [Google Scholar] [CrossRef]
- Wang, Z.; Fang, J.; Tang, Z.; Lin, X. Patterns, Determinants and Models of Woody Plant Diversity in China. Proc. R. Soc. B Biol. Sci. 2011, 278, 2122–2132. [Google Scholar] [CrossRef] [PubMed]
- Normand, S.; Ricklefs, R.E.; Skov, F.; Bladt, J.; Tackenberg, O.; Svenning, J.C. Postglacial Migration Supplements Climate in Determining Plant Species Ranges in Europe. Proc. R. Soc. B Biol. Sci. 2011, 278, 3644–3653. [Google Scholar] [CrossRef]
- Liu, Y.; Shen, Z.; Wang, Q.; Su, X.; Zhang, W.; Shrestha, N.; Xu, X.; Wang, Z. Determinants of Richness Patterns Differ between Rare and Common Species: Implications for Gesneriaceae Conservation in China. Divers. Distrib. 2017, 23, 235–246. [Google Scholar] [CrossRef]
- Wang, Y.; Lyu, T.; Luo, A.; Dimitrov, D.; Wang, Z. Geographic Patterns in Range Sizes and Their Drivers of Endemic Angiosperms in China. Ecosphere 2023, 14, e4646. [Google Scholar] [CrossRef]
- Farjon, A.; Filer, D. An Atlas of the World’s Conifers: An Analysis of Their Distribution, Biogeography, Diversity and Conservation Status; Brill: Leiden, The Netherlands, 2013; ISBN 9789004211803. [Google Scholar]
- Richardson, D.M. Ecology and Biogeography of Pinus; Cambridge University Press: Cambridge, UK, 1998; ISBN 0521789109. [Google Scholar]
- Jin, W.T.; Gernandt, D.S.; Wehenkel, C.; Xia, X.M.; Wei, X.X.; Wang, X.Q. Phylogenomic and Ecological Analyses Reveal the Spatiotemporal Evolution of Global Pines. Proc. Natl. Acad. Sci. USA 2021, 118, e2022302118. [Google Scholar] [CrossRef]
- Salazar-Tortosa, D.F.; Saladin, B.; Castro, J.; Rubio de Casas, R. Climate Change Is Predicted to Impact the Global Distribution and Richness of Pines (Genus Pinus) by 2070. Divers. Distrib. 2024, 30, e13849. [Google Scholar] [CrossRef]
- Svenning, J.C.; Skov, F. The Relative Roles of Environment and History as Controls of Tree Species Composition and Richness in Europe. J. Biogeogr. 2005, 32, 1019–1033. [Google Scholar] [CrossRef]
- Badik, K.J.; Jahner, J.P.; Wilso, J.S. A Biogeographic Perspective on the Evolution of Fire Syndromes in Pine Trees (Pinus: Pinaceae). R. Soc. Open Sci. 2018, 5, 172412. [Google Scholar] [CrossRef]
- Breiman, L. Random Forests. Mach. Learn. 2001, 45, 5–32. [Google Scholar] [CrossRef]
- Gilbert, N.A.; Amaral, B.R.; Smith, O.M.; Williams, P.J.; Ceyzyk, S.; Ayebare, S.; Davis, K.L.; Leuenberger, W.; Doser, J.W.; Zipkin, E.F. A Century of Statistical Ecology. Ecology 2024, 105, e4283. [Google Scholar] [CrossRef]
- Li, Y.; Miao, Y.; Zhang, J.; Cammarano, D.; Li, S.; Liu, X.; Tian, Y.; Zhu, Y.; Cao, W.; Cao, Q. Improving Estimation of Winter Wheat Nitrogen Status Using Random Forest by Integrating Multi-Source Data Across Different Agro-Ecological Zones. Front. Plant Sci. 2022, 13, 890892. [Google Scholar] [CrossRef]
- Wang, Z.; Wang, G.; Li, Y.; Zhang, Z. Determinants of Carbon Sequestration in Thinned Forests. Sci. Total Environ. 2024, 951, 175540. [Google Scholar] [CrossRef]
- Fan, Y.; Chen, J.; Shirkey, G.; John, R.; Wu, S.R.; Park, H.; Shao, C. Applications of Structural Equation Modeling (SEM) in Ecological Studies: An Updated Review. Ecol. Process. 2016, 5, 19. [Google Scholar] [CrossRef]
- Grace, J.B.; Anderson, T.M.; Seabloom, E.W.; Borer, E.T.; Adler, P.B.; Harpole, W.S.; Hautier, Y.; Hillebrand, H.; Lind, E.M.; Pärtel, M.; et al. Integrative Modelling Reveals Mechanisms Linking Productivity and Plant Species Richness. Nature 2016, 529, 390–393. [Google Scholar] [CrossRef] [PubMed]
- Grace, J.B.; Anderson, T.M.; Olff, H.; Scheiner, S.M. On the Specification of Structural Equation Models for Ecological Systems. Ecol. Monogr. 2010, 80, 67–87. [Google Scholar] [CrossRef]
- Lefcheck, J.S. PiecewiseSEM: Piecewise Structural Equation Modelling in r for Ecology, Evolution, and Systematics. Methods Ecol. Evol. 2016, 7, 573–579. [Google Scholar] [CrossRef]
- Zhang, P.; Seabloom, E.W.; Foo, J.; MacDougall, A.S.; Harpole, W.S.; Adler, P.B.; Hautier, Y.; Eisenhauer, N.; Spohn, M.; Bakker, J.D.; et al. Dominant Species Predict Plant Richness and Biomass in Global Grasslands. Nat. Ecol. Evol. 2025, 9, 924–936. [Google Scholar] [CrossRef]
- He, P.; Jiang, R.; Liu, W.; Ye, J.; Huang, G.; Wu, H.; Zhang, Y. From Native Habitats to Invasion Frontiers: Understanding Spatial Niches of Invasive Plants Through Functional Traits. J. Biogeogr. 2025, 52, e15145. [Google Scholar] [CrossRef]
- Caudullo, G.; Welk, E.; San-Miguel-Ayanz, J. Chorological Maps for the Main European Woody Species. Data Br. 2017, 12, 662–666. [Google Scholar] [CrossRef]
- Mauri, A.; Strona, G.; San-Miguel-Ayanz, J. EU-Forest, a High-Resolution Tree Occurrence Dataset for Europe. Sci. Data 2017, 4, 160123. [Google Scholar] [CrossRef] [PubMed]
- GBIF Occurrence Download. Available online: https://www.gbif.org/occurrence/download/0018946-250426092105405 (accessed on 7 May 2025).
- Araújo, M.B.; Nogués-Bravo, D.; Diniz-Filho, J.A.F.; Haywood, A.M.; Valdes, P.J.; Rahbek, C. Quaternary Climate Changes Explain Diversity among Reptiles and Amphibians. Ecography 2008, 31, 8–15. [Google Scholar] [CrossRef]
- Liu, L.; Xu, X.; Zhang, L.; Li, Y.; Shrestha, N.; Neves, D.M.; Wang, Q.; Chang, H.; Su, X.; Liu, Y.; et al. Global Patterns of Species Richness of the Holarctic Alpine Herb Saxifraga: The Role of Temperature and Habitat Heterogeneity. J. Plant Ecol. 2022, 15, 237–252. [Google Scholar] [CrossRef]
- Liu, L.; Xu, Y.; Tang, Y.; Du, W.; Shao, C.; Wu, J.; Zhao, L.; Zhang, L.; Liu, J.; Xu, X. The Importance of Including Soil Properties When Disentangling the Drivers of Species Richness: The Case of the Alpine Genus Saxifraga L. in China. Front. Ecol. Evol. 2020, 8, 244. [Google Scholar] [CrossRef]
- Mu, H.; Li, X.; Wen, Y.; Huang, J.; Du, P.; Su, W.; Miao, S.; Geng, M. A Global Record of Annual Terrestrial Human Footprint Dataset from 2000 to 2018. Sci. Data 2022, 9, 176. [Google Scholar] [CrossRef] [PubMed]
- Shrestha, N.; Su, X.; Xu, X.; Wang, Z. The Drivers of High Rhododendron Diversity in South-West China: Does Seasonality Matter? J. Biogeogr. 2018, 45, 438–447. [Google Scholar] [CrossRef]
- Laughlin, D.C.; Abella, S.R.; Covington, W.W.; Grace, J.B. Species Richness and Soil Properties in Pinus ponderosa Forests: A Structural Equation Modeling Analysis. J. Veg. Sci. 2007, 18, 231–242. [Google Scholar] [CrossRef]
- Yuan, Z.; Ali, A.; Ruiz-Benito, P.; Jucker, T.; Mori, A.S.; Wang, S.; Zhang, X.; Li, H.; Hao, Z.; Wang, X.; et al. Above- and below-Ground Biodiversity Jointly Regulate Temperate Forest Multifunctionality along a Local-Scale Environmental Gradient. J. Ecol. 2020, 108, 2012–2024. [Google Scholar] [CrossRef]
- Hu, J.; Dong, S.; Wang, L.; Li, W.; Li, Q. Impact of Human Activities on Seasonal Changes in Precipitation in China. Clim. Environ. Res. 2024, 29, 643−655. [Google Scholar] [CrossRef]
- Xu, C.; Zhao, T.; Zhang, J.; Tao, L. Effects of Human Activities and Natural Forcings on Multiscale Changes of Global Land Surface Air Temperature Simulated by CMIP6 Models. Chin. J. Geophys. 2024, 67, 477–491. [Google Scholar]
- Wang, T.; Sun, Y.; Zhang, X.; Yang, X.Q.; Song, H. Detectable Anthropogenic Influence in Mean Precipitation of China. Geophys. Res. Lett. 2025, 52, e2025GL114870. [Google Scholar] [CrossRef]
- Harrell, F.E., Jr. Harrell Miscellaneous, Version 5.1-3; R Package; Comprehensive R Archive Network: Vienna, Austria, 2024.
- Fox, J.; Weisberg, S.; Price, B. Companion to Applied Regression, Version 3.1-3; R Package; Comprehensive R Archive Network: Vienna, Austria, 2024.
- Archer, E. Estimate Permutation P-Values for Random Forest Importance Metrics, Version 2.5.2; R Package; Comprehensive R Archive Network: Vienna, Austria, 2023.
- Breiman, L.; Cutler, A.; Liaw, A.; Wiener, M. Breiman and Cutlers Random Forests for Classification and Regression, Version 4.7-1.2; R Package; Comprehensive R Archive Network: Vienna, Austria, 2024.
- Zhang, W.; Bussmann, R.W.; Li, J.; Liu, B.; Xue, T.; Yang, X.; Qin, F.; Liu, H.; Yu, S. Biodiversity Hotspots and Conservation Efficiency of a Large Drainage Basin: Distribution Patterns of Species Richness and Conservation Gaps Analysis in the Yangtze River Basin, China. Conserv. Sci. Pract. 2022, 4, e12653. [Google Scholar] [CrossRef]
- Xie, H.; Tang, Y.; Fu, J.; Chi, X.; Du, W.; Dimitrov, D.; Liu, J.; Xi, Z.; Wu, J.; Xu, X. Diversity Patterns and Conservation Gaps of Magnoliaceae Species in China. Sci. Total Environ. 2022, 813, 152665. [Google Scholar] [CrossRef]
- Chi, X.; Zhang, Z.; Xu, X.; Zhang, X.; Zhao, Z.; Liu, Y.; Wang, Q.; Wang, H.; Li, Y.; Yang, G.; et al. Threatened Medicinal Plants in China: Distributions and Conservation Priorities. Biol. Conserv. 2017, 210, 89–95. [Google Scholar] [CrossRef]
- Yang, X.; Liu, B.; Bussmann, R.W.; Guan, X.; Xu, W.; Xue, T.; Xia, C.; Li, J.; Jiang, H.; Wu, L.; et al. Integrated Plant Diversity Hotspots and Long-Term Stable Conservation Strategies in the Unique Karst Area of Southern China under Global Climate Change. For. Ecol. Manag. 2021, 498, 119540. [Google Scholar] [CrossRef]
- Dobson, A.P.; Rodriguez, J.P.; Roberts, W.M.; Wilcove, D.S. Geographic Distribution of Endangered Species in the United States. Science 1997, 275, 550–553. [Google Scholar] [CrossRef]
- Kuemmerle, T.; Kaplan, J.O.; Prishchepov, A.V.; Rylsky, I.; Chaskovskyy, O.; Tikunov, V.S.; Müller, D. Forest Transitions in Eastern Europe and Their Effects on Carbon Budgets. Glob. Change Biol. 2015, 21, 3049–3061. [Google Scholar] [CrossRef] [PubMed]
- Sundaram, M.; Donoghue, M.J.; Farjon, A.; Filer, D.; Mathews, S.; Jetz, W.; Leslie, A.B. Accumulation over Evolutionary Time as a Major Cause of Biodiversity Hotspots in Conifers. Proc. R. Soc. B Biol. Sci. 2019, 286, 20191887. [Google Scholar] [CrossRef] [PubMed]
- Song, W.; Li, Y.; Luo, A.; Su, X.; Wang, Q.; Liu, Y.; Lyu, T.; Chen, Y.; Peng, S.; Sandanov, D.; et al. Historical and Contemporary Climate Jointly Determine Angiosperm Plant Diversity Patterns across East Eurasia. Ecography 2024, 2024, e07062. [Google Scholar] [CrossRef]
- Wai, T.H.; Liang, X.; Xie, H.; Liu, L.; Pan, Y.; Xu, Y.; Zhao, L.; Xu, X. Global Richness Patterns of Alpine Genus Gentiana Depend on Multiple Factors. Ecol. Evol. 2024, 14, e11366. [Google Scholar] [CrossRef] [PubMed]
- Wang, H.; Xu, X.; Cheng, X.; Liu, Y.; Luo, A.; Lyu, T.; Wang, W.; Nizamani, M.M.; Wang, Z. Spatial Patterns and Determinants of Moraceae Richness in China. J. Plant Ecol. 2022, 15, 1142–1153. [Google Scholar] [CrossRef]
- Jiang, K.; Wang, Q.; Dimitrov, D.; Luo, A.; Xu, X.; Su, X.; Liu, Y.; Li, Y.; Li, Y.; Wang, Z. Evolutionary History and Global Angiosperm Species Richness–Climate Relationships. Glob. Ecol. Biogeogr. 2023, 32, 1059–1072. [Google Scholar] [CrossRef]
- Wachowiak, W.; Żukowska, W.B.; Perry, A.; Lewandowski, A.; Cavers, S.; Łabiszak, B. Phylogeography of Scots Pine in Europe and Asia Based on MtDNA Polymorphisms. J. Syst. Evol. 2023, 61, 315–327. [Google Scholar] [CrossRef]
- Żukowska, W.B.; Wójkiewicz, B.; Lewandowski, A.; László, R.; Wachowiak, W. Genetic Variation of Scots Pine (Pinus Sylvestris L.) in Eurasia: Impact of Postglacial Recolonization and Human-Mediated Gene Transfer. Ann. For. Sci. 2023, 80, 42. [Google Scholar] [CrossRef]
- Marques, A.; Martins, I.S.; Kastner, T.; Plutzar, C.; Theurl, M.C.; Eisenmenger, N.; Huijbregts, M.A.J.; Wood, R.; Stadler, K.; Bruckner, M.; et al. Increasing Impacts of Land Use on Biodiversity and Carbon Sequestration Driven by Population and Economic Growth. Nat. Ecol. Evol. 2019, 3, 628–637. [Google Scholar] [CrossRef]
- Shrestha, N.; Wang, Z. Selecting Priority Areas for Systematic Conservation of Chinese Rhododendron: Hotspot versus Complementarity Approaches. Biodivers. Conserv. 2018, 27, 3759–3775. [Google Scholar] [CrossRef]
Disclaimer/Publisher’s Note: The statements, opinions and data contained in all publications are solely those of the individual author(s) and contributor(s) and not of MDPI and/or the editor(s). MDPI and/or the editor(s) disclaim responsibility for any injury to people or property resulting from any ideas, methods, instructions or products referred to in the content. |
© 2025 by the authors. Licensee MDPI, Basel, Switzerland. This article is an open access article distributed under the terms and conditions of the Creative Commons Attribution (CC BY) license (https://creativecommons.org/licenses/by/4.0/).