Abstract
This study investigated spruce wood (Picea abies Karst. L.) dust generated during sanding in a woodworking company, focusing on its health, explosion, and fire hazards. Microscopic analyses revealed that dust particles ranged from 2.38 μm × 1.69 μm to 499.71 μm × 403.30 μm, with an average size of 73.2 μm × 37.98 μm. Smaller particles exhibited a spherical morphology, while larger ones were elongated and fibrous. Sieve analysis confirmed that particles sized 63–75 μm formed the largest fraction (46.74%), with 71% of the total dust being airborne (<100 μm), including 5% PM10 and 1% PM2.5. Explosion tests identified a lower explosion limit (LEL) of 80 g·m−3, with dust classified as highly explosive (ST 2). Smaller particles were found to significantly reduce the LEL, increasing explosion susceptibility. These findings highlight the dual risk of inhalation exposure and explosion potential. Practical safety recommendations include ensuring efficient local dust extraction, mandatory use of respiratory protection, and restricted worker movement near sanders. Furthermore, organizational measures aligned with ATEX standards—such as daily cleaning, removal of settled dust layers, use of explosion-safe industrial vacuum cleaners, and installation of automatic explosion suppression systems in extraction units—are essential.
1. Introduction
Wood dust is an integral part of woodworking operations []. It is created during mechanical processing of wood, e.g., sawing, planning, milling, or sanding [,]. During mechanical cutting (such as sanding), the material removal process generates thin layers of detached material, commonly referred to as dust. Their morphology and dimensions are determined by the specific machining operation performed and the geometry of the cutting tool []. Some of the main technological processes in woodworking production are sawing [,], milling [,], and sanding, which generate a significant amount of dust. Sanding is one of the most common woodworking operations, carried out on smooth surfaces to prepare them for finishing, coating, or further processing [,]. During wood sanding, abrasive grains on the sanding belt remove material from the surface. These grains act as cutting edges, shaving off small fragments of wood []. The size of the removed particles depends on the abrasive material, grit size [,], and the pressure applied []. One of the main components created in the sanding process is wood dust. Wood dust particulates (WDPs) are a finely divided, air-suspended pollutant from the manufacture of wooden furniture []. Dust is defined as small solid particles in the atmosphere that do not settle under their own weight and can remain scattered (swirled) in the air for some time. Dust particles (especially those below 100 μm) pose a serious health risk to employees and increase the risk of fire [,,,,].
1.1. Risks of Wood Dust in Terms of Explosions and Fires
Wood dust is significantly more dangerous than compact wood in terms of fire risk. That is why dust explosions in industry are a frequent and constant risk []. The problem can be impurities in dust settled on machines, which can lead to fire in the machines or the surroundings []. According to ref. [], especially in the case of spruce dust particles, the ignition time is 50% shorter than that of hardwood dust. In certain cases, wood dust can ignite when mixed with air, which can also pose a risk of secondary explosion of dust accumulated in the area []. Wood dust is formed especially during sanding, is highly flammable, and can form an explosive mixture with air under certain circumstances. From a hygiene point of view, the term dust is understood as small particles of solid materials that are dispersed in the air or are deposited on individual objects. The size of dust particles ranges from 1 μm to 100 μm. The average range of wood dust is usually between 10 μm and 30 μm, although some processes produce dust particles with a diameter of less than <5 μm []. The finer the dust, the greater its specific volume (i.e., the size of the surface area per unit mass) []. As the specific volume increases, the maximum explosion pressure and the rate of increase in maximum explosion pressure rise, and the initiation energy required for the initiation of the dust–air mixture decreases. Particles with a diameter greater than 0.5 mm generally no longer react explosively. Yet, it is important to note that when handling dust, abrasion from larger particles produces smaller particles. For a mixture of particles with a diameter of more than 0.5 mm, the addition of 5 to 10% by weight of fine dust fractions with a medium grit size (approximately 0.04 mm) is sufficient to make the mixture explosive again. The moisture content of wood dust is another important parameter. Moisture reduces the risk of organic dust explosions by employing three key mechanisms. It acts as an inert heat sink, consuming thermal energy through evaporation. The resulting water vapor then chemically dilutes the reactive gases, lowering overall mixture reactivity. Finally, moisture increases particle cohesion, physically preventing the dust cloud from fully dispersing, which is necessary to propagate an intense explosion []. The sensitivity to ignition and spread of flame in a dust cloud is influenced by several factors, such as the concentration of the dust, its composition and moisture content, the size and shape of the particles, or the type of dust [,]. Wood dust moisture content is a factor affected by air humidity that affects the explosiveness of the mixture [,,,]. The presence of water in the dust can reduce the strength of the explosion and the susceptibility to ignition []. The risk of explosion decreases as the moisture content increases [,]. According to the results of the study of [], wood dust with low moisture content (interior conditions) becomes a potential risk in terms of explosion and subsequent fire.
1.2. Occupational Health Risks of Wood Dust
From the point of view of the woodworking industry, it is the finest dust [] that easily penetrates the respiratory system. The wood dust particles can cause nasal mucosa damage, nasal cancer, rhinitis, sore throat, bronchitis, and cryptogenic fibrosing alveolitis []. In addition, the particles can linger on the skin, causing pruritus, pyoderma, acne [], nasopharyngeal carcinoma [], cough [], or oxidative stress []. Another component found in the wood sanding dust mixture is silica. This occurs in the sanding tools as an abrasive material and is released during the process of wood sanding. In doing so, it can cause serious occupational diseases [,]. From the point of view of the definition of dust particles, the most risky is airborne dust, which can penetrate into the respiratory tract and alveoli, where it can cause structural damage to the lungs [,] or cause coughing or chest pain []. Oak and beech dust is classified as an A1 carcinogen, while dust from other wood species is an A2 carcinogen [,]. For the above reasons, dust is therefore a monitored parameter in the working environment []. In terms of sanding, a study showed [] that in the case of beech, ash, hornbeam, and alder wood, the dust particles were smaller than 1.5 μm. From the study of [], it turned out that during sanding, larger dust particles are formed in spruce and pine wood compared to beech, hornbeam, oak, or ash wood. The study also showed that there is a relationship between the density of wood and the size of dust particles. This dependence was also found in the study of []. According to the research of [,], the density of wood is also related to the concentration of dust. The higher the density of the wood, the lower the dust concentration. The study also showed that as the density of wood increases, the diameter of dust particles decreases. From the above studies, it can therefore be said that sanding spruce wood produces dust with particles of larger diameter. However, within the framework of spruce dust research, there is still a low number of studies that link the morphology of dust particles with sieve analysis and analysis of explosion parameters.
This paper’s main objective is to evaluate the risks—including fire, explosion, and workers’ health hazards—at a woodworking company that produces semi-finished spruce wood products. The paper aims to collect wood dust generated during the sanding and determine the size of its particles. This analysis will assess the health hazard the dust poses to workers. Furthermore, the explosion characteristics of the dust will be determined to evaluate its risk from a fire and explosion perspective. The following subtasks will be performed as part of the experiment:
- Microscopic analysis of wood dust particles after sanding and measurement of dust particle dimensions.
- Sieve analysis of dust particles.
- Explosion parameters of dust in an autoclave.
2. Materials and Methods
2.1. Wood Dust Material
In Slovakia, Norway spruce (Picea abies Karst. L.) is the most commonly processed tree species among all coniferous trees (especially for their physical and mechanical properties). The coniferous raw material was processed on a technological line for the production of construction timber, which consisted of the following parts: a line for sawing wood, a line for sanding, and a line for the production of briquettes. The object of the research was wood dust created on the sanding line. The wood parts were dried to a moisture content of 8% ± 2% according to interior conditions. Parts were then transported to the lower belt sander from the roller conveyor. In the lower sander, the underside of the parts was sanded using sandpaper in the form of an endless strip. After the sanding of the underside of the parts, the material was moved to the roller conveyor and then to the upper sander, where the upper side of the parts was sanded. The grit size of the sanding belt was P80. A sanding belt with this grit size was used in production to calibrate the thickness of the edge-glued panel and to remove minor imperfections (machine marks). The working conditions during sanding were as follows: air humidity 45% and air temperature 21 °C. The collection of wood was carried out on a one-off basis. To collect the dust generated during sanding, the FESTOOL CTL 26 E (Festool Group GmbH and Co. KG, Wendlingen, Germany) was connected to the lower and upper sander. The bag of sanding dust was then sealed in a zip-lock bag to preserve its moisture as much as possible.
2.2. Determination of Wood Dust Moisture Content, Microscopic Analysis, and Sieve Analysis
After the wood dust was collected, the moisture content of the dust samples was analyzed on the next day. The method was carried out in accordance with the technical standard ISO 1666:2000 Starch. For the determination of the amount of moisture [], the instrument used was the Mettler Toledo Halogen Moisture Analyzer HS153 (Mettler Toledo, Bratislava, Slovakia). The procedure was repeated 5 times (10 g each time) to determine more accurate moisture content values.
Subsequently, the dust was microscopically analyzed using an Olympus BX 50 (Olympus Corporation, Tokyo, Japan) transmitted light transmission microscope with an objective zoom of 100× and 200×. A Keyence VHX-7000 digital microscope (Keyence Corporation, Osaka, Japan) was also used for microscopic measurement of particle dimensions. Dust particles (approximately 1 g) were evenly stratified on the microscope glass slide 30 times. Subsequently, an area of 10 mm × 10 mm was scanned at a 200× lens magnification. Within this area, the microscope automatically analyzed the dust particles based on the difference in brightness (with white LED light shining through the glass slide and darker dust particles). The digital microscope was calibrated before each experiment using a Keyence calibration scale (Keyence Corporation, Osaka, Japan) with a known grid distance. Out of 30 analyses, the Keyence VHX-7000 software (Keyence Corporation, Osaka, Japan) measured 50,000 dust particles.
To determine the percentage of dust particle sizes in the collected mass, granulometric analysis was used, which divided the sample mass into individual size ranges based on the sieves used (captured mass on a given sieve with a defined mesh size). Based on the gravimetric weighing of the trapped dust mass on the respective sieve with the given mesh size, their percentage was calculated. For the examined samples, sieves with the size of the holes corresponding to the technological process were selected. Sieves (1, 32, 40, 45, 63, 75, 90, 106, 125, 150, 180, 250, 500 μm) were used to determine the specific percentage of dust fractions. We selected these sieve meshes because they cover a wide, representative range of particle sizes, which is critical for assessing the risks associated with sanding dust, especially in the context of occupational health or fire and explosion risks. Sieves with a size below 100 μm were particularly important, as this dust is inhalable. The oscillation frequency was set to 75 on the device, and sieving was carried out with an additional mass of 50 ± 1.0 g in 15 min. The procedure was repeated 5 times to obtain a more accurate representation of wood dust particles in each sample. The results present the calculated percentage by weight of the total mass captured on the relevant sieve of the given size. Since the size of the dust in this case is determined by the flow through a sieve with a given mesh size, the presented results only relate to the size range in which the given chip was located. In the case of sieving sanding dust, 3 to 4 Teflon balls were inserted into sieves with mesh sizes of 125 μm, 080 μm, 63 μm, and 32 μm to prevent dust particles from coagulating and forming clusters of dust fractions of different sizes in the shape of a ball. The Retsch AS 200 Basic Analytical Sieving Machine (Retsch GmbH, Haan, Germany) used is shown in Figure 1. The amount of residue retained on each sieve was determined by weighing the samples on a high-precision Radwag KERN PLT digital laboratory balance (KERN and SOHN, Balingen, Germany), which has a weighing accuracy of 0.001 g.
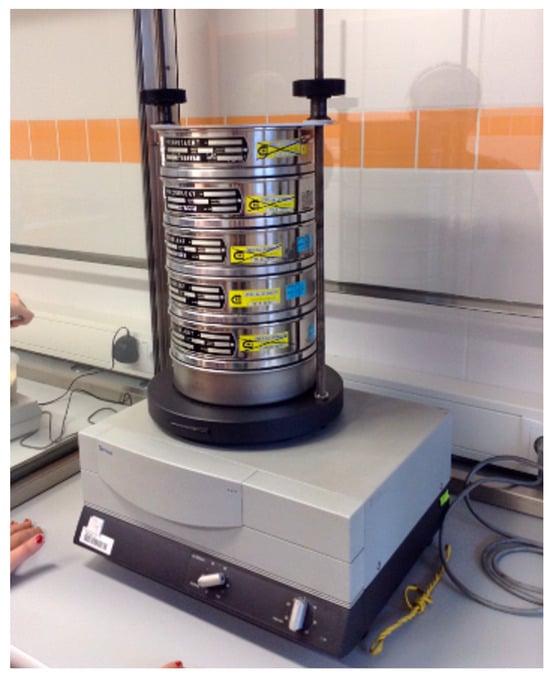
Figure 1.
Determination of multiple wood dust fractions using the AS 200 Basic analytical sieving machine (Retsch GmbH, Haan, Germany).
2.3. Maximum Explosion Parameters of Wood Dust
The experiment was based on EN 14034-2+A1:2012 Determination of explosion characteristics of dust clouds. Part 2: Determination of the maximum rate of explosion pressure rise (dp/dt)max of dust clouds []. The determination of the explosion parameters of the dusts was carried out in a VA-20 (Cesana AG, Basel, Switzerland) explosion autoclave (Figure 2). The test chamber is a hollow ball with a capacity of 20 L, made of stainless steel. The chamber has a double-walled structure. Between the inner and outer shell, there is a space that is filled with water, the so-called water jacket, and it is possible to turn the circulation of this water on or off. The water jacket is used to dissipate the heat generated by the explosion and thus maintain the temperature required for the measurement. Chemical detonators are designed for initiating dust, gas, and hybrid mixtures in pressure vessels, such as the VA-20 (Cesana AG, Basel, Switzerland). A Sobbe igniter was used (Fr. SOBBE GmbH, Dortmund, Germany). The ignition initiation conditions were implemented using an EBBOS CHZ chemical detonator (Fr. SOBBE GmbH, Dortmund, Germany) with an ignition energy of 1 kJ for determining the lower explosive limit and a green chemical detonator with a number of pieces equal to 2 × 5 kJ and a total initiation energy of 10 kJ for determining the explosion parameters. In the VA 20 (Cesana AG, Basel, Switzerland), the initial pressure was atmospheric pressure, and the 0.7 L container was emptied after 10 ms of air ingress with 20 bar compressed air. The weight of the dust tested in the autoclave was determined by calculating the required concentration and then weighing it on a laboratory scale. The measurement was repeated three times.
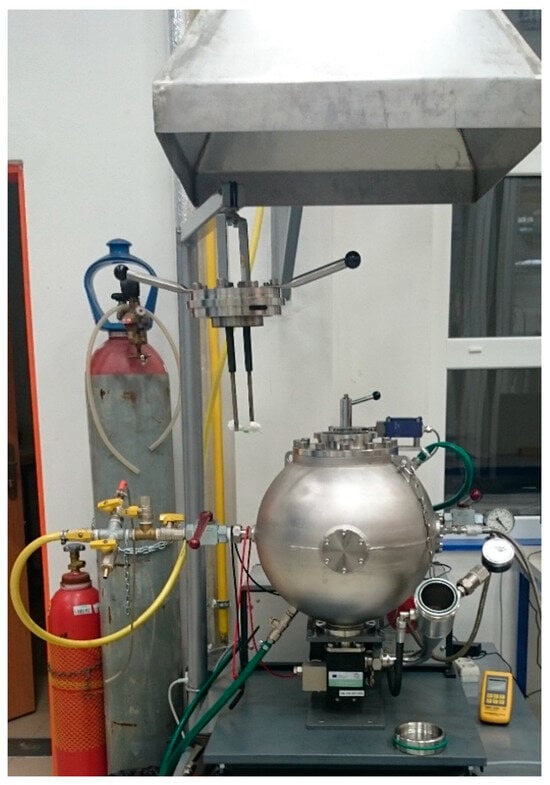
Figure 2.
Diagram of the VA−20 explosion autoclave (Cesana AG, Basel, Switzerland).
Before each measurement, the functionality and tightness of the device were verified by introducing compressed air into the autoclave space and performing a “fictitious” initiation without burners. This verified that there was no loss of pressure anywhere and that both pressure sensors measured within the prescribed deviation. In addition, pressure tests of the device and calibration of the pressure sensors are performed once a year in an accredited testing laboratory. In the interim, an internal calibration of the sensors is also performed once a month according to the procedure in the manufacturer’s manual. The system automatically flags unacceptable explosion and control parameter discrepancies in red. Errors include Pex/Pm (pressure difference > 0.3 bar), dP/dt (rate of pressure rise difference > 10% of the mean), Pd (expansion pressure outside 0.55 to 0.7 bar), td (outlet-valve time lag outside 30 to 50 ms), and tv (ignition delay deviation > ±5 ms from the entered time). Automatic control ensures the reliability of measured data.
The explosion autoclave determined the lower explosion limit, maximum pressure, and maximum pressure rise, and the cubic constant was calculated according to Formula (1). The lower explosion limit (LEL) is defined as the lowest concentration of a mixture at which the mixture is explosive. The value is very important for determining the environment to protect the equipment from the risk of explosion and the concentration at which the mixture will be below the hazardous concentration.
—maximum explosion pressure growth rate (MPa·s−1), —body volume (m3).
The maximum explosion pressure is the explosion pressure measured with the optimal concentration of the dust–air mixture. The maximum rate of pressure rise (dp/dt) max depends on time. It is subtracted from the explosion curve obtained from the experimental measurement of the explosiveness of flammable dust in a turbulent state.
2.4. Statistical Evaluation of Wood Dust from Sanding
Experimental determinations of moisture content and sieve analysis were statistically analyzed. The results of the analysis were processed in the statistical software STATISTICA 14 (TIBCO Software Inc., Palo Alto, CA, USA). Selected methods of descriptive and inductive statistics were used for data processing and analysis, considering the nature of the measured quantities and the intention of the experiments performed. A paired t-test for dependent samples was used in the case of microscopic analysis of dust particle sizes (at the α = 0.05 significance level). An F-test was used to determine statistically significant changes in the size of particles captured on individual sieves. Analysis of variance (ANOVA) and Duncan’s post-hoc test were used to determine the significance of the effect of dust concentration on maximum pressure and maximum pressure increase rate. ANOVA was also performed at a significance level of α = 0.05.
3. Results
3.1. Spruce Wood Dust Moisture Content
In the first step, the moisture content of the dust after sanding was measured according to the relevant technical standard. Wood dust had a moisture content of 8.42% ± 0.40%. The maximum measured moisture content was 8.74%, and the minimum measured moisture content was 7.64%. The minimum and maximum values correspond to the moisture content of wood dust indoors (8% ± 2%) at a certain temperature and air humidity. This moisture content value was slightly higher than the measured moisture content from the literature []. When compared with the study of [], it can be noted that the moisture content of spruce dust is lower than the moisture content of sawdust from furniture production, which the authors analyzed (10%). If the moisture content of the wood was higher, the presence of water would reduce the force of the explosion and the susceptibility of the dust cloud to ignition []. On the other hand, the moisture content of the wood dust in the interior oscillated around an average value of 8.42%. The total mixture sampled with this moisture content was subsequently evaluated by sieve analysis, and its explosion parameters were determined.
3.2. Microscopic Analysis of Wood Dust
In Figure 3, Figure 4 and Figure 5, different sizes and shapes of dust particles can be observed. Figure 3 shows that particles in certain cases reach sizes in the order of hundreds of micrometers. Their shape is, in most cases, elongated and fibrous compared to higher-density wood species, where the particles are more circular []. The fibrous shape of spruce dust particles is particularly notable at a higher fraction [,,]. In Figure 3, it is possible to observe a complex of earlywood tracheids in an almost intact state and undamaged bordered pits in radial section.
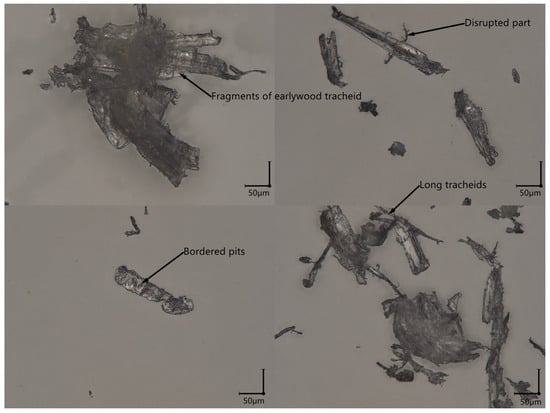
Figure 3.
Microscopic image of a sample of wood dust.
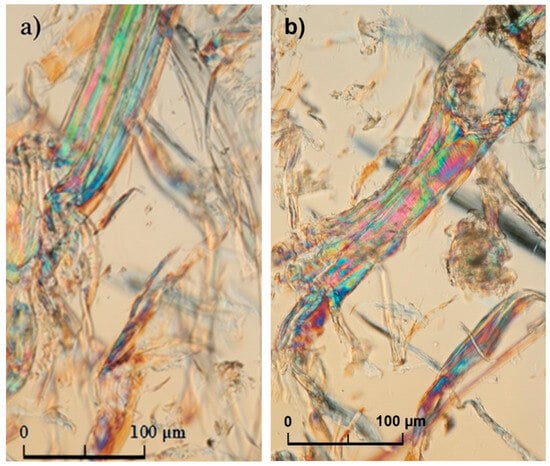
Figure 4.
(a) Mechanically agitated dust particles; (b) fibrous shape of dust particles.
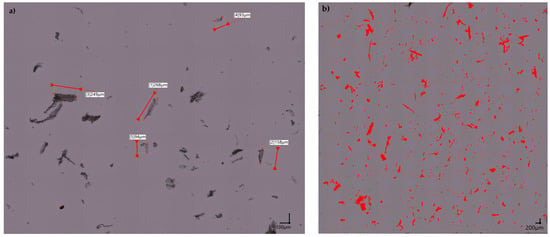
Figure 5.
(a) Microscopic analysis of the dimensions of individual particles. (b) Demonstration of software for automatic detection of particles and measurement of particle dimensions; microscopic analysis was performed on a Keyence digital microscope (Keyence Corporation, Osaka, Japan).
Microscopic analysis mainly observed long coiled tracheids with a defibrillated cell wall. In Figure 4a, it is possible to observe fibrous tracheids after mechanical intervention. Very mechanically disturbed cellular elements were found in the observed samples in the form of a tuft (Figure 4b). The more damaged the dust particles, the greater their surface-to-mass ratio, as a result of which the area available for contact with the ignition source or for the transfer of flame from other particles increases []. This particle damage can be triggered within the extraction system, where the particles are carried and ground against the walls of the pipe. The different structure of dust particles from the intake pipes and their behavior (higher risk of explosion) was also confirmed by []. For this reason, it is necessary to deal with microscopic analysis when researching the properties of wood dust. As can be seen in Figure 4, dust particles have a largely fibrous shape. However, particles whose size is below 100 μm can also be observed in samples analyzed by a microscope (Figure 5). In addition to the fire risk, these are also health risks. According to the WHO Regulation (WHO/SDE/OEH/99.14), such particles meet the definition of dust (from 1 μm to 100 μm) and become airborne dust.
In the next step, a digital microscope was used to analyze the particle dimensions. This was automatically performed by the “Particle Analysis” software Keyence VHX-7000 microscope (Keyence Corporation, Osaka, Japan). An example of automatic particle detection can be seen in Figure 5b. The sieve analysis only shows the range (lower and upper) of particles on the sieve where the highest mass of dust particles was captured. However, the digital microscope provided information about the dimensions of individual dust particles through analysis. At the same time, it was also possible to analyze very small particles that were trapped on the 1 μm sieve (i.e., determine the particle size in the range from 1 μm to 32 μm). This microscopic analysis was used to determine the average dimensions of dust particles, dEC (diameter of a circle with equal projection area) according to [], aspect ratio calculated according to [] and the maximum and minimum dimensions in a 2D projection.
Table 1 shows the dimensions of the sanding dust particles. The digital microscope captured the largest and, at the same time, the smallest dimension of each particle. From the data in Table 1, it can be seen that these fibrous, oblong particles have an average size of 73.2 μm × 37.98 μm. A paired t-test for dependent samples was used to determine the difference between the maximum dimension and the minimum dimension. At the α = 0.05 significance level, the difference between these two measured dimensions of the wood dust is statistically significant (p-level < 0.00). Similar fibrous dust particles were also observed in the studies of [,]. The study of [] shows that the size of spruce particles is around 11.1 μm. An elongated dimension is also observed in the statistical data for the maximum and the minimum. The largest measured particle in the dust mixture was 499.71 μm × 403.30 μm. The smallest particle measured was 2.38 μm × 1.69 μm. This is very similar to the study of []. It follows that even the smallest particles are not completely isometric, although their circularity is greater than that of larger particles. The average of the analyzed particles was determined by sieve analysis using a 63 μm sieve (i.e., particles from 63 μm to 75 μm). The analysis shows that there are also particles below 2.5 μm in sanding dust, i.e., those classified as PM2.5. These pose a serious risk to workers’ health. These particles were also found in analyzed dust samples after CNC milling []. From Table 1, it is also possible to see the average, minimum, and maximum values for the dEC parameter. However, the average value is notably lower than in the results of the study of []. Nevertheless, the maximum value of this parameter coincides with the data measured in the authors’ study. In the investigation of particle morphology, the aspect ratio was also measured (Table 1). The calculation showed that value 0 is a circle. The higher the value, the more elongated or non-spherical the particle. Table 1 shows that the average aspect ratio was 0.41. The lower average was probably caused by a larger number of particles being more circular in shape. This is evidenced by the smallest particles, whose aspect ratio is 0.04, and, therefore, they have a circular shape. On the contrary, the largest particles have an aspect ratio of 0.92, which indicates a significant elongation, similar to dEC (6.28). This is consistent with the claims of [,].

Table 1.
Dimensions of dust particles analyzed with a digital microscope (for n = 50,000 pcs).
3.3. Statistical Evaluation of Sieve Analysis of Spruce Wood Dust
The results of the sieve analysis of wood dust are shown in Figure 6. The resulting weight and percentage composition of the sanding dust are the arithmetic means of three sieve analyses. The F-test showed that the sizes of dust particles captured on individual sieves varied statistically significantly (p-level < 0.00 at the α = 0.05 significance level). The values in Figure 6 represent the masses of dust particles collected on the individual sieves of the instrument in grams, as well as their relative amount. During sieving, the polydisperse system is completely divided into individual groups. These groups contain particles with a size within certain limits given by the dimensions of the sieves used. Figure 6 shows that the highest mass (23.37 g) of captured wood dust particles was in the range of 63 μm to 75 μm. This group contained up to 46.74% of the total sieved particles of wood dust. The second most numerous group was from 45 μm to 63 μm, with 8.99% of the particles represented. Since spruce dust particles are larger than deciduous wood species, with a demonstrably elongated shape (see the microscopic analysis), some dust particles were also found in the range from 250 μm to 500 μm (3.20%). This supports microscopic analysis, in which longer fibrous particles were discovered in the dust samples analyzed. Figure 6 also shows that the most abundant particle size (median) was in the range of 45 μm to 63 μm, similar to the study of []. This is a smaller size of dust particles than in the case of [], where the average value of spruce dust particles was at a level of approximately 325 μm (for P60). The small dust particle size in this experiment could have been caused by finer sanding on a belt sander. Compared to the studies of [,], it also follows that dust particles are larger than those of wood species with a higher density (hardwoods). From the values in Figure 6, it is evident that almost half of the particles were captured on a sieve with a mesh size of 63 μm, while in the case of oak and beech in the study of [], the largest fraction of particles was below 32 μm. The reason for the larger particles is that less dense spruce wood is less resistant to woodworking processes [,]. The above results show that dust particles from sanding are more likely to be wood powder according to the technical standard ISO 17225 [].
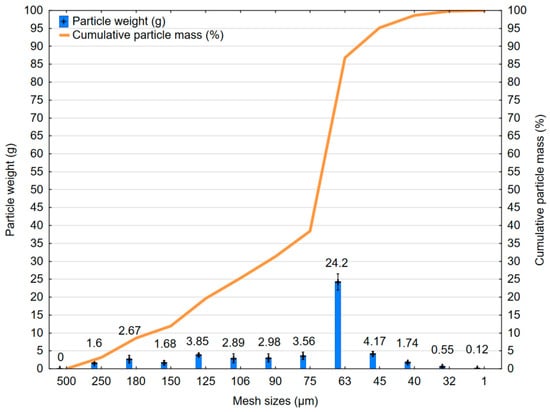
Figure 6.
Results of sieve analysis and cumulative masses of fallen dust particles after sanding; cross = arithmetic mean; vertical bars denote ± 95% confidence interval.
From the point of view of the risks of explosion and subsequent fire, the limit is 100 μm for dust to enter the air and become airborne [,]. From this point of view, according to Figure 6, up to 80% of dust particles after sanding pose a potential risk of explosion. According to the studies of [,], with decreasing dust particle size, the risk of explosion increases (the minimum initiation energy (MIE) decreases). Another risk is that more than half of the spruce dust particles are located below 75 μm, where, according to [,], a significantly lower minimum ignition temperature is required. From the research of [], it turned out that particles with a smaller diameter have a larger specific surface area (m2·g−1), which affects their explosion parameters. According to the study of [], using the same concentration of dust particles, the explosion pressure increases with decreasing particle diameter. This is because the smaller the diameter of the particles, the larger the specific surface area and the larger the contact zone with oxygen, which leads to a faster release of heat, and deflagration occurs with subsequent detonation. The size of the dust particles also affects the ignition temperature. According to the study of [], the ignition temperature decreases almost linearly with decreasing dust particle size. Therefore, a high proportion of particles with a size of 63 to 75 microns (compared to larger particles) in the sample analyzed may represent a fire hazard.
The above results indicate the dimensions of fine dust particles. When compared to the study of [], it can be stated that this dust is predominantly finer than milling sawdust particles. In the authors’ study, the largest proportion of milled particles is in the range of 1000 μm to 2000 μm. In contrast to the study of [], the analyzed spruce sanding dust in Table 1 is larger. The reason is that the authors used 360-grit sandpaper for sanding. This made the sanding dust particles finer. The study of [] analyzed dust from sanding MDF boards with 80-grit sanding paper. The authors reported that the aspect ratio was 0.42, similar to the results in Table 1.
3.4. Fine Dust Particle Analysis
From the point of view of health risks, it can be concluded that the total volume of the analyzed samples contains a proportion of particles meeting the PM2.5 category. This was also proven from the analysis of the dimensions of dust particles in Table 1. This fine fraction of wood dust can potentially travel through the airways to the pulmonary alveoli, where it can trigger various types of inflammation. Nevertheless, in addition to the PM2.5 (or PM10) category, fractions below 100 μm are also dangerous. Approximately 70% of dust particles below 100 μm of the total mass analyzed may enter workers’ airways and cause acute or chronic inflammation, tumors, or other problems in the upper and lower respiratory tract []. According to the research of [,], PM2.5 particles can enter the bloodstream, where they trigger an immune response. Exposure to these particles can cause rapid inflammation or oxidative damage, according to studies.
The sieve analysis (Figure 6) revealed the overall distribution of dust particles. Nonetheless, in the context of workplace hygiene, it is crucial to assess dust particles smaller than 100 µm, i.e., the inhalable and respirable fraction. For this purpose, a Keyence VHX-7000 digital microscope (Keyence Corporation, Osaka, Japan) was used. Figure 7 illustrates the particle size distribution of dust particles generated during sanding. The results indicate that the largest proportion of dust mass, approximately 71%, is concentrated in the size range between 10 µm and 100 µm. Coarser particles larger than 100 µm account for 23% of the total dust mass. Particles smaller than 10 µm (thoracic fraction) represent 6% of the total. The proportion of particles below 2.5 µm (respirable fraction) in the analyzed sample was 1%.
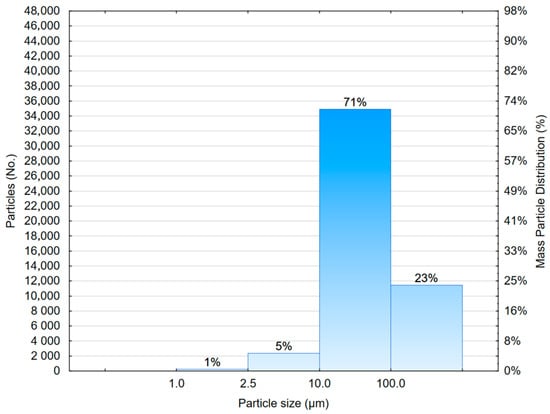
Figure 7.
Mass distribution of fine particles in wood sanding dust.
This distribution suggests that the sanding of spruce wood primarily generates particles between 10 µm and 100 µm, with a relatively low presence of respirable dust. From an occupational health perspective, this means that although the share of respirable particles is limited, it still requires attention due to their potential to penetrate deeper into the respiratory tract. Overall, the particle size distribution reflects the fibrous nature of spruce wood, where mechanical abrasion tends to produce larger fragments rather than finer dust.
3.5. Lower Explosion Limit (LEL) of Spruce Wood Dust Depending on Concentration
With the help of the VA−20 explosion autoclave (Cesana AG, Basel, Switzerland), different concentrations were measured, whether it was when measuring the LEL (lower explosion limit for dust) or the maximum explosion parameters. Figure 8 shows the graph curve for the wood dust from the sander when determining the LEL depending on concentration. It can be noted that up to a concentration of 80 g·m−3, it does not exert any explosion pressure. It follows that the wood dust did not explode on the sander.
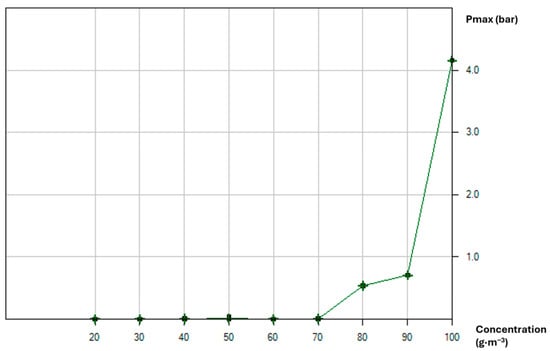
Figure 8.
Pressure increases depending on the concentration of wood dust from the sander.
At a concentration of 80 g·m−3, the device measured an explosion pressure of 0.05 MPa. This was the lowest concentration of dust dispersed in the air that could lead to ignition []. It is an increase in pressure that was created by the explosion. From this curve, we determine the lower explosion limit of wood dust from the sander at a concentration of 80 g·m−3 (Figure 8). This concentration of wood dust is higher than in the studies of [,]. The authors measured the LEL for spruce dust particles (from 20 μm to 71 μm) at a concentration of 50 g·m−3 and for dust particles (from 71 μm to 125 μm) at a concentration of 60 g·m−3. In the case of this experiment, the largest dust particle ratio was in the range of 63 μm to 75 μm (Figure 6), and the lower explosion limit of the dust was 80 g·m−3 (Figure 8). The explanation for the LEL value we have measured may be the higher moisture content of the wood compared to the study of []. The authors further stated that the LEL value decreases with a decrease in the size of the dust particles. This is probably another reason why the LEL values in Figure 8 are higher. In Figure 8, a sharp increase in pressure above a concentration of 90 g·m−3 can also be observed. This sharp increase is typical when the concentration of dust is high enough to ensure good flame spread. A further increase in concentration quickly increases the amount of fuel available for combustion, resulting in a much higher release of energy and consequently much higher pressure.
The rate of increase of explosion pressure depending on the concentration of a given wood dust is shown in the graph. We can notice that up to a concentration of 70 g·m−3, the value is zero. At a concentration of 80 g·m−3, the explosion pressure build-up value rises to 0.9 MPa. Subsequent concentrations also show values of explosion pressure build-up, indicating an explosion in an explosion autoclave (Figure 9).
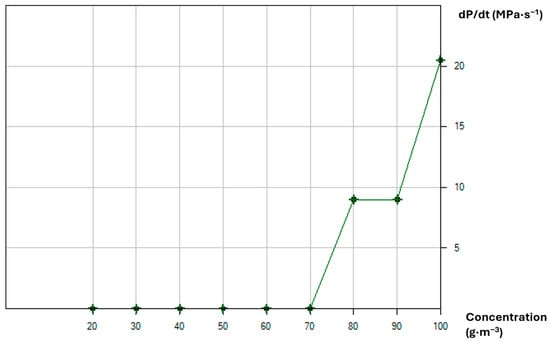
Figure 9.
LEL graph showing the increase in explosion pressure velocity versus the concentration of wood dust from the sander.
In previous experiments, the LEL was determined for several wood samples, including spruce []. The results achieved in this experiment are comparable to those. The results in Figure 8, Figure 9 and Figure 10 show that the dust analyzed after sanding can be classified as explosive dust class 2 (40 g·m−3 < LEL < 200 g·m−3). Considering the results of previous tests, it can be argued that the obtained dust has a high risk of explosion due to the low moisture content, small particle diameter, and low lower explosion limit of the dust. When comparing with the results of a previous study by [], it can be argued that the lower explosion limit of spruce dust had similar values (58 g·m−3).
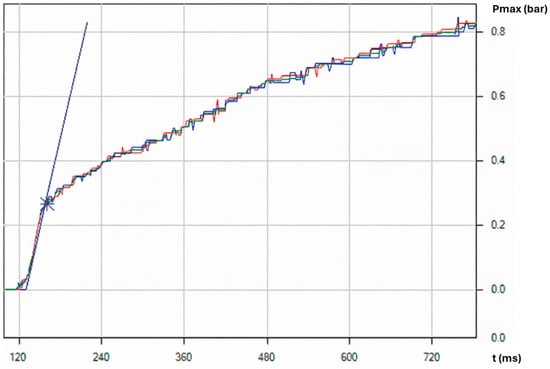
Figure 10.
LEL curve (ending at 80 g·m−3) for wood dust from the sander (different colors mean different measurements).
Figure 10 displays the explosion curve for a concentration of 80 g·m−3, which was previously determined to be the lower explosion limit. The curve shows the force of the explosion pressure as a function of time. Pressure rose sharply between 50 and 120 ms, as indicated by the curve. The increase in pressure was due to the spread of flames in the dust cloud and due to the production of a large volume of hot gases.
3.6. Lower Explosion Limit (LEL) of Spruce Wood Dust Depending on Particle Size
According to the research of [,], it is the average particle size that is the limiting element of the explosion. The research of [] shows that particles in the range of 96 µm to 180 µm have a lower explosion pressure than particles in the range of 50 µm to 96 µm. For this reason, the influence of dust particle size on the lower explosive limit was analyzed.
Table 2 shows the values of the lower explosive limit depending on mesh size, i.e., the size of the dust particles. The results were subjected to analysis of variance (ANOVA). The ANOVA showed that the size of the wood dust particles has a statistically significant effect on the values of the lower explosive limit (p = 0.031 at the α = 0.05 significance level). Nevertheless, as Table 2 already indicates, according to Duncan’s post-hoc test, a statistically significant change only occurs at particle sizes of 63 μm and above. In Table 2, as the particle size increases, the LEL values increase (a higher concentration is required for an explosion). The dust below 63 μm is more highly explosive than coarser wood dust particles. The particle size ranges from 63 μm to 500 μm and also includes the fraction with the largest percentage, according to Figure 6 (the 63 μm sieve). Although this fraction is composed of fine dust, the proportion of larger, coarser dust particles up to 500 μm statistically significantly increased the LEL values. The LEL data up to 63 μm are comparable to the results in the study of []. From 63 μm onwards, the LEL values in Table 2 are higher than in the authors’ study. The explanation is that the authors measured the LEL for particles up to 125 μm. From the point of view of explosion classes, it is therefore possible to categorize dust below 45 μm as class 1, i.e., highly explosive dust.

Table 2.
Lower explosion limit values depending on the mesh size, i.e., the wood dust particle size range. Values are determined from three measurements.
3.7. Explosion Pressure and Pressure Increase Rate of Spruce Wood Dust Depending on Concentration
Figure 11 shows a graph of the maximum explosion parameters for the wood sanding dust, showing the dependence of the maximum explosion pressure on concentration. Following the initial data processing, an analysis of variance (ANOVA) was carried out. Based on the results of the ANOVA, the concentration of wood dust has a significant effect on the maximum pressure (p = 0.000 at the α = 0.05 significance level) and maximum pressure rise rate (p = 0.000 at the α = 0.05 significance level). Similar results were also found in the study of [].
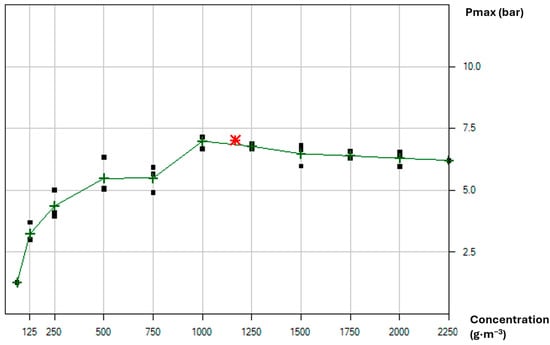
Figure 11.
Graph of maximum explosion parameters, with an increase in maximum pressure from the concentration of wood dust from the sander (red star = value of maximum explosion pressure; black square = different measurement; green cross = arithmetic mean).
From the explosion graph (Figure 11), it can be determined that the maximum explosion pressure of 7.4 bar is at a concentration of 1000 g·m−3. The increase in pressure at a concentration of 1000 g·m−3 was statistically significant according to Duncan’s post-hoc test. The explosion autoclave determined the average maximum explosion pressure between concentrations of 1000 g·m−3 and 1250 g·m−3, which is graphically represented by a red star. Pmax measured at concentrations of 1750 g·m−3, 2000 g·m−3, and 2250 g·m−3 are not statistically significantly different according to Duncan’s post-hoc test. The value of the maximum explosion pressure is similar to those of the studies of [,]; however, the maximum pressure in the case of this experiment was at a higher concentration. In the study of [] a maximum pressure of 7.95 bar was already reached at a concentration of 450 g·m−3, which is significantly lower than the measurements in Figure 11.
Figure 12 shows a graph of maximum explosion parameters for wood dust from a sander. It shows the dependence of the rate of increase of the maximum explosion pressure on the concentration. The findings from the explosion graph determine that the maximum rate of increase of the maximum explosion pressure is at a concentration of 2000 g·m−3. The explosion autoclave determined the maximum explosion pressure between concentrations of 1750 g·m−3 and 2000 g·m−3 using an average calculation, which is graphically represented by a red dot.
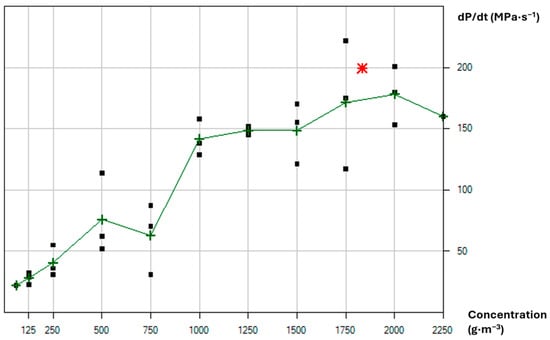
Figure 12.
Graph of the maximum explosion parameters of the rate of increase of the maximum explosion pressure from the concentration of wood dust from the sander (red star = value of the maximum rate of increase of the explosion pressure; black square = different measurement; green cross = arithmetic mean).
Figure 11 and Figure 12 show the results of tests in a 20−L ball for sanding dust. It was found that over the entire concentration range, the maximum pressure was 7.4 bar, the maximum pressure increase rate was 200 bar∙s−1, and the Kmax value was 54.3 m∙bar∙s−1 (according to Formula (1)). The lower explosion limit (LEL) was 80 g∙m−3. According to [], the measured maximum pressure increase rate is in the St 2 class—i.e., strongly explosive or impetuous explosion. It signifies that the wood dust has the potential for a stronger explosion.
As an example, the curve in Figure 13 shows the force of the explosion pressure at a concentration of 1000 g·m−3 depending on time. Compared to the studies of [,], it can be argued that the increase in pressure during the explosion occurs later, but just as rapidly. According to Figure 13, the maximum pressure was reached after 210 ms, when a significant amount of heat and gaseous products were generated in the autoclave. The hot combustion products in the vessel then maintained the pressure further.
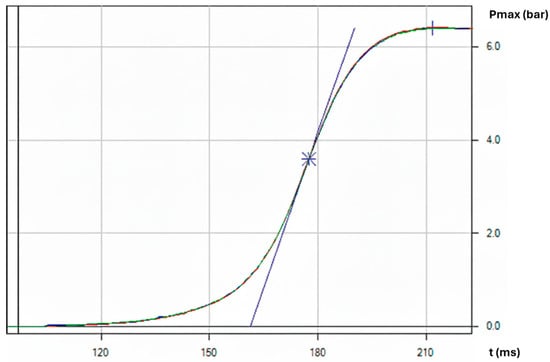
Figure 13.
Curve of maximum explosion parameters at a concentration of 1000 g·m−3 of wood dust from the sander (different colors mean different measurements).
According to the study of [], the maximum pressure increase rate KSt and Pmax are also affected by the size of the dust particles. The study showed that for particles in the range of 250 μm–500 μm, compared to particles in the range of 0 μm–63 μm, there is a decrease in both parameters, but the largest decrease is in KSt. The study [] also showed that for the same dust concentration, the explosion pressure increased with decreasing particle size. Since, according to Figure 6, the dust mixture also contains particles with a size of 250 μm–500 μm, these will have a lower explosion pressure. The reason, according to [], is that the smaller the particles, the larger the specific surface and the larger the contact surface between the particles and oxygen, which leads to a faster heat release during combustion. According to [], the maximum pressure increase rate is lower when the dust particles are larger. The study showed that for particles in the range of 25 μm–45 μm and in the range of 45 μm–71 μm, the pressure rises faster than for particles in the range of 90 μm–125 μm.
4. Conclusions
Spruce wood dust from a woodworking company was analyzed using a series of tests. The analyses in the presented paper focused on the evaluation of health, explosion risk, and thus fire risks for dust particles in operation. Dust taken from the sander in operation had an average moisture content of 8.42% ± 0.40%. This corresponded to the equilibrium moisture content of the wood (and therefore of the wood dust) in indoor conditions. Microscopic analysis showed that, in the collected dust mixture, there were particles from a few micrometers to particles of the order of hundreds of micrometers. The particles of wood dust were predominantly elongated and fibrous. Microscopic analysis on a digital microscope showed that the average dust particle had dimensions of 73.2 μm × 37.98 μm. The largest measured particle in the dust mixture was 499.71 μm × 403.30 μm. The smallest measured particle was 2.38 μm × 1.69 μm. The average measured aspect ratio value showed that the smallest particles were spherical in shape, while the largest particles were elongated and filamentous. The sieve analysis showed that the largest fraction in the mixture comprised dust particles with sizes of 63 μm to 75 μm. These accounted for up to 46.74% of the total dust mixture. The sieve analysis also revealed the proportion of very fine dust particles, which pose an immediate risk to the health of workers in the plant. Of the total analyzed share, 71% was airborne dust with a size below 100 μm. Dust particles below 10 μm (i.e., PM10) accounted for 5%, and dust particles below 2.5 μm (i.e., PM2.5) accounted for 1%. From tests carried out in an explosion autoclave, the lower explosion limit of the collected mixture of dust particles was determined at a concentration of 80 g·m−3 (explosion class 2). At a concentration of 90 g·m−3, there was a sharp increase in explosion pressure Pmax. This concentration was thus sufficient for the spread of the flame associated with the release of large amounts of energy. A sharp increase in pressure at the LEL value occurred after only 120 ms. At the same time, the experiment found a statistically significant effect of dust particle size on the LEL. The measured data showed that the LEL increased gradually with the increase of dust particles up to a size of 63 μm (explosion class 1). From 63 μm, the LEL value was significantly higher (explosion class 2). Thus, the results showed that for the same concentration of smaller dust particles, the lower explosion limit would be lower. Especially when sanding spruce wood, this poses a serious risk. The total collected mixture of dust particles from the sanding reached a maximum explosion pressure of 7.4 bar between concentrations of 1000 g·m−3 and 1250 g·m−3. The collected dust mixture had a maximum pressure increase rate of 200 bar∙s−1 (i.e., the calculated Kmax value was 54.3 m∙bar∙s−1). According to ATEX, the maximum pressure increase rate was classified as ST 2–strongly explosive or impetuous explosion.
The above results show that the analyzed mixture of dust particles from sanding spruce wood poses a serious risk to the health of workers in a woodworking company. Hazardous particles of the PM10 and PM2.5 categories were identified in the mixture. In addition, most of the dust particles were airborne particles. For this reason, it is necessary to ensure sufficient dust extraction from the belt sander section as well as protection of the upper respiratory tracts of workers (i.e., respiratory masks). The proposed solution is also to limit the movement of workers around the machine. The collected dust mixture also posed an explosion and fire risk. The measured values of the lower explosion limit and maximum pressure increase rate show that the dust mixture from the belt sander can be categorized as explosive, highly explosive, and reacting with an impetuous explosion. Organizational measures for explosion protection in accordance with ATEX 137 are therefore essential, in particular, daily cleaning and removal of the layer of settled dust on the ground around the machine, on the machine itself, on the hall structure, and on its parts (lights, stairs, etc.). An industrial vacuum cleaner suitable for explosive environments must be used. The central extraction system to which the belt sander is connected should be equipped with automatic explosion suppression. In this suction device technology, the filters are the most critical element. Since they are cleaned with air pulses, this area is classified as dangerous due to the risk of flammable dust explosion.
As part of future research into operational safety from the perspective of health, explosions, and, therefore, fire risks, the concentration values of PM dust particles in the working environment will be determined by measurement. The research into the morphology of dust particles, as well as their explosion parameters, may be extended to other types of wood in the future. In the present paper, spruce wood dust was investigated due to the production program of a wood processing company.
Author Contributions
E.M. set the main objectives of the research, performed conceptualization, performed experiment design, supervised and ensured the project administration, and acquired funding. R.K. provided an overview of the latest literature and assisted with sieve analysis and data evaluation. L.A. carried out translation, editing of the original draft into the template, and assisted with the measurement of explosion characteristics. All authors have read and agreed to the published version of the manuscript.
Funding
This work was supported by the Slovak Research and Development Agency under Contract no. APVV-22-0030.
Institutional Review Board Statement
Not applicable.
Informed Consent Statement
Not applicable.
Data Availability Statement
The data presented in this study are available upon request from the corresponding author.
Conflicts of Interest
The authors declare no conflicts of interest.
References
- Warguła, Ł.; Wilczyński, D.; Wieczorek, B.; Palander, T.; Gierz, L.; Nati, C.; Sydor, M. Characterizing Sawdust Fractional Composition from Oak Parquet Woodworking for Briquette and Pellet Production. Adv. Sci. Technol. Res. J. 2023, 17, 236–247. [Google Scholar] [CrossRef]
- Tong, R.; Cheng, M.; Zhang, L.; Liu, M.; Yang, X.; Li, X.; Yin, W. The construction dust-induced occupational health risk using Monte-Carlo simulation. J. Clean. Prod. 2018, 184, 598–608. [Google Scholar] [CrossRef]
- Çakiroğlu, E.O. Prediction of dust emissions during CNC milling of spruce and pine with machine learning. Eur. J. Wood Prod. 2025, 83, 173. [Google Scholar] [CrossRef]
- Pędzik, M.; Júda, M.; Kminiak, R.; Czerniejewska-Wolska, H.; Rogozinski, T. The Effect of Average Chip Thickness on The Potentially Respirable Dust from CNC Finish Milling of Wood-Based Materials. Drew. Pr. Nauk. Doniesienia Komun. = Wood Res. Pap. Rep. Announc. 2024; in press. [Google Scholar] [CrossRef]
- Chuchala, D.; Rogoziński, T.; Orlowski, K.A.; Pędzik, M.; Hanincová, L.; Eggertsson, O. Granulometric characterization of Arctic driftwood sawdust from frame sawing process. Ind. Crops Prod. 2024, 213, 118448. [Google Scholar] [CrossRef]
- Simon, C.; Donnot, A.; Méausoone, P.-J. Indoor wood dust analysis during machining with an original experimental device. Eur. J. Wood Prod. 2022, 80, 465–475. [Google Scholar] [CrossRef]
- Koleda, P.; Koleda, P.; Hrčková, M.; Júda, M.; Hortobágyi, Á. Experimental Granulometric Characterization of Wood Particles from CNC Machining of Chipboard. Appl. Sci. 2023, 13, 5484. [Google Scholar] [CrossRef]
- Çakıroğlu, E.O.; Demirarslan, K.O.; Taşdemir, T. Characterization of wood dust emission according to some wood species in 3D machining applied with CNC machine. Eur. J. Wood Prod. 2025, 83, 59. [Google Scholar] [CrossRef]
- Warguła, Ł.; Wieczorek, B.; Krystofiak, T.; Sydor, M. Impact of surface finishing technology on slip resistance of oak lacquer wood floorboards with distinct gloss levels. Wood Mater. Sci. Eng. 2024, 19, 1163–1172. [Google Scholar] [CrossRef]
- Majka, J.; Sydor, M.; Warguła, Ł.; Wieczorek, B. Anti-slip properties of thermally modified hardwoods. Eur. J. Wood Wood Prod. 2024, 83, 14. [Google Scholar] [CrossRef]
- Sydor, M.; Mirski, R.; Stuper-Szablewska, K.; Rogoziński, T. Efficiency of Machine Sanding of Wood. Appl. Sci. 2021, 11, 2860. [Google Scholar] [CrossRef]
- Pędzik, M.; Stuper-Szablewska, K.; Sydor, M.; Rogoziński, T. Influence of Grit Size and Wood Species on the Granularity of Dust Particles during Sanding. Appl. Sci. 2020, 10, 8165. [Google Scholar] [CrossRef]
- Hanincová, L.; Pędzik, M.; Majka, J.; Sydor, M.; Rogoziński, T. Influence of thermal modification and sanding parameters on finest particle content in pinewood dust. Wood Mater. Sci. Eng. 2024, 19, 887–895. [Google Scholar] [CrossRef]
- Ratnasingam, J.; Scholz, F.; Natthondan, V.; Graham, M. Dust-generation characteristics of hardwoods during sanding processes. Eur. J. Wood Prod. 2011, 69, 127–131. [Google Scholar] [CrossRef]
- Yuan, N.; Zhang, J.; Lu, J.; Liu, H.; Sun, P. Analysis of Inhalable Dust Produced in Manufacturing of Wooden Furniture. BioResources 2014, 9, 7257–7266. [Google Scholar] [CrossRef]
- Pędzik, M.; Rogoziński, T.; Majka, J.; Stuper-Szablewska, K.; Antov, P.; Kristak, L.; Kminiak, R.; Kučerka, M. Fine Dust Creation during Hardwood Machine Sanding. Appl. Sci. 2021, 11, 6602. [Google Scholar] [CrossRef]
- Marková, I.; Hroncová, E.; Tomaškin, J.; Tureková, I. Thermal Analysis of Granulometry Selected Wood Dust Particles. BioResources 2018, 13, 8041–8060. [Google Scholar] [CrossRef]
- Callé, S.; Klaba, L.; Thomas, D.; Perrin, L.; Dufaud, O. Influence of the size distribution and concentration on wood dust explosion: Experiments and reaction modelling. Powder Technol. 2005, 157, 144–148. [Google Scholar] [CrossRef]
- Santamaría-Herrera, A.; Hoyuelos, F.J.; Casado-Marcos, C. Characterization of the explosiveness of wood dust. Process Saf. Environ. Prot. 2023, 169, 252–259. [Google Scholar] [CrossRef]
- Welling, I.; Lehtimäki, M.; Rautio, S.; Lähde, T.; Enbom, S.; Hynynen, P.; Hämeri, K. Wood Dust Particle and Mass Concentrations and Filtration Efficiency in Sanding of Wood Materials. J. Occup. Environ. Hyg. 2008, 6, 90–98. [Google Scholar] [CrossRef]
- Eckhoff, R.K. Current status and expected future trends in dust explosion research. J. Loss Prev. Process Ind. 2005, 18, 225–237. [Google Scholar] [CrossRef]
- Warguła, Ł.; Kaczmarzyk, P.; Anna, D. The Assessment of Fire Risk of Non-road Mobile Wood Chopping Machines. J. Res. Appl. Agric. Eng. 2019, 64, 58–64. [Google Scholar]
- Przybysz, J.; Celiński, M.; Kozikowski, P.; Mizera, K.; Borucka, M.; Gajek, A. Flammability and explosion characteristics of hardwood dust. J. Fire Sci. 2023, 41, 89–101. [Google Scholar] [CrossRef]
- Krentowski, J. Disaster of an industrial hall caused by an explosion of wood dust and fire. Eng. Fail. Anal. 2015, 56, 403–411. [Google Scholar] [CrossRef]
- Proto, A.R.; Zimbalatti, G.; Negri, M. The Measurement and Distribution of Wood Dust. J Agric. Eng. 2010, 41, 25. [Google Scholar] [CrossRef]
- Guo, L.; Xiao, Q.; Zhu, N.; Wang, Y.; Xu, C. Comparative studies on the explosion severity of different wood dusts from fiberboard production. BioRes 2019, 14, 3182–3199. [Google Scholar] [CrossRef]
- Eckhoff, R.K. Explosion Hazards in the Process Industries; Gulf Professional Publishing: Houston, TX, USA, 2016; ISBN 978-0-12-803273-2. [Google Scholar]
- Eckhoff, R.K.; Li, G. Industrial Dust Explosions. A Brief Review. Appl. Sci. 2021, 11, 1669. [Google Scholar] [CrossRef]
- Pérez-Peña, N.; Valenzuel, L.; Diaz-vaz, J.E.; Ananías, R.A. Prediction of equilibrium moisture content in wood in relation to the specific gravity of the cell wall and environmental variables. Maderas. Cienc. Tecnol. 2011, 13, 253–266. [Google Scholar] [CrossRef]
- Dudarski, G.; Kowal, M.; Czestochowski, C. Dust explosion hazard in wood processing. Ann. Wars. Univ. Life Sci.—SGGW. For. Wood Technol. 2015, 90, 61–65. [Google Scholar]
- Zhou, X.; Li, X.; Cui, Z.; Wu, L.; Zhou, H.; Lu, X. Combustible wood dust explosions and impacts on environments and health—A review. Environ. Res. 2023, 216, 114658. [Google Scholar] [CrossRef]
- Li, C.; Zhang, Z.; Sun, K.; He, C.; Yuan, C. Ignition characteristics of mixtures of micro-sized wood dusts and centimeter-sized flakes and fibers initiated by deposit fires. J. Loss Prev. Process Ind. 2025, 94, 105575. [Google Scholar] [CrossRef]
- Chang, S.-C.; Cheng, Y.-C.; Zhang, X.-H.; Shu, C.-M. Effects of moisture content on explosion characteristics of incense dust in incense factory. J Therm. Anal. Calorim. 2022, 147, 2885–2892. [Google Scholar] [CrossRef]
- Shamssain, M.H. Pulmonary function and symptoms in workers exposed to wood dust. Thorax 1992, 47, 84–87. [Google Scholar] [CrossRef]
- Rekhadevi, P.V.; Mahboob, M.; Rahman, M.F.; Grover, P. Genetic damage in wood dust-exposed workers. Mutagenesis 2009, 24, 59–65. [Google Scholar] [CrossRef]
- Pérez-Escuredo, J.; Martínez, J.G.; Vivanco, B.; Marcos, C.Á.; Suárez, C.; Llorente, J.L.; Hermsen, M.A. Wood dust-related mutational profile of TP53 in intestinal-type sinonasal adenocarcinoma. Hum. Pathol. 2012, 43, 1894–1901. [Google Scholar] [CrossRef] [PubMed]
- Löfstedt, H.; Hagström, K.; Bryngelsson, I.-L.; Holmström, M.; Rask-Andersen, A. Respiratory symptoms and lung function in relation to wood dust and monoterpene exposure in the wood pellet industry. Upsala J. Med. Sci. 2017, 122, 78–84. [Google Scholar] [CrossRef] [PubMed]
- Kargar-Shouroki, F.; Dehghan Banadkuki, M.R.; Jambarsang, S.; Emami, A. The association between wood dust exposure and respiratory disorders and oxidative stress among furniture workers. Wien. Klin. Wochenschr. 2022, 134, 529–537. [Google Scholar] [CrossRef]
- Dalin, H.U.; Yiming, L.I.U.; Dongsheng, T. Relation between environmental pollution caused by free SiO2 dust and lipid peroxidation in erythrocyte membrane in human. Chin. J. Public Health 2005, 21, 1273–1274. [Google Scholar]
- Riva, D.R.; Magalhães, C.B.; Lopes, A.A.; Lanças, T.; Mauad, T.; Malm, O.; Valença, S.S.; Saldiva, P.H.; Faffe, D.S.; Zin, W.A. Low dose of fine particulate matter (PM2.5) can induce acute oxidative stress, inflammation and pulmonary impairment in healthy mice. Inhal. Toxicol. 2011, 23, 257–267. [Google Scholar] [CrossRef] [PubMed]
- Wang, Y.-L.; Gao, W.; Li, Y.; Wang, Y.-F. Concentration-dependent effects of PM2.5 mass on expressions of adhesion molecules and inflammatory cytokines in nasal mucosa of rats with allergic rhinitis. Eur. Arch. Otorhinolaryngol. 2017, 274, 3221–3229. [Google Scholar] [CrossRef]
- Tobin, E. Occupational Exposure to Wood Dust and Respiratory Health Status of Sawmill Workers in South-South Nigeria. J. Pollut. Eff. Control 2015, 4, 1000154. [Google Scholar] [CrossRef]
- Scheeper, B. Wood-dust exposure during wood-working processes. Ann. Occup. Hyg. 1995, 39, 141–154. [Google Scholar] [CrossRef]
- Ojima, J. Generation rate and particle size distribution of wood dust by handheld sanding operation. J. Occup. Health 2016, 58, 640–643. [Google Scholar] [CrossRef]
- Salthammer, T.; Gu, J.; Gunschera, J.; Schieweck, A. Release of chemical compounds and particulate matter. In Springer Handbook of Wood Science and Technology; Springer: Berlin/Heidelberg, Germany, 2023; pp. 1949–1974. [Google Scholar] [CrossRef]
- Thorpe, A.; Brown, R.C. Factors Influencing the Production of Dust During the Hand Sanding of Wood. Am. Ind. Hyg. Assoc. J. 1995, 56, 236–242. [Google Scholar] [CrossRef]
- ISO 1666:1996; Starch—Determination of Moisture Content—Oven-Drying Method. ISO: Geneva, Switzerland, 1996.
- EN 14034-2+A1; Determination of Explosion Characteristics of Dust Clouds. Part 2: Determination of the Maximum rate of Explosion Pressure rise (dp/dt)max of Dust Clouds. European Committee for Standardization: Brussels, Belgium, 2010.
- Tureková, I.; Marková, I. Ignition of Deposited Wood Dust Layer by Selected Sources. Appl. Sci. 2020, 10, 5779. [Google Scholar] [CrossRef]
- Stasiak, M.; Molenda, M.; Bańda, M.; Gondek, E. Mechanical properties of sawdust and woodchips. Fuel 2015, 159, 900–908. [Google Scholar] [CrossRef]
- Očkajová, A.; Beljakova, A.; Siklienka, M. Morphology of dust particles from the sanding process ofthe chosen tree species. Wood Res. 2010, 55, 89–98. [Google Scholar]
- Očkajová, A.; Kučerka, M.; Kminiak, R.; Banski, A. Sustainable Manufacturing Process in the Context of Wood Processing by Sanding. Coatings 2021, 11, 1463. [Google Scholar] [CrossRef]
- Mazzoli, A.; Favoni, O. Particle size, size distribution and morphological evaluation of airborne dust particles of diverse woods by Scanning Electron Microscopy and image processing program. Powder Technol. 2012, 225, 65–71. [Google Scholar] [CrossRef]
- Ding, T.; Zhao, J.; Zhu, N.; Wang, C. A comparative study of morphological characteristics of medium-density fiberboard dust by sieve and image analyses. J. Wood Sci. 2020, 66, 55. [Google Scholar] [CrossRef]
- Očkajová, A.; Beljaková, A.; Luptáková, J. Selected properties of spruce dust generated from sanding operations. Wood Ind./Drv. Ind. 2008, 59, 3–10. [Google Scholar]
- Sydor, M.; Majka, J.; Hanincová, L.; Kučerka, M.; Kminiak, R.; Kristak, L.; Pędzik, M.; Očkajová, A.; Rogoziński, T. Fine dust after sanding untreated and thermally modified spruce, oak, and meranti wood. Eur. J. Wood Prod. 2023, 81, 1455–1464. [Google Scholar] [CrossRef]
- He, Z.; Yang, H.-T.; Chen, Z.-J.; Ma, H.-H.; Zhang, X.-L.; Wang, L.-Q.; Shen, Z.-W. Explosion Characteristics of Layered Wood Dust with High Pressure Oxygen. Energy Sci. Eng. 2025, 13, 4944–4954. [Google Scholar] [CrossRef]
- Očkajová, A.; Kučerka, M.; Krišťák, L.; Igaz, R. Granulometric Analysis of Sanding Dust from Selected Wood Species. BioResources 2018, 13, 7481–7495. [Google Scholar] [CrossRef]
- Hlaskova, L.; Rogozinski, T.; Dolny, S.; Kopecky, Z.; Jedinak, M. Content of respirable and inhalable fractions in dust created while sawing beech wood and its modifications. Drew. Pr. Nauk. Doniesienia Komun. 2015, 58, 135–146. [Google Scholar] [CrossRef]
- Beljo-Lučić, R.; Čavlović, A.; Antonović, A.; Vujasinović, E.; Šimičić, I. Properties of chipped wood generated during mechanical wood processing. Drv. Ind. 2005, 56, 11–19. [Google Scholar]
- ISO 17225-1:2020; Solid Biofuels—Fuel Specifications and Classes—Part 1: General Requirements. ISO: Geneva, Switzerland, 2020.
- Sisler, J.D.; Mandler, W.K.; Shaffer, J.; Lee, T.; McKinney, W.G.; Battelli, L.A.; Orandle, M.S.; Thomas, T.A.; Castranova, V.C.; Qi, C.; et al. Toxicological assessment of dust from sanding micronized copper-treated lumber in vivo. J. Hazard. Mater. 2019, 373, 630–639. [Google Scholar] [CrossRef]
- Dado, M.; Lamperová, A.; Kotek, L.; Hnilica, R. An Evaluation of On-Tool System for Sanding Dust Collection: Pilot Study. Manag. Syst. Prod. Eng. 2020, 28, 184–188. [Google Scholar] [CrossRef]
- Vandličková, M.; Marková, I.; Makovická-Osvaldová, L.; Gašpercová, S.; Svetlík, J. Evaluation of African padauk (Pterocarpus soyauxii) explosion dust. BioRes 2019, 15, 401–414. [Google Scholar] [CrossRef]
- Kuracina, R.; Szabová, Z.; Balog, K. Study of Selected Fire Characteristics of Beech Wood Depending on Particle Size. In Wood & Fire Safety, Proceedings of the 9th International Conference on Wood & Fire Safety 2020, Strbske Pleso, Slovakia, 14 March 2020; Makovicka Osvaldova, L., Markert, F., Zelinka, S.L., Eds.; Springer International Publishing: Cham, Switzerland, 2020; pp. 16–21. [Google Scholar]
- Pang, Z.; Zhu, N.; Cui, Y.; Li, W.; Xu, C. Experimental investigation on explosion flame propagation of wood dust in a semi-closed tube. J. Loss Prev. Process Ind. 2020, 63, 104028. [Google Scholar] [CrossRef]
- Martinka, J.; Rantuch, P.; Balog, K. Assessment of the impact of spruce wood particle size and water content on the ignition temperature of dust clouds. Cellul. Chem. Technol. 2015, 49, 549–558. [Google Scholar]
- Kminiak, R.; Kučerka, M.; Kristak, L.; Reh, R.; Antov, P.; Očkajová, A.; Rogoziński, T.; Pędzik, M. Granulometric Characterization of Wood Dust Emission from CNC Machining of Natural Wood and Medium Density Fiberboard. Forests 2021, 12, 1039. [Google Scholar] [CrossRef]
- Saejiw, N.; Chaiear, N.; Sadhra, S. Exposure to Wood Dust and Its Particle Size Distribution in a Rubberwood Sawmill in Thailand. J. Occup. Environ. Hyg. 2009, 6, 483–490. [Google Scholar] [CrossRef]
- Zhang, X.; Kang, J.; Chen, H.; Yao, M.; Wang, J. PM2.5 Meets Blood: In vivo Damages and Immune Defense. Aerosol Air Qual. Res. 2018, 18, 456–470. [Google Scholar] [CrossRef]
- Thangavel, P.; Park, D.; Lee, Y.-C. Recent Insights into Particulate Matter (PM2.5)-Mediated Toxicity in Humans: An Overview. Int. J. Environ. Res. Public Health 2022, 19, 7511. [Google Scholar] [CrossRef]
- Castells, B.; Varela, A.; Castillo-Ruiz, F.J.; Calvo, L.F.; Medic, L.; Tascón, A. Ignition and explosion characteristics of olive-derived biomasses. Powder Technol. 2023, 420, 118386. [Google Scholar] [CrossRef]
- Przybysz, J.; Celiński, M.; Mizera, K.; Gloc, M.; Borucka, M.; Gajek, A. Flammability and explosion characteristics of softwood dust. J. Therm. Anal. Calorim. 2023, 148, 10727–10733. [Google Scholar] [CrossRef]
- Mráčková, E.; Milanko, V.; Gavanski, D.; Simedić, B. Rozbor vybraných dezintegrovaných vzoriek dreva z pohľadu výbušnosti a zdravotného rizika. Delta 2013, 7, 16–22. [Google Scholar]
- Kim, Y.S.; Lee, M.C.; Rie, D.H. Explosion characteristics of combustible wood dust in confined system: Analysis using oxygen consumption energy. J. Mech. Sci. Technol. 2016, 30, 5771–5779. [Google Scholar] [CrossRef]
- Huéscar Medina, C.; Phylaktou, H.N.; Andrews, G.E.; Gibbs, B.M. Explosion characteristics of pulverised torrefied and raw Norway spruce (Picea abies) and Southern pine (Pinus palustris) in comparison to bituminous coal. Biomass Bioenergy 2015, 79, 116–127. [Google Scholar] [CrossRef]
- Damec, J. Protivýbuchová Prevence, 1st ed.; Edice SBPI Spektrum 8: Ostrava, Czech Republic, 2005; ISBN 80-86111-21-0. [Google Scholar]
- Kuracina, R.; Zuzana, S.; Cekan, P. Determination of the Maximum Explosion Pressure and the Maximum Rate of Pressure Rise During Explosion of Wood Dust Clouds. Res. Pap. Fac. Mater. Sci. Technol. Slovak Univ. Technol. 2015, 23, 48–56. [Google Scholar] [CrossRef]
- Bartknecht, W. Explosionsschutz: Grundlagen und Anwendung; Springer: Berlin/Heidelberg, Germany, 2011; ISBN 978-3-642-77516-1. [Google Scholar]
Disclaimer/Publisher’s Note: The statements, opinions and data contained in all publications are solely those of the individual author(s) and contributor(s) and not of MDPI and/or the editor(s). MDPI and/or the editor(s) disclaim responsibility for any injury to people or property resulting from any ideas, methods, instructions or products referred to in the content. |
© 2025 by the authors. Licensee MDPI, Basel, Switzerland. This article is an open access article distributed under the terms and conditions of the Creative Commons Attribution (CC BY) license (https://creativecommons.org/licenses/by/4.0/).