Article

Characteristics and Delineation of Temporary Wetland in Lava Forest, Jeju Island

1
Warm Temperate and Subtropical Forest Research Center, National Institute of Forest Science, Seogwipo 63582, Jeju-do, Republic of Korea
2
Forest Policy Division, Forest Industry and Policy Bureau, Korea Forest Service, Deajeon-si 35208, South Chungcheong, Republic of Korea
*
Author to whom correspondence should be addressed.
Forests 2025, 16(12), 1770; https://doi.org/10.3390/f16121770
Submission received: 24 October 2025 / Revised: 18 November 2025 / Accepted: 20 November 2025 / Published: 25 November 2025
(This article belongs to the Section Forest Hydrology)

Abstract

Temporary wetlands are ecosystems formed by seasonal or intermittent inundation that provide habitats and support hydrological and biogeochemical processes. Despite their importance, they are often overlooked due to their small size and ephemeral nature. The lava forest of Jeju Island, known as Gotjawal, is a rare ecosystem where temporary wetlands occur despite the high permeability of basaltic terrain. This study reports an assessment of temporary wetlands in the Seonheul Gotjawal forest, focusing on identification, boundary delineation, and key characteristics. Wetlands were identified using four years (2020–2023) of water level monitoring and vegetation surveys. Hydrological boundaries were defined by maximum observed water levels, and ecological boundaries were delineated from plant distribution. Ecological boundaries consistently fell within hydrological ones, showing the value of vegetation indicators in wetland identification. Wetland areas ranged from 347–1214 m2, with average depths of 0.2–0.9 m and hydroperiods of 13–76%. Water levels correlated with total rainfall. Three geomorphological wetland types were distinguished, with the shortest hydroperiods observed in small lava depressions functioning as forest microhabitats for endemic species. This study provides the first integrated evaluation of temporary wetlands in the Gotjawal lava forest and offers baseline data for classification and conservation.

1. Introduction

Temporary wetlands are individually small but ecologically significant components of the landscape. Previous global assessments have shown that small waterbodies—including ponds and small lakes—have been substantially underestimated in surface-area inventories, and that they play disproportionately important roles in hydrological and biogeochemical processes such as carbon cycling and denitrification [1,2,3,4]. Among various types of small and shallow waterbodies, temporary wetlands represent some of the most dynamic and ecologically significant systems. They also serve as habitats for a wide range of flora and fauna, enhance biodiversity at the landscape level, and introduce temporary or semi-permanent aquatic elements to terrestrial ecosystems [5,6,7,8]. Nevertheless, their ecological value is often underestimated due to characteristics such as small size, irregularity, and short hydroperiods, making them vulnerable to ongoing disturbance and degradation [9,10,11,12,13,14,15].
Wetlands are generally defined based on biological indicators, physical indicators such as hydrology and hydric soils, and legal or policy-based criteria [16]. Biological indicators refer to wetland-specific plants and animals, while physical indicators include direct or indirect evidence of inundation. Among these, temporary wetlands are defined as shallow depressions where surface water accumulates periodically or irregularly and then dries intermittently [10].
Deil [17] categorized temporary wetlands into three major types based on geomorphological, hydrological, and climatic conditions. The first type is the shoreline habitat, which forms around permanent wetlands, particularly in perhumid extratropical temperate climatic zones. These include shallow freshwater lakes, artificial ponds, and riverbanks, and are influenced by increased evapotranspiration in summer, reduced precipitation, and short dry seasons. The second is the ephemeral flush habitat, which occurs in intermittent streams or temporary channels that flow only after torrential rainfall. These are mostly found on rocky outcrops in subtropical regions or on tropical inselbergs. The third is the seasonal pool habitat, which occurs in subhumid areas near the Tropic of Cancer and Tropic of Capricorn, including dry tropical and semi-arid regions. These pools are formed by seasonal rainfall, surface runoff, and rising groundwater levels during the wet season. Such temporary wetlands vary greatly in size and shape and are sometimes classified by the season of formation (e.g., vernal, aestival, autumnal, or hibernal pools). They are also named differently depending on regional and geomorphological features, such as playas, pans, daya, turloughs, or gilgais.
The Gotjawal lava forest in Jeju Island, located in a humid subtropical climate, has climatic conditions suitable for the formation of shoreline habitats. However, due to the area’s geomorphological traits—specifically the difficulty in retaining and storing surface water [18]—permanent lakes and perennial streams are extremely rare, limiting the formation of shoreline habitats. The Seonheul Gotjawal region in northeastern Jeju is a unique site where both seasonal temporary wetlands and permanent wetlands coexist under the combined influence of a humid climate and lava terrain. Despite this uniqueness, research on wetlands in this area has been limited. Existing studies have mainly focused on vegetation structure [19,20], distribution of the endemic fern Mankyua chejuense [21,22], fungi and pteridophytes [23,24], and ecotourism and community issues [25,26,27]. Water-related studies have addressed groundwater recharge potential in Gotjawal [28,29], hydrogeomorphological analysis of Jeju’s mountainous regions [30], and past wetland distribution surveys [31]. However, only one study [32] has specifically focused on temporary wetlands, comparing their vegetation with that of permanent wetlands.
The temporary wetlands of Seonheul Gotjawal have rarely been clearly identified or recognized. In the absence of hydrological data, some of these sites, including those in this study, had been tentatively assumed to represent upland terrain undergoing terrestrialization. However, subsequent field observations indicate that these areas function as rainfall-dependent temporary wetlands formed under unique lava-forest conditions. As a result, studies on their distribution, identification criteria, and management strategies remain limited, placing these wetlands in a blind spot for conservation and management. This study aims to establish baseline data on temporary wetlands formed in lava forest terrains by conducting field-based characterization using water level sensors and vegetation surveys, delineating their boundaries, and quantitatively analyzing their geomorphological and hydrological characteristics.

2. Materials and Methods

2.1. Study Area

This study was conducted in temporary wetlands located within the Gotjawal lava forest in Seonheul-ri, Jocheon-eup, Jeju-si, Jeju Island, Republic of Korea (Figure 1). Jeju Island is a volcanic island approximately 32 km wide and 74 km long, with a total area of about 1825 km2. Halla Mountain, with an elevation of 1950 m above sea level, stands at the center of the island. The surface geology is primarily composed of basaltic lava and pyroclastic deposits, and the area is covered with relatively shallow soils [33]. The Seonheul Gotjawal area, the focus of this study, is located on a basaltic plateau in the northeastern part of the island, at elevations between 90 and 155 m. The terrain has gentle slopes of less than 10° and is mainly characterized by pāhoehoe lava formations. The lava sheet is typically thin—around 3 m—and features microtopographic elements such as small lava tubes, tumuli, and lava depressions [34].
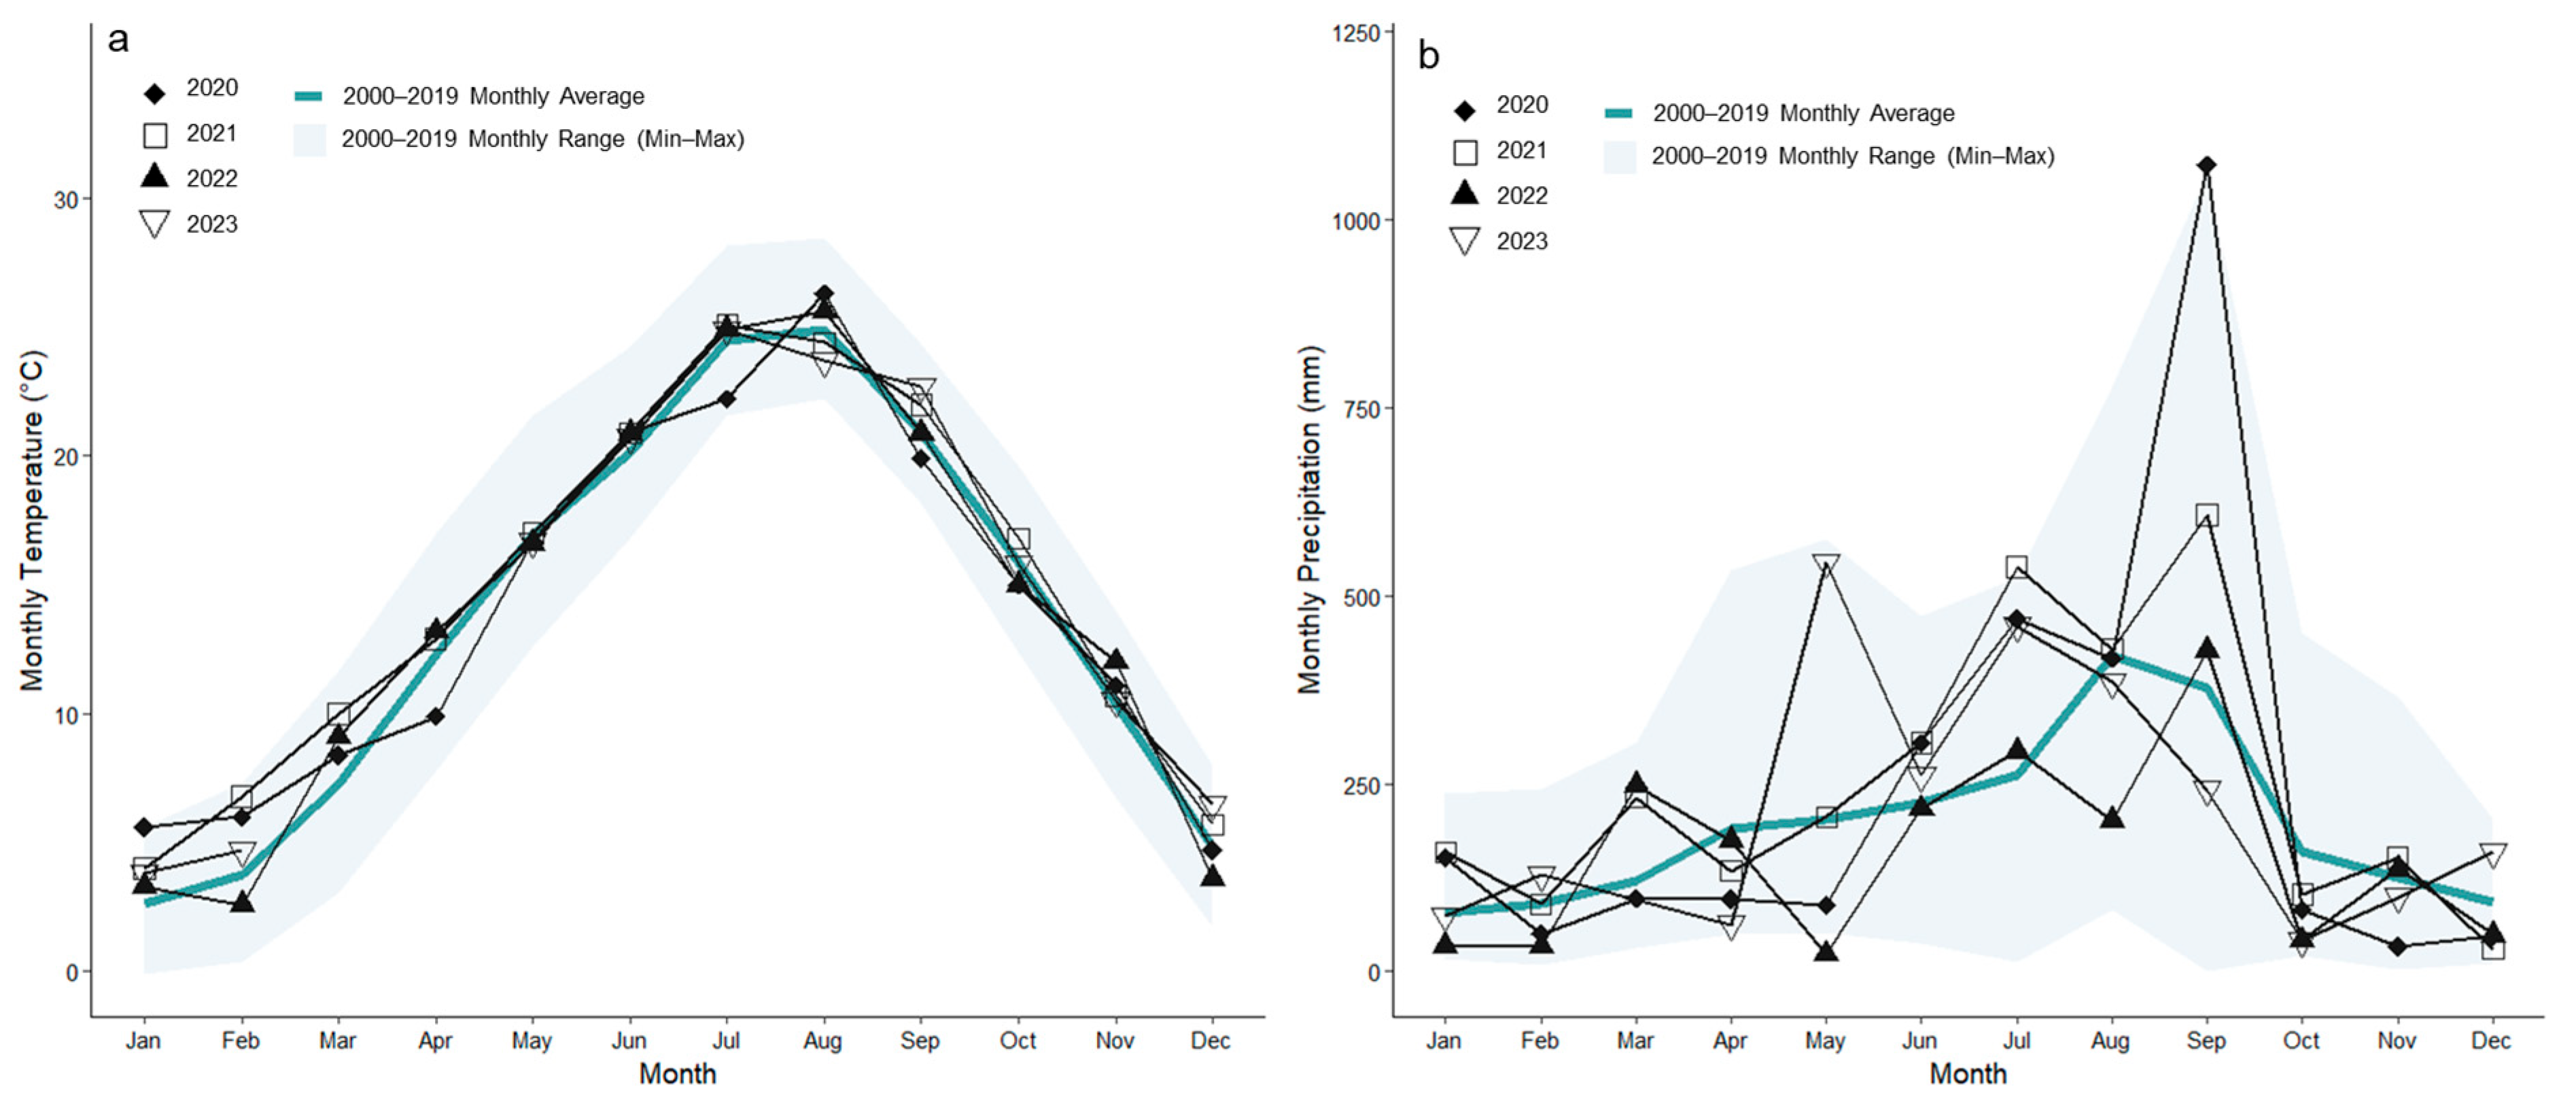
Meteorological data were obtained from the nearest Korea Meteorological Administration AWS station, Wasan AWS [35]. The long-term (2000–2019) average annual temperature was 13.7 °C, and the average annual precipitation was 2365 mm (Figure 2). During the study period (2020–2023), the average annual temperature was 14.3 °C and the average annual precipitation was 2554 mm. Monthly averages for the study period are presented in Figure 2.
To select the study sites, areas within the study region that had the potential to form temporary wetlands were first explored. Aerial/satellite imagery from 2008, available through the Korean mapping platform KakaoMap, was reviewed to locate scenes in which temporary surface water was visible. Within the publicly accessible interface, detailed metadata such as the exact acquisition date or sensor information could not be identified. Based on this pre-screening, field surveys were conducted to assess candidate sites.
As a result, five sites with diverse conditions were selected based on observed geomorphological, hydrological and vegetation characteristics:
  • One site (W1) with hydrological and vegetative conditions similar to a permanent wetland;
  • Two sites (W2, W3) characterized by dry surfaces and prominent basalt block distribution;
  • Two sites (W4, W5) located in grassland-type areas with dry surfaces and topsoil presence.
These five sites were selected to represent a range of geomorphological, hydrological, and vegetation conditions, aiming to encompass the potential diversity of temporary wetland types in the area (Table S1).

2.2. Wetland Identification

2.2.1. Water Level Monitoring

Wetlands are generally defined as areas where water is present either permanently or temporarily, resulting in saturated or flowing conditions [36]. Therefore, the most direct and reliable method for identifying temporary wetlands is to monitor whether standing water actually occurs. In this study, observation pipes were installed at the deepest point of each wetland site in 2019. Pressure-type water level loggers (Orpheus Mini, OTT HydroMet, Kempten, Germany; CTD-10, METER, WA, USA) were installed to monitor water levels. Data collection began on 1 January 2020, with measurements recorded automatically at 10 min intervals. Since the sensors require submersion of at least 35 mm to operate accurately, only water levels exceeding 35 mm were considered valid. The collected data were converted into hourly averages and used to calculate various hydrological indicators, including mean and maximum water levels, annual ponding frequency, and duration of inundation.
To quantify the degree of wetland formation, a Hydro Period Index (HPi) was calculated. HPi reflects the persistence of inundation and is defined as the ratio of the total time a site remains ponded to the total observation period [37]. An HPi value close to 1 indicates a site that remains inundated year-round, while a value near 0 indicates terrestrial conditions with little or no ponding.
The formula is as follows:
HPi = Tponded/Ttotal
where Tponded is the total time, the site remained inundated, and Ttotal is the total duration of the analysis period (monthly or yearly).

2.2.2. Vegetation Characteristics

Because temporary wetlands have limited and irregular hydroperiods, it is difficult to fully assess their wetland function using water level data alone. Therefore, to evaluate wetland presence more precisely, this study also analyzed three vegetation-based indices: Wetland plants rate, Prevalence Index (PI), and Hydrophytic Cover Index (HCI).
First, the wetland plants rate was calculated based on the wetland preference categories of recorded vascular plant species. The classification followed the criteria of the National Institute of Biological Resources [38], which is based on the five-category system proposed by the U.S. Army Corps of Engineers [39] (Table 1). Every species documented in this study was included in the database employed for the determination of wetland preference [39].
The wetland plants rate is calculated using the following formula:
Wetland plants rate = ((NOBW + NFACW)/(NOBW + NFACW + NFAC + NFACU + NOBU)) × 100
where N represents the number of species, and subscripts refer to wetland preference categories (Table 1).
The PI is calculated by applying weightings to the cover values of plant species, following the method of Lichvar and Gillrich [40]. The HCI is calculated according to Wentworth and Johnson [41] as the proportion of total vegetative cover composed of species in the OBW, FACW, and FAC categories. The formulas are as follows:
PI = (SOBW + 2SFACW + 3SFAC + 4SFACU + 5SOBU)/(SOBW + SFACW + SFAC + SFACU + SOBU)
HCI = ((SOBW + SFACW + SFAC)/(SOBW + SFACW + SFAC + SFACU + SOBU)) × 100
Here, S indicates the sum of cover values for each wetland preference category, and the subscripts denote the respective categories (Table 1).
A PI value of ≤3.0 indicates that the area is considered a wetland, while a value > 4.0 suggests a non-wetland condition. Values between 2.5 and 3.5 are considered transitional and require supplemental hydrological or soil data. For HCI, values ≥ 50% generally indicate that the area qualifies as a wetland. We used the site-level annual mean HCI and PI as conservative summary indicators for the delineated wetland units.
Vegetation cover was surveyed using the quadrat method. The outer boundary of wetland vegetation within the maximum water level boundary was determined, and an actual vegetation map was created based on dominant species (Table S2). Sampling plots were then established by zone. Because of seasonal variability in vegetation, the number and size of plots were adjusted at each survey. Site- and month-specific plot design is summarized in Table S3. Field surveys were conducted in June, August, September, October, and November of 2023. Species cover was quantified using the Braun-Blanquet scale, which includes a 9-point cover-abundance rating as proposed by Westhoff and van der Maarel [42].

2.3. Wetland Boundary Delineation

Wetland boundaries are commonly delineated using factors such as responsible management authority (e.g., protected-area polygons), wetland type, physical structure, hydrological conditions, vegetation indicators, GIS, and satellite imagery [39,43,44]. In this study, both hydrological and ecological indicators were considered to delineate wetland boundaries. To identify the physical extent of ponded areas, a Digital Elevation Model (DEM) was generated using a mobile terrestrial LiDAR device (ZEB Horizon, GeoSlam, Nottinghamshire, UK) in April 2023. Based on the DEM, hydrological boundaries were defined using the maximum water levels observed for at least one continuous hour during the four-year monitoring period at each water level sensor location.
Ecological boundaries were determined using drone imagery (M300, DJI) captured concurrently with vegetation surveys in 2023. Actual vegetation maps were produced for each survey period, and the outermost occurrence of OBW and FACW species was used to define the ecological boundary. The widest spatial extent observed during the study period was adopted as the final ecological boundary. Because OBW and FACW species typically occur in wetlands with a probability of 70%–98%, their presence at a given location is interpreted as a strong ecological indicator of wet conditions. Given the relatively small size of the study sites and the clarity of ecological boundaries observed through drone imagery and field surveys, GPS-based boundary tracking was not separately conducted.

2.4. Wetland Characteristics

2.4.1. Geomorphological and Soil Characteristics

To analyze the geomorphological features of the study sites, DEM data were processed using QGIS 3.30.2. Parameters such as elevation, area, perimeter, Shape Index (SI), and cross-sectional profiles of the wetlands were analyzed. The SI was calculated using the following formula [45]:
SI = Perimeter/(2 × √(π × Area))
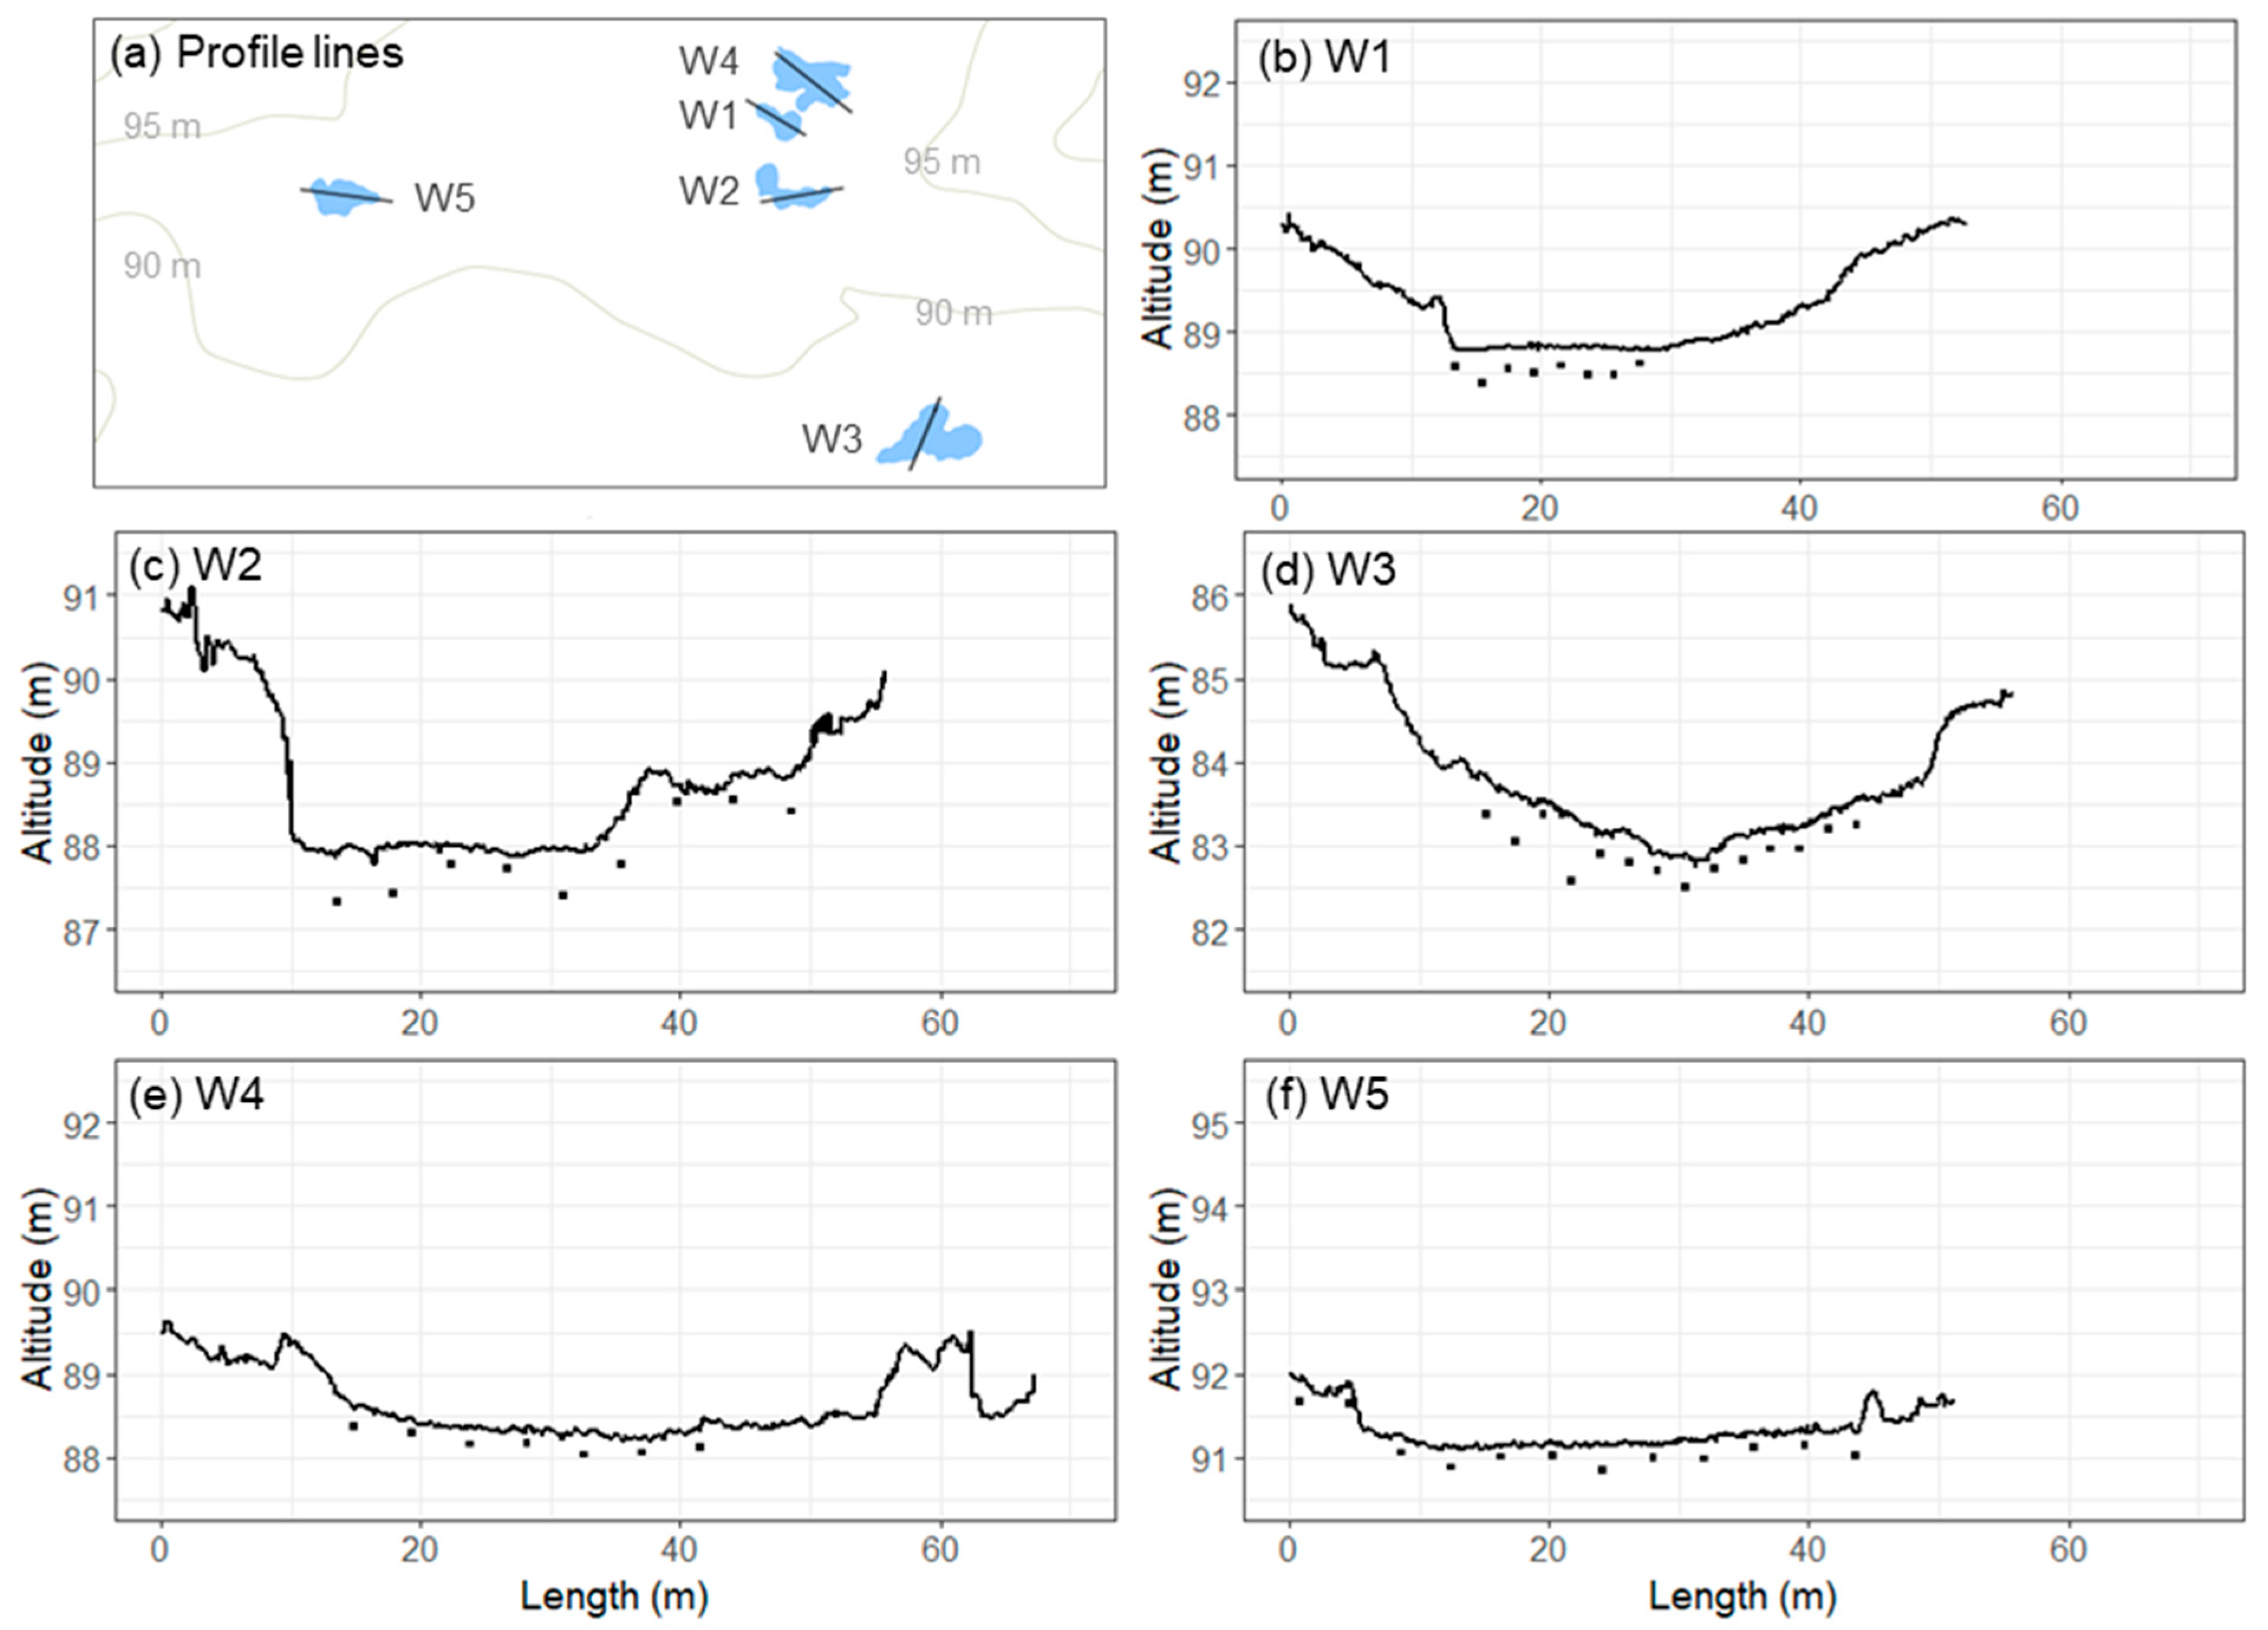
An SI value of 1 indicates a perfect circle, while values greater than 1 reflect increasing complexity or irregularity of the wetland boundary. This index was used to compare the relative shape complexity among wetlands, regardless of their absolute size. Cross-sectional profiles were generally drawn along the major axis of each wetland. However, if the major axis did not adequately represent the topographic variation, the cross-section was drawn along the most distinct profile. All cross-sections were designed to pass through the deepest point of each wetland. To measure wetland penetration depth, probing rods were used along each wetland’s cross-sectional axis.
The study area consists of volcanic ash-derived soils, with a shallow layer (approximately 10 cm) of rocky silty loam [18,46]. To examine the soil sediment characteristics of the temporary wetlands, surface soils (0–10 cm) were collected using 400 mL soil samplers. At each wetland, samples were collected from three representative points. Laboratory analyses included soil texture, pH, organic matter content (%), cation exchange capacity (cmolc kg−1), and electrical conductivity (dS m−1). The permeability coefficient was measured using 100 mL soil cores and the DIK-4021 instrument (DAIKI, Sakai, Fukui Prefecture, Japan).

2.4.2. Hydrological Characteristics

The water level of a wetland is determined by the hydrological balance between various forms of inflow and outflow. Basic hydrological information is therefore essential for understanding water level fluctuations. In this study, all periods during which the water level continuously increased or decreased for at least two hours were identified. From these periods, the following indicators were calculated: Water level Recession Rate (WRR; mm/h), Water level Increase Rate (WIR; mm/h), and Water level Increase per Precipitation (WIP; mm/mm).
WRR represents how quickly a temporary wetland returns to dry conditions after rainfall and is closely related to wetland persistence. In contrast, WIR indicates the rate at which water levels rise following rainfall or external inflow, reflecting the wetland’s responsiveness to inundation events. WIP is the ratio of water level increase to precipitation. A WIP value greater than 1 suggests that external inflows (e.g., surface runoff or groundwater input) have a stronger effect on water level than rainfall alone. Conversely, a WIP value less than 1 implies that water losses (e.g., infiltration, evapotranspiration) exceed the gains from rainfall input [30]. These indicators, respectively, represent inflow rate (WIR), persistence (WRR), and rainfall efficiency (WIP), and together provide a comprehensive understanding of the wetland’s hydrological functioning.
To evaluate temporal variation, we applied the Mann–Kendall test to the four-year time series (2020–2023). Additionally, interquartile range (IQR) analysis was used to identify anomalous years relative to each site’s internal variability. Because the observation period was short, these analyses were used to characterize general variability patterns rather than to infer long-term statistical trends.

2.5. Statistical Analysis and Limitations

This study analyzed a total of five temporary wetlands. Due to the limited sample size, there are inherent constraints on the generalizability of the findings. The primary objective of this research was not to define universal characteristics of lava forest wetlands, but rather to explore hydrological and ecological trends and to establish baseline data.
To enhance statistical reliability despite the small sample size, four years (2020–2023) of time-series water level data were used for repeated observations. In addition, site selection was not based on random sampling but was carefully designed through field surveys to include wetlands with differing geomorphological and vegetation characteristics, thereby aiming to represent a range of temporary wetland types. Although the number of study sites was limited, the study aimed to ensure interpretability and applicability by considering both the spatial variability and temporal repetition of hydrological responses.
To examine the trends among the wetland plants rate, PI, HCI, HPi, and soil properties, as well as the effect of rainfall events on water level increases, Pearson correlation analysis was used as an exploratory tool. Due to site-specific tendencies—such as W1 having the smallest area but the longest hydroperiod, and W3 having the largest area but the shortest hydroperiod—there are limitations in generalizing relationships between variables using correlation analysis. Therefore, the primary aim of the statistical analysis was to identify trends among variables, rather than to infer statistically robust or causal relationships. All correlation, Mann–Kendall test and IQR analysis were performed using R statistical software (version 4.2.3).

3. Results

3.1. Wetland Identification

3.1.1. Hydrological Characteristics

Based on four years of water level monitoring from 2020 to 2023, the annual mean HPi values across the study sites ranged from 0.13 to 0.76, indicating that all wetlands experienced inundation for at least 13% of the year (Table 2). W1, although it showed vegetation and hydrological features similar to those of a permanent wetland, had a mean annual HPi of 0.76, indicating that it was inundated for approximately 76% of the year and thus classified as a temporary wetland. The remaining four wetlands exhibited more typical characteristics of temporary wetlands, with annual HPi values ranging from 0.13 to 0.32. During inundation periods, the mean water level ranged from 218 to 954 mm, and the maximum water level ranged from 684 to 2840 mm. Distinct inundation patterns were observed: W1 was characterized by low-frequency, long-duration inundation, while W2–W5 exhibited high-frequency, short-duration inundation.
To further assess temporal dynamics, we examined interannual variability in HPi. The Mann–Kendall test indicated no statistically significant trend during 2020–2023. IQR-based anomaly detection similarly revealed no extreme outlier years, although HPi values were generally lower in 2022 across most sites (Table S4). These results suggest that interannual variability was relatively small within the four-year monitoring period.
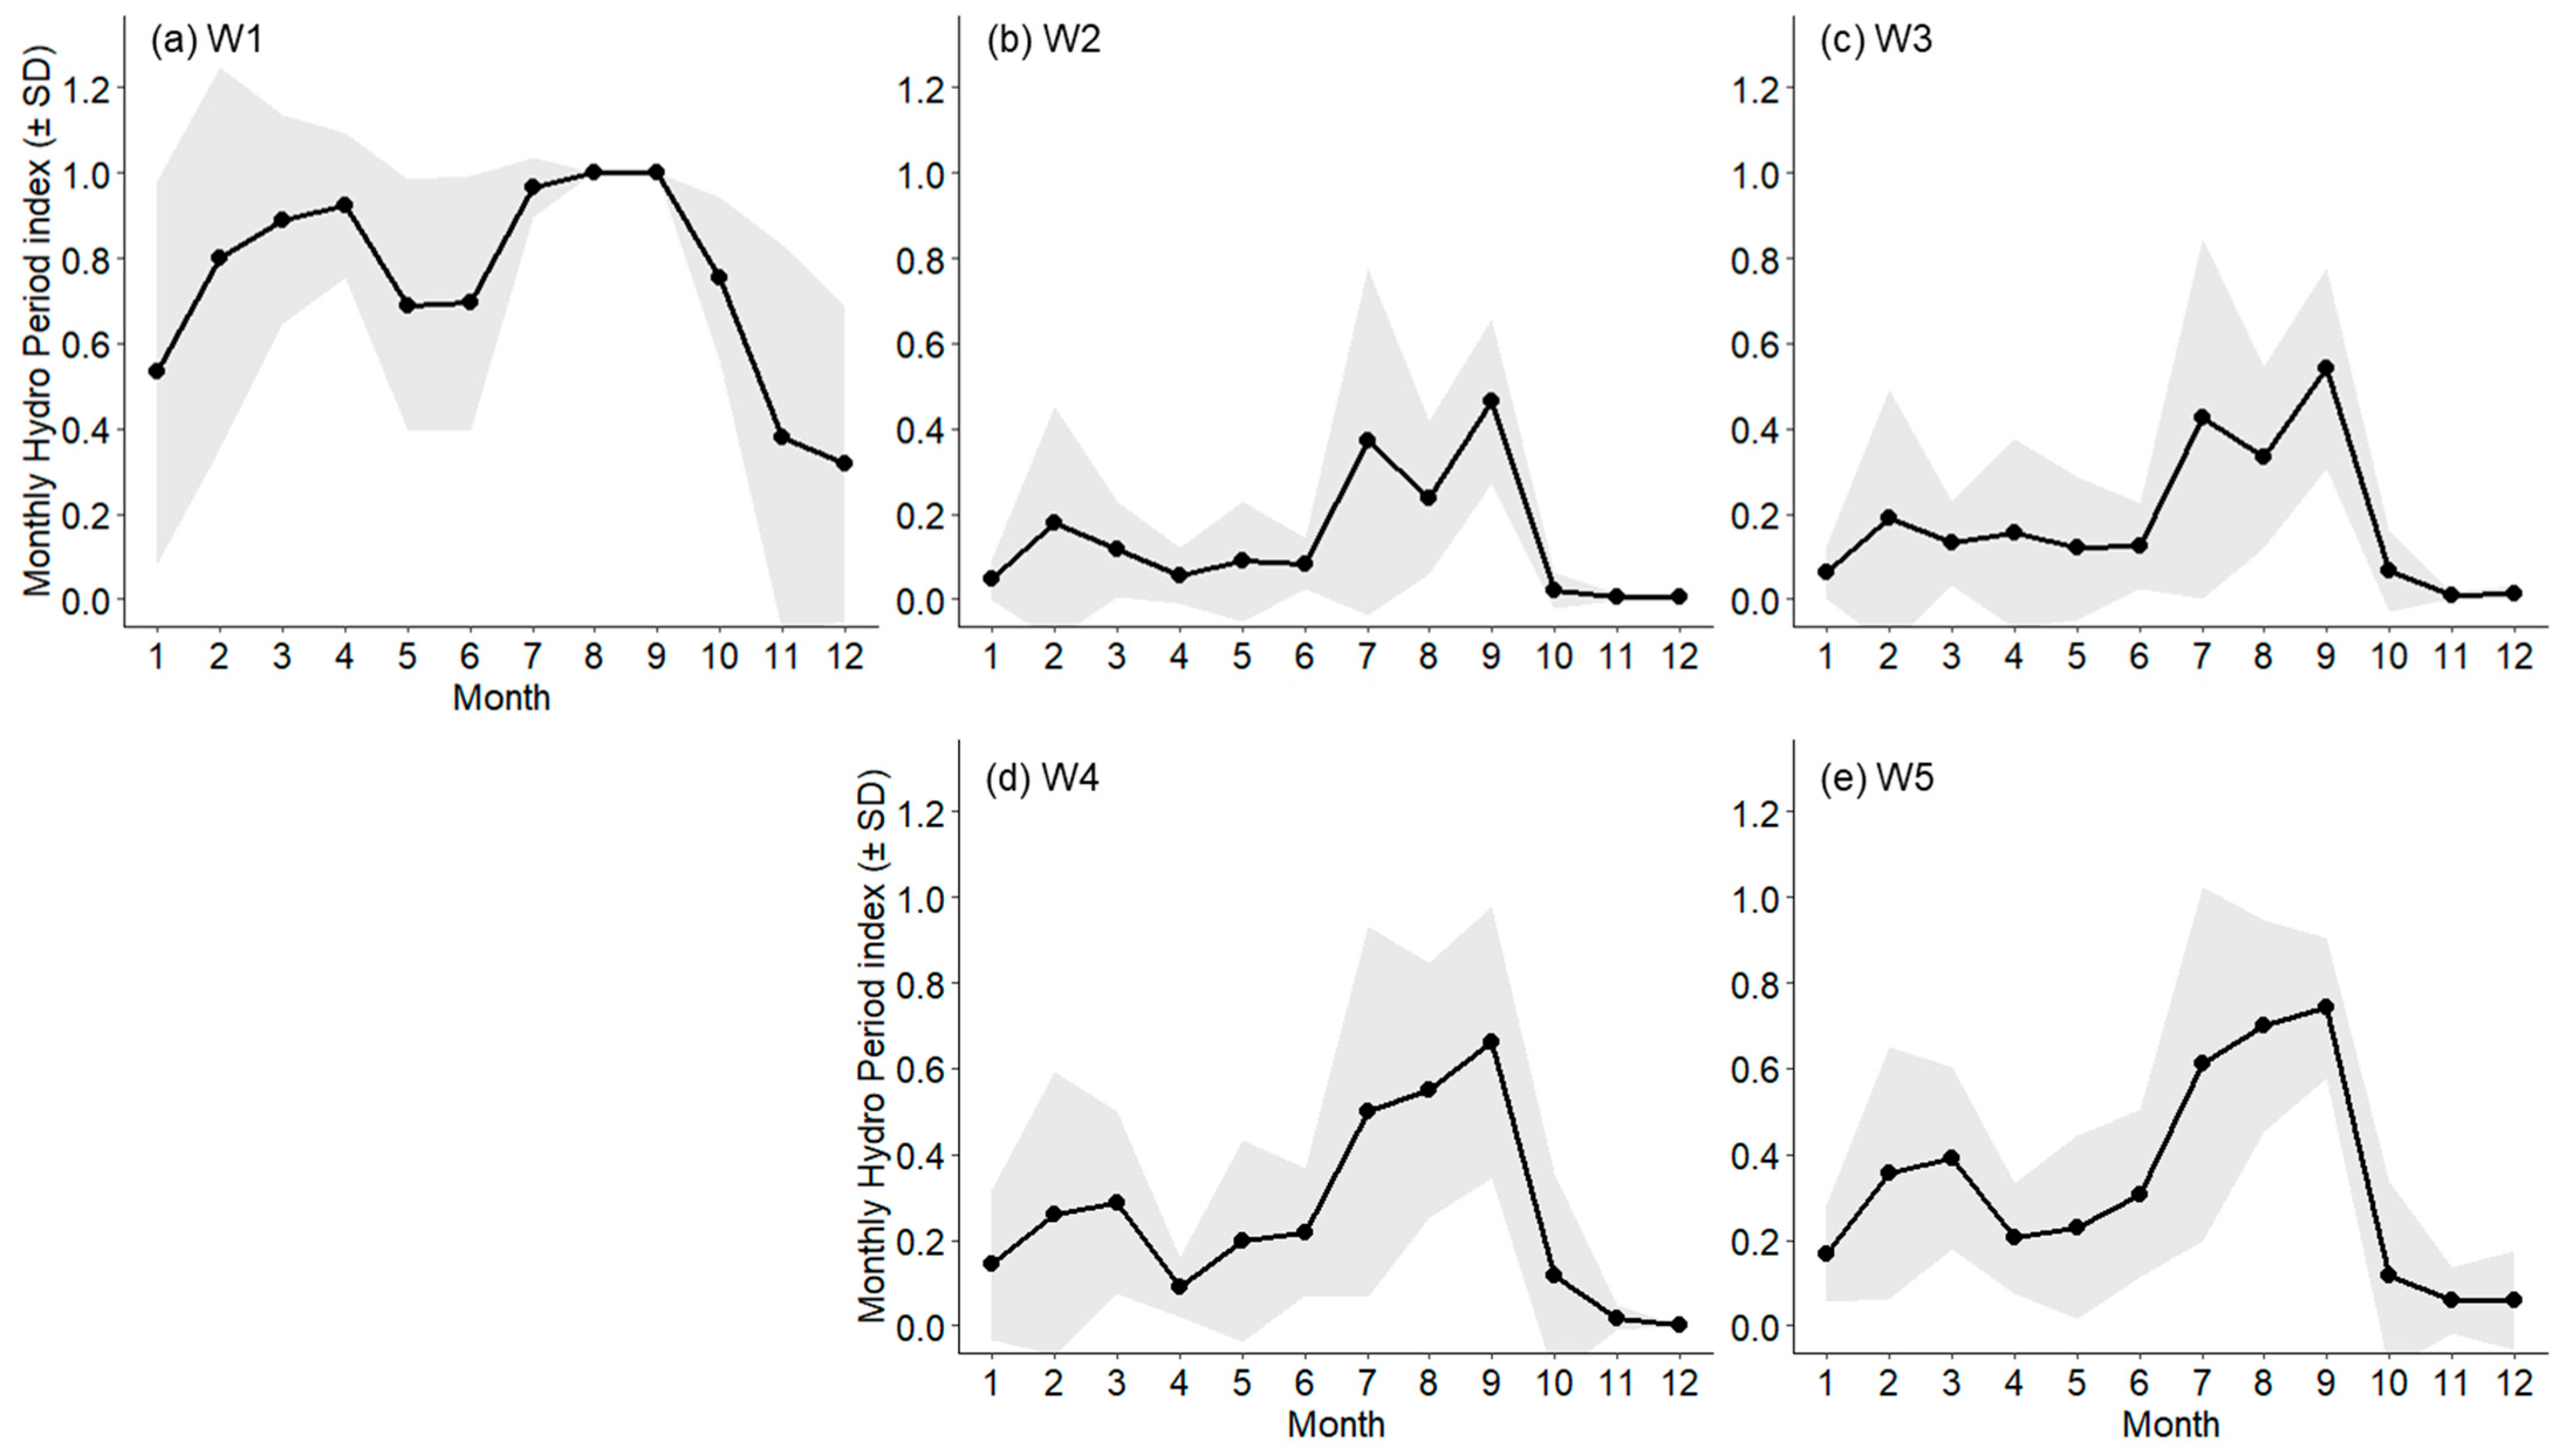
Monthly HPi analysis showed that W1 remained inundated for most of the year, with temporary drying occurring only during winter. In contrast, W2–W5 were briefly inundated in spring, with more sustained inundation occurring during summer and autumn (Figure 3 and Figure S1). These seasonal patterns align with the distinct rainfall regime of Jeju Island, which includes a short spring rainy season, a summer monsoon, and heavy rainfall events caused by summer typhoons.
Correlation analysis between monthly HPi and monthly precipitation revealed high correlation coefficients for W2–W5 (0.77, 0.82, 0.81, and 0.73, respectively), indicating that hydroperiod at these sites closely follows rainfall patterns. In contrast, W1 showed a relatively low correlation (r = 0.34), which suggests that rainfall alone may not fully explain inundation dynamics at this site. Instead, localized topographical or subsurface constraints likely modulate water retention, resulting in weaker rainfall–hydroperiod coupling.

3.1.2. Vegetation Characteristics

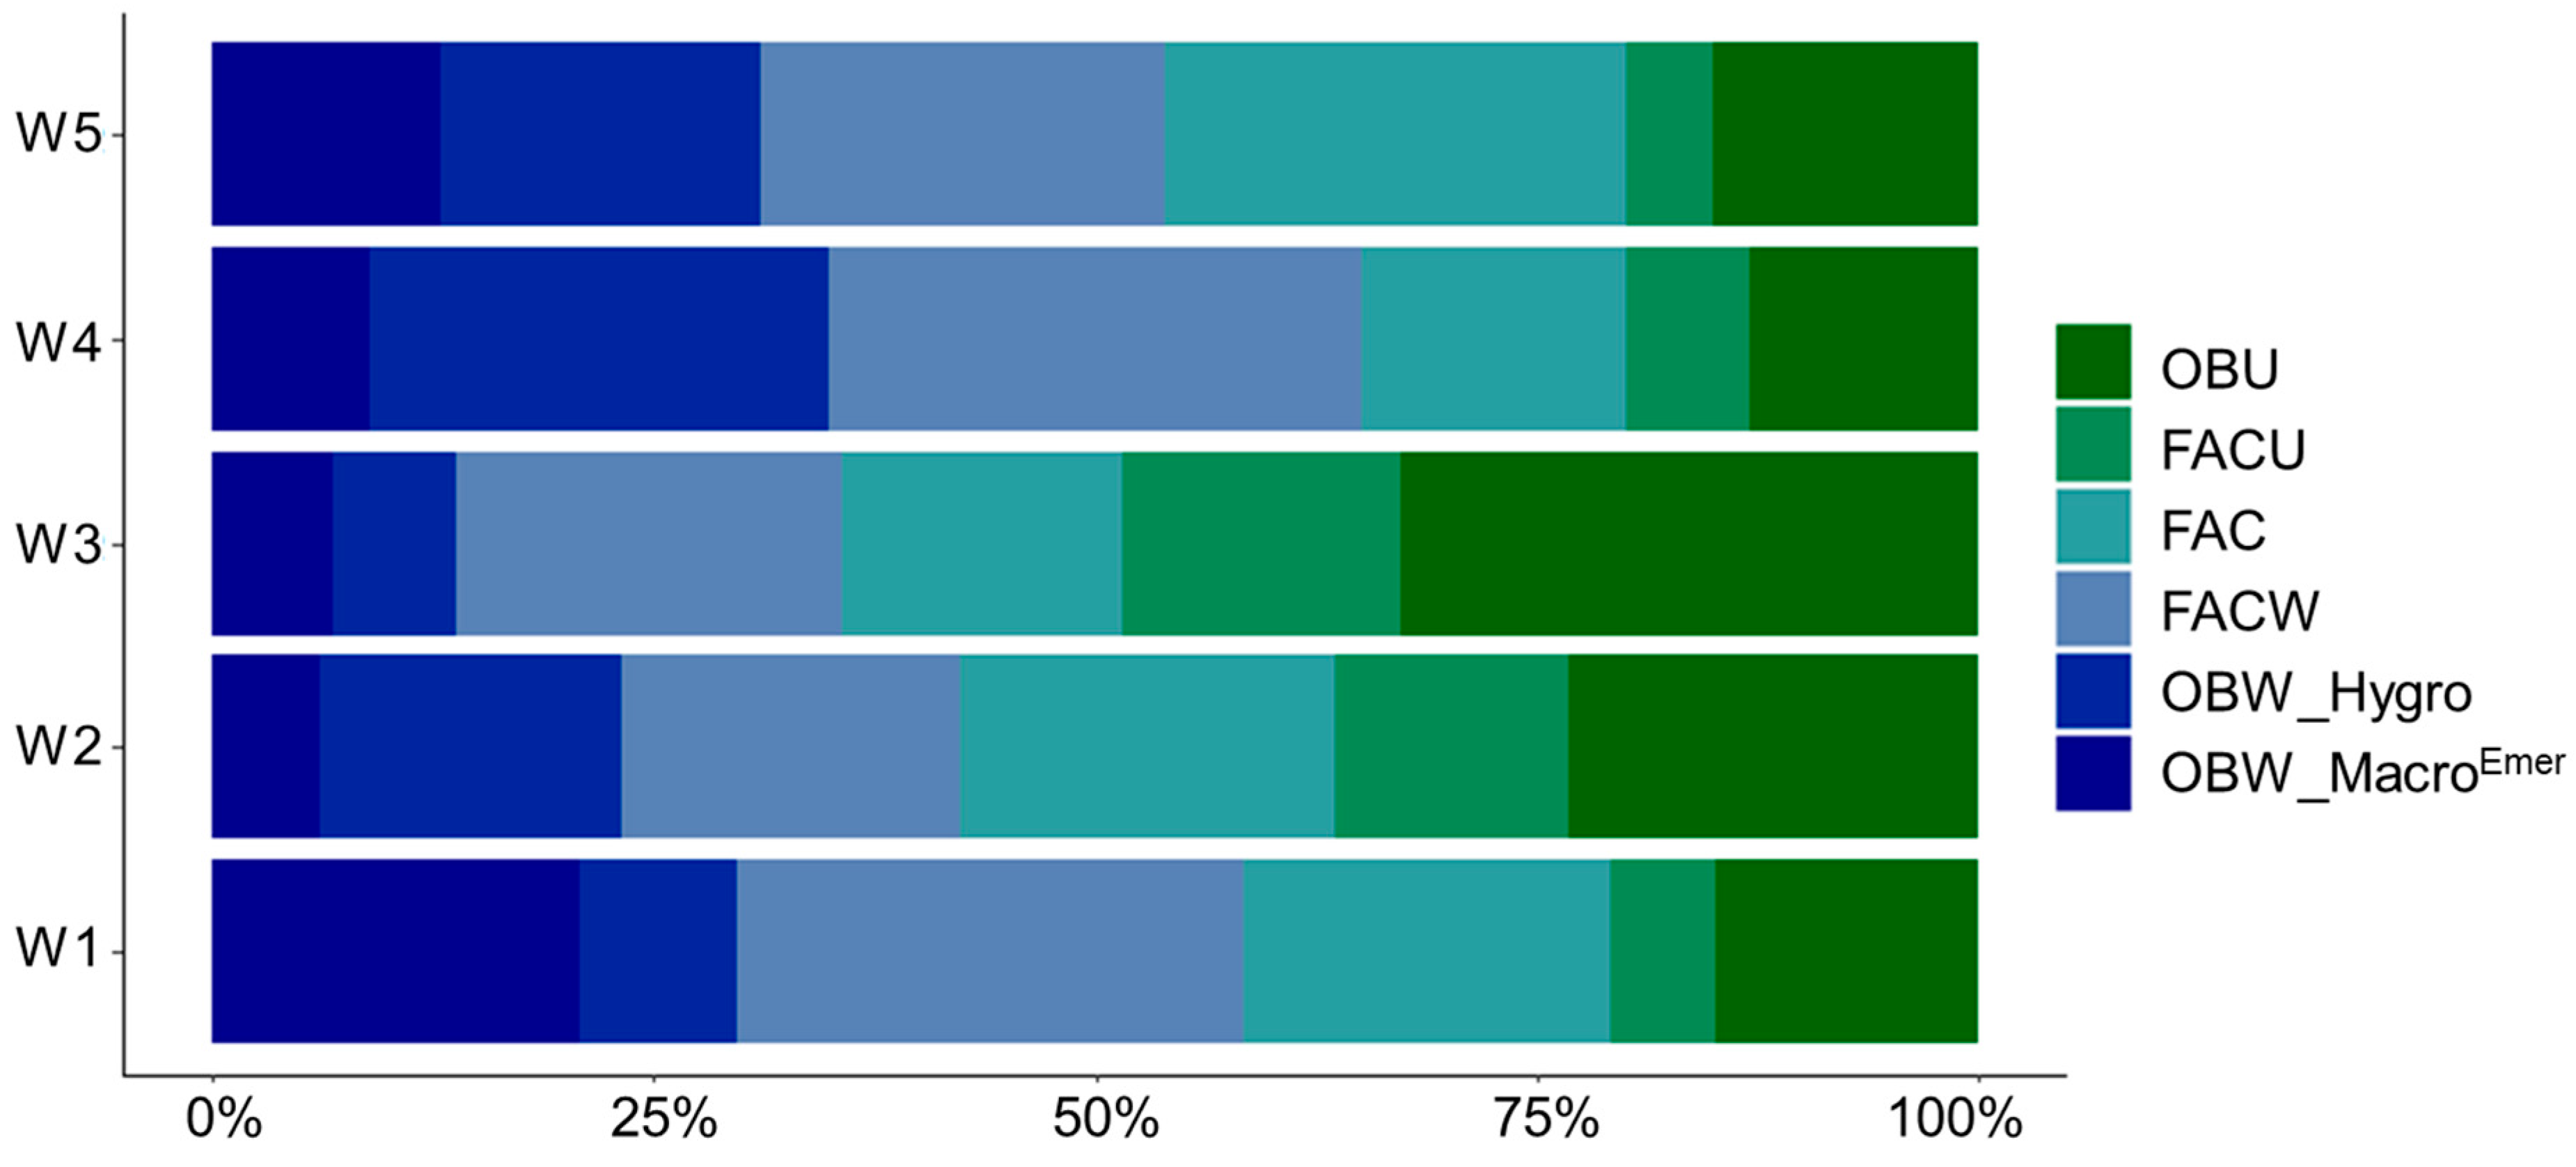
The vegetation survey confirmed the presence of OBW in all five wetlands, and the wetland plants rate exceeded 50% in W1, W4, and W5 (Figure 4). Of the 85 species recorded, 38 were wetland preference species (OBW/FACW) and 5 were Red-List taxa (≥LC), representing 44.7% and 5.9% of the flora, respectively (Table S5). The proportion of emergent aquatic macrophytes adapted to environments with persistent surface water levels was highest in W1 (21%) and lowest in W2 (6%). In W1, several species typically associated with ponds or shallow water habitats were observed, including Alisma canaliculatum, Caldesia parnassifolia, Schoenoplectus tabernaemontani, and Schoenoplectiella triangulata. The presence of these hydrophytic specialists suggests a high potential for sustained water levels at this site.
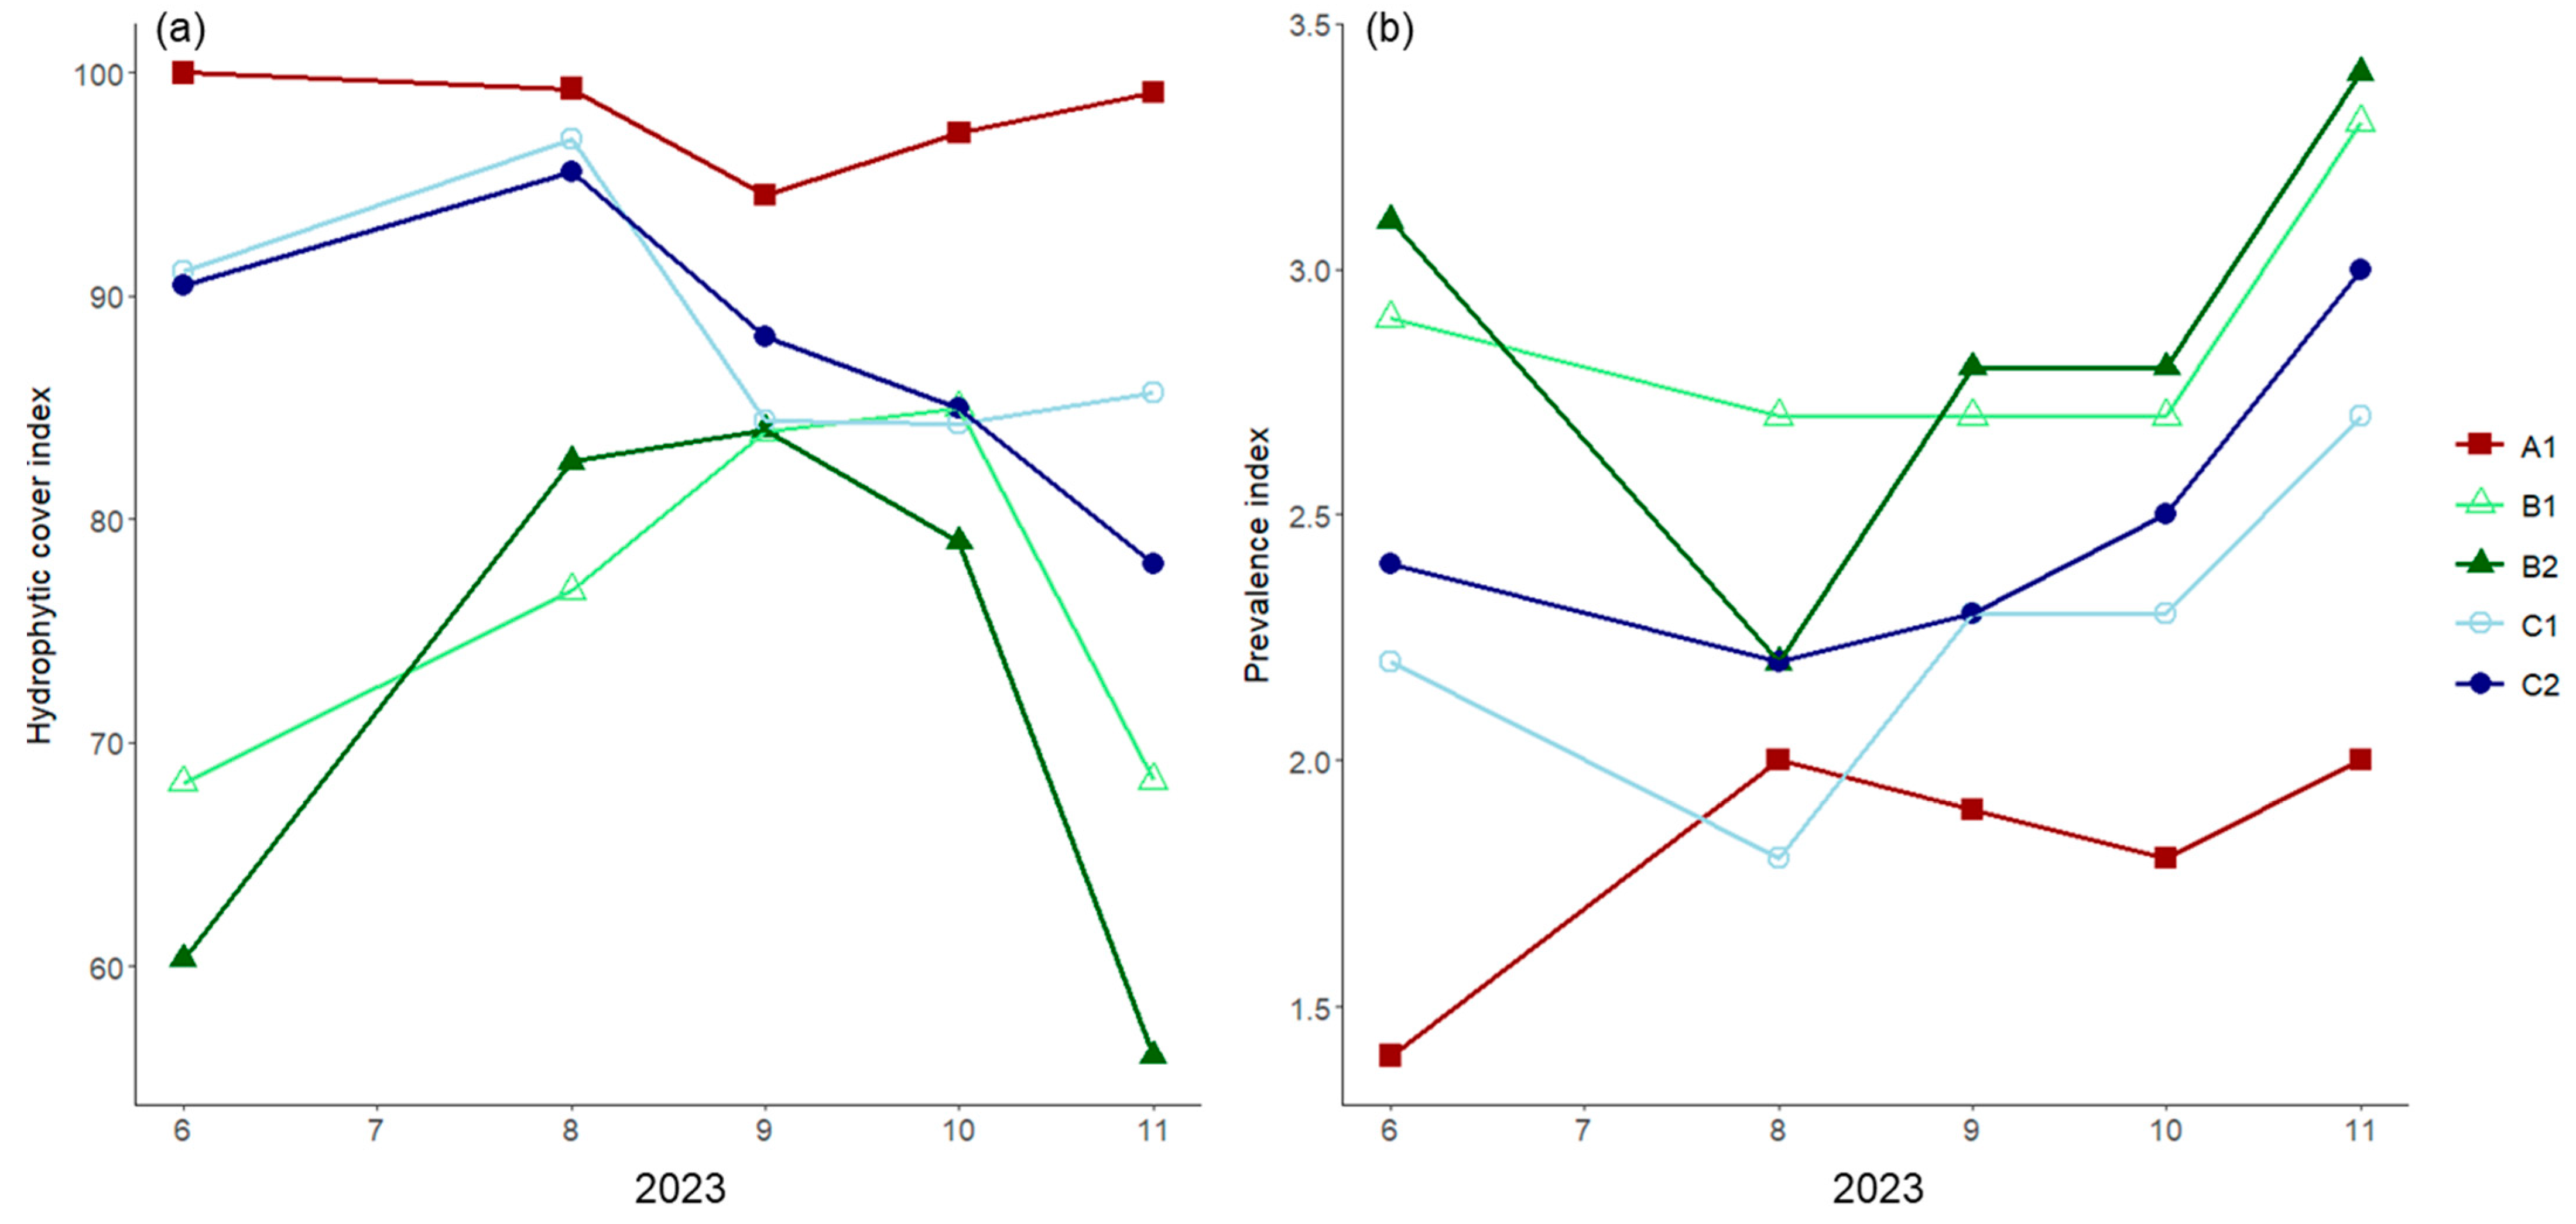
Analysis of the HCI showed that the annual mean HCI values at all sites exceeded 50%, indicating that all sites were identified as wetlands (Figure 5). On a monthly basis, W1 consistently maintained high HCI values throughout the year, while W2 and W3 dropped below 70% in June and November. The PI also indicated wetland status at all sites, with annual mean values below 3. However, W2 and W3 had annual mean PI values of 2.8 and 2.9, respectively. Therefore, vegetation indices alone may be insufficient to determine conclusive wetland status at these sites, indicating the need for supplementary evidence. In terms of monthly variation, W1 maintained PI values below 2.0 year-round, whereas the other sites showed seasonal increases, particularly in June and November. Overall, the integration of the three vegetation-based indices confirmed that all study sites function as wetlands, with W1 having the strongest wetland signature throughout the year. For the other sites, wetland conditions were most evident from August to October and less pronounced in June and November, showing a seasonal trend similar to that of HPi. All three vegetation indices showed positive relationships with HPi: wetland plants rate (r = 0.62), HCI (r = 0.85), and PI (r = −0.90), indicating that a higher HPi corresponds with greater species richness and vegetation cover of wetland-adapted plants.

3.2. Wetland Boundary Delineation

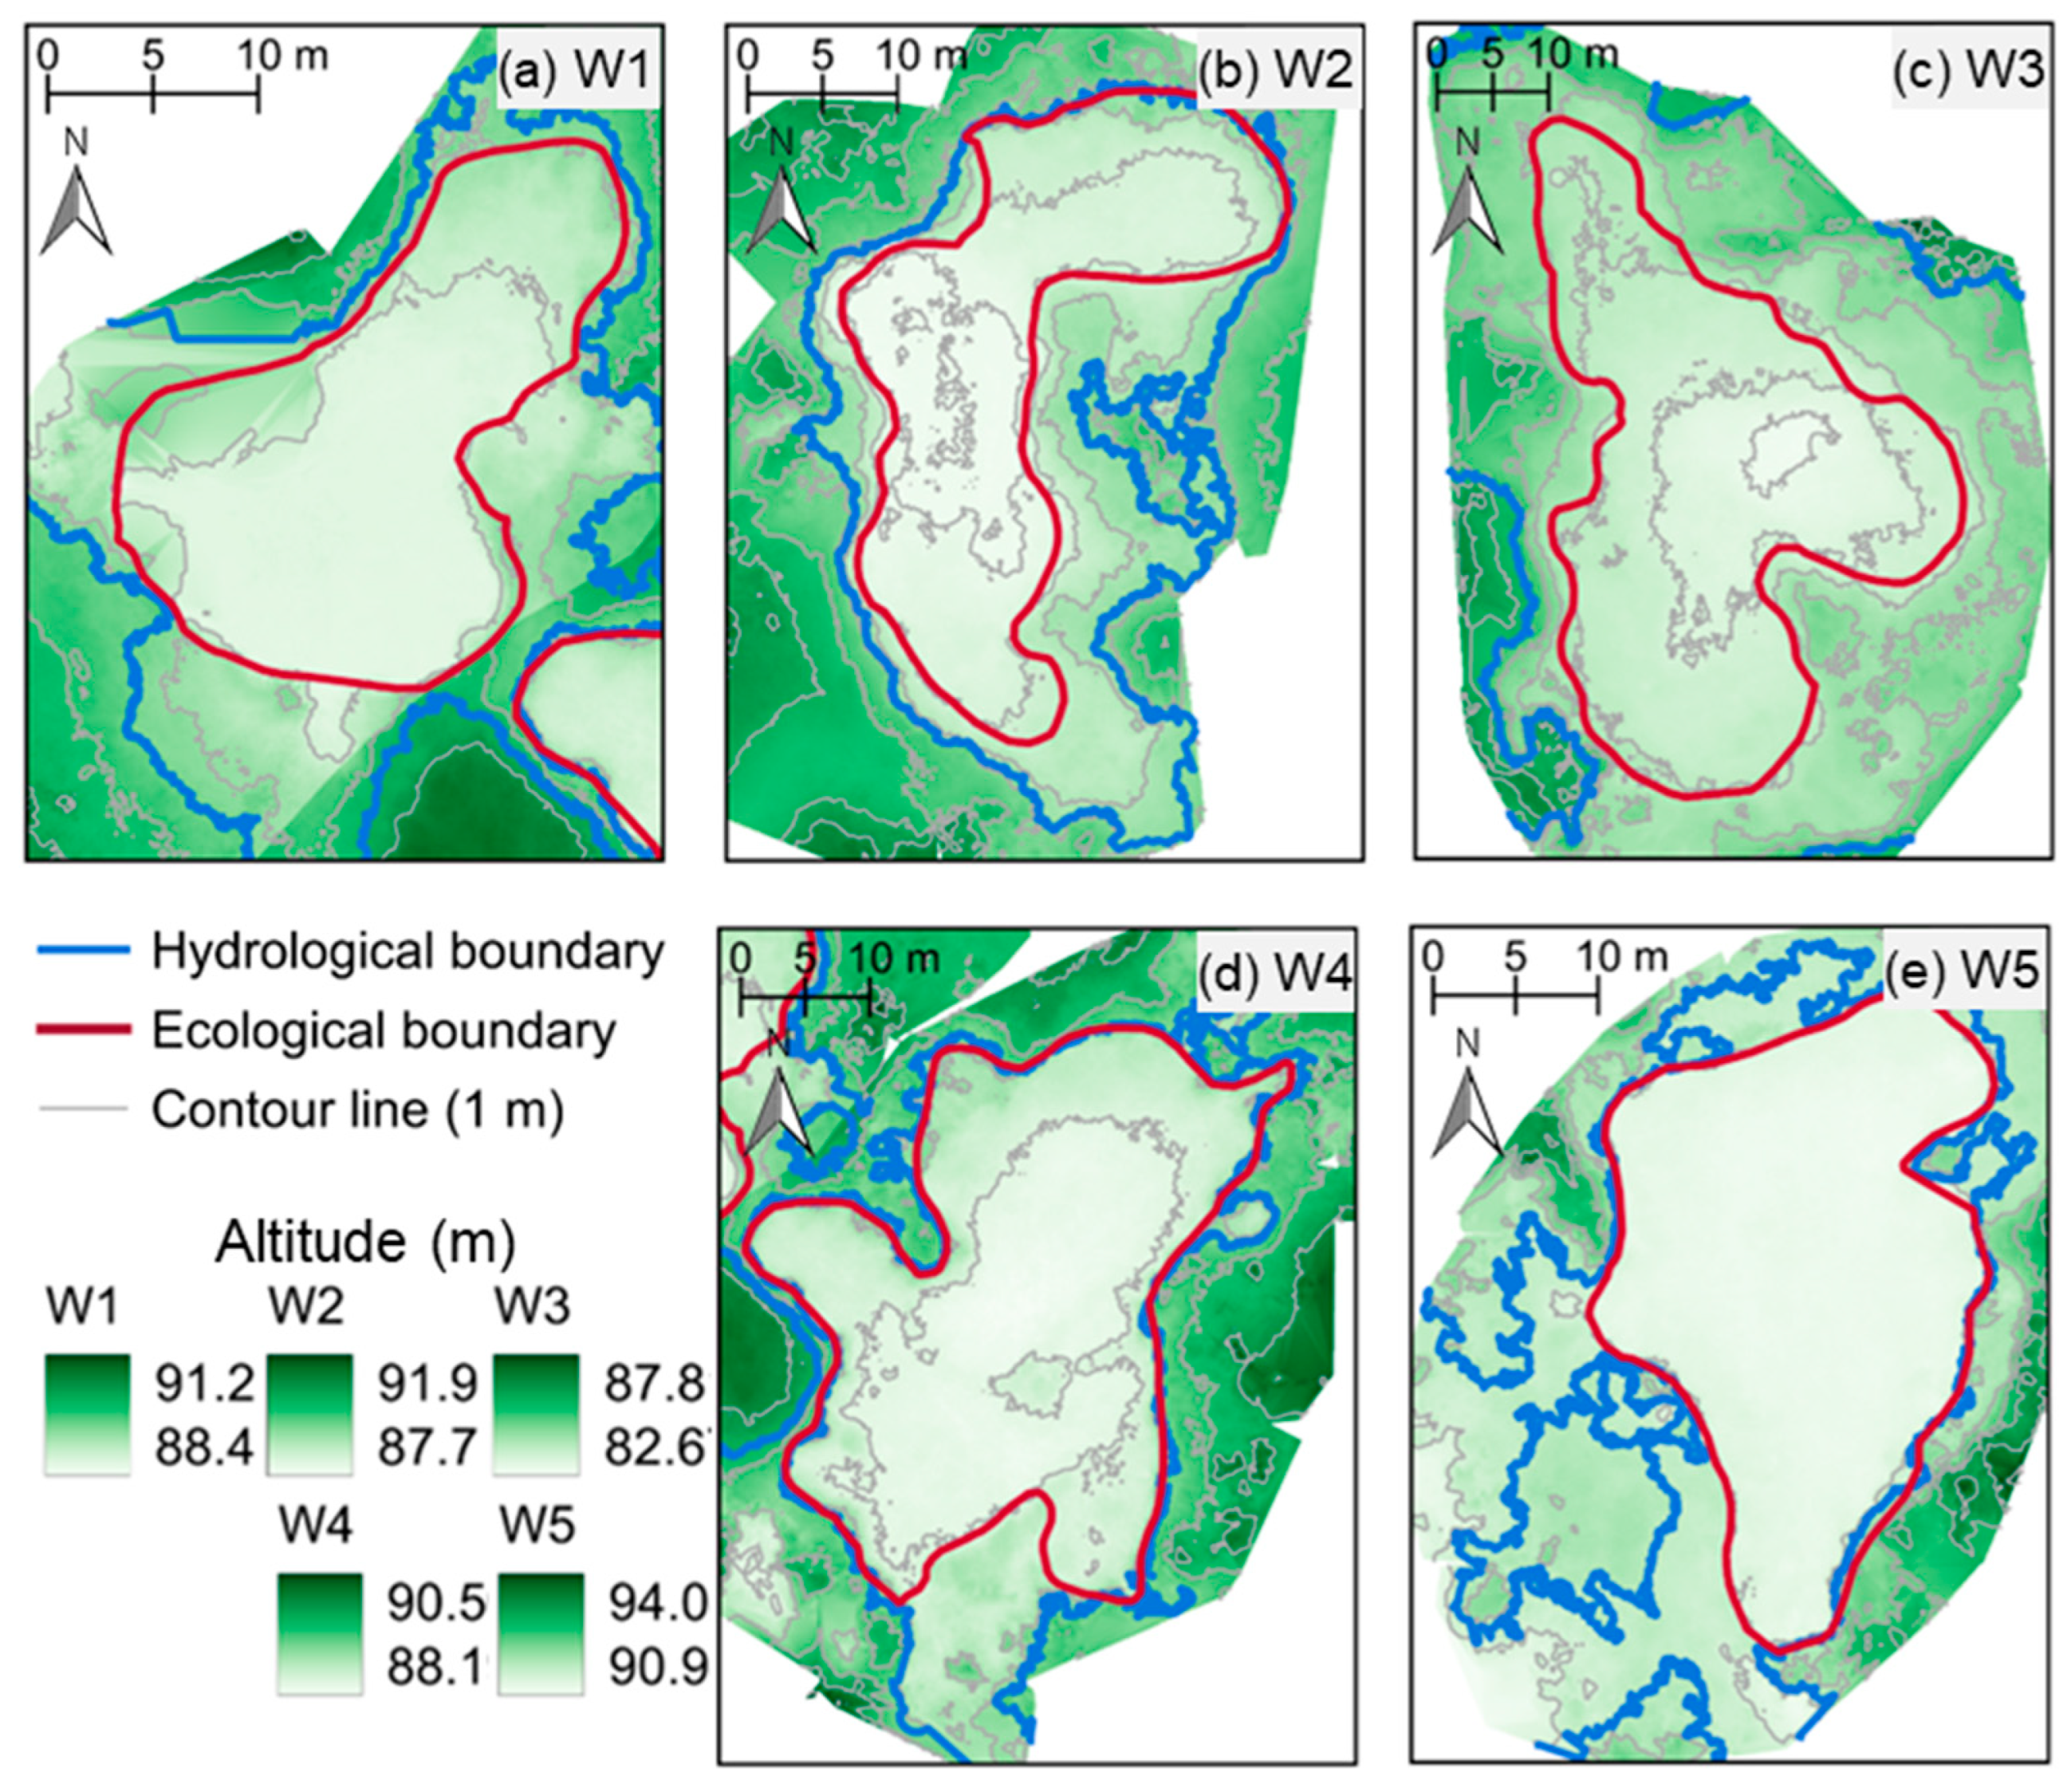
In temporary wetlands, even intermittently inundated areas are considered wetlands if surface water accumulates temporarily. Accordingly, this study defined the hydrological boundary as the inundation extent at the point of maximum water level. This boundary was derived based on the highest water level recorded during the observation period from 2020 to 2023, using a high-resolution LiDAR-based DEM (Figure 6, blue line).
Meanwhile, the distribution of wetland vegetation serves as a key ecological indicator of the presence of temporary wetlands. Therefore, the outermost boundary of wetland vegetation was extracted from drone-based field surveys and designated as the ecological boundary (Figure 6, red line).
A comparison of the two boundaries showed that the ecological boundary was located entirely within the hydrological boundary in all wetlands. Cross-sectional analysis further confirmed that the elevation of the ecological boundary was consistently lower than that of the hydrological boundary (Figure 7).
To assess hydrological conditions outside the ecological boundary, HPi values were calculated for those areas. The HPi values outside the ecological boundary were 0.100, 0.027, 0.044, 0.0006, and 0.003 for the five wetlands, indicating that the inundation period within the boundary accounts for 80%–99% of the total inundation events. These findings demonstrate that the ecological boundary effectively represents the core wetland vegetation zone and the minimum unit of stable hydrological response in temporary wetlands. Based on this, the ecological boundary was adopted as the conservative final boundary of each wetland in this study. However, in larger or more topographically complex wetlands, a quantitative spatial analysis of the relationship between hydrological and ecological boundaries would be required prior to application.

3.3. Wetland Characteristics

3.3.1. Geomorphological and Soil Characteristics

The Seonheul Gotjawal region has a gentle slope of less than 10° [18]. Although the wetland shapes vary, the elevation difference among the wetlands was relatively small, with a maximum difference of 8.3 m (Table 3). In particular, W1, W2, and W4 are located in close proximity and at similar elevations (Figure 1, Table 3), suggesting that microtopography, rather than large-scale slope, plays a more important role in the formation of temporary wetlands. Microtopography refers to elevation differences of several centimeters to a few meters and is a key factor influencing soil moisture, inundation duration, and vegetation distribution [47].
The Shape Index (SI) values for the five wetlands ranged from 1.27 to 1.63, indicating variability in the complexity of wetland boundaries. W1 and W5 had the lowest SI value of 1.27, indicating relatively compact and simple shapes. In contrast, W2 had the highest SI value of 1.63, reflecting a more complex and irregular boundary. W3 and W4 had larger surface areas, but their SI values were intermediate—1.48 and 1.55, respectively—indicating that larger area does not necessarily correspond to greater shape complexity.
The study wetlands were classified into three geomorphological types: W1; W2–W3; and W4–W5. W1 had a concave shape with gently sloping edges and a central organic-rich sediment layer up to 40 cm deep (Figure 8b). Bedrock was exposed toward the margins. The penetration depth was moderate (Table 3).
W2 and W3 were characterized by near-vertical walls, irregular microtopography, and abundant basalt block accumulation (Figure 8c,d). These sites exhibited the highest spatial variability in penetration depth. The soil layer was shallow (less than 10 cm), patchy, and composed mainly of basalt block piles with thin organic debris. In some densely packed basalt block zones, the probe reached the maximum measurement length of 80 cm, suggesting that the blocks are thickly layered up to the underlying bedrock. Vegetation was sparse in these areas, with mosses being the dominant cover.
W4 and W5 exhibited a dish-shaped topography with flat centers and lower edges. Large basalt blocks were rare, and the surface was covered with soil or organic material (Figure 8e,f). The average penetration depth was shallow and relatively uniform, although locally deeper measurements were observed. While surface water was absent, waterlogged conditions were noted when stepping on the soil, indicating the presence of near-surface water. Since water level monitoring was conducted relative to the ground surface, the actual period of soil saturation may have been longer than the recorded inundation duration.
The soil textures of wetlands W1 to W5 were identified as silt loam, sandy clay loam, clay, silty clay, and silty clay loam, respectively (Table 4). In general, the Seonheul region is characterized by brown volcanic ash-derived silt loam soils [18,46], while various textures such as clay, sandy loam, and silt have been reported in permanent wetlands in Jeju [48]. In this study, W2, W3, W4, and W5 all exhibited high clay content, exceeding 30%.
The bulk density of soils in the temporary wetlands was approximately half of the typical value for the Seonheul region (0.8 g/cm3; [46]), indicating high porosity in the wetland soils.
The average permeability coefficient for saturated soils in Jeju has been reported as 0.44 m/day [49], and all study sites showed similar values, except for W3. Despite having a clay-rich soil, W3 exhibited the highest permeability coefficient among the sites. This is likely due to the high rock fragment content in its soil, which enhances water transmission.
Although the permeability coefficient of the soil was expected to be correlated with HPi, the observed correlation was low (r = –0.38). In contrast, moderate correlations were found with HCI and PI (r = –0.69 and 0.60, respectively). These patterns suggest that soil permeability is more closely associated with vegetation indices than with hydrological persistence, although this relationship may also be influenced by unmeasured factors such as subsurface lava structure or microtopographic variability.
The pH and electrical conductivity (EC) of the five temporary wetlands did not differ significantly from those of typical forest soils, indicating no signs of acidification or salt accumulation (Table 5). In contrast, organic matter content and cation exchange capacity (CEC) were substantially higher than the reported averages for brown volcanic ash soils in the region, which are 9.5% and 22 cmolc kg−1, respectively [50].

3.3.2. Hydrological Characteristics of Temporary Wetlands

Analysis of water level dynamics using WRR and WIR showed that the average water level recession time was 6–8 h across sites, with no large differences between wetlands. However, the maximum recession time was shortest in W1 (Table 6), suggesting that W1 stabilizes quickly after rainfall. WRR values were 2–3 times higher in W2 and W3 compared to other wetlands, indicating differences in drainage speed or water storage capacity.
In contrast, the water level increase time ranged from 3.5 to 5.5 h, with W1 showing the longest mean and maximum increase times. This indicates that W1 remains moist most of the time and responds sensitively even to small rainfall events. WIR was also highest in W2 and W3, suggesting that these wetlands are more responsive to short-term water level fluctuations.
This pattern was also reflected in the WIP values. WIP represents the ratio of water level increase to rainfall amount, where values close to 1 indicate a direct contribution of rainfall to water level rise. W2 and W3 exhibited higher WIP values than the other wetlands, with W3 reaching a value of 1.48, meaning that the amount of incoming water was approximately 1.5 times the rainfall amount. This suggests that the rise in water level may have been influenced not only by rainfall but also by additional inputs such as surface runoff from adjacent areas, likely facilitated by the site’s location in a relatively depressed or valley-like terrain. Under such conditions, one might expect water to be retained for a longer period in W3. However, its actual HPi was low (Table 2), implying either rapid water outflow, or a limitation of the WIR-based analysis, which only captures events where a rise in water level occurred. As a result, WIR and WIP values may have been overestimated in temporary wetlands that respond only to heavy rainfall events.
Water level increase tended to show stronger correlations with total precipitation than with intensity or duration (Table 7), indicating that total rainfall amount is more closely associated with inundation responses in these wetlands. In summary, WRR, WIR, WIP, and HPi, respectively, reflect drainage rate, inflow responsiveness, dependence on external water inputs, and inundation persistence. Together, these indicators provide a multidimensional understanding of the hydrological functioning of temporary wetlands, without implying direct causal relationships

4. Discussion

4.1. Identifying Temporary Wetlands Within Lava Forest Ecosystems: Boundary Delineation Using Hydrological and Vegetation Indicators

Wetland identification is the most critical initial step in the study of temporary wetlands. In this study, satellite imagery that provided a clear contrast between temporary wetland areas and the surrounding forest areas was used to support the site selection process. However, canopy cover in temporary wetlands varies widely by region, ranging from 40% to 96% [37,51]. Therefore, in areas with closed canopies, additional indicators beyond satellite imagery are required for accurate identification.
Vegetation indicators used in this study included the HCI and the PI. Despite some monthly variation, all study sites were identified as wetlands based on these indices. Both HCI and PI showed positive statistical associations with hydroperiod, and a previous study in Hawaiian lava forests with similar geological conditions reported an 81% correspondence between PI and hydrological indicators [52].
Beyond identification, boundary delineation is also a fundamental part of wetland studies. This is typically carried out in the field using soil and vegetation indicators [16]. In this study, instead of soil data, water level loggers were used to directly monitor hydrological changes, and the distribution of FACW plant species was mapped. The outer boundary of FACW species corresponded to the minimum extent where stable hydrological responses occurred and was therefore adopted as the final ecological boundary for each temporary wetland.
The fact that ecological boundaries were located inside the maximum water level line suggests that average hydroperiod conditions, rather than peak water levels, play a more significant role in determining vegetation establishment [53,54]. In particular, previous research has identified 5%–12% inundation during the growing season as a hydrological threshold for wetland vegetation [55], supporting the idea that plant distribution is shaped more by sustained hydrological rhythms than by extreme events. This pattern is not unique to Gotjawal lava forests but reflects general principles of wetland ecology.
Vegetation reflects the long-term average hydrological conditions of temporary wetlands and can therefore serve as a more stable indicator than short-term water level observations. In particular, waterlogged soils were observed in some wetlands even in the absence of visible surface water, suggesting that vegetation-based indicators may better represent wetland conditions than water level sensors in such cases. In this study, HCI and PI were found to be appropriate indicators for the identification and boundary delineation of temporary wetlands in the Seonheul Gotjawal region.

4.2. Hydrological Characteristics of Temporary Wetlands in Volcanic Lava Forests

Temporary wetlands have been classified based on various criteria, including geomorphology [17,56], hydroperiod, vegetation [57], presence of amphibians [58], canopy openness, and pond connectivity [59]. The five wetlands ranged in area from 347 to 1214 m2, with mean water levels of 0.2–0.9 m and maximum water levels of 0.9–2.8 m, classifying them as typical small-scale temporary wetlands. Inundation was most frequent in summer and autumn, while spring and winter were marked by shorter hydroperiods. Annual HPi values ranged from 0.13 to 0.76, and water level increases were closely associated with total rainfall. According to Deil’s typology [17], these wetlands correspond to seasonal pool habitats, and Tiner [16] similarly emphasized the importance of precipitation patterns. Our findings also showed statistically significant associations between rainfall and hydroperiod, supporting the interpretation that the Seonheul Gotjawal wetlands function as rainfall-dependent temporary wetlands. However, their hydroperiods are constrained by the site’s unique geological conditions.
The regional deep aquifer is located approximately 122 m below the surface, as recorded at the nearest national groundwater monitoring well outside the study plots [60], indicating that the study wetlands are not influenced by the regional groundwater table. The area also exhibits high recharge, with 44%–67% of rainfall infiltrating to groundwater [18,29,30]. However, localized pāhoehoe lava formations and shallow boulder layers create small depressions where surface water temporarily accumulates, and surface-water resources such as reservoirs and wells were historically used in these areas [30]. These high-permeability geological structures influence water retention and hydroperiods in the study wetlands, often limiting the duration of surface inundation despite high rainfall. As a result, the Seonheul wetlands function as rainfall-dependent temporary wetlands shaped primarily by microtopography rather than groundwater.
Vernal pools in temperate forests of eastern Canada and the United States exhibit physical characteristics similar to those of the Seonheul sites, with annual precipitation of approximately 950–1090 mm, maximum water levels around 2 m, and mean levels of about 0.5 m [37,51,61]. These wetlands typically form from winter snowmelt and dry out in warm seasons due to evapotranspiration, with annual inundation rates of 48%–80% [37,62]. In contrast, despite receiving more than twice the annual precipitation, the Seonheul wetlands showed similar sizes and inundation durations. This suggests that a combination of factors—including high subsurface permeability, rapid outflow, and limited storage capacity—constrains hydrological persistence and physical development of the wetlands.
To complement this spatial comparison, we also examined interannual hydrological variability. The absence of statistically significant interannual trends likely reflects the short duration of the monitoring record. Although HPI values were slightly lower in 2022 across multiple sites (Table S4), this deviation remained within the normal variability range indicated by the IQR analysis. Interestingly, while 2022 exhibited the lowest HPI, the maximum water levels were lowest in 2023 (Figure S1). This decoupling between inundation duration and depth suggests that 2022 experienced brief but intense inundation events, whereas 2023 was characterized by generally shallow and short flooding. Given the inherent variability of temporary wetlands and the limited observation period, a longer-term dataset would be essential to determine whether the observed fluctuations reflect short-term climatic variability or long-term hydrological change.
This study represents the first quantitative assessment of temporary wetlands within the Seonheul Gotjawal lava forest, and the results reflect the unique geomorphological and hydrological context of this terrain. Therefore, caution is needed when generalizing these patterns to wetland types that occur in non-volcanic landscapes. Nevertheless, the distinctive environmental conditions of the study area offer valuable insights into wetland formation and hydrological processes characteristic of volcanic lava terrains.

4.3. Geomorphic and Ecological Uniqueness of Temporary Wetlands in Seonheul Lava Forest

The formation and persistence of temporary wetlands in the Seonheul Gotjawal are closely linked to the area’s unique volcanic geomorphology. The region consists of geologically young lava flows (5000–11,000 years old) with shallow soils and diverse microtopography [33]. Although previously classified as ʻaʻā lava, subsequent studies have identified pāhoehoe-type structures such as pressure domes, collapse pits, and lava tubes [34,63], which create local depressions where water can temporarily accumulate. Among all Gotjawal regions, Seonheul contains the highest proportion of these pāhoehoe formations, whose relatively low permeability compared to ʻaʻā lava likely explains the spatial variation in wetland formation and hydrological response observed in this study.
Reflecting these geophysical conditions, we classified three types of temporary wetlands in the Seonheul Gotjawal that were identified based on geomorphological and vegetation characteristics, and each type exhibited distinct differences in landform structure, hydrological response, and vegetation distribution. Although the classification is based on only five wetlands and therefore has limitations in generalizability, this typology provides meaningful insights as an exploratory attempt and may serve as a basis for developing a quantitative classification system and guiding future research.
Based on this typology, the characteristics of each wetland type are summarized below. W1 (Type A) exhibited a gently sloping, concave landform, a high proportion of aquatic vegetation, and a prolonged hydroperiod, but showed a weak statistical association with rainfall. W2 and W3 (Type B) were characterized by deep concave basins with large basalt block accumulation, heterogeneous and deep penetration depths, and subsurface rock piles. These sites had the shortest hydroperiods, lowest aquatic plant coverage, received external surface water inputs, and showed the greatest spatial discrepancy between hydrological and ecological boundaries. W4 and W5 (Type C) featured shallow, flat topography with uniform and shallow penetration depths, and their hydrological and vegetation characteristics were intermediate between those of W1 and W2–W3.
To visually highlight these multidimensional differences among the three wetland types, we included a radar chart comparing key hydrological and vegetation indices among the five sites (Figure 9). This visualization clearly illustrates the prolonged hydroperiod and high aquatic plant coverage of Type A (W1), the rapid water recession and sparse vegetation of Type B (W2–W3), and the intermediate characteristics of Type C (W4–W5), thereby reinforcing the typological interpretation presented above.
These patterns prompted an estimation of subsurface structure using penetration depth measurements and surface topography and proposed a conceptual cross-sectional diagram (Figure 10) to supplement the observational limitations of inaccessible underground conditions.
Jeon et al. [63] also reported that Gotjawal wetlands form primarily on pāhoehoe lava and that most areas of the Seonheul Gotjawal maintain wetland conditions throughout the year. W1 in this study exhibited similar characteristics. Its tendency to retain water over extended periods is interpreted as a result of dense pāhoehoe lava layers, which limit both infiltration and subsurface outflow (Figure 10a).
Jeju Island features exposed zones of highly permeable lava terrain, including sumgol (airflow hole in lava terrain), Gotjawal forests, intermittent streams, and collapse basins. These lava landforms are classified according to their surface exposure into four types: extrusion, dent (collapse), soil-clad, and open types [64]. Dent-type (collapse-type) wetlands are formed by rock subsidence, resulting in shallow soil layers and limited vegetation development. W2 and W3 exhibit the typical characteristics of this type, including exposed rock fragments, subsurface basalt block piles, and sparse vegetation. These sites also show strong topographic relief, with up to 3 m of elevation difference between center and edge, and near-vertical walls (Figure 10b). Previous research on dent-type landforms suggested subsidence depths of up to 3 m and possible structural continuity of bedrock [65], which likely explains the rapid water level recession observed in W2 and W3. Due to their short inundation periods and sparse vegetation, these sites were initially assumed to be in the process of terrestrialization. However, based on their geomorphological and hydrological features, they are now interpreted as rare and ecologically distinctive temporary wetlands formed over collapse-type terrain. Notably, W2 and W3 were the only sites where M. chejuense, a rare endemic fern species of Jeju, was observed, highlighting their exceptional ecological and conservation value. Recent physiological studies show that plants possess clearly defined tolerance thresholds to both drought and waterlogging, and their performance declines sharply once soil-moisture conditions exceed these limits [66,67]. Because these tolerance ranges vary substantially among species, only those adapted to highly specific hydrological regimes can persist in temporary wetlands with rapid drainage and short inundation durations. The distinctive hydrological environment of collapse-type wetlands therefore likely provides the narrow soil-moisture conditions required for the persistence of M. chejuense. Accordingly, these wetlands represent high-priority habitats for the conservation of Jeju’s endemic flora.
In contrast to the distinct collapse-type characteristics of W2 and W3, sites W4 and W5 exhibited flat surface topography, minimal surface rock fragments, short inundation periods, shallow and uniform penetration depths, and high proportions of aquatic vegetation. Their surface hydrological responses were similar to those of W2 and W3. However, prolonged subsurface saturation may have occurred, and the uniform penetration depth and consistent vegetation distribution suggest a subsurface structure similar to W1 (Figure 10c, top). In contrast, unusually deep probe depths were occasionally observed near the edges of these wetlands, indicating the potential presence of shallow dent-type structures overlain by soil (Figure 10c, bottom). Therefore, these observations imply that W4 and W5 may represent a hybrid landform combining both dent-type and soil-clad characteristics. Although surface ponding appears limited, the broad and shallow basins inferred from the subsurface structure likely enable these wetlands to retain near-surface water for extended periods. Despite their initial classification as upland grasslands, the high abundance and uniform distribution of aquatic vegetation clearly demonstrate wetland hydrology. As with W2 and W3, the subtlety of their surface inundation patterns may have led to their being overlooked, even though they exhibit clear wetland traits and hold ecological significance as part of the diverse hydrological mosaic of the Seonheul lava terrain.
These findings highlight that temporary wetlands in the Seonheul Gotjawal lava forest, although small in size and easily overlooked due to their intermittent nature, represent ecologically distinctive components of the forest ecosystem. Their formation is closely linked to localized geomorphological and hydrological conditions, and they provide important habitats for endemic and wetland-dependent species. Recognizing and conserving these wetlands is therefore essential not only for wetland protection but also for the integrated management of forest ecosystems, as they contribute to hydrological regulation and support the unique biodiversity of the lava forest landscape. Accordingly, management and conservation strategies should reflect the dynamic characteristics of temporary wetlands rather than uniformly applying frameworks premised on permanent wetlands. Otherwise, well-intended interventions—such as physical modifications or hydrological stabilization—may lead to unintended degradation.

5. Conclusions

This study aimed to identify temporary wetlands and delineate their boundaries within the Seonheul Gotjawal area of Jeju Island, while exploring patterns in geomorphological and hydrological characteristics. Based on water level monitoring and vegetation surveys at five wetland sites, we proposed a typology of three distinct types (W1; W2–W3; W4–W5), differentiated by landform structure, inundation duration, penetration depth, and vegetation composition. These findings suggest that various forms of temporary wetlands exist within the complex lava forest ecosystem of the Gotjawal.
Compared to hydrological boundaries, the ecological boundaries were consistently located within them, demonstrating the effectiveness of plant-based indicators for wetland identification. Notably, even in areas like W2–W5, where surface inundation was not clearly visible, the uniform distribution of wetland plant species suggests that these previously unrecognized sites may in fact be ecologically significant wetlands.
Due to their intermittent nature, temporary wetlands are often excluded from conservation efforts. However, they hold high ecological value as habitats for endemic vegetation and rare species. In highly permeable lava forests, such wetlands can play an important role in enhancing forest ecosystem diversity. This study is the first to document daily water level fluctuations and annual hydroperiods of temporary wetlands in the Seonheul Gotjawal. It also revealed that certain areas previously regarded as forest are, in fact, wetlands formed over collapsed lava structures. These landforms maintain unique moisture conditions and provide specialized ecological environments that support endemic species such as M. chejuense.
This study is the first to document daily water level fluctuations and hydroperiods of temporary wetlands in the Seonheul Gotjawal, and it proposes a typology of three distinct wetland types based on their unique characteristics. Future research and management strategies for temporary wetlands should adopt type-specific approaches based on this classification. For instance, W1 requires conservation-oriented strategies due to its long-term water retention capacity; W2 and W3, characterized by short inundation periods and distinctive geomorphology, call for targeted monitoring and habitat protection; and W4 and W5 are prone to misclassification as non-wetlands, warranting recognition and protection. Such differentiated management approaches will serve as a foundation for developing practical conservation systems that reflect the ecological diversity and value of temporary wetlands, while contributing to integrated forest ecosystem management in the Gotjawal landscape.
By highlighting the presence and ecological uniqueness of temporary wetlands in this region, this study also provides a baseline for future efforts, including wetland distribution mapping, type-specific conservation planning, and the development of vegetation indicator-based boundary delineation methods, thereby supporting long-term strategies for forest ecosystem conservation in lava forest environments.

Supplementary Materials

The following supporting information can be downloaded at: https://www.mdpi.com/article/10.3390/f16121770/s1. Figure S1: Water level of five wetlands and precipitation; Table S1: Site selection information; Table S2: Monthly vegetation cover at each wetland site; Table S3: Details of plot size and number by wetland and season; Table S4: Hydroperiod index (2020–2024); Table S5: Checklist of plant species recorded in the study area.

Author Contributions

Conceptualization, M.P., E.P. and J.K.; methodology, M.P. and E.P.; software, M.P.; validation M.P. and E.P.; formal analysis, M.P. and E.P.; investigation, M.P. and E.P.; resources, A.S., M.P. and E.P.; data curation, M.P. and E.P.; writing—original draft preparation, M.P. and E.P.; writing—review and editing, E.P. and M.P.; visualization, M.P.; supervision, A.S.; project administration, A.S.; funding acquisition, A.S. All authors have read and agreed to the published version of the manuscript.

Funding

This work was supported by the National Institute of Forest Science (NIFoS) through the Development of Forest Management Technologies to Enhance Functions of the Gotjawal and Unique Forest Ecosystems in Jeju island Project funded by the Korea Forest Service (FE0100-2019-02-2023).

Data Availability Statement

The datasets generated during and/or analyzed during the current study are available from the corresponding author on reasonable request.

Acknowledgments

The authors would like to express their sincere appreciation to Kyung-Ha Kim for invaluable assistance with photography and field investigations. During the preparation of this manuscript, the authors used ChatGPT 4.0 for the purpose of translating the text from Korean to English. The authors have reviewed and edited the output and take full responsibility for the content of this publication.

Conflicts of Interest

The authors declare no conflicts of interest. The funders had no role in the design of the study; in the collection, analyses, or interpretation of data; in the writing of the manuscript; or in the decision to publish the results.

Abbreviations

The following abbreviations are used in this manuscript:
HPiHydro Period Index
PIPrevalence Index
HCIHydrophytic Cover Index
OBWObligate wetland plant
FACWFacultative wetland plant
FACFacultative plant
FACUFacultative upland plant
OBUObligate upland plant
DEMDigital Elevation Model
SIShape Index
WRRWater level Recession Rate
WIRWater level Increase Rate
WIPWater level Increase per Precipitation

References

  1. Capps, K.A.; Rancatti, R.; Tomczyk, N.; Parr, T.B.; Calhoun, A.J.K.; Hunter, M. Biogeochemical Hotspots in Forested Landscapes: The Role of Vernal Pools in Denitrification and Organic Matter Processing. Ecosystems 2014, 17, 1455–1468. [Google Scholar] [CrossRef]
  2. Downing, J.A. Emerging global role of small lakes and ponds: Little things mean a lot. Limnética 2010, 29, 0009–0024. [Google Scholar] [CrossRef]
  3. Euliss, N.H.; LaBaugh, J.W.; Fredrickson, L.H.; Mushet, D.M.; Laubhan, M.K.; Swanson, G.A.; Winter, T.C.; Rosenberry, D.O.; Nelson, R.D. The Wetland Continuum: A Conceptual Framework for Interpreting Biological Studies. Wetlands 2004, 24, 448–458. [Google Scholar] [CrossRef]
  4. Ganesan, G.; Rainwater, K.; Gitz, D.; Hall, N.; Zartman, R.; Hudnall, W.; Smith, L. Comparison of Infiltration Flux in Playa Lakes in Grassland and Cropland Basins, Southern High Plains of Texas. Tex. Wat. J. 2016, 7, 25–39. [Google Scholar] [CrossRef]
  5. Herault, B.; Thoen, D. How Habitat Area, Local and Regional Factors Shape Plant Assemblages in Isolated Closed Depressions. Acta Oecologica 2009, 35, 385–392. [Google Scholar] [CrossRef]
  6. Paton, P.W.C. A Review of Vertebrate Community Composition in Seasonal Forest Pools of the Northeastern United States. Wetl. Ecol. Manag. 2005, 13, 235–246. [Google Scholar] [CrossRef]
  7. Pinto-Cruz, C.; Molina, J.A.; Barbour, M.; Silva, V.; Espírito-Santo, M.D. Plant Communities as a Tool in Temporary Ponds Conservation in SW Portugal. Hydrobiologia 2009, 634, 11–24. [Google Scholar] [CrossRef]
  8. Zedler, P.H. Vernal Pools and the Concept of “Isolated Wetlands”. Wetlands 2003, 23, 597–607. [Google Scholar] [CrossRef]
  9. Allen, C.; Gonzales, R.; Parrott, L. Modelling the Contribution of Ephemeral Wetlands to Landscape Connectivity. Ecol. Model. 2020, 419, 108944. [Google Scholar] [CrossRef]
  10. Calhoun, A.J.K.; Mushet, D.M.; Bell, K.P.; Boix, D.; Fitzsimons, J.A.; Isselin-Nondedeu, F. Temporary Wetlands: Challenges and Solutions to Conserving a ‘Disappearing’ Ecosystem. Biol. Conserv. 2017, 211, 3–11. [Google Scholar] [CrossRef]
  11. Cohen, M.J.; Creed, I.F.; Alexander, L.; Basu, N.B.; Calhoun, A.J.K.; Craft, C.; D’Amico, E.; DeKeyser, E.; Fowler, L.; Golden, H.E.; et al. Do Geographically Isolated Wetlands Influence Landscape Functions? Proc. Natl. Acad. Sci. USA 2016, 113, 1978–1986. [Google Scholar] [CrossRef] [PubMed]
  12. Delle Grazie, F.M.; Gill, L.W. Review of the Ecosystem Services of Temperate Wetlands and Their Valuation Tools. Water 2022, 14, 1345. [Google Scholar] [CrossRef]
  13. Javornik, C.J.; Collinge, S.K. Influences of Annual Weather Variability on Vernal Pool Plant Abundance and Community Composition. Aquat. Bot. 2016, 134, 61–67. [Google Scholar] [CrossRef]
  14. Mushet, D.M.; Calhoun, A. Wetland Conservation in the United States: A Swinging Pendulum. Soil Water Conserv. A Celebr. 2020, 75, 162–171. [Google Scholar]
  15. Van den Broeck, M.; Waterkeyn, A.; Rhazi, L.; Grillas, P.; Brendonck, L. Assessing the Ecological Integrity of Endorheic Wetlands, with Focus on Mediterranean Temporary Ponds. Ecol. Indic. 2015, 54, 1–11. [Google Scholar] [CrossRef]
  16. Tiner, R.W. Wetland Indicators: A Guide to Wetland Formation, Identification, Delineation, Classification, and Mapping, 2nd ed.; CRC Press: Boca Raton, FL, USA, 2016; ISBN 978-1-315-37471-0. [Google Scholar]
  17. Deil, U. A Review on Habitats, Plant Traits and Vegetation of Ephemeral Wetlands—A Global Perspective. Phytocoenologia 2005, 35, 533–705. [Google Scholar] [CrossRef]
  18. Ministry of Environment of Korea. 2012 Detailed Survey of Wetland Protected Areas—Nakdong River Estuary, DaehamsanYongneup, Dongbaekdongsan, and Mujechi Neup; Ministry of Environment of Korea: Sejong-si, Republic of Korea, 2012. [Google Scholar]
  19. Han, B.-H.; Kim, J.-Y.; Choi, I.-T. Vegetation Structure of Evergreen Broad-Leaved forest in Dongbaekdongsan (Mt.), Jeju-Do, Korea. Korean J. Environ. Ecol. 2007, 21, 336–346. [Google Scholar]
  20. Kwak, J.-I.; Lee, K.-J.; Han, B.-H.; Song, J.-H.; Jang, J.-S. A study on the vegetation structure of evergreen broad-leaved forest Dongbaekdongsan (Mt.) in Jeju-do, Korea. Korean J. Environ. Ecol. 2013, 27, 241–252. [Google Scholar]
  21. Hyun, H.-J.; Moon, M.-O.; Choi, H.-S.; Kim, C.-S. Growth Pattern and Phenology of Mankyua chejuense B.Y. Sun, M.H. Kim & C.H. Kim. Korean J. Plant Resour. 2014, 27, 95–101. [Google Scholar] [CrossRef]
  22. Lee, K.-M.; Shin, J.-H.; Jeong, H.-M.; Kim, H.-R.; Kim, J.-H.; Shin, D.-H.; You, Y.-H. Characteristics of vegetation structure and habitat of Mankyua chejuense (Ophioglssaceae), endangered plant in Korea. J. Wetl. Res. 2012, 14, 35–45. [Google Scholar]
  23. Ko, P. Ecological Study on Wild Mushrooms in Sunhulgot Dongbaekdongsan Areas. Ph.D. Thesis, Jeju National University, Jeju-si, Republic of Korea, 2009. [Google Scholar]
  24. Ko, S. Classification of Pteridophyta in Dongbaekdongsan by Analysis of DNA Sequence. Ph.D. Thesis, Jeju National University, Jeju-si, Republic of Korea, 2015. [Google Scholar]
  25. Jang, H.-W.; Seo, K.-Y.; Hong, S.-H. An oral testimony on the promotion of eco-tourism based on tourism commons: Focusing on Dongbaek Garden in Seonheul-ri, Jeju. Int. J. Tour. Hosp. Res. 2023, 37, 37–52. [Google Scholar]
  26. Jeong, Y.-S. Historical Evolution of Relations between Commons and Community: Focused on the Case of Dongbaek-Dongsan—Seonheul-Ri in JEJU Island. Tjl 2017, 17, 119–163. [Google Scholar] [CrossRef]
  27. Ko, C. A Study on Behavioral Intention of Eco-tourists through the Extended Theory of Planned Behavior: Focused on Sustainable Intelligence as Moderate Variable. J. Converg. Cult. Technol. (JCCT) 2023, 9, 315–330. [Google Scholar]
  28. Jang, Y.-C.; Lee, C.-W. Gotjawal Forest In Jeju Island as an Internationally Important Wetland. J. Wetl. Res. 2009, 11, 99–104. [Google Scholar]
  29. Kim, J.; Lim, H.; Choi, H.T.; Li, Q.; Moon, H.; Choi, H. Analysis on Water Retention Rate according to Water Cycle Characteristics in Jeju Gotjawal Forest. J. Environ. Sci. Int. 2022, 31, 1013–1025. [Google Scholar] [CrossRef]
  30. An, J.; Kim, T. A Hydrogeomorphological Approach to Irrigation Facilities in the Transition Zone to Mountain Area of Jeju Island. J. Korean Geomorphol. Assoc. 2015, 22, 17–27. [Google Scholar]
  31. Dongbaekdongsan Wetland Research Team. Encountering the Wetlands at Dongbaekdongsan; Jocheon-eup Ramsar Wetland City Area Management Committee: Jeju-si, Republic of Korea, 2017. [Google Scholar]
  32. Jung, S.; Yim, B.S.; Cho, Y.C.; Kim, J.-S.; Lee, C.S. Type and Vegetation of the Dongbaekdongsan Wetland in Jeju, a Southern Island of Korea. J. Wetl. Res. 2018, 20, 281–293. [Google Scholar]
  33. Ahn, U.S.; Sohn, Y.K.; Kang, S.S.; Jeon, Y.M.; Choi, H.S. The major causes of Gotjawal formation in Jeju Island. J. Geol. Soc. Korea 2015, 51, 1–19. [Google Scholar] [CrossRef]
  34. Park, J.B.; Kang, B.-R.; Koh, G.W.; Kim, G.-P. Geological characteristics of Gotjawal terrain in Jeju Island. J. Geol. Soc. Korea 2014, 50, 431–440. [Google Scholar] [CrossRef]
  35. Korea Meteorological Administrarion KMA Open MET Data Portal. Available online: https://data.kma.go.kr/data/grnd/selectAwsRltmList.do?pgmNo=56 (accessed on 22 May 2024).
  36. Ramsar Convention. Ramsar Hand books 5th Edition: An Introduction to the Ramsar Convention on Wetlands; Ramsar Convention Secretariat: Gland, Switzerland, 2016. [Google Scholar]
  37. Roux, M.; Larocque, M.; Nolet, P.; Bizhanimanzar, M. Geomorphological and Meteorological Drivers of Ephemeral Pond Hydrology in the Canadian Shield Forest. Hydrol. Process. 2023, 37, e15009. [Google Scholar] [CrossRef]
  38. National Institute of Biological Resources. Wetland Preference and Life Forms of Vascular Plants on the Korean Peninsula; National Institute of Biological Resources: Incheon, Republic of Korea, 2020; 235p, ISBN 8968114706, 9788968114700. [Google Scholar]
  39. U.S. Army Corps of Engineers, E.L. Corps of Engineers Wetland Delineation Manual. Available online: https://www.nae.usace.army.mil/Missions/Regulatory/Jurisdiction-and-Wetlands/Wetland-Delineation-Manual/ (accessed on 11 May 2024).
  40. Lichvar, R.; Gillrich, J.J. Examining Discrepancies Among Three Methods Used to Make Hydrophytic Vegetation Determinations for Wetland Delineation Purposes; US Army Engineer Research & Development Center, Cold Regions Research & Engineering Laboratory: Hanover, NH, USA, 2014. [Google Scholar]
  41. Wentworth, T.R.; Johnson, G.P.; Kologiski, R.L. Designation of Wetlands by Weighted Averages of Vegetation Data: A Preliminary Evaluation. J. Am. Water Resour. Assoc. 1988, 24, 389–396. [Google Scholar] [CrossRef]
  42. Westhoff, V.; Van Der Maarel, E. The Braun-Blanquet Approach. In Classification of Plant Communities; Springer: Dordrecht, The Netherlands, 1978; pp. 287–399. [Google Scholar]
  43. Koo, B.-H. Wetlnad Ecology; JoKyong Press: Tokyo, Japan, 2018. [Google Scholar]
  44. Moon, S.; Koo, B.-H. A Study on Korea Inland Wetland Boundary Delineation. J. Korea Soc. Environ. Restor. Technol. 2014, 17, 15–30. [Google Scholar] [CrossRef]
  45. McGarigal, K.; Marks, B.J. FRAGSTATS: Spatial Pattern Analysis Program for Quantifying Landscape Structure; Pacific Northwest Research Station: Portland, OR, USA, 1995. [Google Scholar] [CrossRef]
  46. Jeju Folklore and Natural History Museum. Original Color Atlas of Jeju Soil; Jeju Folklore and Natural History Museum: Jeju, Republic of Korea, 2000. [Google Scholar]
  47. Moser, K.; Ahn, C.; Noe, G. Characterization of Microtopography and Its Influence on Vegetation Patterns in Created Wetlands. Wetlands 2007, 27, 1081–1097. [Google Scholar] [CrossRef]
  48. Ministry of Environment of Korea. 2005 Nationwide Inland Wetland Natural Environment Survey—Jeju Island (Dongbaekdongsan, Yongsu Reservoir); Ministry of Environment of Korea: Sejong-si, Republic of Korea, 2005. [Google Scholar]
  49. Jeon, B.C.; Lee, S.; Kim, S.S.; Kim, K.S.; Kim, N. A Study on the Rainfall Infiltration Capacity of Soil (A Study on the Mid-Mountain Area of Jeju Island). J. Eng. Geol. 2019, 29, 99–112. [Google Scholar]
  50. Park, C.-S.; Kim, L.-Y.; Cho, S.-J. Classification of Volcanic Ash Soils and contribution of Organic Matter and Clay to Cation Exchange Capacity. Korean J. Soil Sci. Fertil. 1985, 18, 161–168. [Google Scholar]
  51. Luymes, N.; Chow-Fraser, P. Community Structure, Species–Habitat Relationships, and Conservation of Amphibians in Forested Vernal Pools in the Georgian Bay Region of Ontario. FACETS 2022, 7, 215–235. [Google Scholar] [CrossRef]
  52. Wakeley, J.S.; Sprecher, S.W.; Lichvar, R.W. Relationships among Wetland Indicators in Hawaiian Rain Forest. Wetlands 1996, 16, 173–184. [Google Scholar] [CrossRef]
  53. Foti, R.; del Jesus, M.; Rinaldo, A.; Rodriguez-Iturbe, I. Hydroperiod Regime Controls the Organization of Plant Species in Wetlands. Proc. Natl. Acad. Sci. USA 2012, 109, 19596–19600. [Google Scholar] [CrossRef]
  54. Greenway, M.; Jenkins, G.; Polson, C. Macrophyte Zonation in Stormwater Wetlands: Getting It Right! A Case Study from Subtropical Australia. Water Sci. Technol. 2007, 56, 223–231. [Google Scholar] [CrossRef]
  55. National Research Council Wetlands. Characteristics and Boundaries; National Academies Press: Washington, DC, USA, 1995. [Google Scholar]
  56. Rheinhardt, R.D.; Hollands, G.C. Classification of Vernal Pools: Geomorphic Setting and Distribution. In Science and Conservation of Vernal Pools in Northeastern North America; Calhoun, A.J.K., deMaynadier, P.G., Eds.; CRC Press: Boca Raton, FL, USA, 2008; pp. 11–29. [Google Scholar]
  57. Colburn, E.A. Vernal Pools: Natural History and Conservation; McDonald and Woodward Publishing Company: Blacksburg, OH, USA, 2004; ISBN 978-0-939923-91-5. [Google Scholar]
  58. Calhoun, A.J.K.; Walls, T.E.; Stockwell, S.S.; McCollough, M. Evaluating Vernal Pools as a Basis for Conservation Strategies: A Maine Case Study. Wetlands 2003, 23, 70–81. [Google Scholar] [CrossRef]
  59. Schrank, A.J.; Resh, S.C.; Previant, W.J.; Chimner, R.A. Characterization and Classification of Vernal Pool Vegetation, Soil, and Amphibians of Pictured Rocks National Lakeshore. Amid 2015, 174, 161–179. [Google Scholar] [CrossRef]
  60. Jeju Special Self-Governing Province. 2022 Groundwater Monitoring Annual Report; Jeju Special Self-Governing Province: Jeju, Republic of Korea, 2022; p. 158. [Google Scholar]
  61. Brooks, R.T.; Hayashi, M. Depth-Area-Volume and Hydroperiod Relationships of Ephemeral (Vernal) Forest Pools in Southern New England. Wetlands 2002, 22, 247–255. [Google Scholar] [CrossRef]
  62. Brooks, R.T. A Review of Basin Morphology and Pool Hydrology of Isolated Ponded Wetlands: Implications for Seasonal Forest Pools of the Northeastern United States. Wetl. Ecol. Manag. 2005, 13, 335–348. [Google Scholar] [CrossRef]
  63. Jeon, Y.; Ahn, U.S.; Ryu, C.G.; Kang, S.S.; Song, S.T. A review of geological characteristics of Gotjawal terrain in Jeju Island: Preliminary Study. J. Geol. Soc. Korea 2012, 48, 425–434. [Google Scholar]
  64. Kim, N.; You, Y.K.; Jeon, B.; Kim, D. A proposal of classification and evaluation method of pollution vulnerabilities by a highly permeable terrain in Jeju Island. J. Geol. Soc. Korea 2019, 55, 247–256. [Google Scholar] [CrossRef]
  65. Ban, H.; Kim, D. Influence of ‘Sumgol’ in Jeju on Ground Stability under Various Loading Conditions. J. Korean Geoenvironmental Soc. 2022, 23, 41–48. [Google Scholar] [CrossRef]
  66. Fu, Z.; Gu, X.; Xiao, J.; Dai, S.; Zhao, L.; Zhang, S.; Zeng, Z.; Yang, X. Global critical soil moisture thresholds of plant water stress. Nat. Commun. 2024, 15, 4924. [Google Scholar] [CrossRef] [PubMed]
  67. Gustafson, E.J.; Bronson, D.R.; Windmuller-Campione, M.A.; Slesak, R.A.; Donner, D.M. Measuring and modeling waterlogging tolerance to predict the future for threatened lowland ash forests. Biogeosciences 2025, 22, 2499–2515. [Google Scholar] [CrossRef]
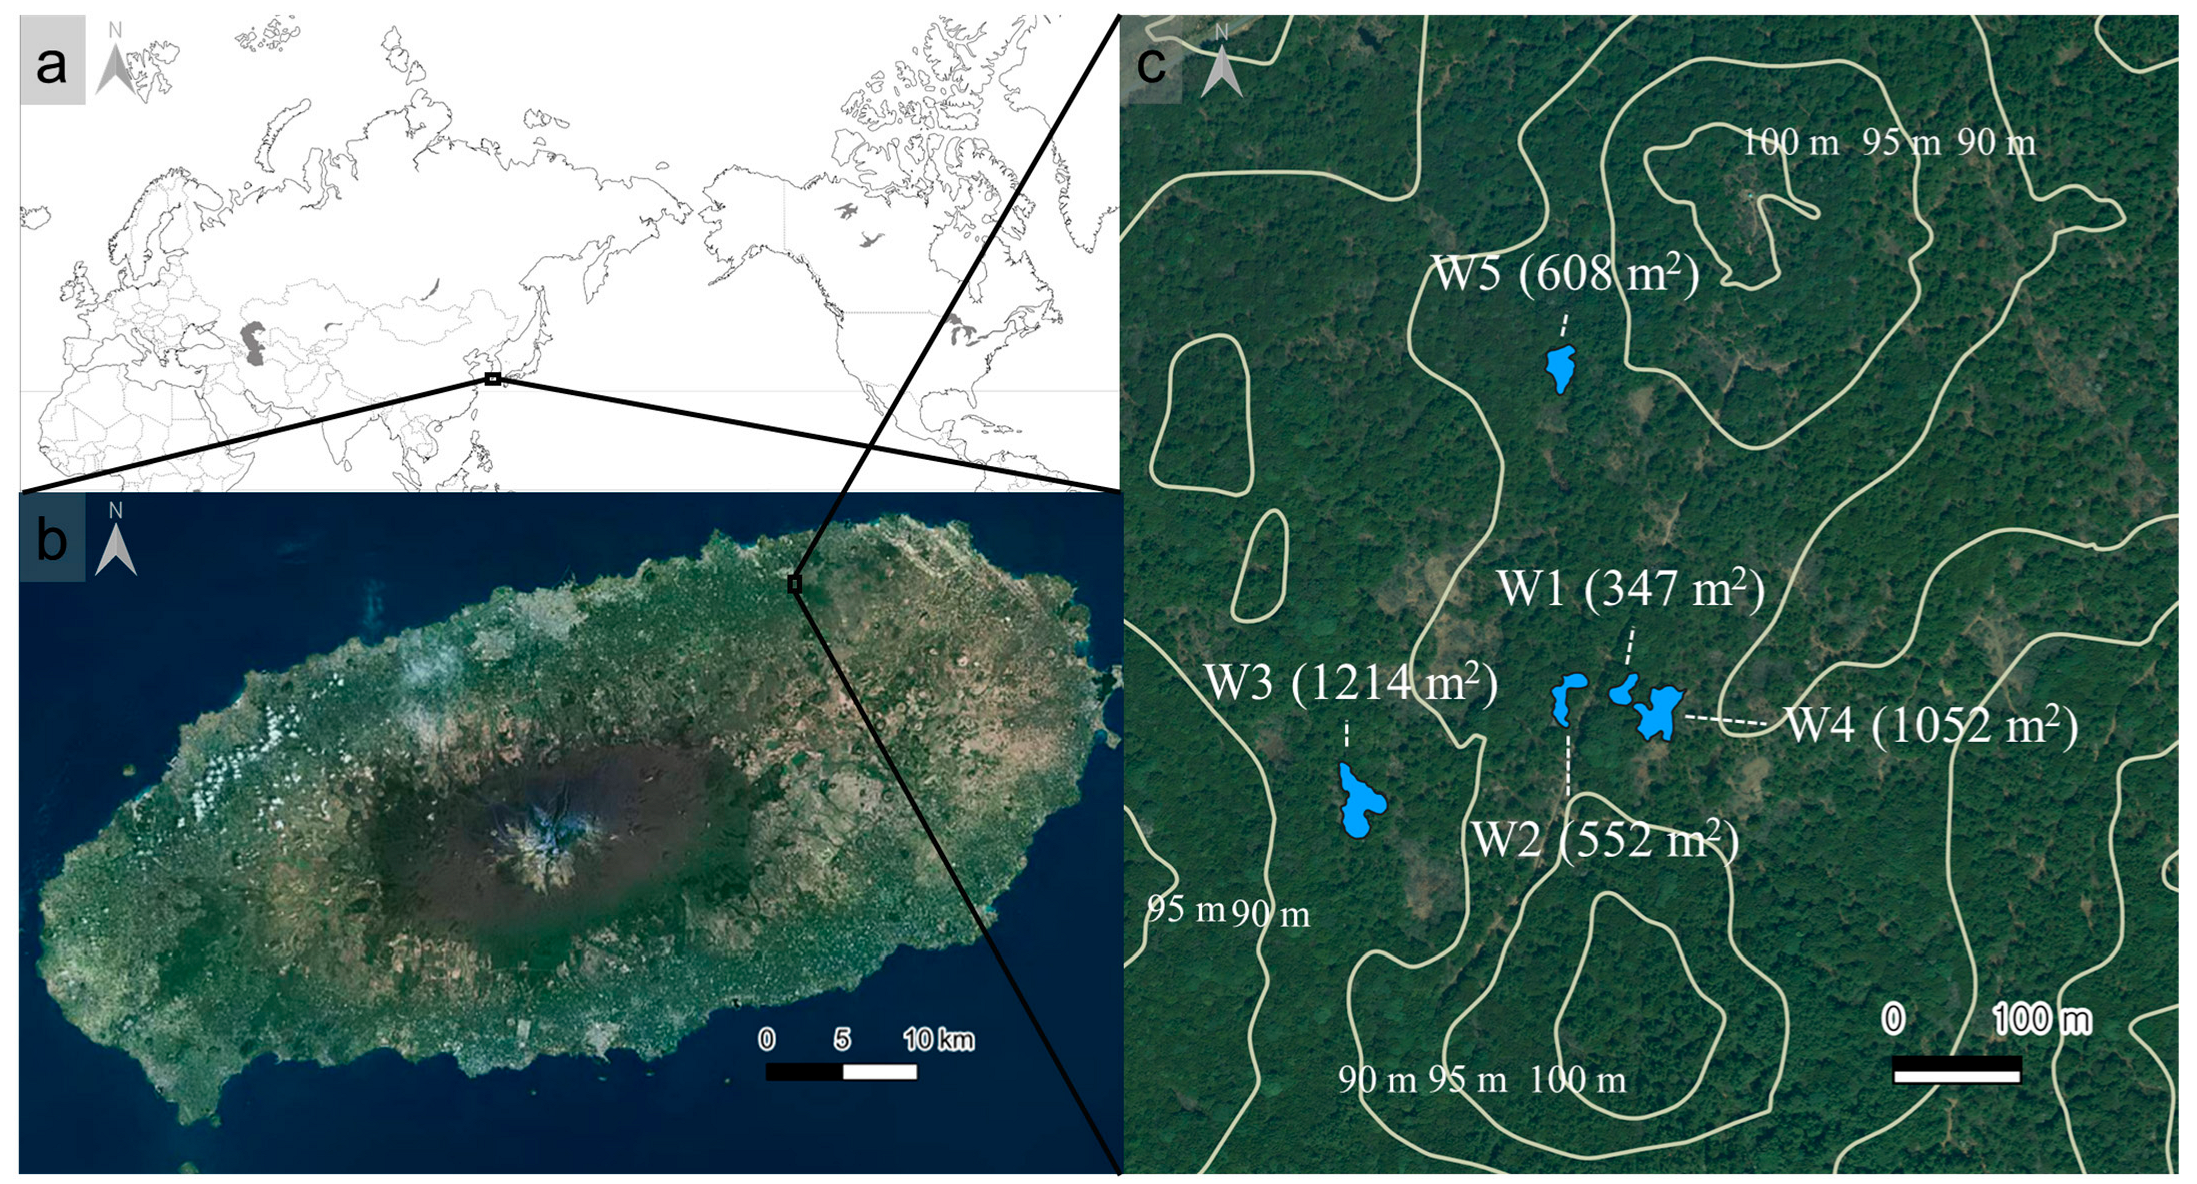
Figure 1. Location of the Study Area in Seonheul Gotjawal, Jeju Island, Republic of Korea: (a) Location of Jeju Island within East Asia; (b) Satellite view of Jeju Island showing the position of the study area; (c) Enlarged view of the study area in Seonheul Gotjawal showing five temporary wetlands (W1–W5) with area labels and 5 m contour intervals.
Forests 16 01770 g001
Figure 2. Climatic Background: Monthly Temperature and Precipitation (2020–2023) Compared to 2000–2019 Range: (a) Monthly average temperature; (b) Monthly precipitation. Solid blue line indicates the 20-year average (2000–2019), and the shaded bands represent the historical monthly maximum–minimum range.
Forests 16 01770 g002
Figure 3. Mean of Monthly Hydro Period Index Across Four Years (2020–2023): Shaded area indicates standard deviation. A value of 1.0 indicates wetlands that are continuously flooded. (a) W1; (b) W2; (c) W3; (d) W4; (e) W5.
Forests 16 01770 g003
Figure 4. Proportional Distribution of Plant Species by Wetland Indicator Status in Each Wetland: OBU: obligate upland plant; FACU: facultative upland plant; FAC: facultative plant; FACW: facultative wetland plant; OBW_Hygro: hygrophyte among obligate wetland plants; OBW_MacroEmer: emergent aquatic macrophyte among obligate wetland plants.
Forests 16 01770 g004
Figure 5. Hydrophytic Cover Index (HCI) and Prevalence Index (PI) in Temporary Wetlands (June–November 2023): HCI ≥ 50 indicates wetland; PI ≤ 3 typically indicates wetland, while 2.5–3.5 suggests need for additional indicators. (a) Monthly HCI patterns; (b) Monthly PI patterns.
Forests 16 01770 g005
Figure 6. Hydrological and Ecological Boundaries of Temporary Wetlands with Altitude and Contour Lines. (a) W1; (b) W2; (c) W3; (d) W4; (e) W5.
Forests 16 01770 g006
Figure 7. Topographic Profiles of Temporary Wetlands with Hydrological and Ecological Boundaries: Black solid lines represent altitude along the transects. Blue dashed lines indicate hydrological boundaries; red solid lines indicate ecological boundaries derived from vegetation. (a) W1; (b) W2; (c) W3; (d) W4; (e) W5.
Forests 16 01770 g007
Figure 8. Topographic Profiles and Soil Penetration Points Along Major Axes of Temporary Wetlands: Blue areas represent the target wetlands. gray arrow indicates north; letters (W1–W5) denote wetlands; gray contour lines and numbers represent altitude. (a) Map showing the location and orientation of the profile lines drawn through each wetland; (b) Elevation profile of W1 along the major axis intersecting the lowest elevation point; (c) Elevation profile of W2; (d) Elevation profile of W3; (e) Elevation profile of W4; (f) Elevation profile of W5. Black dots indicate soil penetration (depth) measurement points.
Forests 16 01770 g008
Figure 9. Radar chart comparing key hydrological and vegetation indices across the five temporary wetlands.; HPi: hydroperiod index; WRR: Water level Recession Rate; WIR: Water level Increase Rate; HCI: hydrophytic cover index; PI: Prevalence Index; All variables were normalized using a max-based scaling approach, in which the maximum value for each variable was set to 1 and the minimum to 0, allowing direct comparison across indicators with different units and ranges. Gray shaded areas represent the normalized index profile for each wetland. (a) W1; (b) W2; (c) W3; (d) W4; (e) W5.
Forests 16 01770 g009
Figure 10. Conceptual Cross-Sections of Temporary Wetland Types: Conceptual cross-sectional diagrams of three wetland types based on field observations and probe depth measurements; (a) Type A wetland (W1); (b) Type B wetland (W2, W3); (c) Two possible subsurface structures of Type C wetlands (W4, W5); Blue dashed lines represent the maximum observed water level. Hatched zones indicate dense lava layers (pāhoehoe-like). Subsurface structures are hypothetical due to the inability to directly observe belowground conditions.
Forests 16 01770 g010
Table 1. Wetland Indicator Status Categories and Definitions [39].
Wetland
Indicator Status
AbbreviationsEstimated Frequency of Occurrence
Obligate
wetland plant
OBWPlants almost always found in wetlands under natural conditions
(Estimated wetland occurrence frequency > 98%)
Facultative
wetland plant
FACWPlants mostly found in wetlands, but occasionally occur in upland areas
(Estimated wetland occurrence frequency: 71–98%)
Facultative plantFACPlants found in wetlands and uplands with similar frequency
(Estimated wetland occurrence frequency: 31–70%)
Facultative
upland plant
FACUPlants mostly found in upland areas, but occasionally occur in wetlands
(Estimated wetland occurrence frequency: 3–30%)
Obligate
upland plant
OBUPlants almost always found in upland areas under natural conditions
(Estimated wetland occurrence frequency < 3%)
Table 2. Mean Annual Hydrological Characteristics of Temporary Wetlands (2020–2023).
WetlandHydro Period Index (Year)Water Level (mm)Ponding
Frequency (Events/Year)
Ponding Period (Days/Event)
MeanMaxMeanMax
W10.76 ± 0.05372.3911.14.0 ± 1.3121.6 ± 59.8294.7
W20.13 ± 0.02479.81581.621.7 ± 3.82.2 ± 0.418.2
W30.16 ± 0.02954.52840.819.2 ± 2.73.0 ± 0.122.8
W40.23 ± 0.03290.2970.612.2 ± 1.16.9 ± 0.637.5
W50.32 ± 0.03219.4683.619.5 ± 2.56.1 ± 0.534.5
± indicates standard error.
Table 3. Geomorphological Characteristics of Temporary Wetlands.
WetlandAltitude (m)Area (m2)Perimeter (m)Shape IndexMajor Axis Length (m)Penetration
Depth (cm)
W188.5346.684.11.2726.027.8 ± 8.7
W287.8552.1135.71.6343.640.3 ± 17.8
W382.71214.0183.31.4860.735.1 ± 17.3
W488.01051.7177.71.5544.520.0 ± 1.9
W591.0607.6111.01.2739.921.2 ± 5.1
± indicates standard deviation.
Table 4. Physical Properties of Soils in Five Temporary Wetlands.
WetlandSoil TextureBulk Density
(g/cm3)
Ratio of Rock Fragments (%)Permeability Coefficient (m/day)
Sand (%)Silt (%)Clay (%)
W111.3 ± 1.566.8 ± 4.121.8 ± 5.60.37 ± 0.030.65 **0.22 ± 0.06
W214.2 ± 3.451.3 ± 4.134.5 ± 0.60.44 ± 0.011.45 ± 0.880.47 ± 0.28
W311.6 ± 1.743.3 ± 2.645.1 ± 2.90.46 ± 0.056.59 ± 0.906.25 ± 2.71
W46.9 ± 2.051.1 ± 9.141.9 ± 7.10.43 ± 0.020.66 ± 0.090.16 ± 0.03
W58.5 ± 1.761.2 ± 2.030.3 ± 1.90.57 ± 0.021.81 ± 0.550.85 ± 0.31
± indicates standard error. ** The standard error for ratio of rock fragments of W1 was not calculated due to zero values at two of three sampling points.
Table 5. Chemical Properties of Soils in Five Temporary Wetlands.
WetlandpHEC (dSm−1)Organic Matter (%)CEC (cmolc kg−1)
W15.27 ± 0.030.33 ± 0.0119.73 ± 0.3729.88 ± 0.12
W25.13 ± 0.120.39 ± 0.0322.18 ± 1.8135.38 ± 0.87
W35.57 ± 0.120.38 ± 0.0320.17 ± 1.4336.19 ± 1.76
W45.33 ± 0.030.40 ± 0.0423.13 ± 2.0935.25 ± 0.93
W55.37 ± 0.030.33 ± 0.0220.75 ± 0.7732.00 ± 0.77
± indicates standard error.
Table 6. Water Level Response Metrics of Five Temporary Wetlands (2020–2023).
WetlandFluctuation Time (h)WRR (mm/h)Fluctuation Time (h)WIR (mm/h)WIP
(mm/mm)
MeanMaxMeanMax
W18.041590.725.72601.550.45
W26.392451.645.21502.160.74
W36.052751.384.02503.341.48
W46.982110.573.48471.270.47
W57.692490.783.78361.810.63
WRR: Water level regression rate; WIR: Water level increase rate; WIP: Water level increase per precipitation.
Table 7. Correlation Coefficients Between Precipitation Variables and Water Level Increase Events.
WetlandCorrelation Coefficient with Water Level Change
Precipitation
Duration (h)
Total Precipitation (mm)Precipitation
Intensity (mm/h)
W10.710.770.44
W20.580.780.47
W30.600.750.48
W40.640.790.47
W50.670.740.45
Disclaimer/Publisher’s Note: The statements, opinions and data contained in all publications are solely those of the individual author(s) and contributor(s) and not of MDPI and/or the editor(s). MDPI and/or the editor(s) disclaim responsibility for any injury to people or property resulting from any ideas, methods, instructions or products referred to in the content.