Abstract
Tree planting strategies play a critical role in improving local wind environments. This study investigates the effects of tree crown morphology and planting layout on wind regulation at two vertical levels, pedestrian height (1.5 m) and low-altitude canopy level (5 m), in Macau, a high-density subtropical city. Field microclimate measurements were combined with computational fluid dynamics (CFD) simulations to quantify the performance of three typical crown morphologies (ellipsoidal, cylindrical, and conical) under six planting configurations. Results reveal differentiated impacts across heights; under single trees and opposite tree plantings, ellipsoidal crowns produced the least wind reduction at 1.5 m but the strongest blockage at 5 m, while conical crowns caused substantial attenuation at 1.5 m yet allowed faster wind recovery at 5 m. Planting layouts further modulated these effects; a single-row of ellipsoidal crowns balanced pedestrian ventilation with upper-level wind protection, whereas opposite tree pair planting, enclosure planting and curved planting displayed contrasting performances depending on species morphology. The findings demonstrate that optimizing tree morphology and layout can precisely regulate ventilation and sheltering across height layers. This study provides scientific evidence for vegetation configuration in hot–humid high-density cities, supporting climate-responsive urban planning and design.
1. Introduction
High-density cities in subtropical hot–humid regions are increasingly challenged by intensifying heatwaves driven by urbanization and climate change [1,2]. The urban heat island (UHI) effect poses serious threats to human health, environmental quality, and vegetation growth [3,4]. Urban greening, especially trees, offers a natural, low-cost, and sustainable pathway to mitigate heat through evapotranspiration, increased albedo, and shading, thereby improving thermal comfort [5,6,7]. While numerous studies highlight the shading effect of trees in alleviating heat stress [8], the wind regulation mechanisms of individual trees and tree configurations with different morphologies remain less explored.
UHI is defined thermally, but its magnitude within the urban canopy layer is tightly governed by advection, turbulent diffusion, and air–surface convective exchange [9,10,11]. Increases in mean wind speed and turbulence (i) raise the convective heat-transfer coefficient between warm surfaces and air, accelerating sensible-heat removal and lowering near-surface air temperature [12,13]; (ii) strengthen ventilation and three-dimensional mixing that import relatively cooler air and disperse anthropogenic heat and moist, warm air masses [14,15]; and (iii) hasten evening release of stored heat by sustaining larger air–surface temperature gradients [16]. Trees interact with wind by generating turbulence through canopy morphology and by modifying near-surface wind speed through their spatial configuration [17,18,19]. Accordingly, winds near treetop height (≈5 m) indicate block-scale ventilation and heat dispersion, whereas winds at pedestrian level (≈1.5 m) directly condition convective exchange in the human micro-environment and, consequently, local air temperature and perceived thermal stress.
Urban wind and heat are commonly examined at the mesoscale (≈2–2000 km) and microscale (<2 km) [3,20,21]. These scales describe the distribution of wind and heat across urban areas, from districts to blocks and down to the pedestrian level, each with distinct formation mechanisms and complex interactions [22]. Mesoscale circulations are induced by pressure differences associated with UHI, shaped by prevailing winds and convective air currents at the tropospheric boundary [23]. Urban structures and surface roughness further modulate these prevailing winds, creating diverse local wind environments [20]. At the vertical level, research in Hong Kong has shown that podium-level (0–15 m) air permeability strongly influences urban ventilation and determines wind speeds at the pedestrian level (≈2 m) [24]. In this context, assessing wind at ≈5 m and ≈1.5 m captures complementary processes, block-scale ventilation and pedestrian-level heat exchange, which jointly affect local thermal conditions [25,26,27]. However, most existing studies focus either on pedestrian thermal comfort at 1.5 m [25,26], or on ventilation at the canopy or urban scale [23,28], with limited attention to the differentiated effects of individual trees and tree groups across these two heights.
Computational fluid dynamics (CFD) has proven to be an effective and flexible tool to simulate wind speed variations in urban environments [20,27]. It is widely applied to model buoyancy-driven flows in street canyons and to evaluate pedestrian thermal comfort, using platforms such as ANSYS, ENVI-met, and OpenFOAM [29]. Although urban buildings are typically the dominant focus of CFD simulations, the aerodynamic effects of trees are equally important and warrant further investigation [19,21,28,30]. Among available CFD tools, WindPerfect DX offers specialized functions for modelling airflow and assessing the impacts of vegetation on the urban wind environment [31]. Previous studies have explored tree impacts through variations in species, canopy diameter, bole length, porosity, and leaf area index (LAI) [32,33,34]. However, these studies are often practice-oriented, providing planning guidelines [35,36], rather than systematically examining the micromechanical processes by which trees influence airflow.
To address this gap, the present study aims to elucidate the mechanisms by which tree crown morphology and layout regulate wind at different heights. Specifically, the objectives are to: (1) establish a parameterized CFD model based on typical crown morphologies (ellipsoidal, cylindrical, and conical) in a high-density, hot–humid city; (2) explain the differentiated effects of crown morphology and planting layout on wind at low altitude (≈5 m) and pedestrian height (≈1.5 m); and (3) propose tree-planting strategies for different planting scenarios (ventilation enhancement vs. wind protection) based on these mechanisms. Notably, this work is limited to aerodynamics: neither air temperature nor the urban energy budget is modeled, and the reported metrics serve as wind-modulation indicators rather than quantified reductions in UHI intensity.
2. Materials and Methods
2.1. Study Area
This study focuses on Macau, a high-density urban area located on the southeastern coast of China, which faces significant challenges related to UHI due to its limited land area, dense population, and scarce green spaces [3,37]. Situated in a hot–humid region, Macau experiences prolonged, extreme summer heat that imposes considerable stress on public health [2,38]. The summer season in Macau spans from June to September, as defined by the 25th–75th percentile thresholds [37]. According to records from the Macao Meteorological and Geophysical Bureau (2012–2021), an hourly summer climatology shows median temperatures of ~29–30 °C from 00:00–07:00, rising to ~30–33 °C at 12:00–15:00 (with the hourly 90th-percentile often above 34 °C), and easing to ~30–31 °C after ~20:00; the prevailing wind direction during the summer months is southerly, with wind speeds predominantly ranging from 2.36 to 2.86 m/s, as determined by the 30%–70% percentile thresholds (Figure 1).
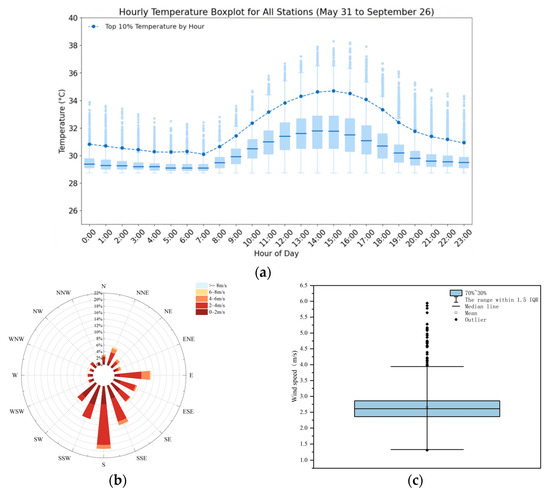
Figure 1.
Records from Taipa Grande meteorological station in Macau (2012–2021). (a) Hourly temperature boxplot in summer; (b) Wind rose chart from June to September; (c) Wind speed during summer.
In Macau, street and park vegetation primarily consists of small- to medium-sized tree species (Figure 2). While these trees provide limited shade, their impact on the wind environment remains insufficiently explored. In this compact and tourism-oriented city, the morphology and spatial arrangement of trees are particularly important for balancing aesthetic value with ecological cooling benefits. Therefore, this study adopts typical small- to medium-sized tree morphologies and the average summer wind speed as the basis for the numerical simulation.
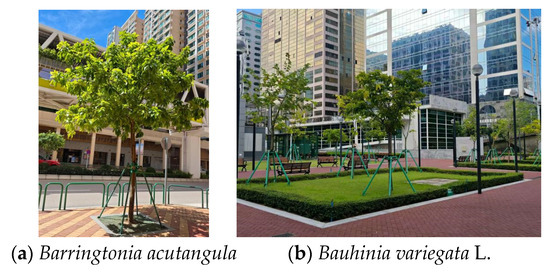
Figure 2.
Typical trees in Macau. (a) A roadside tree, photographed in Guangdong Avenue; (b) Park trees, photographed in Parque Dr. Carlos d’Assumpção.
2.2. Computational Fluid Dynamics (CFD) Simulation
Wind fields around tree crowns were simulated with WindPerfect (Cartesian finite-volume CFD solver) [39,40], which has been applied to thermal and wind environment studies [19,37]. The inlet profile followed a neutral power-law atmospheric boundary layer with a southerly approach, specified as = 2.9 m/s at 10 m (70th percentile of long-term Macao metrological stations’ observations), representing typical medium-to-high winds that reveal meaningful ventilation contrasts while limiting the influence of rare extremes (Equation (1)). This study focuses on the mechanisms by which tree morphology and planting layout influence wind speed. For comparability across canopy morphologies and layouts. Vegetation is treated as a porous medium with a flow-penetration effect; leaf area density (LAD) governs the foliage-induced flow resistance (), whose principle and formulation are given in Equation (2). In all simulations, LAD was fixed at 0.3 m2m−3 (solver default) for every morphology and layout so that foliage-induced form drag—and thus the depth/width of the wake velocity deficit and the downstream recovery distance—was controlled consistently across cases (Figure 3); holding LAD constant isolates shape-driven flow modulation among ellipsoidal, cylindrical, and conical crowns. Crown geometries used a total height , bole height (Table 1). Arrays for paired/row/circular/curved layouts used a centre-to-centre spacing of 6 m unless stated otherwise (Figure 4). This choice ensures comparability and control by adopting a uniform spacing that eliminates planting-density confounding so differences are attributable to morphology rather than spacing, while simultaneously limiting blockage and boundary effects to enhance aerodynamic observability and enable a clear comparison of ventilation pathways among crown morphologies.
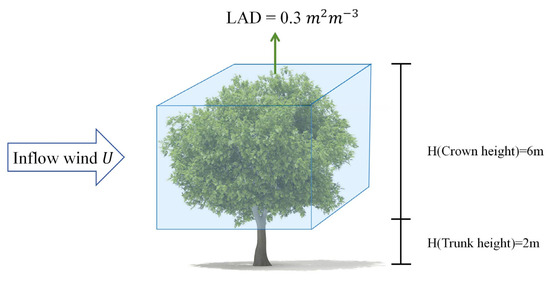
Figure 3.
Schematic of canopy geometry and LAD for a single tree.

Table 1.
Crown type.
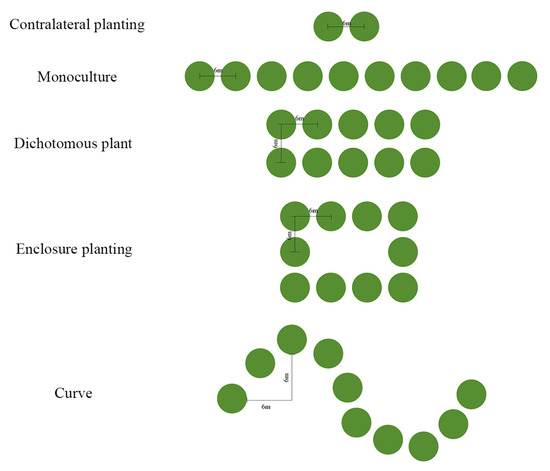
Figure 4.
Planting Layout.
Case-specific domains were scaled with the geometry to keep boundaries sufficiently distant from the crown/arrays and to avoid artificial recirculation. A non-uniform Cartesian mesh with a focal-refinement window around the crown was used in all cases, with minimum spacings of ≈0.05 m (horizontal) and ≈0.04 m (vertical) and progressive stretching outward; the total cell counts therefore varied by case (≈7.1–17.5 × 10⁶). Solutions were iterated until residuals plateaued and probe velocities along the sampling lines became stationary; the fine mesh was adopted for parametric runs.
To assess sensitivity to grid resolution, five total mesh sizes were tested: , , , , and cells. With refinement, the solution converged rapidly: once the total cell count reached , the mean-velocity profiles along the two crown centrelines ( and ) were already practically coincident at and ; further refinement to cells yielded no discernible differences in the centerline velocity profiles within plotting resolution (Figure A1). This indicates small error and insensitivity to additional refinement [41]. Accordingly, subsequent simulations scaled mesh resolution with model/domain size but never fell below the identified convergence threshold; a minimum of cells were used for parametric runs. Detailed settings are summarized in Table 2.
Table 2.
CFD simulation settings.
Inflow power-law:
Drag coefficient:
Notes: wind speed at height ; wind speed at 10 m; terrain exponent (class B: ); drag coefficient; drag force; fluid density; free-stream velocity; windward area.
2.3. Model Validation Against Field Measurements
Validation measurements were conducted in Jardim da Cruz (Taipa, Macau) at a designated point within an open grassed area (Figure 5). The site was selected to minimize confounding influences: (i) an unobstructed fetch with homogeneous surface roughness (grass) enabled stable pedestrian-level flow sampling; (ii) limited nearby building blockage and no pedestrian activity reduced anthropogenic disturbances; and (iii) the open area allowed secure deployment of a portable station at the required height. Wind speed at z = 1.5 m was recorded using a portable automatic weather station (HQ series, Table A1) mounted on a tripod and levelled on firm ground. Data were logged continuously during 30 August 2023, 10:00–17:00, and aggregated to hourly means (10:00–16:00) to pair with model outputs at the same coordinates and height. The 10 m reference wind used to drive the inflow profile was taken from the concurrent records of the municipal meteorological station. This site-specific comparison indicates that the adopted CFD configuration reproduces pedestrian-level wind magnitudes with high fidelity under the tested conditions, thereby supporting the credibility of the simulations (Figure A2).
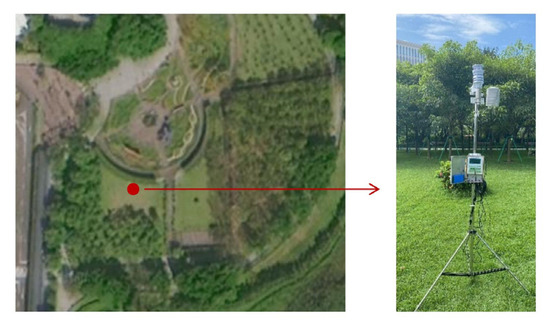
Figure 5.
Field measurement.
2.4. Quantification and Visualization
To quantify flow modification by crown morphology using only the measured centerline mean-velocity profiles, three publication-tested diagnostics were adopted in terminology consistent with Wang et al. [42]:
- (i)
- Relative wind velocity , the nondimensional mean speed normalized by the upstream reference at the same height;
- (ii)
- Wind-velocity reduction efficiency ( = (1 − /u0) × 100%), a compact measure of leeward deceleration magnitude;
- (iii)
- A threshold-based shelter-distance concept analogous to the effective shelter distance , here implemented as two solver-agnostic proxies—the downstream distance to 95% recovery (first ) and the 50% shelter depth (farthest ).
The upstream reference was computed as the mean of the most upwind (10%) samples at the analysis height to provide a robust baseline. Under a porous-medium representation with leaf area density held constant across morphologies and layouts, these metrics convert qualitative statements about “stronger/weaker sheltering” into concise, reproducible numbers without introducing additional model-dependent parameters, in line with established aerodynamic assessment practice for porous obstacles [42]. Moreover, while drag coefficients and turbulence intensity can be informative, a global for a porous canopy is representation-dependent, and reliable turbulence intensity requires fluctuation data not available in mean-profile tables; the chosen , , and -type thresholds therefore offer a clean, directly computable alternative that strengthens the evidence base beyond descriptive narration.
Given that ventilation effects in multi-tree layouts depend sensitively on spacing, relative orientation, and enclosure geometry, which are not fully standardized across configurations, quantitative indicators are restricted to single trees crown morphology to isolate intrinsic shape effects. Layout effects are presented through flow maps and profile descriptions to elucidate mechanisms, avoiding over-quantification in the absence of a unified geometric reference.
3. Results
3.1. Impact of Tree Crown Morphology on the Wind Environment
At the pedestrian height (1.5 m), all crown types exhibit minimal centerline attenuation (Table 3; Figure 6, Figure 7 and Figure 8). The ellipsoidal crown shows negligible reduction (minimum ; ), indicating an almost undisturbed flow along the mid-height section. The cylindrical crown produces moderate deceleration (minimum ; ), while the conical crown yields the largest near-ground reduction among the three yet remains limited in magnitude (minimum ; ). Recovery to 95% of the inflow velocity occurs almost immediately downstream ( m for all morphologies), and no distinct strong-shelter zone is present at the centerline ( m).
Table 3.
Centerline wind metrics.
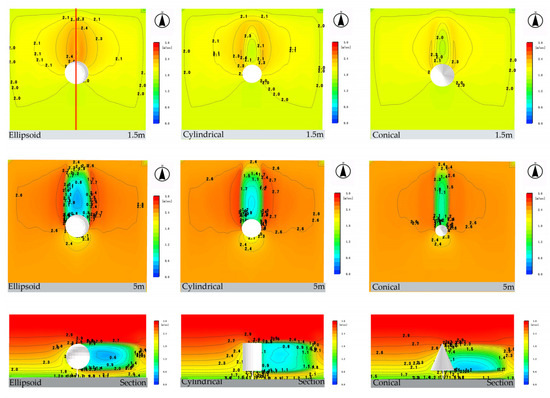
Figure 6.
Simulation results of the impact of single-tree planting on wind speed.
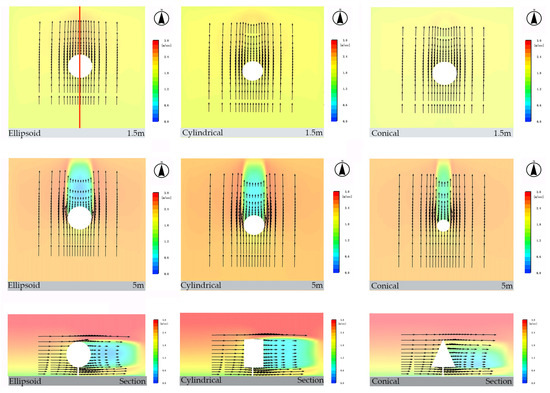
Figure 7.
Simulated wind-field distribution and flow direction for single planting.
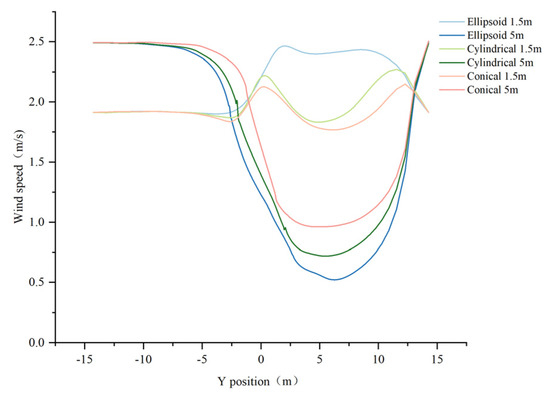
Figure 8.
Line chart of crown shape and wind speed. Wind speed was obtained at 1.5 m (X = 0, Y = −15–15, Z = 1.5) and 5 m (X = 0, Y = −15–15, Z = 5).
At the canopy height (5 m), morphology-induced sheltering becomes pronounced (Table 3; Figure 6, Figure 7 and Figure 8). The ellipsoidal crown produces the strongest flow reduction (minimum at ; ), followed by the cylindrical (minimum at ; ) and the conical (minimum at; ). The extent of the strong-shelter zone, represented by , follows the same order—11.54, 10.88, and 10.30 m for ellipsoidal, cylindrical, and conical forms, respectively—indicating that broader and fuller crowns sustain deeper wakes. In all cases, the flow does not recover to 95% of the inflow speed until the downstream limit of the computational domain ( m), confirming a long-range wake persistence at this height.
In summary, at pedestrian height, the three crowns show small but discernible differences: conical reduces centerline flow the most, cylindrical is moderate, and ellipsoidal the least; whereas at canopy height the contrasts become pronounced, with ellipsoidal producing the deepest and most persistent wake, cylindrical intermediate, conical weakest and recovery not achieved within the downstream span considered.
3.2. Impact of Tree Planting Layout on the Wind Environment
3.2.1. Opposite Tree Planting
At 1.5 m height, the airflow under the opposite tree planting configuration exhibits clear acceleration both along the windward canopy edges and within the region between the two crowns, while the outer unobstructed zones remain relatively steady (Figure 9, Figure 10 and Figure 11). The ellipsoidal canopy produced the greatest increase, followed by the cylindrical and then the conical form. With an incoming wind speed of 1.9 m/s, the wind velocity rose to 2.43 m/s, 2.24 m/s, and 2.03 m/s, respectively, before gradually declining.
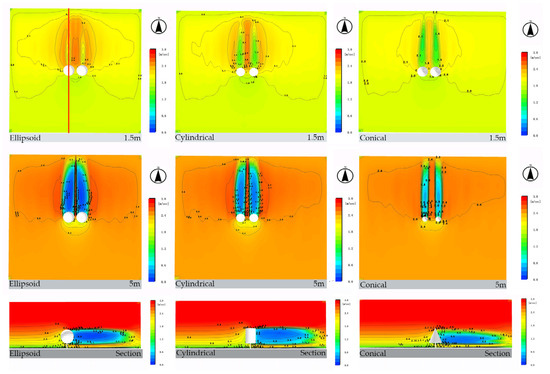
Figure 9.
Simulation results of the impact of opposite tree planting on wind speed.
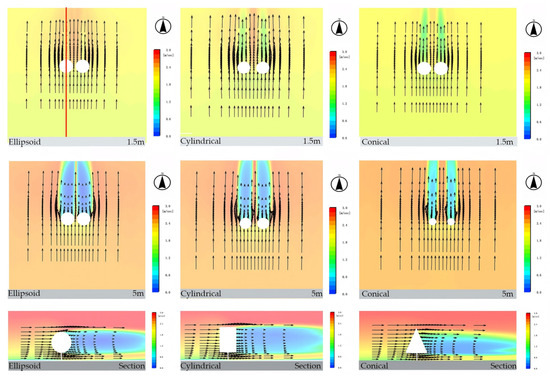
Figure 10.
Simulated wind-field distribution and flow direction for opposite tree planting.
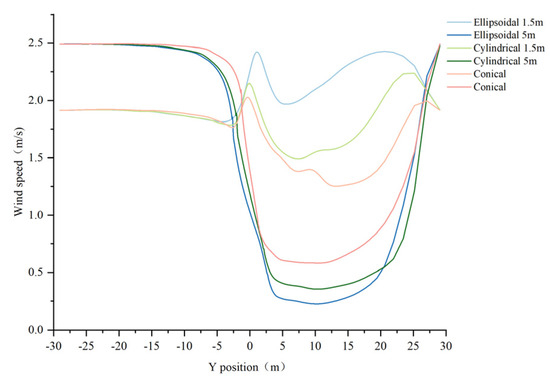
Figure 11.
Line chart of opposite tree planting and wind speed. Wind speed was obtained at 1.5 m (X = 3, Y = −30–30, Z = 1.5) and 5 m (X = 3, Y = −30–30, Z = 5).
At 5 m, wind speed attenuation was more pronounced. Under an incoming wind speed of 2.5 m/s, the presence of tree canopies caused a sharp reduction, forming a distinct low-velocity wake zone. The minimum wind speeds were 0.27 m/s for the ellipsoidal canopy, 0.43 m/s for the cylindrical canopy, and 0.68 m/s for the conical canopy, highlighting the differing degrees of airflow obstruction imposed by each canopy morphology. Across both observation heights (1.5 m and 5 m), no pronounced flow-direction deflection was observed in the leeward wake for any canopy morphology.
3.2.2. Single-Row Planting
At a pedestrian-level height of 1.5 m, the comparative analysis indicates that the ellipsoidal canopy produces the weakest attenuation of wind speed, followed by the cylindrical canopy, while the conical canopy exhibits the strongest attenuation (Figure 12 and Figure 13). Overall, no persistent recirculation is observed at 1.5 m (Figure 14); specifically, pronounced lateral channeling develops on both sides of the cylindrical canopy, whereas the conical canopy induces a sustained near-ground low-velocity zone.
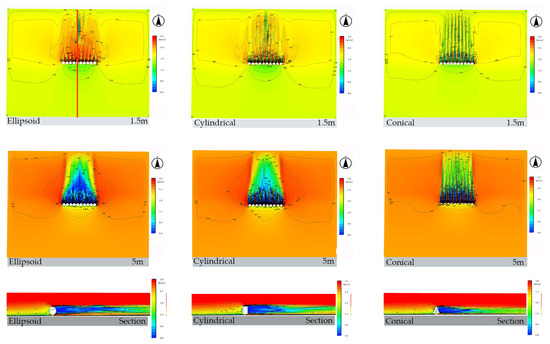
Figure 12.
Simulation results of the impact of single-row planting on wind speed.
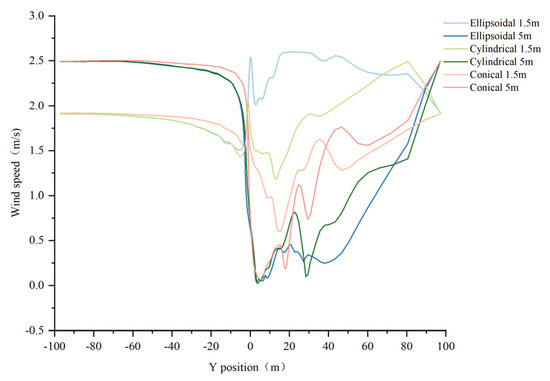
Figure 13.
Line chart of single-row planting and wind speed. Wind speed was obtained at 1.5 m (X = 23, Y = −100–100, Z = 1.5) and 5 m (X = 23, Y = −100–100, Z = 5).
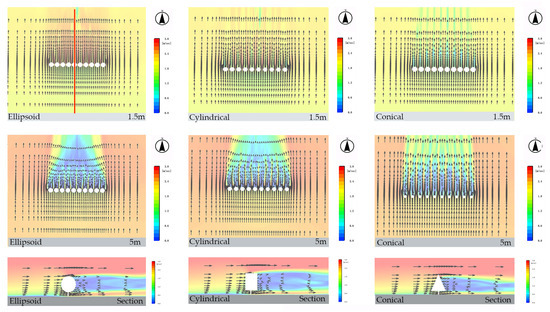
Figure 14.
Simulated wind-field distribution and flow direction for single-row planting.
At 5 m height, all three crown morphologies induce pronounced wind-speed attenuation, albeit to differing degrees: the ellipsoidal canopy yields the greatest leeward reduction, the cylindrical canopy is intermediate, and the conical canopy the weakest. At this elevation, canopy–flow interactions intensify; the ellipsoidal canopy produces a longer leeward low-velocity wake, the conical canopy—owing to its tapered apex that permits partial through-flow—forms the shortest low-speed zone, with the cylindrical canopy falls between the two in magnitude.
3.2.3. Opposite Tree Pair Planting
The simulation results (Figure 15 and Figure 16) and the line chart of wind speed variation (Figure 17) illustrate that, under the opposite tree pair planting configuration, the wind speed responses at 1.5 m height exhibit pronounced differences among canopy morphologies. For the ellipsoidal canopy, the relatively weak attenuation of near-surface wind and the shorter reattachment distance lead to a faster recovery of downstream wind speed. In contrast, the cylindrical canopy generates a relatively stable wake zone behind the trees, showing a lower reattachment rate and thus weaker recovery capacity. The conical canopy, with a larger windward cross-section at the lower part, imposes the strongest reduction on near-surface airflow.
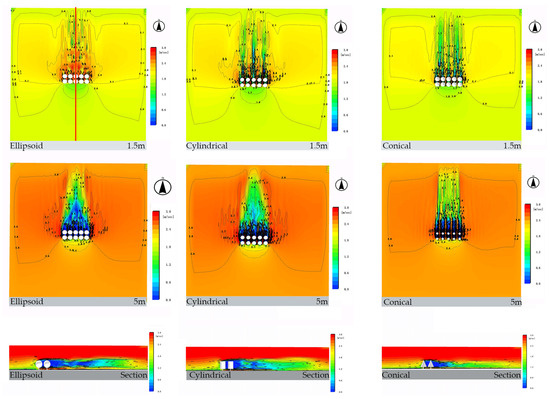
Figure 15.
Simulation Results of Wind Speed under opposite tree pair planting.
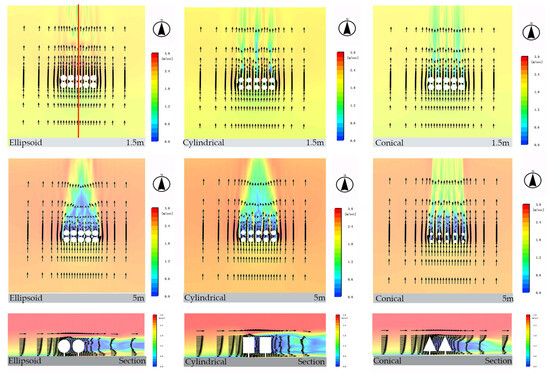
Figure 16.
Simulated wind-field distribution and flow direction for opposite tree pair planting.
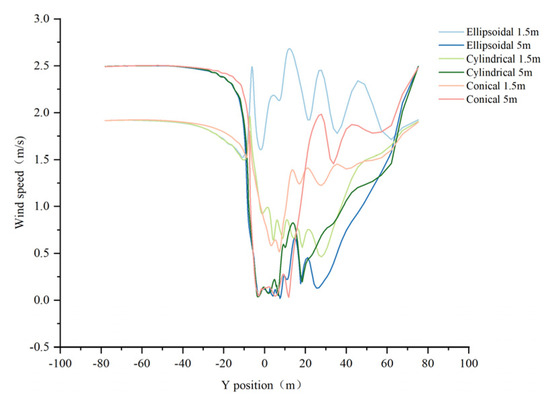
Figure 17.
Line chart of opposite tree pair planting and wind speed. Wind speed was obtained at 1.5 m (X = 12, Y = −80–80, Z = 1.5) and 5 m (X = 12, Y = −80–80, Z = 5).
The impact of crown morphology on wind speed at 5 m differs markedly from that at 1.5 m. The ellipsoidal canopy exerts stronger blockage on the upper-layer flow, resulting in more pronounced wind-speed attenuation and a slower recovery. By contrast, the conical canopy has a substantially reduced radial dimension at this elevation, weakening direct obstruction; consequently, it yields the smallest attenuation and the fastest recovery. The cylindrical canopy exhibits an intermediate response in both attenuation and recovery.
At both heights, wind speed recovers to the inflow levels (1.9 m/s at 1.5 m and 2.5 m/s at 5 m) at approximately 75 m downstream. Overall, the opposite tree pair planting configuration highlights differentiated patterns of attenuation intensity and recovery rate among the three canopy morphologies at different vertical layers.
3.2.4. Enclosure Planting
At a height of 1.5 m, the overall wind speed attenuation effect is relatively weak for the ellipsoidal canopy, moderate for the cylindrical canopy, and strongest for the conical canopy, as evidenced by Figure 18 and Figure 19. From a local perspective, when the airflow first encounters the canopy of the first tree, wind speed decreases, with the minimum dropping to 1.48 m/s. It then increases markedly, rising from the inflow velocity of 1.92 m/s to a peak of 2.45 m/s. Approaching the windward side of the second tree, the velocity declines again, reaching a minimum of 0.5 m/s, before gradually recovering to the inflow level.
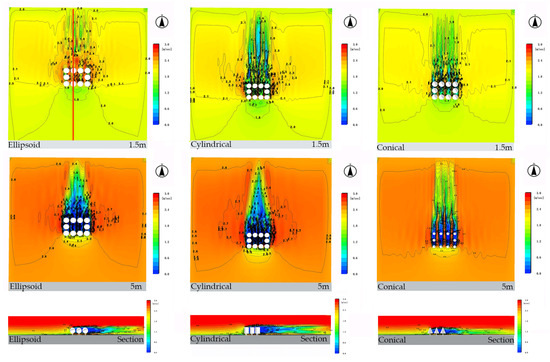
Figure 18.
Simulation results of impact of enclosure planting on wind speed.
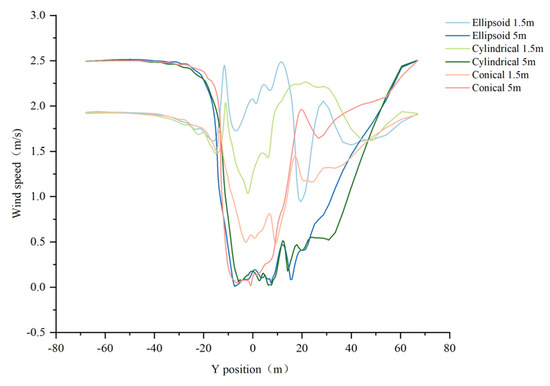
Figure 19.
Line chart of enclosure planting and wind speed. Wind speed was obtained at 1.5 m (X = 6, Y = −70–70, Z = 1.5) and 5 m (X = 6, Y = −70–70, Z = 5).
Under an enclosure planting, the wind field at the 5 m level is characterized by stronger bypass along the flanking rows of crowns, while recirculation within the central open void is comparatively weak (Figure 20). Owing to their larger frontal (projected) areas to the flow, ellipsoidal and cylindrical canopies induce more pronounced recirculation downstream of the second row; by contrast, the conical canopy exhibits less lee-side recirculation. Locally, wind speed shows a sharp drop upon impingement with the canopy layer. The ellipsoidal canopy imposes stronger blockage on the upper-layer flow, leading to greater attenuation and slower recovery; the cylindrical response is intermediate; and the conical canopy, while providing the weakest suppression, enables the fastest downstream recovery. These results indicate that canopy morphology, in concert with contact height and flow-field structure, produces marked spatial heterogeneity in wind speed.
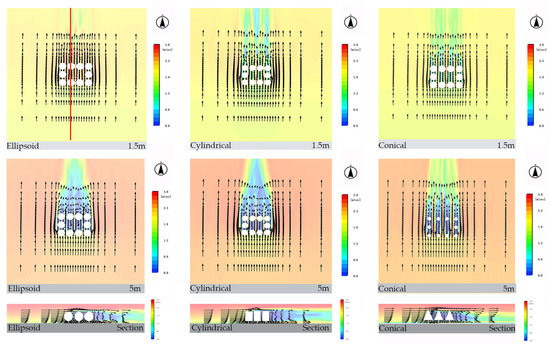
Figure 20.
Simulated wind-field distribution and flow direction for enclosure planting.
3.2.5. Curved Planting
Flow-field analysis shows that, at 1.5 m under a curved planting layout, a pronounced inflow deflection develops along the convex arc segment (Figure 21). In terms of local response, the ellipsoidal canopy produces the weakest attenuation of wind speed yet exhibits the slowest recovery (Figure 22 and Figure 23); by contrast, the cylindrical and conical canopies respond more sensitively to wind-speed variations and display comparable recovery capacity.
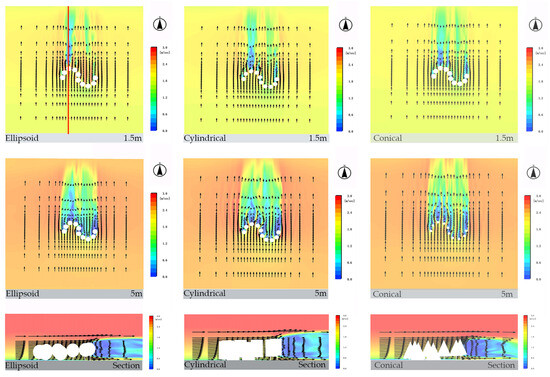
Figure 21.
Simulated wind-field distribution and flow direction for curved planting.
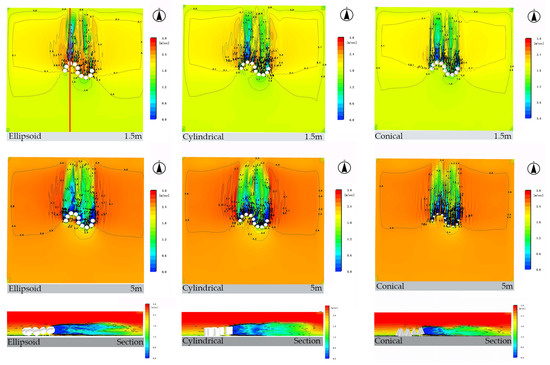
Figure 22.
Simulation results of impact of curved planting on wind speed.
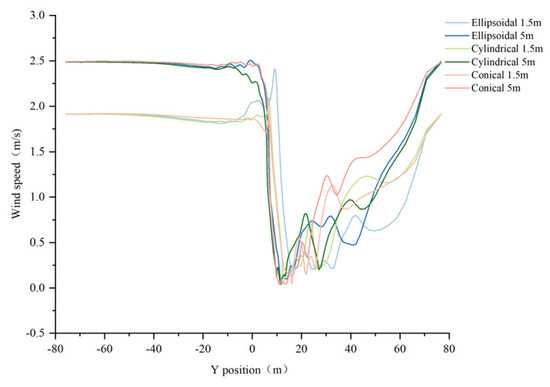
Figure 23.
Line chart of curved planting and wind speed. Wind speed was obtained at 1.5 m (X = 6, Y = −75–75, Z = 1.5) and 5 m (X = 6, Y = −75–75, Z = 5).
At 5 m height, the differences among canopy morphologies become more pronounced. The simulation results indicate that the conical canopy generates a local minimum wind speed as low as 0.04 m/s, yet the downstream recovery rate is the fastest. By comparison, the cylindrical and ellipsoidal canopies maintain higher minimum wind speeds but display relatively slower recovery processes.
4. Discussion
4.1. Vertical Stratification of Tree Crown Morphology as a Regulatory Mechanism for Wind Environments
The simulation results demonstrate that tree crown morphology plays a critical role in shaping vertical wind speed profiles, with distinct crown forms producing variable attenuation effects at 1.5 m and 5 m heights. This is consistent with the findings of previous studies [43,44]. The simulation results highlight pronounced differences among the three tree crown morphologies in regulating wind environments at different vertical layers.
The ellipsoidal tree crown exhibited the weakest attenuation of wind speed at 1.5 m, thereby enhancing near-surface air circulation. By contrast, the conical tree crown produced the most substantial reduction in near-surface winds at 1.5 m. The cylindrical tree crown consistently demonstrated intermediate effects between the ellipsoidal and conical forms, both in terms of wind speed attenuation and recovery, reflecting a more balanced aerodynamic influence across vertical layers. This overall pattern is consistent with the conclusion that trees with conical canopies are subjected to less aerodynamic resistance than those with cylindrical canopies [45].
This result is mainly due to the fact that airflow at 1.5 m height is significantly affected by ground friction and obstacles, and the tree crown acts mainly as a porous obstacle at this height [46]. Tree crown morphology regulates airflow by altering vertical porosity, which determines aerodynamic resistance [47]. Ellipsoidal canopies, with open bases, create low-drag channels that weaken sheltering effects and minimize wind speed attenuation. Conical canopies, with wide and dense bases, disrupt vertical porosity, increase resistance, and force airflow upward or around the tree crown, producing the strongest attenuation. Cylindrical canopies maintain relatively uniform porosity, resulting in moderate resistance and intermediate effects between ellipsoidal and conical forms.
This study found that at a height of 5 m, the elliptical tree crown produced the strongest wind speed blockage and the slowest recovery, whereas the conical tree crown, with its spire-like structure, facilitated upward airflow and reduced resistance, thereby achieving the fastest recovery. The simulation results further suggest that the streamlined cusp of the conical tree crown minimized airflow disturbance by guiding smooth upward acceleration along its sloped surface and generating a Venturi effect [48], which enhanced wind speed recovery in the wake region. The cylindrical tree crown exhibited intermediate effects, with both wind speed attenuation and recovery falling between those of the elliptical and conical forms.
However, the rounded apex of the ellipsoidal tree crown is susceptible to flow separation [49] as airflow passes over its highest point, resulting in a low-pressure, turbulent wake region downstream [50]. The abrupt termination of the vertical boundary at the top of cylindrical canopies also induces flow separation, though to a lesser extent than in rounded ellipsoids but more pronounced than in streamlined conical canopies. As a result, its impact on wind speeds lies between that of the conical and ellipsoidal forms.
4.2. Effects of Planting Configuration on Wind Speed and Optimization Strategies
This study revealed that the influence of tree crown shape on the wind environment varies substantially with the scale of planting configurations, shifting from single trees to larger groups. Different configurations generate complex hydrodynamic effects by reshaping the local flow field, producing outcomes that extend well beyond the simple superposition of individual trees. Different spatial arrangements of trees influence wind speed to varying degrees, a finding that is consistent with previous studies [51]. An appropriate configuration not only enhances thermal and pedestrian comfort, but also guides urban wind corridors and improves neighborhood-scale ventilation efficiency, aligning closely with the positive environmental impacts reported by Hsieh et al. [19].
This study found that double planting initially produces mutual interference between adjacent tree canopies, leading to sharper fluctuations in the wind speed profile compared with the single-planting case. Other studies have reported similar findings [52]. When the configuration is extended to single-row planting, trees begin to function as a continuous barrier, with flow characteristics largely governed by the horizontal continuity of tree crown structure. More complex flow dynamics emerge under opposite tree pair and enclosure planting configurations. As shown in Figure 14, the opposite tree pair planting arrangement generates a characteristic “W”-shaped wind speed profile: airflow decelerates upon encountering the first row, accelerates within the confined channel between the two rows, and decelerates again upon impacting the second row. Within this system, the influence of tree crown morphology becomes multidimensional. Similar patterns of tree–tree aerodynamic interactions have also been reported in previous studies [53].
This study systematically demonstrates the distinct behavioral patterns of different tree crown shapes during this transition, highlighting that the selection of an optimal tree form should be closely aligned with the scale of the intended planting configuration, rather than evaluated solely on the basis of its monoculture characteristics.
4.3. Practical Implications for Urban Planning and Wind Environment Optimization
In pedestrian-intensive areas such as streets, squares, and park rest zones, maintaining ventilation comfort at 1.5 m is essential to prevent heat buildup and pollutant stagnation, some studies have also illustrated the importance of pedestrian ventilation [54,55,56]. This study shows that ellipsoidal canopies, under opposite tree pair planting and single-row planting, provide the least wind attenuation at this height and may even create localized acceleration, making them particularly suitable for such contexts. At 5 m, their strong blocking effect further helps to reduce wind impacts near the corners of low-rise buildings. In areas that demand protection from strong winds, reducing wind speeds at pedestrian height is essential. The broad base of conical crowns substantially weakens winds at 1.5 m, offering effective ground shelter. Other studies have reached similar conclusions [57]. Thus, conical-crowned trees are well suited for fencing or strip planting in open spaces to establish efficient windbreak systems. Cylindrical canopy trees’ moderating effects help avoid poor near-ground ventilation, limit high-altitude wind-shadow zones, and promote a smoother transition in the wind environment. There are also studies that have come to similar conclusions [58]. They are recommended for transitional zones requiring both ventilation and protection, such as inter-building corridors and low-density residential areas.
Planting configuration patterns should be designed in coordination with tree crown morphology. When the design objective is to enhance ventilation, single or opposite tree pair plantings of ellipsoidal crowns are recommended. As demonstrated in this study, such arrangements can utilize canopy gaps to form effective ventilation corridors. In particular, opposite tree pair planting generates significant wind acceleration between rows, making it suitable for channeling prevailing summer winds. Conversely, when wind protection is the primary goal, enclosure planting of conical crowns are preferable. Their broad bases create a continuous windbreak, while their streamlined tops reduce undesirable turbulence and allow the wind field to recover smoothly in the leeward zone. Some studies have come to similar conclusions [59]. As found in other studies [60,61], this study also found that trees was particularly effective in establishing a sheltered microclimate, such as in parks or children’s playgrounds, where the enclosed wind field becomes more complex and overall wind speeds are significantly reduced. Within such enclosures, ellipsoidal crowns are most suitable when internal ventilation is prioritized, whereas conical or cylindrical crowns are more appropriate when the goal is to block strong external winds.
Moreover, the regulation of urban wind environments is closely linked to the mitigation of the UHI effect. UHI arises primarily from the imbalance between heat storage and dissipation within dense urban fabrics, where insufficient ventilation inhibits convective and evaporative cooling [62]. The results of this study indicate that tree crown morphology and planting configuration can effectively modulate airflow patterns that influence these heat transfer processes. Some studies also illustrate the critical importance of trees for UHI mitigation [63,64,65]. Trees in particular are an influence on wind speed and direction [66,67]. Optimizing canopy aerodynamics is not only crucial for wind comfort but also for the thermal regulation of urban microclimates, offering a biophysical pathway through which vegetation design can mitigate UHI intensity at a local scale.
This study highlights the importance of precision design based on wind environment considerations. Recognizing canopy aerodynamics as equally important as aesthetic and ecological values enables urban green spaces to function not only as visual amenities but also as infrastructures for active microclimate regulation.
4.4. Limitations of the Study and Future Research
This study has several limitations. First, an idealized canopy model with a fixed geometric form and uniform surface was employed, whereas real trees are inherently dynamic, heterogeneous, and structurally complex. Future research should consider a wider range of tree heights and aspect ratios, incorporate key biophysical parameters such as the vertical distributions of leaf area index (LAI) and leaf area density (LAD), spatial and temporal variations in canopy porosity (e.g., between deciduous and evergreen species), and branch flexibility. In addition, future studies should extend the analysis to include more diverse canopy geometries (e.g., hemispherical and umbrella-like forms) and morphometric traits (e.g., aspect ratio, volume, and projected area) to establish more generalized predictive models. Second, the simulations were conducted under the assumption of a steady, unidirectional inflow, whereas the actual urban wind environment is highly variable. Furthermore, only a single day of field measurements was used to validate the simulation results. Accordingly, future studies should focus on evaluating the performance of various planting configurations under fluctuating wind speeds and directions, while incorporating seasonal dynamics of urban wind conditions. Finally, this study focused solely on aerodynamic effects and did not account for thermal influences. In real environments, temperature gradients substantially affect atmospheric stability and airflow patterns. Future work should combine CFD with urban canopy models to assess the thermal comfort contributions of evapotranspiration and heat exchange in various tree species.
5. Conclusions
This study systematically investigated the regulatory effects of tree crown morphology and planting layout on the urban wind environment at pedestrian height (1.5 m) and low-canopy height (5 m) in a high-density hot–humid city. The results demonstrate that vertical stratification of wind speed is primarily governed by crown morphology: under single trees and opposite tree planting conditions, ellipsoidal crowns enhance near-surface ventilation but create strong obstruction aloft; conical tree canopy provides effective shade at the understory level while facilitating airflow at the upper layers; and cylindrical crowns consistently exhibit intermediate effects between the two. Planting layouts further amplify or moderate these differences: opposite tree planting and single-tree planting exert similar influences on the surrounding wind environment; opposite tree pair planting generates a pronounced channel effect at pedestrian height, intensifying inter-row acceleration; single-row ellipsoidal crowns balance pedestrian-level ventilation with upper-layer blockage; enclosure planting magnify intra-area wind speed differences; and in a curved planting arrangement, the post-canopy wind speed behind ellipsoidal crowns exhibits a slower recovery. Accordingly, different site conditions should be matched with appropriate crown forms and planting configurations to optimize pedestrian thermal comfort and improve low-altitude ventilation corridors.
Overall, this study emphasizes the importance of incorporating crown morphology and spatial configuration into refined urban greening design. By doing so, urban green spaces can serve not only ecological and aesthetic functions but also act as infrastructures for active microclimate regulation, thereby providing scientific support for enhancing climate resilience in high-density hot–humid cities.
Author Contributions
Conceptualization, H.Q., L.P., X.W., C.-M.H. and S.G.; Methodology, H.Q., L.P. and C.-M.H.; Software, H.Q., L.P. and S.G.; Validation, H.Q.; Formal analysis, H.Q.; Resources, C.-M.H.; Data curation, H.Q. and L.P.; Writing—original draft, H.Q., L.P. and X.W.; Writing—review & editing, H.Q., L.P., X.W. and C.-M.H.; Visualization, H.Q.; Supervision, C.-M.H.; Project administration, C.-M.H.; Funding acquisition, C.-M.H. All authors have read and agreed to the published version of the manuscript.
Funding
This research was funded by the Science and Technology Development Fund (0057/2022/A and 0003/2025/RIA1) of Macau.
Informed Consent Statement
Informed consent was obtained from all subjects involved in the study.
Data Availability Statement
The data presented in this study are available on request from the corresponding author due to data privacy.
Acknowledgments
The authors would like to acknowledge the data support provided by the Macao Special Administrative Region Government, Macao Meteorological and Geophysical Bureau (SMG), and the field support offered by the Municipal Affairs Bureau of Macao (IAM).
Conflicts of Interest
The authors declare no conflicts of interest.
Appendix A

Figure A1.
Grid Verification. (a) Grid fitting performance at X = 0; (b) Grid fitting performance at Y = 0.

Figure A2.
Experimental and simulated results.
Table A1.
Specifications of field measurement instruments.
Table A1.
Specifications of field measurement instruments.
| Instrument Name | Model | Quantity | Range | Resolution | Accuracy |
|---|---|---|---|---|---|
| Total Solar Radiation Sensor | HQJYF | 1 | 0–2000 W/m2 | 1 W/m2 | Spectral Range: 0.3–3 μm Response Time: <5 s Temperature Dependence: <±0.08%/°C |
| Air Temperature Sensor | HQWD | 1 | −50 to +100 °C | 0.1 °C | Accuracy: ±0.5 °C |
| Air Humidity Sensor | HQSD | 1 | 0–100% RH | 0.1%RH | Accuracy: ±5% RH |
| Wind Speed Sensor | HQFS | 1 | 0–70 m/s (starting threshold ≤ 0.5 m/s) | 0.1 m/s | Accuracy: ±(0.3 + 0.03 V) m/s |
| Wind Direction Sensor | HQFX | 1 | 0–360° (starting threshold ≤ 0.5 m/s) | 1° | Accuracy: ±3° |
References
- Hua, J.; Zhang, X.; Ren, C.; Shi, Y.; Lee, T.-C. Spatiotemporal Assessment of Extreme Heat Risk for High-Density Cities: A Case Study of Hong Kong from 2006 to 2016. Sustain. Cities Soc. 2021, 64, 102507. [Google Scholar] [CrossRef]
- Xi, Z.; Li, C.; Zhou, L.; Yang, H.; Burghardt, R. Built Environment Influences on Urban Climate Resilience: Evidence from Extreme Heat Events in Macau. Sci. Total Environ. 2023, 859, 160270. [Google Scholar] [CrossRef] [PubMed]
- Liu, J.; Wu, X.; Pan, L.; Hsieh, C.-M. Multi-Scale Analysis of the Mitigation Effect of Green Space Morphology on Urban Heat Islands. Atmosphere 2025, 16, 857. [Google Scholar] [CrossRef]
- Li, D.; Wu, S.; Liang, Z.; Li, S. The Impacts of Urbanization and Climate Change on Urban Vegetation Dynamics in China. Urban For. Urban Green. 2020, 54, 126764. [Google Scholar] [CrossRef]
- Chen, X.; Zhao, P.; Hu, Y.; Ouyang, L.; Zhu, L.; Ni, G. Canopy Transpiration and Its Cooling Effect of Three Urban Tree Species in a Subtropical City- Guangzhou, China. Urban For. Urban Green. 2019, 43, 126368. [Google Scholar] [CrossRef]
- Li, Z.; Zhang, H.; Juan, Y.-H.; Lee, Y.-T.; Wen, C.-Y.; Yang, A.-S. Effects of Urban Tree Planting on Thermal Comfort and Air Quality in the Street Canyon in a Subtropical Climate. Sustain. Cities Soc. 2023, 91, 104334. [Google Scholar] [CrossRef]
- Wei, Y.-Y.; Cheng, C.-Y.; Lin, T.-P. The Influence of Trees Shade Level on Human Thermal Comfort and the Development of Applied Assessment Tools. Landsc. Urban Plan. 2025, 263, 105436. [Google Scholar] [CrossRef]
- Yang, Y.; Xu, Y.; Duan, Y.; Zhang, S.; Zhang, Y.; Xie, Y. How Can Trees Protect Us from Air Pollution and Urban Heat? Associations and Pathways at the Neighborhood Scale. Landsc. Urban Plan. 2023, 236, 104779. [Google Scholar] [CrossRef]
- Rajagopalan, P.; Lim, K.C.; Jamei, E. Urban Heat Island and Wind Flow Characteristics of a Tropical City. Sol. Energy 2014, 107, 159–170. [Google Scholar] [CrossRef]
- Wang, W.; Yao, X.; Shu, J. Air Advection Induced Differences between Canopy and Surface Heat Islands. Sci. Total Environ. 2020, 725, 138120. [Google Scholar] [CrossRef]
- Han, J.-Y.; Baik, J.-J. A Theoretical and Numerical Study of Urban Heat Island–Induced Circulation and Convection. J. Atmospheric Sci. 2008, 65, 1859–1877. [Google Scholar] [CrossRef]
- Santamouris, M. Using Cool Pavements as a Mitigation Strategy to Fight Urban Heat Island—A Review of the Actual Developments. Renew. Sustain. Energy Rev. 2013, 26, 224–240. [Google Scholar] [CrossRef]
- Pillai, S.S.; Yoshie, R. Flow Velocity and Surface Temperature Effects on Convective Heat Transfer Coefficient from Urban Canopy Surfaces by Numerical Simulation. J. Urban Environ. Eng. 2013, 7, 74–81. [Google Scholar] [CrossRef]
- Ryu, Y.-H.; Baik, J.-J.; Lee, S.-H. A New Single-Layer Urban Canopy Model for Use in Mesoscale Atmospheric Models. J. Appl. Meteorol. Clim. 2011, 50, 1773–1794. [Google Scholar] [CrossRef]
- Oke, T.R.; Mills, G.; Christen, A.; Voogt, J.A. Urban Climates; Cambridge University Press: Cambridge, UK, 2017; ISBN 978-0-521-84950-0. [Google Scholar]
- Sun, T.; Grimmond, C.S.B.; Ni, G.-H. How Do Green Roofs Mitigate Urban Thermal Stress under Heat Waves? J. Geophys. Res. Atmos. 2016, 121, 5320–5335. [Google Scholar] [CrossRef]
- Schindler, D.; Bauhus, J.; Mayer, H. Wind Effects on Trees. Eur. J. For. Res. 2012, 131, 159–163. [Google Scholar] [CrossRef]
- Fan, L.; Zhao, M.; Huo, J.; Sha, Y.; Zhou, Y. The Impact of Vegetation Layouts on Thermal Comfort in Urban Main Streets: A Case Study of Youth Street in Shenyang. Sustainability 2025, 17, 1755. [Google Scholar] [CrossRef]
- Hsieh, C.-M.; Jan, F.-C.; Zhang, L. A Simplified Assessment of How Tree Allocation, Wind Environment, and Shading Affect Human Comfort. Urban For. Urban Green. 2016, 18, 126–137. [Google Scholar] [CrossRef]
- Hsieh, C.-M.; Huang, H.-C. Mitigating Urban Heat Islands: A Method to Identify Potential Wind Corridor for Cooling and Ventilation. Comput. Environ. Urban Syst. 2016, 57, 130–143. [Google Scholar] [CrossRef]
- Ricci, A.; Burlando, M.; Repetto, M.P.; Blocken, B. Static Downscaling of Mesoscale Wind Conditions into an Urban Canopy Layer by a CFD Microscale Model. Build. Environ. 2022, 225, 109626. [Google Scholar] [CrossRef]
- Wong, N.H.; He, Y.; Nguyen, N.S.; Raghavan, S.V.; Martin, M.; Hii, D.J.C.; Yu, Z.; Deng, J. An Integrated Multiscale Urban Microclimate Model for the Urban Thermal Environment. Urban Clim. 2021, 35, 100730. [Google Scholar] [CrossRef]
- Tabassum, A.; Hong, S.-H.; Park, K.; Baik, J.-J. Simulating Urban Heat Islands and Local Winds in the Dhaka Metropolitan Area, Bangladesh. Urban Clim. 2025, 59, 102284. [Google Scholar] [CrossRef]
- Ng, E.; Yuan, C.; Chen, L.; Ren, C.; Fung, J.C.H. Improving the Wind Environment in High-Density Cities by Understanding Urban Morphology and Surface Roughness: A Study in Hong Kong. Landsc. Urban Plan. 2011, 101, 59–74. [Google Scholar] [CrossRef]
- Li, J.; Zheng, B.; Ouyang, X.; Chen, X.; Bedra, K.B. Does Shrub Benefit the Thermal Comfort at Pedestrian Height in Singapore? Sustain. Cities Soc. 2021, 75, 103333. [Google Scholar] [CrossRef]
- Hong, B.; Lin, B. Numerical Studies of the Outdoor Wind Environment and Thermal Comfort at Pedestrian Level in Housing Blocks with Different Building Layout Patterns and Trees Arrangement. Renew. Energy 2015, 73, 18–27. [Google Scholar] [CrossRef]
- Liu, J.; Niu, J.; Xia, Q. Combining Measured Thermal Parameters and Simulated Wind Velocity to Predict Outdoor Thermal Comfort. Build. Environ. 2016, 105, 185–197. [Google Scholar] [CrossRef]
- Yuan, C.; Norford, L.; Ng, E. A Semi-Empirical Model for the Effect of Trees on the Urban Wind Environment. Landsc. Urban Plan. 2017, 168, 84–93. [Google Scholar] [CrossRef]
- Yang, S.; Wang, L.L.; Stathopoulos, T.; Marey, A.M. Urban Microclimate and Its Impact on Built Environment—A Review. Build. Environ. 2023, 238, 110334. [Google Scholar] [CrossRef]
- Hefny Salim, M.; Heinke Schlünzen, K.; Grawe, D. Including Trees in the Numerical Simulations of the Wind Flow in Urban Areas: Should We Care? J. Wind Eng. Ind. Aerodyn. 2015, 144, 84–95. [Google Scholar] [CrossRef]
- Ai, J.; Kim, M. Research on Plant Landscape Design of Urban Industrial Site Green Space Based on Green Infrastructure Concept. Plants 2025, 14, 747. [Google Scholar] [CrossRef]
- Zhu, J.; Luo, X.; Zhai, Y.; Zhang, G.; Zhou, C.; Chen, Z. Study on the Impact of Tree Species on the Wind Environment in Tree Arrays Based on Fluid–Structure Interaction: A Case Study of Hangzhou Urban Area. Buildings 2024, 14, 1409. [Google Scholar] [CrossRef]
- Amani-Beni, M.; Tabatabaei Malazi, M.; Dehghanian, K.; Dehghanifarsani, L. Investigating the Effects of Wind Loading on Three Dimensional Tree Models Using Numerical Simulation with Implications for Urban Design. Sci. Rep. 2023, 13, 7277. [Google Scholar] [CrossRef] [PubMed]
- Buccolieri, R.; Santiago, J.-L.; Rivas, E.; Sanchez, B. Review on Urban Tree Modelling in CFD Simulations: Aerodynamic, Deposition and Thermal Effects. Urban For. Urban Green. 2018, 31, 212–220. [Google Scholar] [CrossRef]
- Wang, X.; Liu, F.; Xu, Z. Analysis of Urban Public Spaces’ Wind Environment by Applying the CFD Simulation Method: A Case Study in Nanjing. Geogr. Pannonica 2019, 23, 308–317. [Google Scholar] [CrossRef]
- Swarno, H.A.; Ahmad, N.H.; Mohammad, A.F.; Othman, N.E. Numerical Simulation of the Tree Effects on Wind Comfort and Wind Safety Around Coastline Building Resort. J. Adv. Res. Fluid Mech. Therm. Sci. 2024, 117, 1–42. [Google Scholar] [CrossRef]
- Pan, L.; Hsieh, C.-M.; Yu, C.-Y.; Xian, T.; Wu, X. Do Parks Act as Cool Islands? A Cross-Scale Evaluation of Their Daytime Cooling Dynamics through Land Surface Temperature and Thermal Comfort in Macau. Sustain. Cities Soc. 2025, 130, 106617. [Google Scholar] [CrossRef]
- Wang, B.; Shen, S.; Weng, L., I; Kan, L.W.; Chan, I.T.; He, C.B.; He, J.Q.; Wong, U.H.; Lao, E.P.L.; Smith, R.D. Associations of Ambient Temperature and Relative Humidity with Hospital Admissions in Macau, China Using Time Series Analysis. Sci. Rep. 2025, 15, 25968. [Google Scholar] [CrossRef]
- Hsieh, C.-M.; Aramaki, T.; Hanaki, K. The Feedback of Heat Rejection to Air Conditioning Load during the Nighttime in Subtropical Climate. Energy Build. 2007, 39, 1175–1182. [Google Scholar] [CrossRef]
- Hsieh, C.-M.; Aramaki, T.; Hanaki, K. Managing Heat Rejected from Air Conditioning Systems to Save Energy and Improve the Microclimates of Residential Buildings. Comput. Environ. Urban Syst. 2011, 35, 358–367. [Google Scholar] [CrossRef]
- American Society of Mechanical Engineers. Standard for Verification and Validation in Computational Fluid Dynamics and Heat Transfer: An American National Standard; American Society of Mechanical Engineers: New York, NY, USA, 2009. [Google Scholar]
- Wang, T.; Qu, J.; Niu, Q.; An, Z.; Gao, Y.; Wang, H.; Niu, B. Aerodynamic Properties and Shelter Effects of a Concrete Plate-Insert Sand Fence Along the Lanzhou-Xinjiang High-Speed Railway in Gobi Regions Under Strong Winds. Front. Environ. Sci. 2022, 10, 861063. [Google Scholar] [CrossRef]
- Mayaud, J.R.; Wiggs, G.F.S.; Bailey, R.M. Characterizing Turbulent Wind Flow around Dryland Vegetation. Earth Surf. Process. Landf. 2016, 41, 1421–1436. [Google Scholar] [CrossRef]
- Khodayari, N.; Hami, A.; Farrokhi, N. The Effect of Trees with Irregular Canopy on Windbreak Function in Urban Areas. Int. J. Archit. Eng. Urban Plan. 2021, 31, 1–12. [Google Scholar]
- Loehle, C. Biomechanical Constraints on Tree Architecture. Trees 2016, 30, 2061–2070. [Google Scholar] [CrossRef]
- Kang, G.; Kim, J.-J.; Choi, W. Computational Fluid Dynamics Simulation of Tree Effects on Pedestrian Wind Comfort in an Urban Area. Sustain. Cities Soc. 2020, 56, 102086. [Google Scholar] [CrossRef]
- Li, W.; Wang, F.; Bell, S. Simulating the Sheltering Effects of Windbreaks in Urban Outdoor Open Space. J. Wind Eng. Ind. Aerodyn. 2007, 95, 533–549. [Google Scholar] [CrossRef]
- Blocken, B.; van Hooff, T.; Aanen, L.; Bronsema, B. Computational Analysis of the Performance of a Venturi-Shaped Roof for Natural Ventilation: Venturi-Effect versus Wind-Blocking Effect. Comput. Fluids 2011, 48, 202–213. [Google Scholar] [CrossRef]
- Ren, X.; Zhang, G.; Chen, Z.; Zhu, J. The Influence of Wind-Induced Response in Urban Trees on the Surrounding Flow Field. Atmosphere 2023, 14, 1010. [Google Scholar] [CrossRef]
- Yoon, T.K.; Lee, S.; Lee, S.; Lee, S.; Hussain, M.; Lee, S.; Chung, H.; Chung, S. A Wind Tunnel Test for the Effect of Seed Tree Arrangement on Wake Wind Speed. Forests 2024, 15, 1772. [Google Scholar] [CrossRef]
- Zhang, L.; Zhan, Q.; Lan, Y. Effects of the Tree Distribution and Species on Outdoor Environment Conditions in a Hot Summer and Cold Winter Zone: A Case Study in Wuhan Residential Quarters. Build. Environ. 2018, 130, 27–39. [Google Scholar] [CrossRef]
- Liu, C.; Zheng, Z.; Cheng, H.; Zou, X. Airflow around Single and Multiple Plants. Agric. For. Meteorol. 2018, 252, 27–38. [Google Scholar] [CrossRef]
- Peterson, C.J.; Cannon, J.B. Modelling Wind Damage to Southeastern Us Trees: Effects of Wind Profile, Gaps, Neighborhood Interactions, and Wind Direction. Front. For. Glob. Chang. 2021, 4, 719813. [Google Scholar] [CrossRef]
- Mirzaei, P.A.; Haghighat, F. A Novel Approach to Enhance Outdoor Air Quality: Pedestrian Ventilation System. Build. Environ. 2010, 45, 1582–1593. [Google Scholar] [CrossRef]
- Tan, Z.; Lau, K.K.-L.; Ng, E. Planning Strategies for Roadside Tree Planting and Outdoor Comfort Enhancement in Subtropical High-Density Urban Areas. Build. Environ. 2017, 120, 93–109. [Google Scholar] [CrossRef]
- Ren, F.; Qiu, Z.; Liu, Z.; Bai, H.; Gao, H.O. Trees Help Reduce Street-Side Air Pollution: A Focus on Cyclist and Pedestrian Exposure Risk. Build. Environ. 2023, 229, 109923. [Google Scholar] [CrossRef]
- Hong, B.; Lin, B.; Qin, H. Numerical Investigation on the Effect of Avenue Trees on PM2.5 Dispersion in Urban Street Canyons. Atmosphere 2017, 8, 129. [Google Scholar] [CrossRef]
- Huang, N.; Sun, J.; Zhao, Y.; Zhang, J.; Pei, B. Modeling Plant Canopy through Numerical Simulation of Cylindrical Array. Comput. Fluids 2025, 289, 106551. [Google Scholar] [CrossRef]
- Wang, L.; Su, J.; Gu, Z.; Tang, L. Numerical Study on Flow Field and Pollutant Dispersion in an Ideal Street Canyon within a Real Tree Model at Different Wind Velocities. Comput. Math. Appl. 2021, 81, 679–692. [Google Scholar] [CrossRef]
- Marchi, L.; Gaspari, J.; Fabbri, K. Outdoor Microclimate in Courtyard Buildings: Impact of Building Perimeter Configuration and Tree Density. Buildings 2023, 13, 2687. [Google Scholar] [CrossRef]
- Ren, Z.; Nikolopoulou, M.; Mills, G.; Pilla, F. Evaluating the Influence of Urban Trees and Microclimate on Residential Energy Consumption in Dublin Neighbourhoods. Build. Environ. 2025, 269, 112441. [Google Scholar] [CrossRef]
- Nazarian, N.; Krayenhoff, E.S.; Bechtel, B.; Hondula, D.M.; Paolini, R.; Vanos, J.; Cheung, T.; Chow, W.T.L.; De Dear, R.; Jay, O.; et al. Integrated Assessment of Urban Overheating Impacts on Human Life. Earths Future 2022, 10, e2022EF002682. [Google Scholar] [CrossRef]
- Ma, W.; Yu, Z.; Yang, W.; Zhang, Y.; Hu, Y.; Hu, J.; Zhang, H.; Yang, G. Optimizing Vegetation and Building Configurations for Streetscape Heat Mitigation: A Multi-Scale Analysis under Extreme Heat. Build. Environ. 2025, 283, 113331. [Google Scholar] [CrossRef]
- Loughner, C.P.; Allen, D.J.; Zhang, D.-L.; Pickering, K.E.; Dickerson, R.R.; Landry, L. Roles of Urban Tree Canopy and Buildings in Urban Heat Island Effects: Parameterization and Preliminary Results. J. Appl. Meteorol. Climatol. 2012, 51, 1775–1793. [Google Scholar] [CrossRef]
- Tan, Z.; Lau, K.K.-L.; Ng, E. Urban Tree Design Approaches for Mitigating Daytime Urban Heat Island Effects in a High-Density Urban Environment. Energy Build. 2016, 114, 265–274. [Google Scholar] [CrossRef]
- Park, M.; Hagishima, A.; Tanimoto, J.; Narita, K. Effect of Urban Vegetation on Outdoor Thermal Environment: Field Measurement at a Scale Model Site. Build. Environ. 2012, 56, 38–46. [Google Scholar] [CrossRef]
- Ooka, R.; Chen, H.; Kato, S. Study on Optimum Arrangement of Trees for Design of Pleasant Outdoor Environment Using Multi-Objective Genetic Algorithm and Coupled Simulation of Convection, Radiation and Conduction. J. Wind Eng. Ind. Aerodyn. 2008, 96, 1733–1748. [Google Scholar] [CrossRef]


Disclaimer/Publisher’s Note: The statements, opinions and data contained in all publications are solely those of the individual author(s) and contributor(s) and not of MDPI and/or the editor(s). MDPI and/or the editor(s) disclaim responsibility for any injury to people or property resulting from any ideas, methods, instructions or products referred to in the content. |
© 2025 by the authors. Licensee MDPI, Basel, Switzerland. This article is an open access article distributed under the terms and conditions of the Creative Commons Attribution (CC BY) license (https://creativecommons.org/licenses/by/4.0/).