Article

Comparison of the Stem Basal Area Increment of Five Coexisting Tree Species with Different Light Demands Growing in Central European Deciduous Forests with Complex Vertical Structures

1
Faculty of Forestry, University of Agriculture in Kraków, Al. 29 Listopada 46, 31-425 Kraków, Poland
2
Regional Directorate of the State Forests, Al. Juliusza Słowackiego 17a, 31-159 Kraków, Poland
*
Author to whom correspondence should be addressed.
Forests 2025, 16(11), 1700; https://doi.org/10.3390/f16111700
Submission received: 11 October 2025 / Revised: 3 November 2025 / Accepted: 5 November 2025 / Published: 7 November 2025
(This article belongs to the Special Issue Forest Growth and Regeneration Dynamics)

Abstract

The diversity of forest tree life strategies is fundamental to species coexistence in mixed stands. Growth rate is one of the most important elements of a species’ life strategy. This aspect has been relatively well recognised in even-aged stands. However, the situation is different in uneven-aged stands, particularly in multi-species stands comprising species with different light demands. In this study, we aimed to compare stem basal area increment (BAI) in regard to five species forming multi-species, uneven-aged deciduous forests in Central Europe as an important element of their growth strategy. Particular attention was paid to the relationship between this feature and tree height and competitive status. These relationships were analysed using a linear mixed model. The BAI was positively correlated with tree height, while a negative correlation was observed between BAI and increasing competitive level. However, the observed variations in the trends of these relationships were not associated with the light demands of the compared species. In general, the majority of the studied species demonstrated similar growth dynamics. This may suggest that the role of this trait in shaping species coexistence is modulated by other life-history strategy components and by specific growth conditions. An exception to this is the most light-demanding species, black alder (Alnus glutinosa (L.) Gaertner), which, contrary to expectations, exhibits a lower basal area increment under uneven-aged conditions.

1. Introduction

Growth rate is one of the most important components of the life strategies of forest trees [1]. During individual development, it undergoes significant changes, which are commonly illustrated by the so-called growth curve [2,3]. In the juvenile phase, growth is relatively slow, but it soon accelerates significantly and finally gradually slows down in the senile phase. One of the characteristic features of the growth curve is the occurrence of an inflection point, which corresponds to the moment of current annual growth culmination [2,3,4].
The growth pattern exhibits species-specific characteristics, which are best recognised in the case of height growth. At one extreme are short-lived early-successional species, in which growth in youth is rapidly accelerated, leading to not only early current annual growth culmination but also to a relatively rapid exhaustion of growth potential, accompanied by an intensification of reproductive effort. At the opposite end of the spectrum are long-lived late-successional species characterised by slower growth in their youth and later growth culmination, followed by a gradual and prolonged decline in growth, associated with a more even allocation of resources [2,5]. In the case of many tree species, especially those associated with intermediate stages of succession, the growth pattern may exhibit intermediate characteristics.
From the perspective of life strategy, growth and height increments can be considered an investment aimed at providing the tree with greater access to light and achieving a more favourable competitive position [6,7]. On the other hand, an increase in stem volume and basal area shows a direct correlation with the intensity of the assimilation process [3]. However, the growth pattern of this trait is different from that of height. This is particularly evident in the significant shift in the timing of the individual growth phases and the culmination of annual growth [4,8,9,10].
The structure of the surrounding tree stand has a significant impact on tree growth conditions [11,12,13,14]. This is particularly evident in the modified light conditions and access to growing space resulting from vertical stratification of the forest canopy [11,15]. This often leads to an intensified effect of the temporal shift in the culmination of current annual growth, which makes it difficult to identify [8,16]. This phenomenon particularly affects shade-tolerant late-successional species with the ability to respond positively to improved light conditions after a long period of suppression [17,18,19,20,21,22].
In uneven-aged stands, the growth potential of trees is more closely related to their size than to their age [23,24,25,26,27,28,29,30,31,32,33,34,35]. Furthermore, as in any forest community, this potential may be reduced due to competitive interactions with other individuals. In many cases, the intensity of these interactions is characterised by relatively simple measures related to the density and basal area of the surrounding tree stand [12,14,23,28,32,35,36,37,38]. A more advanced approach utilises the characteristics of the closest neighbourhood, taking into account the spatial relationships between trees [26,29,39,40,41,42]. In this regard, it is not only the number and size of identified competitors that are important, but also their species affiliation. This is because specific tree species contribute differently to local stand density and generate different levels of competitive pressure in relation to their closest surroundings [43,44].
Compared to even-aged stands, the dynamics of the growth and increment of trees in uneven-aged stands are generally less well understood. In Central and Western Europe, stands managed under selection systems, consisting of late-successional coniferous species, mainly silver fir (Abies alba Mill.), are an exception in this regard [16,45,46]. As for deciduous species, more extensive studies on tree growth in similar types of stands have so far been devoted only to beech (Fagus sylvatica L.) [47,48,49]. However, data on a wider range of species forming uneven-aged, multi-species deciduous forests originate mainly from North America [20,36,40,50,51,52,53], while in European conditions, the state of knowledge on these issues remains fragmentary [54,55,56]. This problem is particularly pronounced in forest stands where species with different light requirements coexist in various vertical stratification and spatial arrangements [57]. The growth strategy of light-demanding species in a multi-layered deciduous forest environment is particularly far from being fully understood. Filling this information gap is important not only for a comprehensive understanding of the life strategies and coexistence mechanisms of species forming forest communities of this type, but also for understanding the potential productivity and improving methods for optimising the growing stock and structure of deciduous stands shaped within the concept of close-to-nature forest management.
The goal of this study is to compare the stem basal area increment of five tree species (Figure 1), namely, shade-tolerant European hornbeam (Carpinus betulus L.) and small-leaved lime (Tilia cordata Mill.), mid-tolerant elms (Ulmus laevis Pall. and Ulmus minor Mill. were treated together), relatively light-demanding pedunculate oak (Quercus robur L.), and typical light-demanding black alder (Alnus glutinosa (L.) Gaertner) [58,59] that form multi-layered deciduous stands under the conditions of the Central European lowlands.
Assuming that most trees in the examined stands have not yet reached the culmination of annual basal area increment, it may be expected that, at this stage of growth, light-demanding species will exhibit a higher growth potential than shade-tolerant species. At the same time, according to the general assumptions of succession theory [5], an increase in the light requirements of a species should be accompanied by greater sensitivity to competitive interactions. These premises form the basis for the following research hypotheses (Figure 1):
H1: 
Stem basal area increment increases with improvement in the tree’s position in the vertical stand profile (as reflected by its height), and the strength of this relationship increases with the species’ light requirements.
H2: 
Stem basal area increment decreases with increasing competitive pressure experienced by a given tree, and the strength of this relationship increases with the species’ light requirements.

2. Materials and Methods

2.1. Study Area, Sample Plots, and Field Measurements

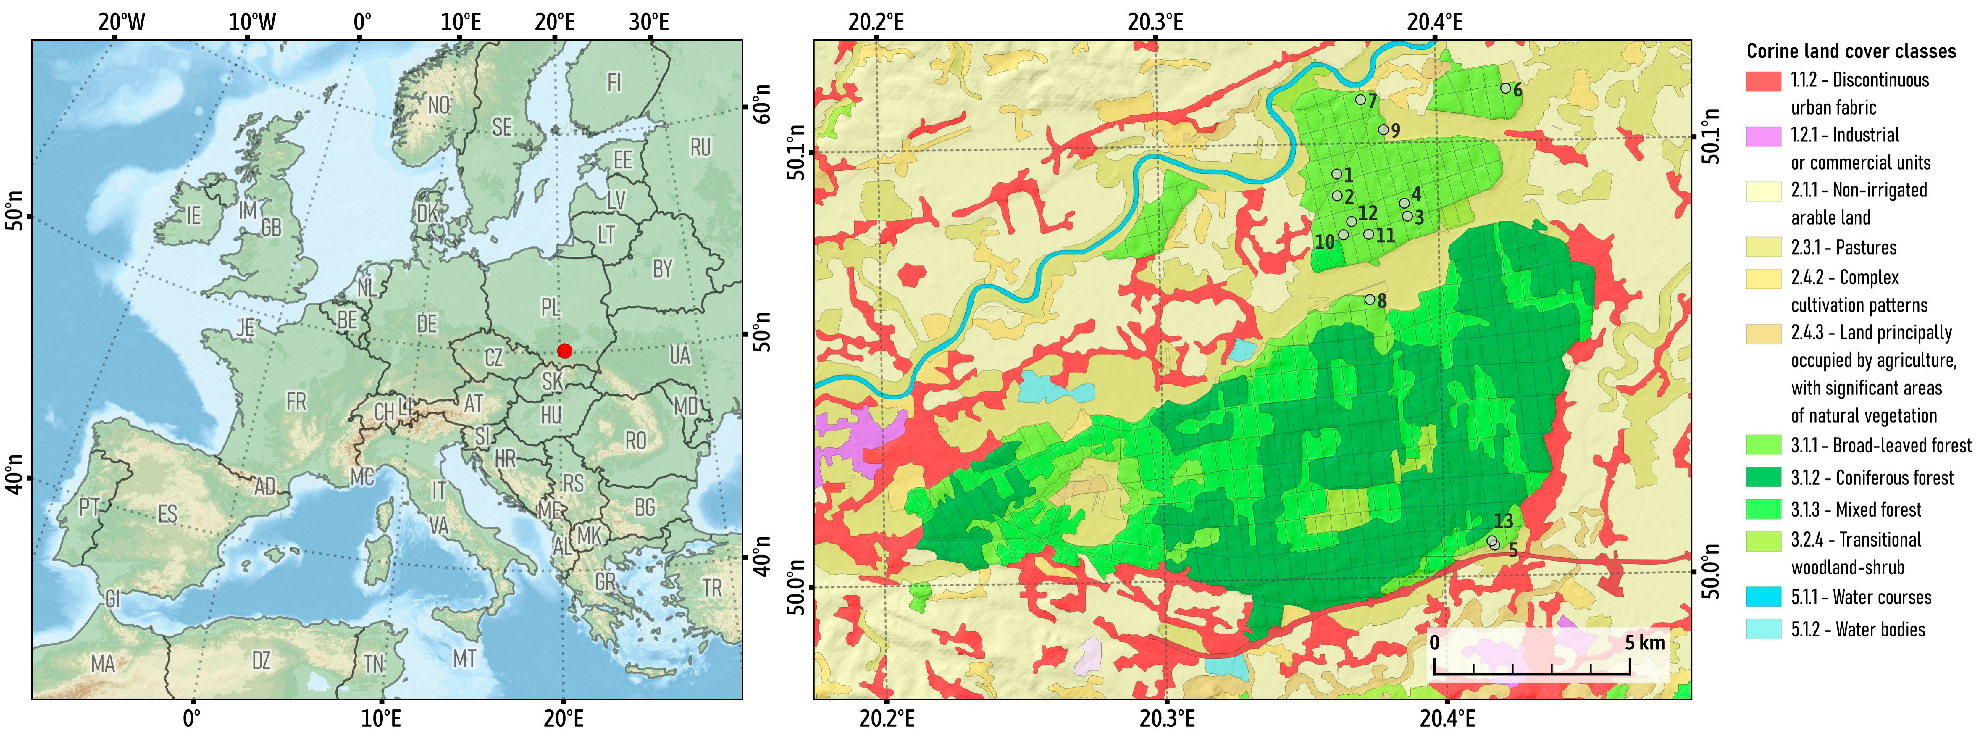
The study area, located in Niepołomice Forest (southern Poland) and confined by the geographic coordinates 50.007° N and 50.112° N and 20.364° E and 20.425° E (Figure 2), is a flat lowland area (about 185 m a.s.l.) situated in the western part of the Sandomierz Basin, which is a tectonic depression between the Carpathian Mountains and a belt of loess uplands. The studied deciduous forests cover the Holocene floodplain of the Vistula River and its right-sided Carpathian tributary, the Raba River.The alluvial deposits underlying this area are characterised by far-reaching heterogeneity, evident both in their vertical profile and in their mosaic spatial arrangement [60]. As a consequence, the forest vegetation forms a fine-scale mosaic of patches that represent different degrees of affinity to riparian forests (alliance Alno-Padion) and to oak–hornbeam forests (alliance Carpinion betuli) communities [61].
The climatic conditions are typical for the temperate zone with an increased influence of continental characteristics. The average annual temperature is 8 °C, with annual precipitation of 650 mm. The growing period with daily temperatures above 5 °C is about 230 days [66].
One remarkable feature of the studied stands is the occurrence of several species with varied light demands in different stand layers, as well as the vertical differentiation of stand structure at small spatial scales [57]. These mixed-species forests represent ‘relict’ remnants of stands of natural origin surrounded by artificially restored stands. They variously consist of the following species: pedunculate oak, black alder, European hornbeam, small-leaved lime, European ash (Fraxinus excelsior L.), European white elm, Scots pine (Pinus sylvestris L.) (the only conifer species), and field elm (species are ranked by their descending proportion in the bulk volume of the stands).
In 2002, 13 square sample plots were established, each covering an area of 0.64 ha (Table 1). Field measurements included stem coordinates, tree heights (H), diameters at a height of 1.3 m (DBH), and crown radii determined in the four cardinal compass directions (N, E, S, W) for all live trees of DBH ≥ 7.0 cm. The values of H and crown radii were determined to the nearest 0.1 m.
In 2017, for the trees that survived the control period, the DBH was re-measured to determine the stem basal area increment (BAI). Identification of individual trees was carried out on the basis of predetermined coordinates. The measurement was carried out to an accuracy of 0.5 cm. The calliper was placed at the permanently marked measurement points in two perpendicular directions (N–S and E–W). Measurement activities did not include individuals that had reached the DBH threshold of 7 cm during the control period.
In general, the exclusion of trees with a diameter below 7 cm from the analyses should not have a substantial effect on the obtained results. This is because stem BAI values depend not only on annual ring width, but also on the circumference of the stem on which the ring is formed. Consequently, in very thin trees, BAI values are inherently low, regardless of species identity, and therefore cannot meaningfully contribute to interspecific differentiation.
Stand characteristics on the study plots at the beginning of the control period are given in Table 1. Exact data include species compositions, stem numbers, basal areas, and stand volumes. The DBH distributions represent multi-modal, negative exponential or rotated sigmoid types [57].

2.2. Data Analysis

An analysis of the stem BAI was carried out for the five main broadleaf tree species forming the study stands. According to increasing shade tolerance, these species can be ordered as follows: alder, oak, elms (European white elm and field elm were treated together), lime, and hornbeam [58,59]. However, when increasing longevity is taken into account, the ranking changes: alder, hornbeam, elm, lime, and oak [59]. Trees belonging to the other species were only included in the analyses as competitors. This included ash, which commonly showed disease symptoms related to the dieback problem of this species (which may have been the main factor determining the growth rate). The increment in stem basal area was defined as the difference between the stem basal area at the end (2017) and the beginning (2002) of the control period.
The surroundings of trees (under conditions prevailing at the beginning of the control period) were characterised by a competition index based on a formulation by Hegyi [67] modified by the authors:
C I i = D B H j r L A I j / D B H i d i s t i j + 1
where the summation is over all neighbours of the i object tree, rLAI is the relative species-specific leaf area index and distij is the horizontal distance between the i object tree and its j neighbour. All trees located within the zone of potential crown overlap were regarded as neighbours (competitors) of the object tree i. This zone was defined as the sum of potential crown radii dependent on tree DBHs:
b 0 ln D B H i b 1 + b 0 ln D B H j b 1
with the parameters b0 = 2.570 and b1 = 1.969. The parameters were derived from the empirical dataset by fitting the function:
y = b 0 ln x b 1
to the 95th quantiles of the crown radii determined in 5 cm-wide DBH classes [68]. Because light is a primary driver of competitive interactions in forest communities and light absorption is closely linked with leaf area index (LAI) [69], we used the relative species-specific LAI as a weighting factor to account for the different competitive power of tree species. The incorporation of a weighting factor, closely related to species-specific foliage density, mimicked asymmetric above-ground competition between species with different light demands and hence increased the sensitivity of the competition index to variation in local species composition both in horizontal and vertical mixtures. Based on the literature [70,71,72,73], we assumed the following LAI values: alder 2.5, oak 3.0, elms 4.0, lime 5.0 and hornbeam 5.5. Given that hornbeam has the highest LAI among the five taxa considered, the relative values were as follows: alder 0.45, oak 0.55, elms 0.73, lime 0.91, and hornbeam 1.00. For other species, we used the relative values calculated on the basis of LAI values taken from the literature or assigned to species of similar light demand: Scots pine 0.27 [74,75], European ash and wild cherry (Prunus avium L.) 0.55, sycamore (Acer pseudoplatanus L.) and Norway maple (Acer platanoides L.) 0.73, and bird cherry (Prunus padus L.) 0.91. The use of species-specific LAI values derived from the literature is undoubtedly a simplification and does not fully reflect the spatial and temporal variability of competitive interactions in the canopy, which arises from inter-individual differences in crown architecture. However, in comparison with the basic version of Hegyi’s index, this approach can be considered a substantial improvement. To minimise border effects, only trees located more than 10 m from the nearest plot boundary were treated as object trees. In addition, a toroidal shift method was applied to account for competitive effects exerted by trees growing outside the boundaries of the study plots [76].
In total, the analysis included 1240 object trees (227 alders, 220 oaks, 110 elms, 180 limes, and 503 hornbeams). The effect of tree height and local competition on stem basal area increment of the five species studied was tested using a regression approach. We used tree height and not DBH as a predictor variable because, in multi-species stands, this parameter directly describes the social status of trees. Moreover, the substantially lower variation in the maximum values of tree height (compared to maximum DBH) facilitates interspecific comparisons.
Since the distribution of the stem BAI was highly right-skewed and did not follow a normal distribution, we used a generalised linear mixed-model (GLMM) approach, dedicated to the gamma distribution family, with the log-link function [77,78]. The final model took the following general form:
log B A I i j = β 0 + β 1 H i j × S i j + β 2 C I i j × S i j + a j + ε i j
where log(BAIij) represents the natural logarithm of the yearly basal area increment of tree i from plot j, Hij denotes the height of tree i from plot j, CIij denotes the competition index for tree i from plot j, Sij is a categorical variable representing the species of tree, β0, β1 and β2 are the fixed-effect parameters, aj is a random intercept associated with plot j (to account for plot-level variation) and εij is the residual error associated with tree i on plot j. The inclusion of interaction terms Hij ×Sij and CIij ×Sij allows for species-specific effects of height and competition on basal area increment (the effect of tree height and competition index on growth was allowed to vary between species).
To evaluate species-specific effects of height and competition index (CI) on stem BAI we fitted a GLMM using the glmmTMB package [79] in R v.4.5.1 [80], supported by RStudio v.2025.05.01. The model assumed a Gamma distribution of residuals with a logarithmic link function and included fixed effects of H and CI, both modelled in interaction with species, as well as a random intercept for site to account for potential spatial clustering. The significance of the fixed effects was assessed based on Wald chi-square tests provided by glmmTMB, and nonsignificant interactions were removed through stepwise simplification. Random effect significance was evaluated by likelihood ratio tests (LRTs), comparing the final model to reduced models lacking the random term, following the approach recommended by [81]. Pairwise comparisons between species were conducted using estimated marginal means with Holm–Bonferroni correction for multiple testing, maintaining a family-wise error rate of 0.05. We checked the assumptions of the homoscedasticity of residuals, normality of random error distribution, and the absence of collinearity for the independent variables on the basis of the Variance Inflation Factor with a threshold of 5. Package lmerTest v.3.1-3 [82] provided a means of calculating the p-values, which was helpful for judging the statistical importance of the tested variables.

3. Results

3.1. BAI and Other Object Tree Characteristics

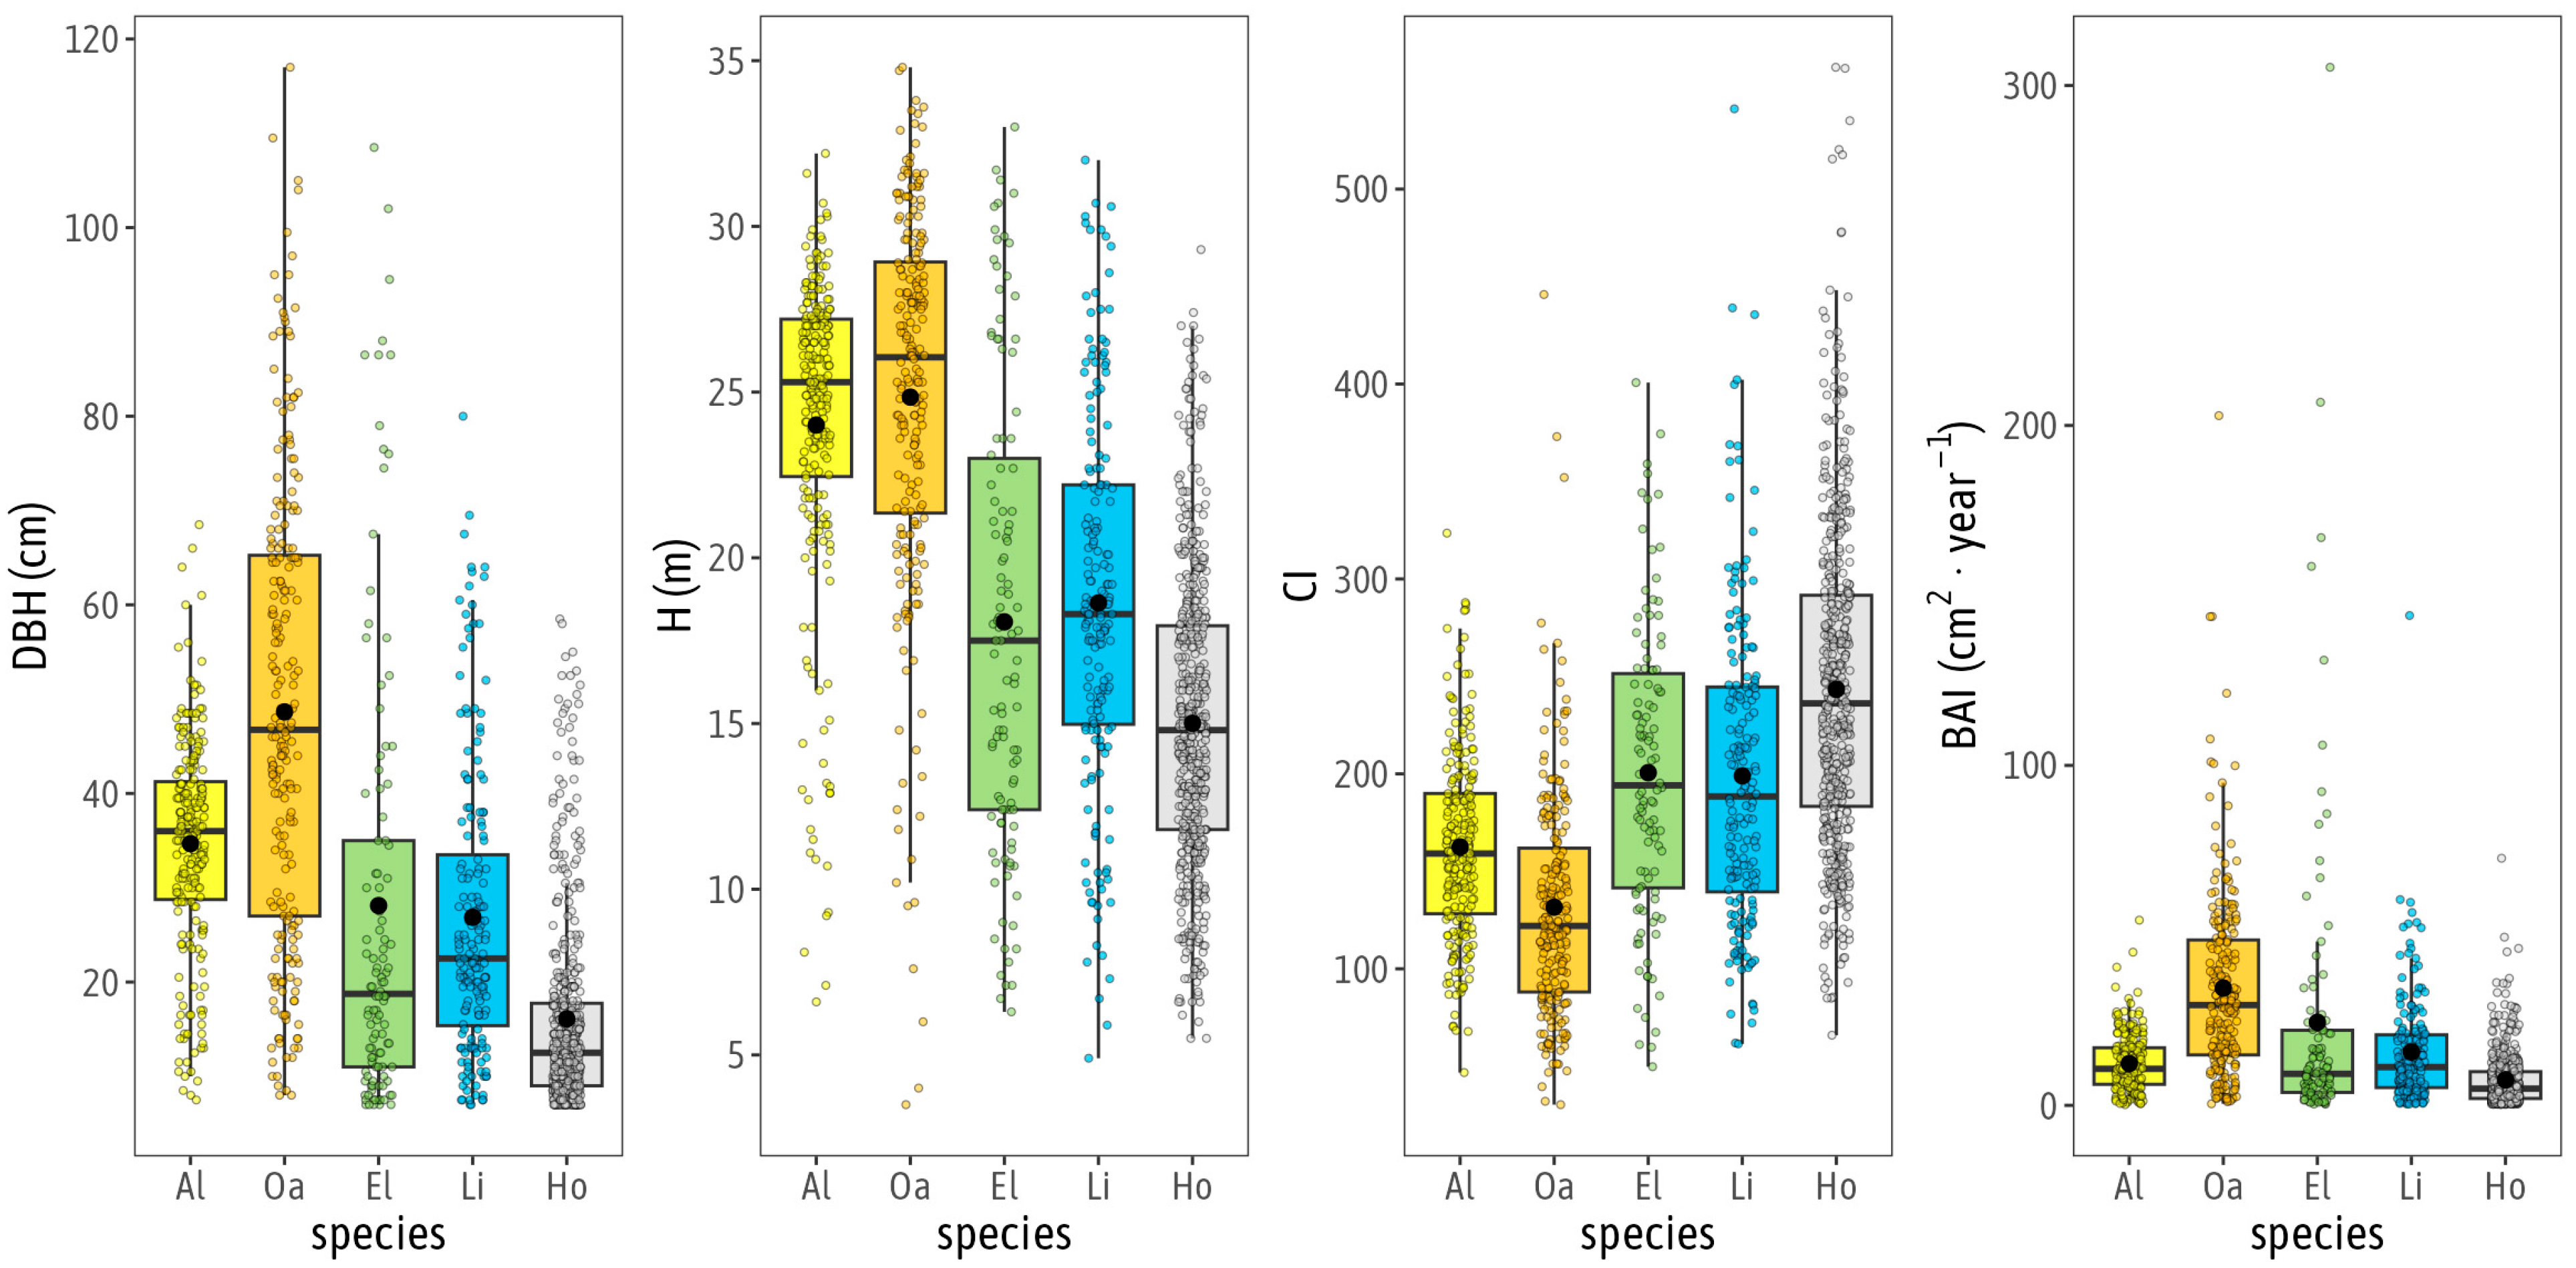
At the beginning of the control period, the largest DBH (117 cm) was reached by the most long-lived among the studied species—pedunculate oak. Relatively large DBHs were also found in elms (up to 108.5 cm) and small-leaved lime (up to 80 cm). On the other hand, smaller maximal DBH values were recorded for relatively short-lived species—black alder (68.5 cm) and hornbeam (58.5 cm) (Figure 3). The minimum DBH values resulted from the adopted measurement threshold. All studied species exhibited a wide range of DBH values, although the mean values were more closely associated with their light requirements. The lowest mean value was found for the most shade-tolerant hornbeam (16.1 cm). The average DBH of the lime was 26.9 cm, while that of the mid-tolerant elm was 28.1 cm. The more light-demanding species, alder (34.7 cm) and oak (48.7 cm), had significantly higher mean values (see also Figure 3).
The maximum heights reached by individual species did not vary as much as DBHs. Pedunculate oak reached up to 34.8 m, while elms reached up to 33 m, black alder reached up to 32.2 m, and small-leaved lime reached up to 32 m. Hornbeam stood slightly apart from the aforementioned species, reaching a maximum height of 29.3 m. The minimum heights in the measured specimens ranged over several metres—from 3.5 m for oak to 6.6 m for alder (Figure 3). All species occur throughout the vertical profile of the stand, although the average values indicate that shade-tolerant species—such as hornbeam (15 m) and lime (18.6 m), and mid-tolerant elm (18.1 m) occurred mainly in the lower and middle layers of the stand, while species with higher light requirements—oak (24.8 m) and alder (24 m)—usually formed the middle and upper layers (see also Figure 3).
Species with different light requirements grew in different competitive conditions. The 5th and 95th quantile values of the competition index are a good illustration of these differences. These were highest for the most shade-tolerant species, hornbeam (130–394), lower for lime (100–353) and mid-tolerant elm (80–343) and lowest for the light-demanding species—alder (90–250) and oak (59–232) (see also Figure 3).
The maximum growth potential of individual tree species under the conditions studied appears to be related to the maximum DBHs they achieve. The 95th percentile values of stem BAI in elm (106 cm2/year) and oak (85 cm2/year) were several times higher than in hornbeam (24 cm2/year) and alder (27 cm2/year), reaching an intermediate level for lime (47 cm2/year). In contrast, the lowest values of stem BAI were seen for trees with strongly stunted growth, for which no change in thickness was shown during the control period, with the accepted accuracy of measurement (Figure 3). These were typically individuals which were heavily suppressed, growing under the forest canopy, particularly numerous in the case of hornbeam.

3.2. Dependence of the BAI on Tree Height and Competition

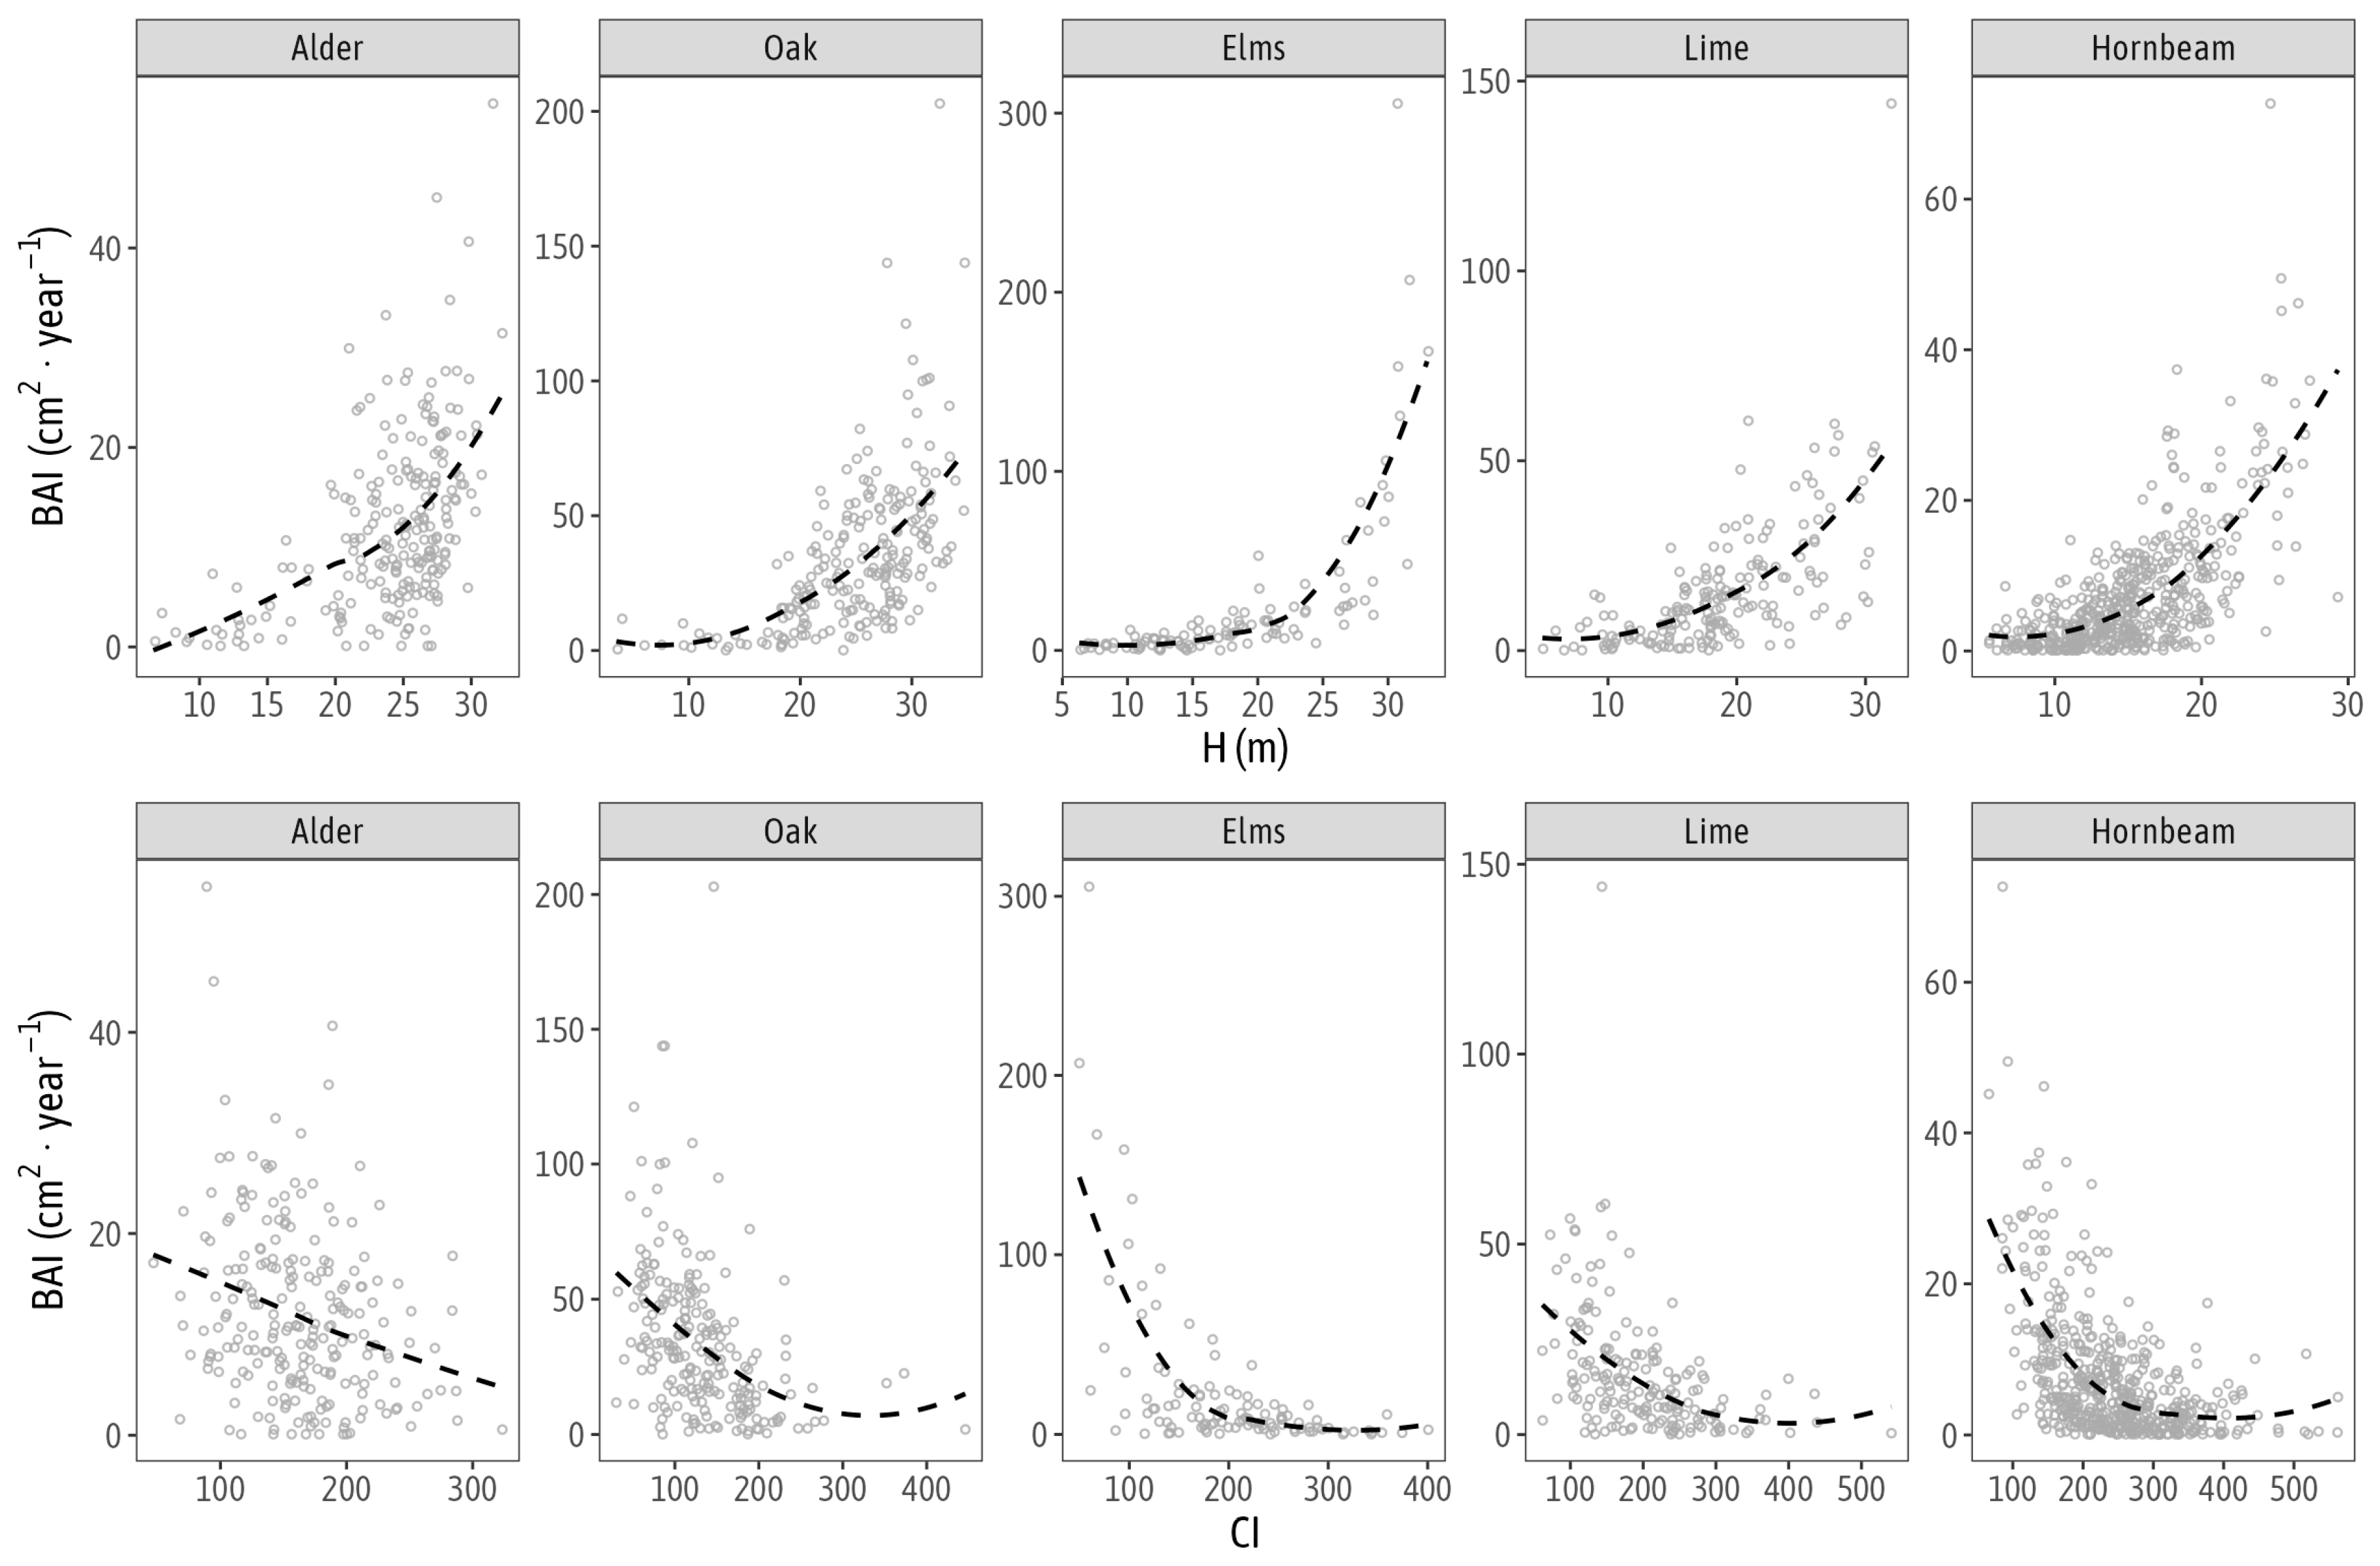
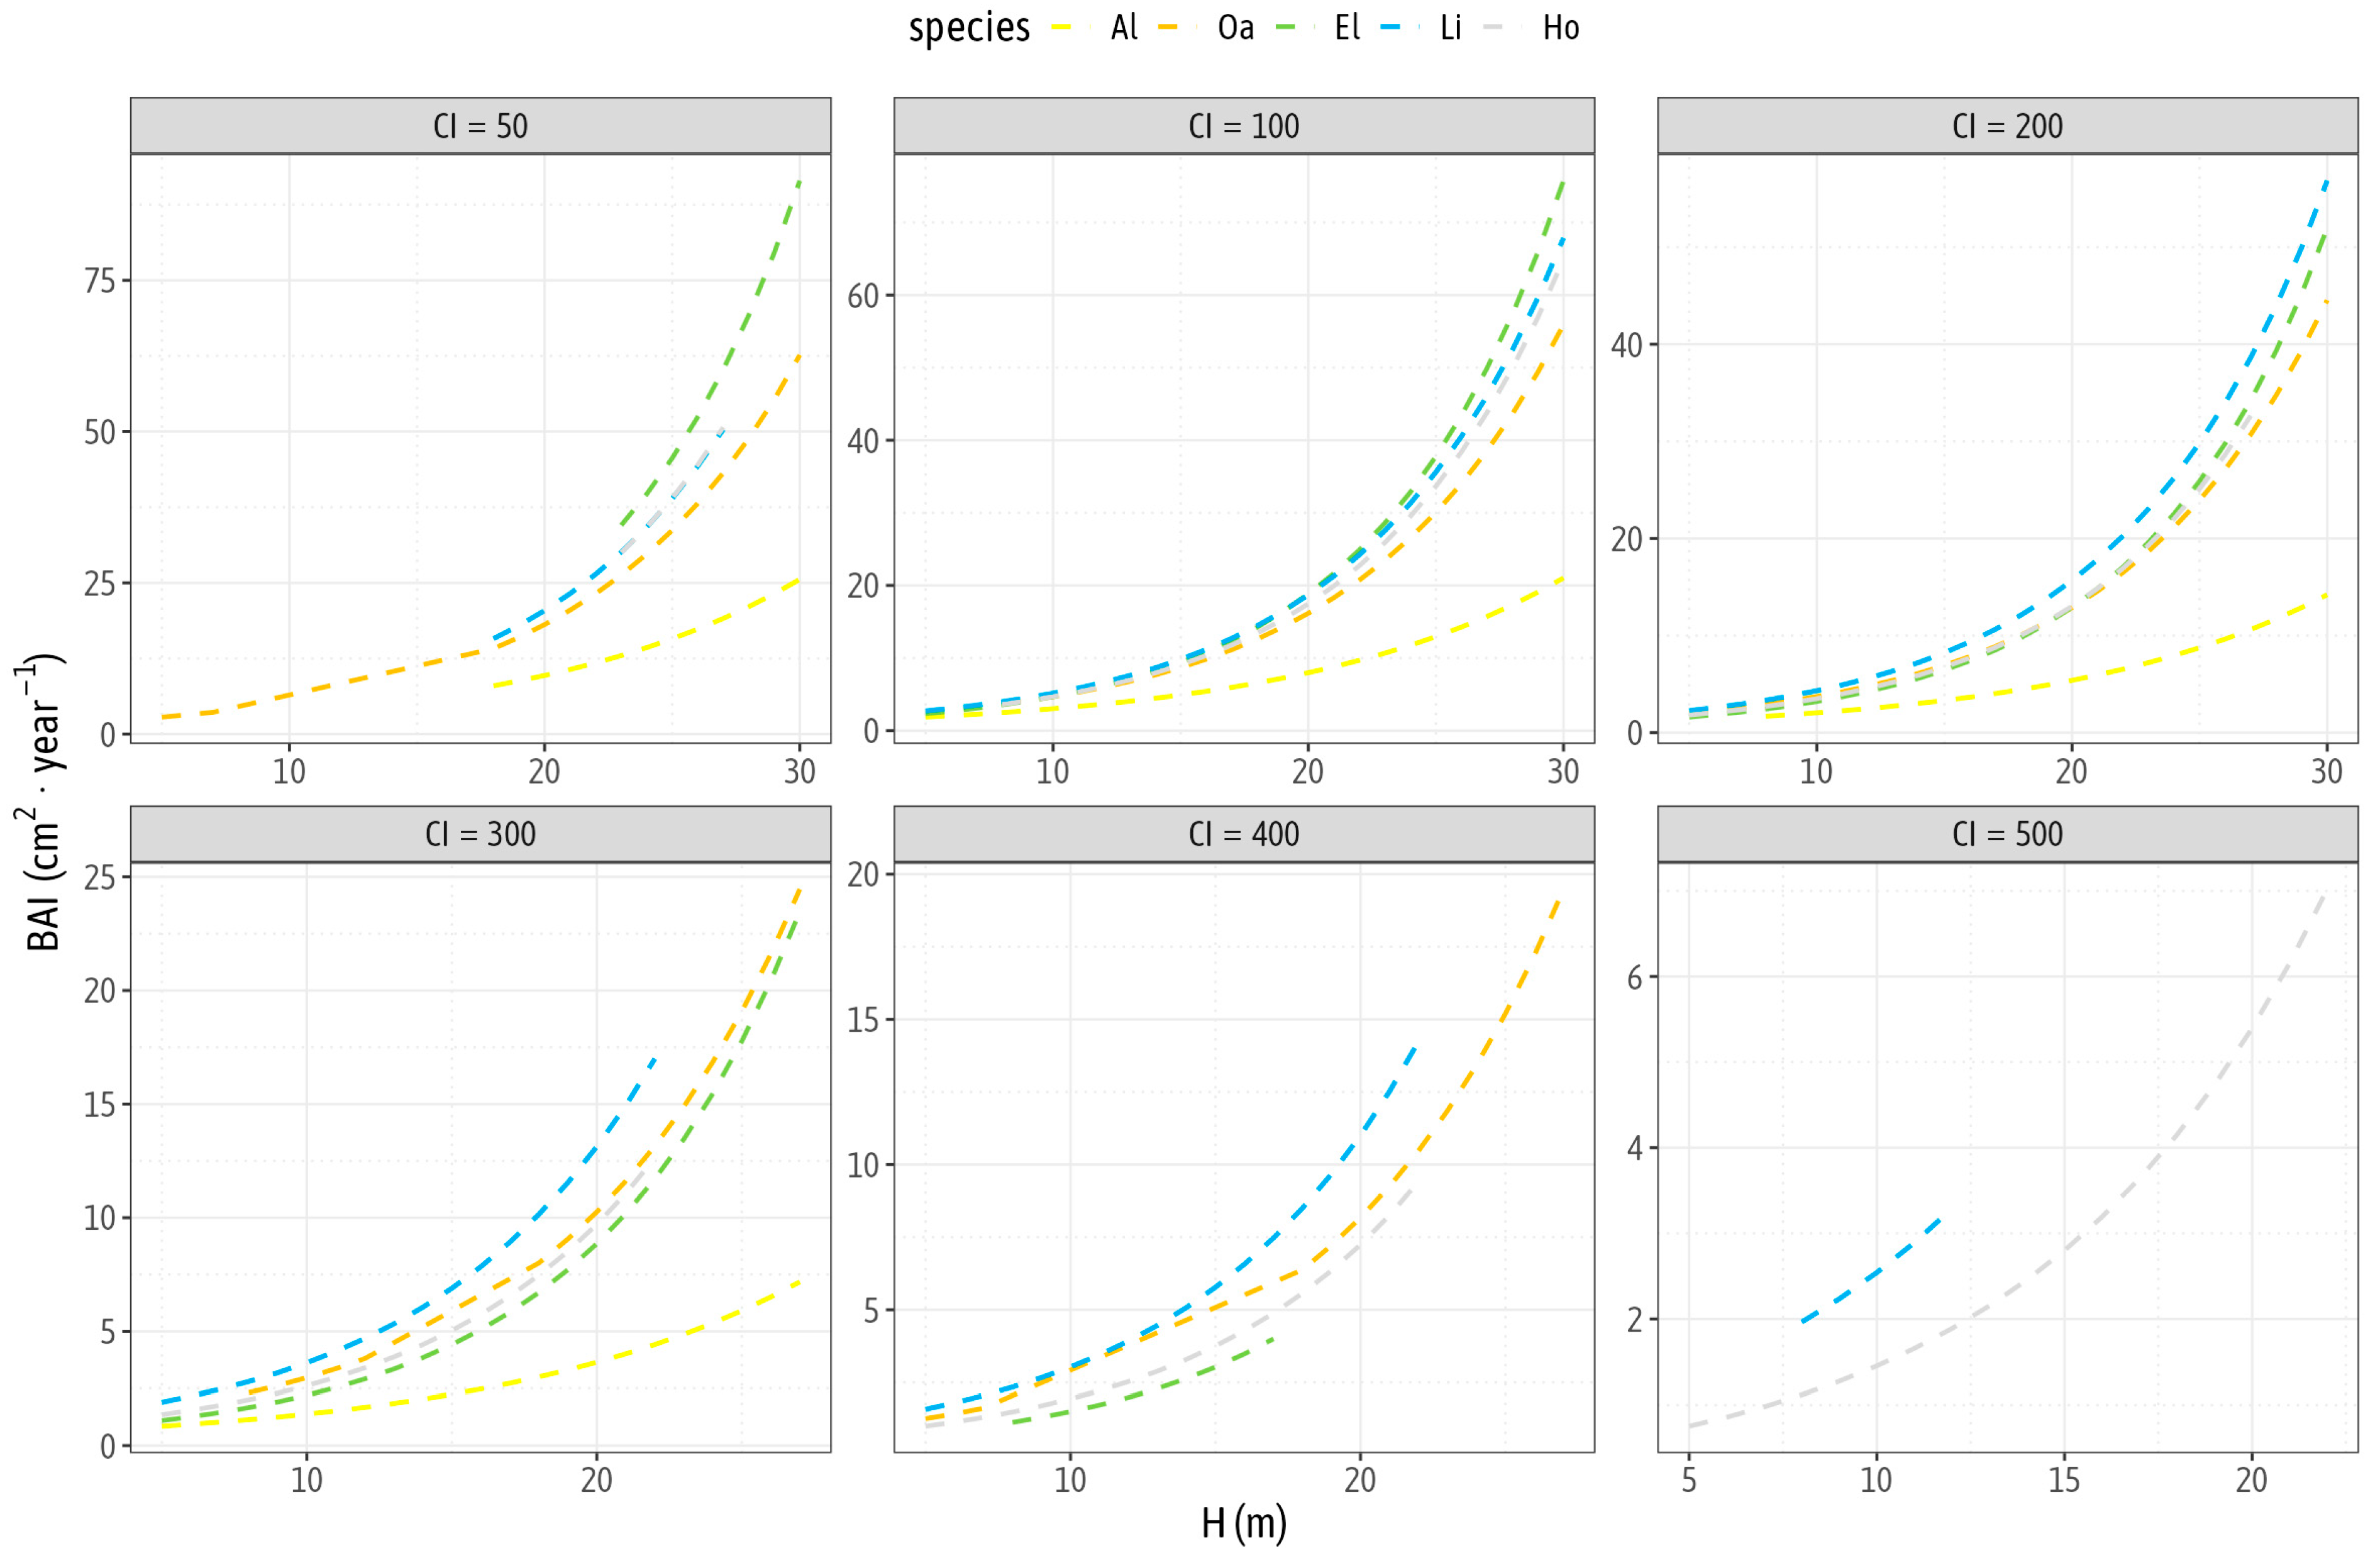
For all tree species studied, the BAI clearly increased with tree height, without allowing a clear identification of the moment of its culmination (Figure 4 and Figure 5). However, contrary to the assumptions of the adopted research hypothesis (H1), for most species the regression coefficients expressing the strength of this relationship did not show statistically significant differences (Table 2). An exception in this respect is the most light-demanding black alder, with the clearly weakest correspondence between BAI and tree height (Table 2, Figure 5).
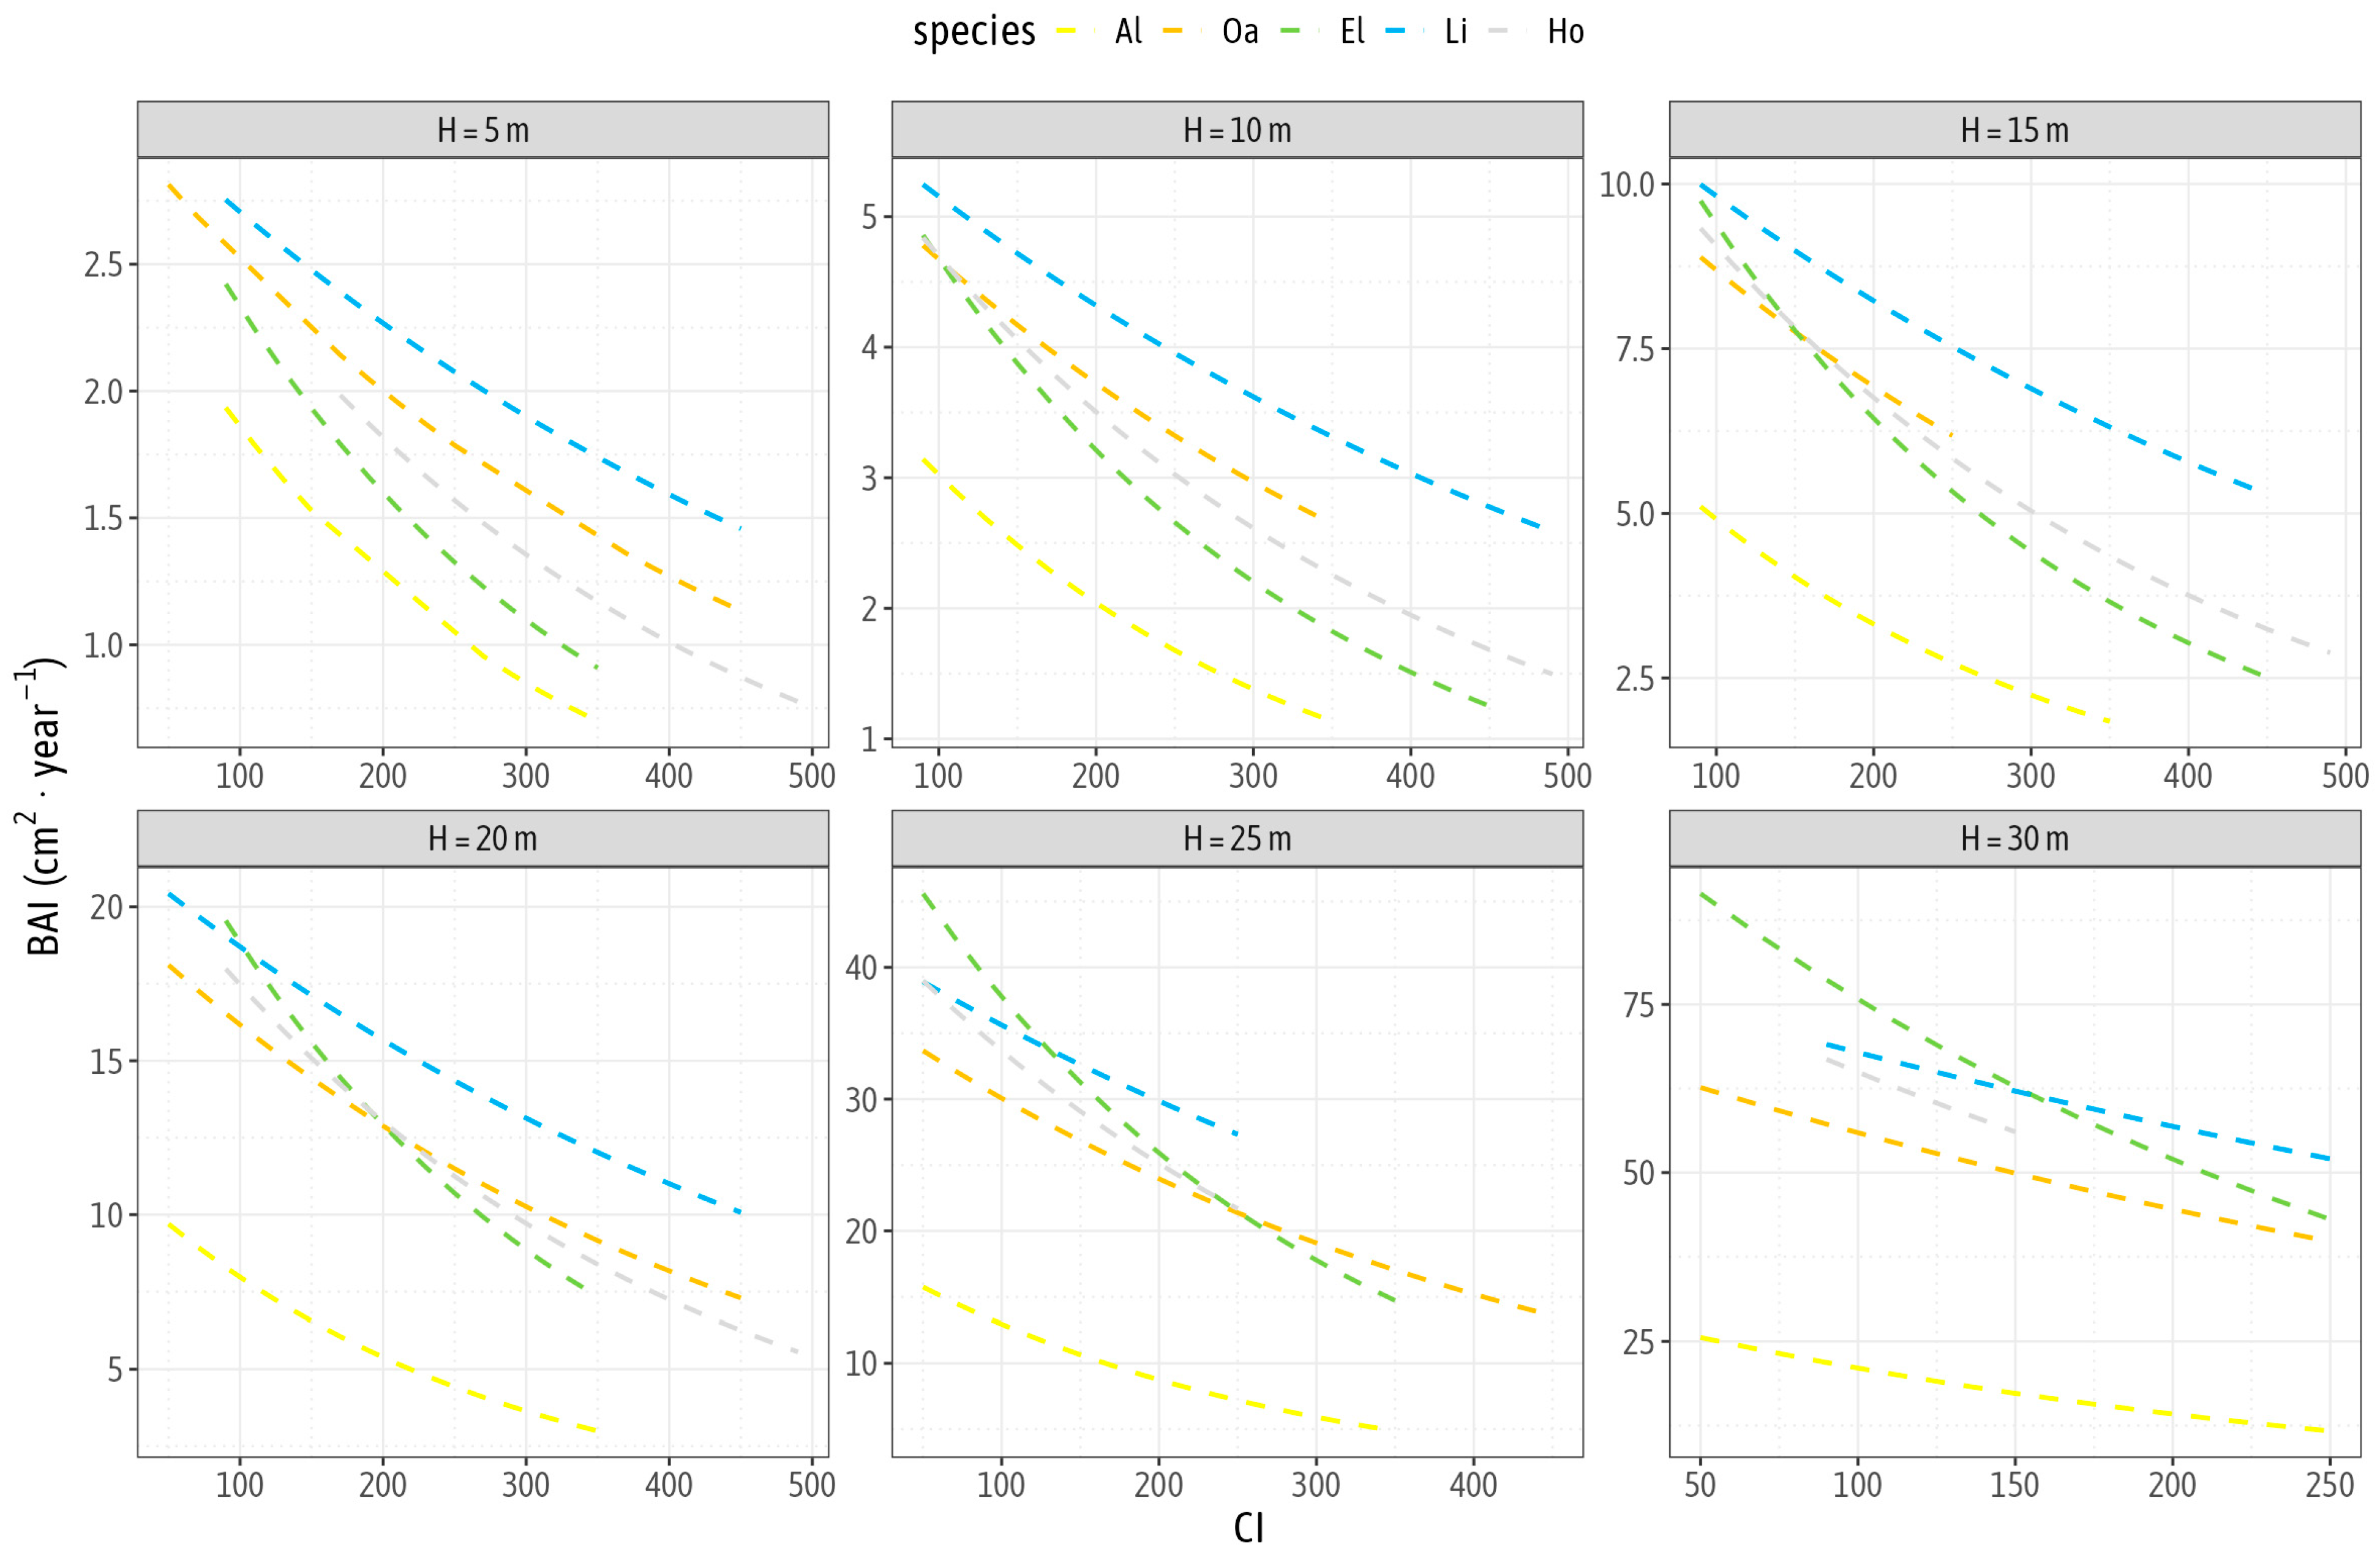
The stem BAI also depended on the level of competitive pressure on particular individuals. For all species studied, it was observed to decrease with an increase in the value of the CI (Figure 4 and Figure 6). However, the values of the regression coefficients expressing the strength of this relationship in the different species showed relatively small variation (Table 2). Statistically significant differences were observed only between lime (the weakest response to competition) and alder and elm (the most pronounced decrease in stem BAI with an increase in the CI) (Table 2, Figure 6). Contrary to the assumptions of the adopted hypothesis H2, these differences appear to be weakly correlated with the light requirements of the studied species. Particularly suggestive is the fact that the strength of the tested relationship in the most light-demanding alder and the most shade-tolerant hornbeam was similar.
It is worth noting that the mixed-effects structure did not mask plot-level variability. The random plot intercept accounted for about 9% of the total variance (ICC = 0.09), showing that site differences were present but relatively small (Table 2). Most variation in BAI occurred among individual trees, driven by tree size and local competitive environment, indicating that similarity in species responses reflects biological patterns rather than model overparameterisation.

4. Discussion

The objective of this study was to compare the stem basal area increment of several tree species building multi-species deciduous stands with complex vertical structure, growing under conditions of the Central European lowlands. In accordance with the research hypothesis H1, a clear relationship was observed between the BAI and the position of the tree in the vertical profile of the forest, related to its height. A characteristic feature of the course of this relationship is the steady increase in the BAI with increasing tree height. At the same time, none of the studied species showed clear symptoms of growth suppression, which could accompany the transition to the senile phase of growth. This is despite the fact that the trees in the studied stands reach dimensions that are close to the potential maximum for the species under consideration. This is probably due to the effect of a significant delay (time lag) of the culmination of the BAI, which is characteristic of trees growing in uneven-aged stands with complex vertical structures. This phenomenon was particularly well recognised in fir stands managed in the selection system [16]. However, this observed pattern of tree growth is not typical for multi-species, multi-aged deciduous and mixed forests [29,35,53] and is instead related to late successional species with high shade-tolerance potential [27,83]. For light-demanding species, especially short-lived ones (such as black alder), this effect can be quite surprising.
Assuming that the trees in the study conditions have not yet reached the moment of culmination of the BAI, higher values can be expected for more light-demanding species, which should have a higher growth potential at this stage of their development [84,85,86,87]. On the other hand, the specific growth conditions in uneven-aged stands (especially shade from above) should favour shade-tolerant species, capable of a positive growth reaction to release, even after a long period of suppression [20,22,83,88]. The results obtained may indicate that for most of the compared species, the above effects compensate each other, resulting in a very similar relationship between stem basal area increment and tree size. This contradicts the assumptions of hypothesis H1 regarding the determining role of light requirements in this respect. Similar observations concerning the absence of a correlation between growth potential and light requirements and potential lifespan have also been found for species in American northern hardwoods [43]. Against this background, however, black alder, which is the most light-demanding of the species examined, shows by far the weakest growth response to an improved position in the vertical profile of the forest.
A weak correspondence with the light requirements of the studied species is also demonstrated by the relationship between the stem BAI and competitive pressure on the tree (contrary to the assumptions of research hypothesis H2). This is particularly surprising, as one would have expected a far greater sensitivity to competitive impacts for light-demanding species. Although previous studies in central European conditions (in Austrian forests) indicated a stronger response in this respect from shade-tolerant species [32], the data used in those analyses may have mostly come from mono-species and even-aged stands. In stands with complex vertical structures, competitive interactions are of a different nature, as the greatest source of competitive pressure for an individual tree is from competitors belonging to higher layers of the stand, generating shade from above [15,89]. Under such conditions, shade-tolerant species with greater ability to occupy the sub-canopy space through lateral crown growth, as well as the ability to modify branch architecture and morphological adaptations of the assimilatory apparatus, are favoured [18,19,84,90,91,92,93,94,95,96]. Furthermore, in multi-species deciduous forests, most interspecific interactions are highly asymmetric [43].
Nonetheless, the differences between the studied species observed in the pattern of the considered relationship cannot be explained by differences in their light requirements. This may result from the overlapping of two effects: primarily, due to the potentially greater sensitivity of light-demanding species to competitive interspecific interactions [92,97,98,99,100,101], followed by the stronger growth response of shade-tolerant species to release from competition [20,102]. As a result, the pattern of the relationship between stem basal area increment and the level of competitive pressure for species with different light requirements may be similar, as was the case in the stands studied. Similar conclusions were drawn by studies conducted in American northern hardwood forests [43], where also no relationship was found between the light requirements of individual species and their sensitivity to competitive interactions.
In the context of the above considerations, it is worth noting that the importance of light requirements as a limiting factor for species in multi-storey stands may sometimes be overestimated. Although the ranges of competitive levels tolerated by the studied species are clearly different, previous studies conducted on the same sites have shown that even species with high light requirements can participate in the formation of stand patches characterised by high structural diversity on a small spatial scale, occurring in all stand layers [57]. This is probably related to the high spatial heterogeneity of the crown canopy, specifically with the presence of small gaps that favour the survival of light-demanding species, not always reflected in the values of the used competition indices, as they do not account for inter-individual variability in the crown architecture of competitors. It is also possible that this phenomenon contributes to masking the interspecies differences in response to competition.
In addition to the relationships discussed above, the research carried out allows us to address a more general question: what are the general differences in growth rates of shade-tolerant and light-demanding species in a multi-storey deciduous forest? It can be assumed that with limited light in the lower layers of the stand, the growth rate of light-demanding species will be slower, since they will not be able to perform photosynthesis as intensively as shade-tolerant species. Indeed, as numerous studies indicate, the survival of more light-demanding species under sub-canopy conditions is associated with a “gap-finding strategy” [22,88,92]. On the other hand, there is a concept that, similarly to full light access, light-demanding species try to grow faster than shade-tolerant ones anyway [53,103,104]. The results obtained tend to favour the first thesis, although this applies mainly to the most light-demanding of the studied species, black alder, which is clearly behind the other studied species in terms of stem basal area growth, for similar tree dimensions and competitive pressure. It might even be stressed that under the conditions of a multi-species, multi-storey deciduous forest, black alder uses a specific growth strategy different from other species and, above all, fundamentally different from its own strategy usually realised in even-aged stands, where it is regarded as a fast-growing species [1]. In this context, it should be emphasised that previous observations on the morphological plasticity of trees in the studied stands did not reveal an effect of excessive stem slenderness for light-demanding species [68], which could indicate an increased investment in tree height growth at the expense of tree diameter increment, with this being a manifestation of an “escape from competition” strategy [6,7,105].
Summarising the above observations, it can be concluded that the differences in growth dynamics among the studied species are relatively small, despite the considerable variation in their light requirements. At the same time, the obtained results correspond fairly well with Grime’s classification of tree life-history strategies [1]. Three of the studied species (hornbeam, lime, and elm) were assigned a competitive strategy (C type), while another species (oak) represents a mixed competitive–stress-tolerant strategy (C–S). Notably, these species exhibit similar model values of stem BAI. Against this background, only alder stands out as the sole species representing a ruderal strategy (R type).
It should be noted, however, that interspecific differences in the examined relationships may be masked by variability in BAI at the level of individual trees, caused by factors not captured in the study methodology. These include individual growth history and fine-scale heterogeneity of the canopy, related to the presence of small gaps and variability in the crown architecture of closest neighbours. Moreover, under real conditions, trees of different species tend to occupy patches of the stand with varying levels of competition, which affects their growth rates and represents an important component of ecological niche differentiation.
From the perspective of species coexistence mechanisms, other elements of life-history strategies are also important, particularly differences in longevity. This allows some species (notably long-lived but relatively light-demanding oak) to use with temporal heterogeneity of ecological niches shaped by episodically occurring medium-scale disturbances [106]. A factor stabilising this ecological system may be the differentiation in water requirements among the studied species. Under conditions of high microsite heterogeneity, this can contribute to the long-term maintenance of tree species diversity, especially through the presence of moister patches favouring alder and elms, while limiting the expansiveness of shade-tolerant species such as hornbeam and lime [57].

5. Conclusions

Under the conditions of a Central European lowland deciduous forest, the stem basal area increment of trees forming multi-species and multi-layered stands increases with the size of the trees and decreases with the level of competitive pressure. However, in both cases, the differences in these relationships do not show a clear correlation with the light requirements of the individual species. Particularly, most of the species studied demonstrate similar growth rates. The exception in this respect is the most light-demanding, but surprisingly slowest-growing species, black alder, which seems to adopt a specific growth strategy, diametrically opposed to that normally used by this species in even-aged stands. Generally, however, it appears that the importance of interspecific differences in growth rates for the mechanisms of coexistence among the studied tree species is obscured by other elements of life-history strategies and by the local specificity of growth conditions.

Author Contributions

Conceptualisation, L.B. and J.P.; methodology, L.B., J.P. and B.W.; software, L.B., J.P. and B.W.; validation, L.B. and B.W.; formal analysis, B.W.; investigation, L.B.; resources, L.B. and B.W.; data curation, L.B. and B.W.; writing—original draft preparation, L.B.; writing—review and editing, L.B. and B.W.; visualisation, B.W.; supervision, L.B.; project administration, L.B.; funding acquisition, L.B. All authors have read and agreed to the published version of the manuscript.

Funding

This work was supported by the Ministry of Science and Higher Education (MNiSW, Poland) as statutory funds no. SUB/040012/D019 and carried out at the Department of Forest Ecology and Silviculture, Faculty of Forestry, University of Agriculture in Krakow, Poland.

Data Availability Statement

The raw data supporting the conclusions of this article will be made available by the authors uponrequest.

Conflicts of Interest

The authors declare no conflicts of interest. The financial supporters had no role in the design of the study, in the collection, analysis, or interpretation of the data, in the writing of the manuscript, or in the decision to publish the results.

References

  1. Brzeziecki, B.; Kienast, F. Classifying the Life-History Strategies of Trees on the Basis of the Grimian Model. For. Ecol. Manag. 1994, 69, 167–187. [Google Scholar] [CrossRef]
  2. Weck, J. ForstlicheZuwachs-Und Ertragskunde; Neumann: Radebeul, Germany, 1955. [Google Scholar]
  3. Assmann, E. The Principles of Forest Yield Study: Studies in the Organic Production, Structure, Increment, and Yield of Forest Stands; Pergamon Press: Oxford, UK, 1970. [Google Scholar]
  4. Pretzsch, H. The Course of Tree Growth. Theory and Reality. For. Ecol. Manag. 2020, 478, 118508. [Google Scholar] [CrossRef]
  5. Rameau, J.V.; Mansion, D.; Dume, G. Flore Forestière Françoise Guide Écologique Illustré; Institut pour le Developpement Forestier: Paris, France, 1989. [Google Scholar]
  6. Valladares, F.; Niinemets, Ü. Shade Tolerance, a Key Plant Feature of Complex Nature and Consequences. Annu. Rev. Ecol. Evol. Syst. 2008, 39, 237–257. [Google Scholar] [CrossRef]
  7. Poorter, L.; Lianes, E.; Moreno-de las Heras, M.; Zavala, M.A. Architecture of Iberian Canopy Tree Species in Relation to Wood Density, Shade Tolerance and Climate. Plant Ecol. 2012, 213, 707–722. [Google Scholar] [CrossRef]
  8. Erteld, W.; Hengst, E. Waldertragslehre; Neumann: Radebeul, Germany, 1966. [Google Scholar]
  9. Borowski, M. Growth of Trees and Stands; PWRiL: Warsaw, Polish, 1974. [Google Scholar]
  10. Lynch, T.B.; Zhang, D. On Relative Maxima of Diameter Growth, Basal Area Growth, Volume Growth, and Mean Annual Increment for Individual Trees. For. Sci. 2011, 57, 353–358. [Google Scholar] [CrossRef]
  11. Forrester, D.I. Linking Forest Growth with Stand Structure: Tree Size Inequality, Tree Growth or Resource Partitioning and the Asymmetry of Competition. For. Ecol. Manag. 2019, 447, 139–157. [Google Scholar] [CrossRef]
  12. Wang, W.; Chen, X.; Zeng, W.; Wang, J.; Meng, J. Development of a Mixed-Effects Individual-Tree Basal Area Increment Model for Oaks (Quercus Spp.) Considering Forest Structural Diversity. Forests 2019, 10, 474. [Google Scholar] [CrossRef]
  13. Zeller, L.; Pretzsch, H. Effect of Forest Structure on Stand Productivity in Central European Forests Depends on Developmental Stage and Tree Species Diversity. For. Ecol. Manag. 2019, 434, 193–204. [Google Scholar] [CrossRef]
  14. Liu, D.; Zhou, C.; He, X.; Zhang, X.; Feng, L.; Zhang, H. The Effect of Stand Density, Biodiversity, and Spatial Structure on Stand Basal Area Increment in Natural Spruce-Fir-Broadleaf Mixed Forests. Forests 2022, 13, 162. [Google Scholar] [CrossRef]
  15. Canham, C.D.; LePage, P.T.; Coates, K.D. A Neighborhood Analysis of Canopy Tree Competition: Effects of Shading versus Crowding. Can. J. For. Res. 2004, 34, 778–787. [Google Scholar] [CrossRef]
  16. Schütz, J.-P. Der Plenterwald; Parey Buchverlag: Berlin, Germany, 2001. [Google Scholar]
  17. Jaworski, A. Charakterystyka Hodowlana Wybranych Drzewostanów z Udziałem Jodły (Abies Alba Mill.) w Karpatach i Sudetach. Acta Agrar. SilvestriaSylvestris 1979, 18, 19–60. [Google Scholar]
  18. Canham, C.D. Growth and Canopy Architecture of Shade-Tolerant Trees: Response to Canopy Gaps. Ecology 1988, 69, 786–795. [Google Scholar] [CrossRef]
  19. Takahashi, K.; Seino, T.; Kohyama, T. Responses to Canopy Openings in Architectural Development of Saplings in Eight Deciduous Broad-Leaved Tree Species. Can. J. For. Res. 2001, 31, 1336–1347. [Google Scholar] [CrossRef][Green Version]
  20. Forget, E.; Nolet, P.; Doyon, F.; Delagrange, S.; Jardon, Y. Ten-Year Response of Northern Hardwood Stands to Commercial Selection Cutting in Southern Quebec, Canada. For. Ecol. Manag. 2007, 242, 764–775. [Google Scholar] [CrossRef]
  21. Čater, M.; Levanič, T. Response of Fagus Sylvatica L. and Abies Alba Mill. in Different Silvicultural Systems of the High Dinaric Karst. For. Ecol. Manag. 2013, 289, 278–288. [Google Scholar] [CrossRef]
  22. Pavlin, J.; Nagel, T.A.; Svitok, M.; Di Filippo, A.; Mikac, S.; Keren, S.; Dikku, A.; Toromani, E.; Panayotov, M.; Zlatanov, T.; et al. Pathways and Drivers of Canopy Accession across Primary Temperate Forests of Europe. Sci. Total Environ. 2024, 906, 167593. [Google Scholar] [CrossRef]
  23. Monserud, R.A.; Sterba, H. A Basal Area Increment Model for Individual Trees Growing in Even- and Uneven-Aged Forest Stands in Austria. For. Ecol. Manag. 1996, 80, 57–80. [Google Scholar] [CrossRef]
  24. Peng, C. Growth and Yield Models for Uneven-Aged Stands: Past, Present and Future. For. Ecol. Manag. 2000, 132, 259–279. [Google Scholar] [CrossRef]
  25. Zhang, L.; Peng, C.; Dang, Q. Individual-Tree Basal Area Growth Models for Jack Pine and Black Spruce in Northern Ontario. For. Chron. 2004, 80, 366–374. [Google Scholar] [CrossRef]
  26. Choi, J.-K.; You, B.-O.; Burkhart, H.E. Allometry, Basal Area Growth, and Volume Equations for Quercus Mongolica and Quercus Variabilis in Gangwon Province of Korea. J. Korean For. Soc. 2007, 96, 189–196. [Google Scholar]
  27. Russell, M.B.; Weiskittel, A.R.; Kershaw, J.A. Assessing Model Performance in Forecasting Long-Term Individual Tree Diameter versus Basal Area Increment for the Primary Acadian Tree Species. Can. J. For. Res. 2011, 41, 2267–2275. [Google Scholar] [CrossRef]
  28. Pokharel, B.; Dech, J.P. Mixed-Effects Basal Area Increment Models for Tree Species in the Boreal Forest of Ontario, Canada Using an Ecological Land Classification Approach to Incorporate Site Effects. Forestry 2012, 85, 255–270. [Google Scholar] [CrossRef]
  29. Tenzin, J.; Tenzin, K.; Hasenauer, H. Individual Tree Basal Area Increment Models for Broadleaved Forests in Bhutan. Forestry 2017, 90, 367–380. [Google Scholar] [CrossRef]
  30. Mohammadi, Z.; Mohammadi Limaei, S.; Lohmander, P.; Olsson, L. Estimation of a Basal Area Growth Model for Individual Trees in Uneven-Aged Caspian Mixed Species Forests. J. For. Res. 2018, 29, 1205–1214. [Google Scholar] [CrossRef]
  31. Di Cosmo, L.; Giuliani, D.; Dickson, M.M.; Gasparini, P. An Individual-Tree Linear Mixed-Effects Model for Predicting the Basal Area Increment of Major Forest Species in Southern Europe. For. Syst. 2020, 29, e019. [Google Scholar] [CrossRef]
  32. Vospernik, S. Basal Area Increment Models Accounting for Climate and Mixture for Austrian Tree Species. For. Ecol. Manag. 2021, 480, 118725. [Google Scholar] [CrossRef]
  33. Ciceu, A.; Bronisz, K.; Garcia-Duro, J.; Badea, O. Age-Independent Diameter Increment Models for Mixed Mountain Forests. Eur. J. For. Res. 2022, 141, 781–800. [Google Scholar] [CrossRef]
  34. Bianchi, S.; Siipilehto, J.; Repola, J.; Niemisto, P.; Korhonen, K.; Peltoniemi, M.; Salminen, H.; Hynynen, J. Individual Tree Basal Area Increment Models Suitable for Different Stand Structures in Finland. For. Ecol. Manag. 2023, 549, 121467. [Google Scholar] [CrossRef]
  35. Padilla-Martínez, J.R.; Paul, C.; Husmann, K.; Corral-Rivas, J.J.; von Gadow, K. Grouping Tree Species to Estimate Basal Area Increment in Temperate Multispecies Forests in Durango, Mexico. For. Ecosyst. 2024, 11, 100158. [Google Scholar] [CrossRef]
  36. Zhao, D.; Borders, B.; Wilson, M. Individual-Tree Diameter Growth and Mortality Models for Bottomland Mixed-Species Hardwood Stands in the Lower Mississippi Alluvial Valley. For. Ecol. Manag. 2004, 199, 307–322. [Google Scholar] [CrossRef]
  37. Rivas, J.J.C.; González, J.G.Á.; Aguirre, O.; Hernández, F.J. The Effect of Competition on Individual Tree Basal Area Growth in Mature Stands of Pinus Cooperi Blanco in Durango (Mexico). Eur. J. For. Res. 2005, 124, 133–142. [Google Scholar] [CrossRef]
  38. Yang, Y.; Huang, S.; Meng, S.X.; Trincado, G.; VanderSchaaf, C.L. A Multilevel Individual Tree Basal Area Increment Model for Aspen in Boreal Mixedwood Stands. Can. J. For. Res. 2009, 39, 2203–2214. [Google Scholar] [CrossRef]
  39. Mailly, D.; Turbis, S.; Pothier, D. Predicting Basal Area Increment in a Spatially Explicit, Individual Tree Model: A Test of Competition Measures with Black Spruce. Can. J. For. Res. 2003, 33, 435–443. [Google Scholar] [CrossRef]
  40. Dimov, L.D.; Chambers, J.L.; Lockhart, B.R. Five-Year Radial Growth of Red Oaks in Mixed Bottomland Hardwood Stands. For. Ecol. Manag. 2008, 255, 2790–2800. [Google Scholar] [CrossRef]
  41. Contreras, M.A.; Affleck, D.; Chung, W. Evaluating Tree Competition Indices as Predictors of Basal Area Increment in Western Montana Forests. For. Ecol. Manag. 2011, 262, 1939–1949. [Google Scholar] [CrossRef]
  42. Wang, Y.; Liu, Z.; Li, J.; Cao, X.; Lv, Y. Assessing the Relationship between Tree Growth, Crown Size, and Neighboring Tree Species Diversity in Mixed Coniferous and Broad Forests Using Crown Size Competition Indices. Forests 2024, 15, 633. [Google Scholar] [CrossRef]
  43. Canham, C.D.; Papaik, M.J.; Uriarte, M.; McWilliams, W.H.; Jenkins, J.C.; Twery, M.J. Neighborhood Analyses of Canopy Tree Competition along Environmental Gradients in New England Forests. Ecol. Appl. 2006, 16, 540–554. [Google Scholar] [CrossRef]
  44. Pretzsch, H.; del Río, M. Density Regulation of Mixed and Mono-Specific Forest Stands as a Continuum: A New Concept Based on Species-Specific Coefficients for Density Equivalence and Density Modification. For. Int. J. For. Res. 2020, 93, 1–15. [Google Scholar] [CrossRef]
  45. Köstler, J.N. Allgäuer Plenterwald types. Forstwissenschafliches Cent. 1956, 75, 423–458. [Google Scholar] [CrossRef]
  46. Favre, L.A. La Croissance Du Sapin En Forêt Jardinée. J. For. Suisse 1965, 116, 547–555. [Google Scholar]
  47. Lejeune, P. Développement d’un Modèle de Type Arbre Appliqué à La Croissance Des Peuplements Feuillus Irréguliers Du Sud de La Belgique. Can. J. For. Res. 1996, 26, 1838–1848. [Google Scholar] [CrossRef]
  48. Schütz, J.-P. Modelling the Demographic Sustainability of Pure Beech Plenter Forests in Eastern Germany. Ann. For. Sci. 2006, 63, 93–100. [Google Scholar] [CrossRef]
  49. Hessenmöller, D.; Bouriaud, O.; Fritzlar, D.; Elsenhans, A.S.; Schulze, E.D. A Silvicultural Strategy for Managing Uneven-Aged Beech-Dominated Forests in Thuringia, Germany: A New Approach to an Old Problem. Scand. J. For. Res. 2018, 33, 668–680. [Google Scholar] [CrossRef]
  50. Webster, C.R.; Lorimer, C.G. Comparative Growing Space Efficiency of Four Tree Species in Mixed Conifer–Hardwood Forests. For. Ecol. Manag. 2003, 177, 361–377. [Google Scholar] [CrossRef]
  51. Fortin, M.; Bédard, S.; DeBlois, J.; Meunier, S. Accounting for Error Correlations in Diameter Increment Modelling: A Case Study Applied to Northern Hardwood Stands in Quebec, Canada. Can. J. For. Res. 2008, 38, 2274–2286. [Google Scholar] [CrossRef]
  52. Kiernan, D.H.; Bevilacqua, E.; Nyland, R.D. Individual-Tree Diameter Growth Model for Sugar Maple Trees in Uneven-Aged Northern Hardwood Stands under Selection System. For. Ecol. Manag. 2008, 256, 1579–1586. [Google Scholar] [CrossRef]
  53. Baral, S.K.; Danyagri, G.; Girouard, M.; Hébert, F.; Pelletier, G. Effects of Suppression History on Growth Response and Stem Quality of Extant Northern Hardwoods Following Partial Harvests. For. Ecol. Manag. 2016, 372, 236–246. [Google Scholar] [CrossRef]
  54. Brzeziecki, B.; Drozdowski, S.; Bielak, K.; Czacharowski, M.; Zajączkowski, J.; Buraczyk, W.; Gawron, L. A Demographic Equilibrium Approach to Stocking Control in Mixed, Multiaged Stands in Bialowieża Forest, Northeast Poland. For. Ecol. Manag. 2021, 481, 118694. [Google Scholar] [CrossRef]
  55. Georgi, L.; Kunz, M.; Fichtner, A.; Reich, K.F.; Bienert, A.; Maas, H.-G.; von Oheimb, G. Effects of Local Neighbourhood Diversity on Crown Structure and Productivity of Individual Trees in Mature Mixed-Species Forests. For. Ecosyst. 2021, 8, 26. [Google Scholar] [CrossRef]
  56. Schmucker, J.; Uhl, E.; Schmied, G.; Pretzsch, H. Growth and Drought Reaction of European Hornbeam, European White Elm, Field Maple and Wild Service Tree. Trees-Struct. Funct. 2023, 37, 1515–1536. [Google Scholar] [CrossRef]
  57. Bartkowicz, L.; Paluch, J. Co-Occurrence of Shade-Tolerant and Light-Adapted Tree Species in Uneven-Aged Deciduous Forests of Southern Poland. Eur. J. For. Res. 2019, 138, 15–30. [Google Scholar] [CrossRef]
  58. Burschel, P.; Huss, J. Grundriss Des Waldbaus; Verlag Paul Parey: Hamburg, Germany, 1997. [Google Scholar]
  59. Jaworski, A. Hodowla Lasu. Charakterystyka Hodowlana Drzew i Krzewów Leśnych; PWRiL: Warsaw, Polish, 2011. [Google Scholar]
  60. Bzowski, M. Rzeźba Terenu i Stosunki Wodne Dna Doliny Wisły w Rejonie Północnej Części Puszczy Niepołomickiej. Stud. Naturae A 1973, 7, 7–37. [Google Scholar]
  61. Ferchmin, M.; Medwecka-Kornaś, A. Grądy Północnej Części Puszczy Niepołomickiej. Stud. Naturae A 1976, 13, 143–169. [Google Scholar]
  62. World Bank Official Boundaries|Data Catalog. Available online: https://datacatalog.worldbank.org/search/dataset/0038272/world-bank-official-boundaries (accessed on 17 October 2025).
  63. OpenTopography—Copernicus GLO-30 Digital Elevation Model. Available online: https://portal.opentopography.org/raster?opentopoID=OTSDEM.032021.4326.3 (accessed on 17 October 2025).
  64. CORINE Land Cover 2018 (Vector/Raster 100 m), Europe, 6-Yearly—Copernicus Land Monitoring Service. Available online: https://land.copernicus.eu/en/products/corine-land-cover/clc2018 (accessed on 17 October 2025).
  65. Bank Danych o Lasach. Available online: https://www.bdl.lasy.gov.pl (accessed on 17 October 2025).
  66. Suliński, J. Zarys Klimatu, Rzeźby Terenu i Stosunki Wodne w Puszczy Niepołomickiej. Stud. Ośrodka Dok. Fizjogr 1981, 9, 25–69. [Google Scholar]
  67. Biging, G.S.; Dobbertin, M. Evaluation of Competition Indices in Individual Tree Growth Models. For. Sci. 1995, 41, 360–377. [Google Scholar] [CrossRef]
  68. Bartkowicz, L.; Paluch, J. Morphological Plasticity of Six Tree Species with Different Light Demands Growing in Multi-Layered Deciduous Forests in Central Europe. Eur. J. For. Res. 2023, 142, 1177–1195. [Google Scholar] [CrossRef]
  69. Fang, H.; Baret, F.; Plummer, S.; Schaepman-Strub, G. An Overview of Global Leaf Area Index (LAI): Methods, Products, Validation, and Applications. Rev. Geophys. 2019, 57, 739–799. [Google Scholar] [CrossRef]
  70. Eliáš, P.; Kratochvílová, I.; Janouš, D.; Marek, M.; Masarovičová, E. Stand Microclimate and Physiological Activity of Tree Leaves in an Oak-Hornbeam Forest. Trees 1989, 3, 227–233. [Google Scholar] [CrossRef]
  71. Eschenbach, C.; Kappen, L. Leaf Area Index Determination in an Alder Forest: A Comparison of Three Methods. J. Exp. Bot. 1996, 47, 1457–1462. [Google Scholar] [CrossRef]
  72. Čermák, J. Leaf Distribution in Large Trees and Stands of the Floodplain Forest in Southern Moravia. Tree Physiol. 1998, 18, 727–737. [Google Scholar] [CrossRef]
  73. Šrámek, M.; Čermák, J. The Vertical Leaf Distribution of Ulmus Laevis Pall. Trees 2012, 26, 1781–1792. [Google Scholar] [CrossRef]
  74. Stenberg, P.; Linder, S.; Smolander, H.; Flower-Ellis, J. Performance of the LAI-2000 Plant Canopy Analyzer in Estimating Leaf Area Index of Some Scots Pine Stands. Tree Physiol. 1994, 14, 981–995. [Google Scholar] [CrossRef]
  75. Soudani, K.; Trautmann, J.; Walter, J.M.N. Leaf Area Index and Canopy Stratification in Scots Pine (Pinus Sylvestris L.) Stands. Int. J. Remote Sens. 2002, 23, 3605–3618. [Google Scholar] [CrossRef]
  76. Diggle, P.J. Statistical Analysis of Spatial Point Patterns; Academic Press: London, UK, 1983. [Google Scholar]
  77. Zenner, E.K.; Teimouri, M. Modeling in Forestry Using Mixture Models Fitted to Grouped and Ungrouped Data. Forests 2021, 12, 1196. [Google Scholar] [CrossRef]
  78. Hammouri, H.M.; Sabo, R.T.; Alsaadawi, R.; Kheirallah, K.A. Handling Skewed Data: A Comparison of Two Popular Methods. Appl. Sci. 2020, 10, 6247. [Google Scholar] [CrossRef]
  79. Brooks, M.E.; Kristensen, K.; van Benthem, K.J.; Magnusson, A.; Berg, C.W.; Nielsen, A.; Skaug, H.J.; Mächler, M.; Bolker, B.M. GlmmTMB Balances Speed and Flexibility among Packages for Zero-Inflated Generalized Linear Mixed Modeling. R J. 2017, 9, 378–400. [Google Scholar] [CrossRef]
  80. R Core Team. R: A Language and Environment for Statistical Computing; R Foundation for Statistical Computing: Vienna, Austria, 2025. [Google Scholar]
  81. Zuur, A.F.; Ieno, E.N.; Walker, N.; Saveliev, A.A.; Smith, G.M. Mixed Effects Models and Extensions in Ecology with R; Springer: New York, NY, USA, 2009; ISBN 978-0-387-87457-9. [Google Scholar]
  82. Kuznetsova, A.; Brockhoff, P.B.; Christensen, R.H.B. LmerTest Package: Tests in Linear Mixed Effects Models. J. Stat. Softw. 2017, 82, 1–26. [Google Scholar] [CrossRef]
  83. Duchesne, L.; Ouimet, R.; Morneau, C. Assessment of Sugar Maple Health Based on Basal Area Growth Pattern. Can. J. For. Res. 2003, 33, 2074–2080. [Google Scholar] [CrossRef]
  84. Hix, D.M.; Lorimer, C.G. Growth-Competition Relationships in Young Hardwood Stands on Two Contrasting Sites in Southwestern Wisconsin. For. Sci. 1990, 36, 1032–1049. [Google Scholar] [CrossRef]
  85. Coates, K.D.; Burton, P.J. Growth of Planted Tree Seedlings in Response to Ambient Light Levels in Northwestern Interior Cedar-Hemlock Forests of British Columbia. Can. J. For. Res. 1999, 29, 1374–1382. [Google Scholar] [CrossRef]
  86. Gratzer, G.; Darabant, A.; Chhetri, P.B.; Rai, P.B.; Eckmüllner, O. Interspecific Variation in the Response of Growth, Crown Morphology, and Survivorship to Light of Six Tree Species in the Conifer Belt of the Bhutan Himalayas. Can. J. For. Res. 2004, 34, 1093–1107. [Google Scholar] [CrossRef]
  87. Black, B.A.; Colbert, J.J.; Pederson, N. Relationships between Radial Growth Rates and Lifespan within North American Tree Species. Écoscience 2008, 15, 349–357. [Google Scholar] [CrossRef]
  88. Brüllhardt, M.; Rotach, P.; Bigler, C.; Nötzli, M.; Bugmann, H. Growth and Resource Allocation of Juvenile European Beech and Sycamore Maple along Light Availability Gradients in Uneven-Aged Forests. For. Ecol. Manag. 2020, 474, 118314. [Google Scholar] [CrossRef]
  89. Bošeľa, M.; Petráš, R.; Šebeň, V.; Mecko, J.; Marušák, R. Evaluating Competitive Interactions between Trees in Mixed Forests in the Western Carpathians: Comparison between Long-Term Experiments and SIBYLA Simulations. For. Ecol. Manag. 2013, 310, 577–588. [Google Scholar] [CrossRef]
  90. Horn, J.S. The Adaptive Geometry of Trees; Princeton University Press: Princeton, NJ, USA, 1971. [Google Scholar]
  91. Rozendaal, D.M.A.; Hurtado, V.H.; Poorter, L. Plasticity in Leaf Traits of 38 Tropical Tree Species in Response to Light; Relationships with Light Demand and Adult Stature. Funct. Ecol. 2006, 20, 207–216. [Google Scholar] [CrossRef]
  92. Petriţan, A.M.; von Lüpke, B.; Petriţan, I.C. Influence of Light Availability on Growth, Leaf Morphology and Plant Architecture of Beech (Fagus Sylvatica L.), Maple (Acer Pseudoplatanus L.) and Ash (Fraxinus Excelsior L.) Saplings. Eur. J. For. Res. 2009, 128, 61–74. [Google Scholar] [CrossRef]
  93. Niinemets, Ü. A Review of Light Interception in Plant Stands from Leaf to Canopy in Different Plant Functional Types and in Species with Varying Shade Tolerance. Ecol. Res. 2010, 25, 693–714. [Google Scholar] [CrossRef]
  94. MacFarlane, D.W.; Kane, B. Neighbour Effects on Tree Architecture: Functional Trade-Offs Balancing Crown Competitiveness with Wind Resistance. Funct. Ecol. 2017, 31, 1624–1636. [Google Scholar] [CrossRef]
  95. Hagemeier, M.; Leuschner, C. Functional Crown Architecture of Five Temperate Broadleaf Tree Species: Vertical Gradients in Leaf Morphology, Leaf Angle, and Leaf Area Density. Forests 2019, 10, 265. [Google Scholar] [CrossRef]
  96. Hagemeier, M.; Leuschner, C. Leaf and Crown Optical Properties of Five Early-, Mid- and Late-Successional Temperate Tree Species and Their Relation to Sapling Light Demand. Forests 2019, 10, 925. [Google Scholar] [CrossRef]
  97. Le Duc, M.G.; Havill, D.C. Competition between Quercus Petraea and Carpinus Betulus in an Ancient Wood in England: Seedling Survivorship. J. Veg. Sci. 1998, 9, 873–880. [Google Scholar] [CrossRef]
  98. Hein, S.; Dhôte, J.-F. Effect of Species Composition, Stand Density and Site Index on the Basal Area Increment of Oak Trees (Quercus Sp.) in Mixed Stands with Beech (Fagus sylvatica L.) in Northern France. Ann. For. Sci. 2006, 63, 457–467. [Google Scholar] [CrossRef]
  99. Ligot, G.; Balandier, P.; Fayolle, A.; Lejeune, P.; Claessens, H. Height Competition between Quercus Petraea and Fagus Sylvatica Natural Regeneration in Mixed and Uneven-Aged Stands. For. Ecol. Manag. 2013, 304, 391–398. [Google Scholar] [CrossRef]
  100. del Río, M.; Bravo-Oviedo, A.; Ruiz-Peinado, R.; Condés, S. Tree Allometry Variation in Response to Intra- and Inter-Specific Competitions. Trees 2019, 33, 121–138. [Google Scholar] [CrossRef]
  101. Beauchamp, N.; Kunstler, G.; Touzot, L.; Ruiz-Benito, P.; Cienciala, E.; Dahlgren, J.; Hawryło, P.; Klopčič, M.; Lehtonen, A.; Šebeň, V.; et al. Light Competition Affects How Tree Growth and Survival Respond to Climate. J. Ecol. 2025, 113, 672–688. [Google Scholar] [CrossRef]
  102. Pretzsch, H. Trees Grow Modulated by the Ecological Memory of Their Past Growth. Consequences for Monitoring, Modelling, and Silvicultural Treatment. For. Ecol. Manag. 2021, 487, 118982. [Google Scholar] [CrossRef]
  103. Beaudet, M.; Messier, C. Growth and Morphological Responses of Yellow Birch, Sugar Maple, and Beech Seedlings Growing under a Natural Light Gradient. Can. J. For. Res. 1998, 28, 1007–1015. [Google Scholar] [CrossRef]
  104. Poorter, L. Growth Responses of 15 Rain-Forest Tree Species to a Light Gradient: The Relative Importance of Morphological and Physiological Traits. Funct. Ecol. 1999, 13, 396–410. [Google Scholar] [CrossRef]
  105. Hulshof, C.M.; Swenson, N.G.; Weiser, M.D. Tree Height–Diameter Allometry across the United States. Ecol. Evol. 2015, 5, 1193–1204. [Google Scholar] [CrossRef] [PubMed]
  106. Bobiec, A.; Jaszcz, E.; Wojtunik, K. Oak (Quercus robur L.) Regeneration as a Response to Natural Dynamics of Stands in European Hemiboreal Zone. Eur. J. For. Res. 2011, 130, 785–797. [Google Scholar] [CrossRef]
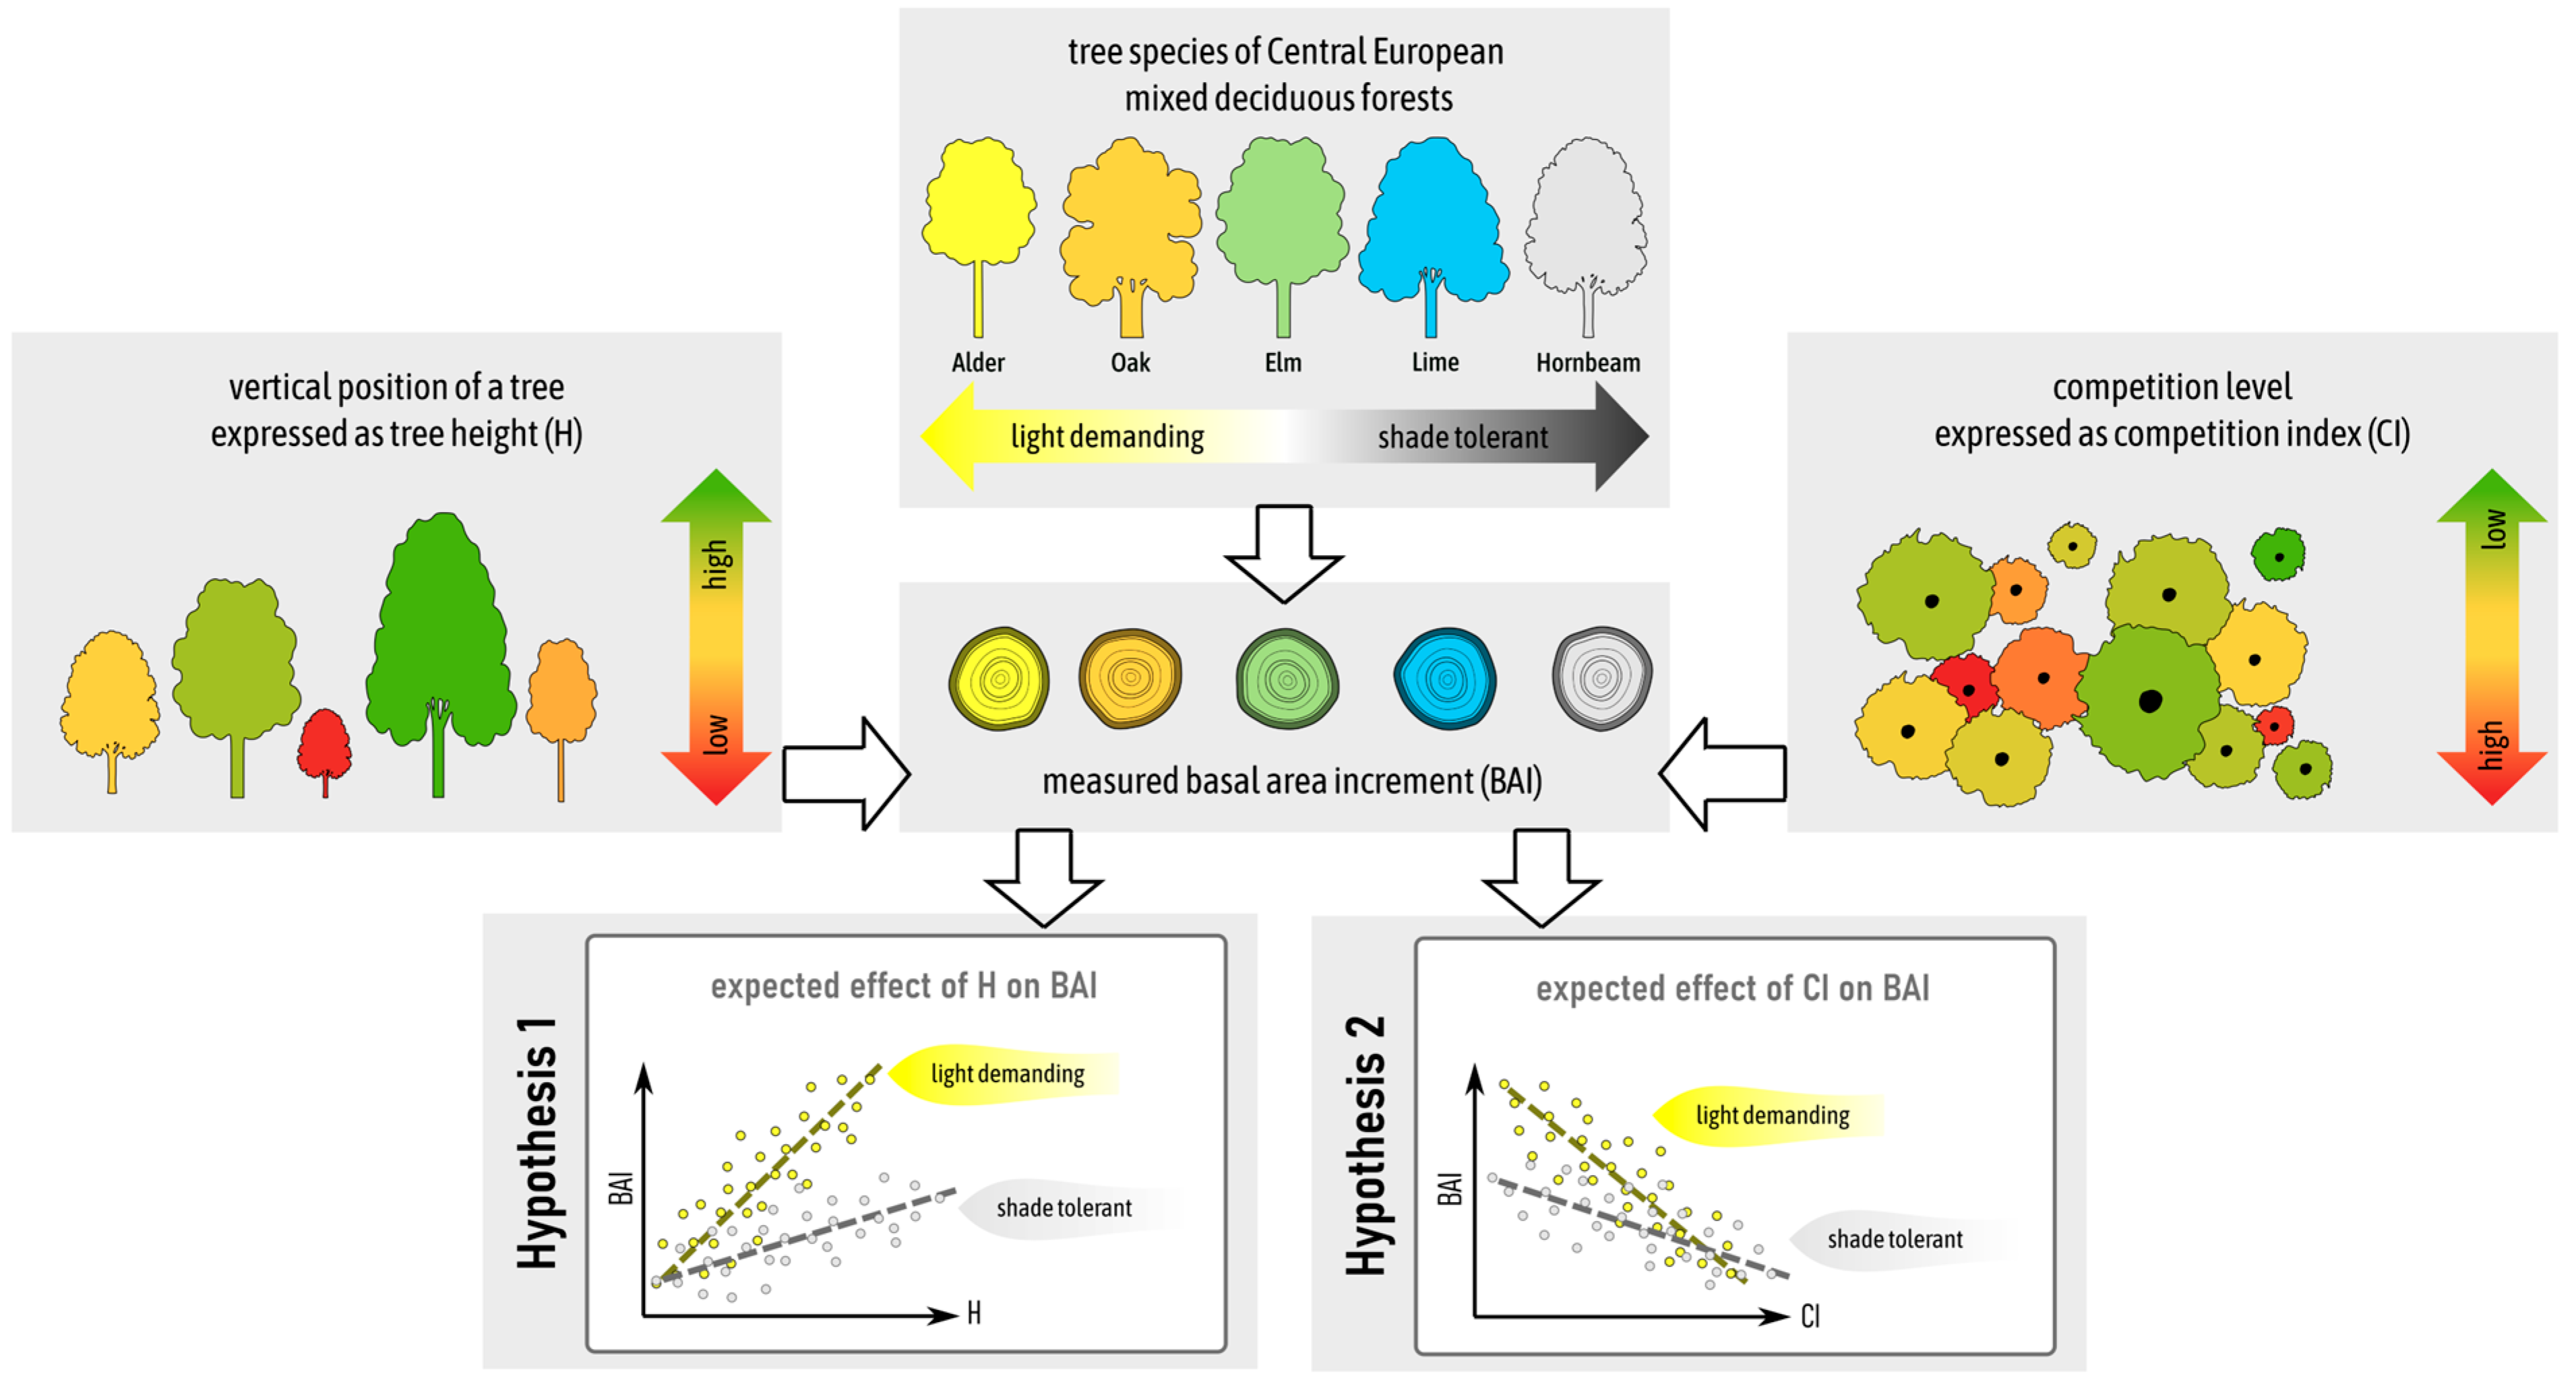
Figure 1. Schematic study design and research hypothesis.
Forests 16 01700 g001
Figure 2. Location of the study area (red dot, left) overlaid on the boundaries of European countries combined with the Copernicus Digital Elevation Model [62,63], and distribution of study plots (right) overlaid on the compartment boundaries of the Niepołomice Forest District combined with the CORINE Land Cover 2018 dataset [64,65].
Forests 16 01700 g002
Figure 3. Median (thick horizontal line), mean (black dot), lower and upper quartiles (box), and range excluding outliers (whiskers) for diameter (DBH), height (H), competition index (CI) and annual stem basal area increment (BAI) of investigated species (Al—black alder, Oa—pedunculate oak, El—European white elm and field elm, Li—small-leaved lime, Ho—European hornbeam).
Forests 16 01700 g003
Figure 4. Relationships between annual stem basal area increment (BAI), tree height (H) and competition index (CI) for the empirical dataset.
Forests 16 01700 g004
Figure 5. Modelled values of the annual stem basal area increment (BAI) at a given constant competition level (CI) and changing tree height (H) for investigated species (Al—black alder; Oa—pedunculate oak; El—European white elm and field elm; Li—small-leaved lime; Ho—European hornbeam).
Forests 16 01700 g005
Figure 6. Modelled values of the annual stem basal area increment (BAI) at a given constant tree height (H) and changing competition level (CI) for investigated species (Al—black alder; Oa—pedunculate oak; El—European white elm and field elm; Li—small-leaved lime; Ho—European hornbeam).
Forests 16 01700 g006
Table 1. Location and basic stand characteristics of the sample plots.
PlotLocationStem No. (ha−1)Species Composition 1
(% of Stem No.)
Basal Area
(m2ha−1)
Species Composition 1
(% of Basal Area)
Volume
(m3ha−1)
AlAsElHoLiOaPioAlAsElHoLiOaPio
150.093° N 20.364° E450 5030136135.5 13214125 471
250.088° N 20.364° E448 1 76176 28.9 3034333 358
350.083° N 20.389° E236 454015 32.6 301654 488
450.086° N 20.388° E248 2384811 130.4 183448 430
550.007° N 20.418° E2532 61770 525.61 3987 345
650.112° N 20.425° E567 14 421429 127.9 7 91765 2302
750.110° N 20.373° E500 10 712161 35.6 45 17 353 527
850.064° N 20.375° E31715 724128 2538.114 714 6014497
950.103° N 20.381° E28613 4320420 35.816 234156 518
1050.079° N 20.366° E34437 401418 35.335 3610 19 464
1150.079° N 20.375° E27850 231284 341.446 219222 577
1250.082° N 20.369° E58328 3110153 1335.452 215811 3406
1350.008° N 20.417° E30554 7227 1033.525 2 72 1464
1 species: Al—black alder Alnus glutinosa (L.) Gaertner; Oa—pedunculate oak Quercus robur L.; As—European ash Fraxinus excelsior L.; Pi—Scots pine Pinus sylvestris L.; Li—small-leaved lime Tilia cordata Miller; Ho—European hornbeam Carpinus betulus L.; El—European white elm Ulmus laevis Pall. and field elm Ulmus minor Miller; o—others (wild cherry, sycamore and Norway maple, and bird cherry).
Table 2. Summary of tested GLMM parameters for stem BAI.
BAI
PredictorsΒCoInP
Fixed Effects
(Intercept)0.52780.8280–0.22750.001 *
H × Gat [Al]0.0970 b0.1115–0.0825<0.001 *
H × Gat [Oa]0.1241 a0.1352–0.1131<0.001 *
H × Gat [El]0.1392 a0.1534–0.1251<0.001 *
H × Gat [Li]0.1289 a0.1428–0.1149<0.001 *
H × Gat [Ho]0.1313 a0.1452–0.1174<0.001 *
Gat [Al] × CI−0.00392 a−0.00220–−0.00564<0.001 *
Gat [Oa] × CI−0.00227 ab−0.00087–−0.003680.002 *
Gat [El] × CI−0.00377 a−0.00247–−0.00507<0.001 *
Gat [Li] × CI−0.00177 b−0.00063–−0.002900.002 *
Gat [Ho] × CI−0.00293 ab−0.00222–−0.00365<0.001 *
Random Effects
σ20.46
τ00Plot0.05
ICC0.09
N Plot13
Observations1240
Marginal R20.6410
Conditional R20.6730
AICc7950.641
Asterisks * indicate statistical significance at 0.05; β—model parameter; CoIn—confidence interval for model parameters; p—level of parameter significance; σ2—variation not explained by the model; τ00—variation associated with random effect of sample plot; ICC—inter-correlation coefficient for sample plots; N—number of sample plots; a, b—homogeneous groups.
Disclaimer/Publisher’s Note: The statements, opinions and data contained in all publications are solely those of the individual author(s) and contributor(s) and not of MDPI and/or the editor(s). MDPI and/or the editor(s) disclaim responsibility for any injury to people or property resulting from any ideas, methods, instructions or products referred to in the content.