Abstract
Long-term relative humidity (RH) variations on the Tibetan Plateau remain poorly understood due to the limited length of instrumental records. Here we developed a 160-year tree-ring width chronology from Populus cathayana on the eastern Tibetan Plateau. Based on climate-tree growth relationships between the tree growth of P. cathayana and current May relative humidity, we reconstructed May relative humidity for the past 146 years. The reconstruction reveals three drought periods (1874–1901, 1921–1932 and 2001–2011) and two wet periods (1902–1920 and 1955–2000). The RH reconstruction is highly consistent with other nearby tree-ring-based temperature and moisture records, suggesting our reconstruction represents large-scale relative humidity variability on the eastern Tibetan Plateau. Spectral analysis detected 2–5 years cycles, likely related to EI Nino–Southern Oscillation (ENSO) variability. Moreover, the reconstruction correlates significantly with the East Asian Summer Monsoon (EASM) index, indicating EASM’s influence on regional moisture transport. These findings highlight the role of ocean–atmosphere coupling in driving humidity variability on the eastern Tibetan Plateau. This study advances understanding of regional climate dynamics and provides a valuable proxy record for future climate change assessments.
1. Introduction
Amid global climate change, the Tibetan Plateau (TP) has undergone significant warming and a slight increase in precipitation over the past five decades [1,2]. Compared to temperature, hydroclimatic fluctuations of the TP, known as the “Water Tower of Asia”, have a greater impact on the regional water cycle, influencing runoff variability and freshwater security across Asia [3,4,5]. These interannual changes in temperature and moisture not only affect the TP itself but also surrounding ecosystems and agriculture. Located on the TP’s eastern margin, Jiu-zhaigou represents a key ecological transition zone between the plateau and the Sichuan Basin [6].
Relative humidity (RH) is an important climatic parameter that reflects the atmospheric moisture condition and plays a vital role in understanding climate system changes under the context of global warming [7]. As air temperature increases, the atmosphere’s capacity to retain water vapor strengthens, thereby promoting evaporation, cloud formation, and the occurrence of extreme precipitation events, which further intensify the global hydrological cycle [8,9,10]. As one of the most important greenhouse gases, water vapor directly affects the Earth’s energy balance and amplifies global warming through positive feedback mechanisms [11,12,13]. Meanwhile, variations in RH exert profound effects on plant physiological processes and ecosystem structure: low RH can suppress stomatal conductance, reduce photosynthetic rate and productivity, whereas excessively high RH may increase the risk of plant diseases [14,15,16]. In addition to temperature and precipitation, RH also has a significant influence on trees by regulating evapotranspiration and maintaining the water balance required for photosynthesis [17]. Therefore, RH is not only a key factor linking the atmosphere and terrestrial water cycles but also an important regulator of ecosystem stability and productivity. However, due to the lack of long-term RH records, our understanding of climate change and its impacts on ecosystems remains incomplete. This highlights the necessity of proxy-based RH reconstructions.
Tree rings offer annually resolved, high-resolution climate signals, making them powerful tools for paleoclimate research [18]. In recent years, tree-ring width data have been widely applied to the reconstruction of historical relative humidity, particularly in China and the Himalayan region. Numerous studies have demonstrated that tree-ring records can reliably reflect the spatiotemporal characteristics of humidity variations. Liu et al. [19] reconstructed the mean RH from June to September for the period 1837–2011 in northeastern China and found a long-term increasing trend, followed by a significant decline after 1990. Peng et al. [20] reconstructed RH variations since 1727 in central China, revealing a historical pattern of frequent regional drought events. Dhyani et al. [17], based on tree-ring data from the western Himalayas in India, found an overall decreasing trend in RH over the past two centuries. Meanwhile, Pumijumnong et al. [21] reported that RH changes in northern Thailand were closely related to large-scale ocean–atmosphere circulations such as ENSO and IOD, with the frequency of extreme wet and dry events markedly increasing since the 20th century. Overall, these studies confirm the effectiveness of tree-ring width data in reconstructing regional relative humidity, although their application remains limited in some areas.
Populus cathayana, a cold- and drought-tolerant broadleaf species widespread across elevations of 1500–3900 m in the southeastern TP, has significant ecological and economic value and shows strong sensitivity to moisture [22]. Previous studies have demonstrated the genus Populus’s potential for climate reconstructions in arid regions [23,24,25]. Notably, RH has been successfully reconstructed using Populus stable isotopes in northwestern China [26]. But to date, P. cathayana has not been applied in dendroclimatic studies on the eastern TP.
Therefore, this study aimed to (1) develop a tree-ring width chronology of P. cathayana on the eastern Tibetan Plateau; (2) clarify tree growth–climate relationships and expand the dendroclimatic application of broadleaf species; (3) reconstruct RH variability based on P. cathayana tree-ring width chronology; and (4) evaluate the possible linkages between regional RH and large-scale ocean–atmosphere oscillations.
2. Materials and Methods
2.1. Study Area
Jiu-zhaigou is located in the eastern part of the Aba Tibetan and Qiang Autonomous Prefecture, Sichuan Province, China (Figure 1a). It lies in the transitional zone between the Qinghai–Tibet Plateau and the Sichuan Basin, characterized by rugged terrain and elevations ranging from approximately 2000 to 4700 m. The study area mainly spans elevations between 2000 and 3500 m and represents an important component of the Minshan Mountains [27]. The region experiences a typical plateau humid climate, with cool and wet summers and cold, dry winters [28]. Vegetation coverage is high, with forest cover exceeding 90%. The dominant soil type is alpine brown soil, typically 20–40 cm deep. Natural vegetation shows distinct vertical zonation. Below 2000 m, sparse drought-tolerant shrubs and some deciduous broad-leaved species are distributed. Between 2000 and 2800 m, mixed coniferous and broad-leaved forests dominate, with major species including P. cathayana, Tetracentron sinense Oliv., Betula utilis D. Don, and Taxus chinensis Rehd. From 2800 to 3500 m, coniferous forests prevail, primarily composed of Abies faxoniana Rehd., Picea purpurea Mast., and Picea retroflexa Mast.; above 3500 m, alpine shrubs and meadows dominate the landscape.
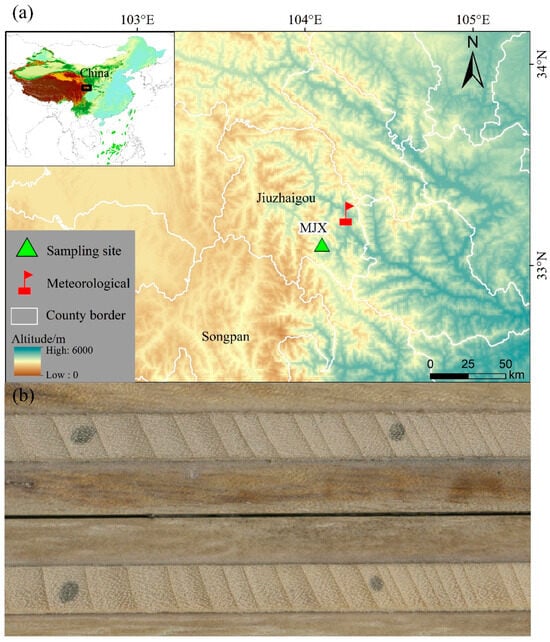
Figure 1.
(a) Map of the study area showing tree-ring sampling sites (triangle) and nearby meteorological stations (flag). (b) Polished cross-sections of P. cathayana tree-ring sample.
P. cathayana typically has a straight trunk; the bark of young trees is smooth and greenish or grayish-white, gradually thickening and developing longitudinal fissures with age, eventually turning dark gray. The species flowers from March to May and fruits from May to July. It is strongly heliophilous and cold-tolerant. In the study area, P. cathayana usually grows along streams or near water sources. It has a well-developed and extensive root system, fast growth rate, and strong sprouting ability. Although not highly demanding in soil conditions, it grows best in deep, fertile, and well-drained soils.
2.2. Tree-Ring Data
Tree-ring samples were collected from a naturally preserved mixed coniferous-broadleaf forest, far from human disturbance, located in Jiu-zhaigou (Geographic Latitude 32.99° N, Geographic Longitude 104.14° E; Elevation: 1920 msl), eastern Tibetan Plateau, China. Following the sampling standards outlined by the International Tree-Ring Data Bank (ITRDB), we selected mature, healthy, and upright P. cathayana trees for coring. From each tree, we extracted at least two increment cores from different directions at breast height. In total, 82 cores were collected from 31 individual trees. Each core was placed into pre-drilled plastic straws, labeled, and brought back to the laboratory. Following standard dendrochronological procedures, the samples were air-dried, mounted, and sanded using progressively finer-grit sandpaper until the ring boundaries were clearly visible (Figure 1b). Once the surfaces were adequately prepared, tree-ring widths were measured with a precision of 0.001 mm using a Velmex measuring system (Bloomfield, NY, USA). All measurements were statistically checked for quality and cross-dated using the COFECHA program [29]. To maximize the temporal coverage of the climate reconstruction, any cores that showed ambiguous growth patterns or could not be confidently cross-dated due to external disturbances were excluded from the final chronology. Tree growth contains both age-related biological trends and ecological signals (such as inter-tree competition) that may obscure the climatic signal [18]. Therefore, to enhance the climate signal in the data, we applied a signal-free detrending method using the RCSigFree program (https://www.geog.cam.ac.uk/research/projects/dendrosoftware (accessed on 28 March 2025)). This method fits age-dependent smoothing splines to each series, removing long-term growth trends and other non-climatic influences while retaining low-frequency climate variability and avoiding the “end-effect” distortion [30]. The final standard chronology was developed using a biweight robust mean method.
2.3. Climate Data
Meteorological data for the period 1959–2017 were obtained from the China Meteorological Data Service Center (CMDC, http://data.cma.cn/ (accessed on 23 January 2018)) for the Jiu-zhaigou meteorological station (Geographic Latitude 33.16° N, Geographic Longitude 104.15° E; Elevation: 1442 msl) (Figure 2). The dataset includes monthly records of mean temperature (T), precipitation (P), and relative humidity (RH). Observational results indicate a mean annual temperature of 9.53 °C, with July being the warmest month and January the coldest; monthly average temperatures remain above 0 °C throughout the year. The mean annual precipitation is approximately 630 mm, with most rainfall concentrated between May and September. The average annual relative humidity is 63.82%.
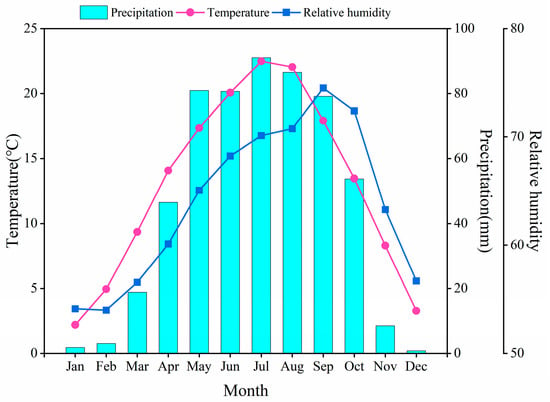
Figure 2.
Monthly mean temperature, relative humidity and precipitation from Jiu-zhaigou meteorological station (1959–2017).
2.4. Methods
Pearson correlation analyses between the tree-ring width chronology and monthly climate variables Temperature, Precipitation and Relative humidity from of the previous March to the current October were conducted over 1959 to 2017. The climate variable showing the strongest and most significant correlation was identified as the dominant limiting factor and was selected for reconstruction with a linear regression model [31]. The model’s robustness and temporal consistency were assessed through split-period calibration and verification [32], using two equal-length subperiods. All reconstruction analyses were carried out in R using the dendroTools package [33,34]. Model performance was evaluated using statistical metrics including the correlation coefficient (R), adjusted R2 (R2adj), reduction of error (RE) [18], coefficient of efficiency (CE) [35], F-statistics, and t-values. A 11-year low-pass filter based on the Fast Fourier Transform (FFT) method [36] was applied to highlight the low-frequency variability of the tree-ring width chronology and reconstruction. To validate the reliability of the reconstruction, spatial correlation analyses were performed using gridded datasets obtained from the KNMI Climate Explorer (https://climexp.knmi.nl/start.cgi (accessed on 1 June 2025)), including CRU TS4.07-derived SPEI, vapor pressure (VP), mean maximum temperature (Tmax), and potential evapotranspiration (PE) [37]. Additionally, red-noise spectral and wavelet analysis was applied to detect periodic signals in the reconstruction [38,39]. Finally, the reconstruction was correlated with the East Asian Summer Monsoon (EASM) Index to explore driving forces of moisture variability [40].
3. Results
3.1. Characteristics of Tree-Ring Time Series
A standardized tree-ring width chronology was developed (Figure 3), spanning from 1863 to 2022 (Table 1). The chronology exhibited a standard deviation (SD) of 0.235, mean sensitivity (MS) of 0.188, first-order autocorrelation (AC1) of 0.551, expressed population signal (EPS) of 0.943, and a signal-to-noise ratio (SNR) of 16.427. These dendrochronological statistical parameters indicate that the chronology contains a strong climate signal and demonstrates sufficient sensitivity to external environmental forcing. The EPS value has consistently been above the widely accepted threshold of 0.85 since 1872 [41,42], confirming the reliability of the chronology and its suitability for subsequent analyses of tree growth–climate relationships.
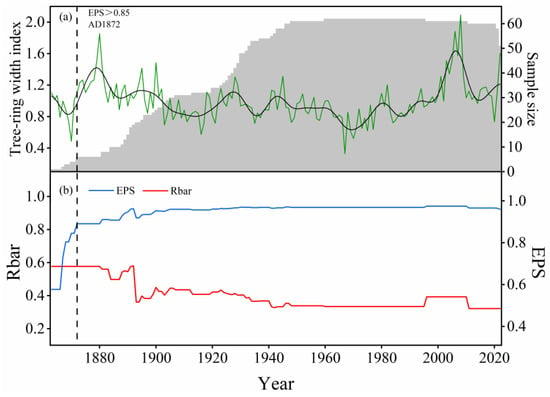
Figure 3.
(a) Tree-ring width standard chronology (green line), the 11-year low-pass FFT filter (black line), and the corresponding sample size (gray shading); (b) Rbar and EPS of the chronology. Vertical dashed line indicates EPS > 0.85.

Table 1.
Statistics of tree-ring width chronology.
3.2. Relationship Between Tree Growth and Climatic Factors
The tree-ring width chronology of P. cathayana in the study area exhibited an overall positive correlation with monthly mean temperature, with this relationship evident in both the current and preceding years (Figure 4a). Significant positive correlations between the chronology and mean temperature were observed in the previous May to September, previous December, the current January, March, May to July and September to October. The chronology showed significant positive correlation with precipitation in the current February and significant negative correlation with precipitation in the current May. At the same time, growth of P. cathayana showed significant negative correlations with relative humidity in the previous May, September, and the current May to June. The negative correlation between the chronology and relative humidity was particularly pronounced in May (r = –0.67, p < 0.01). To further verify these relationships, the first-differenced correlation coefficients between the chronology and climate variables was calculated (Figure 4b). The results confirmed that the tree-ring width chronology remained significantly negatively correlated with both the current May precipitation and May relative humidity (RHc5, defined as the relative humidity in current May) (p < 0.01). These findings indicated that the current RHc5 is the limiting factor for radial growth of P. cathayana in the study area and suitable for climate reconstruction in this region.
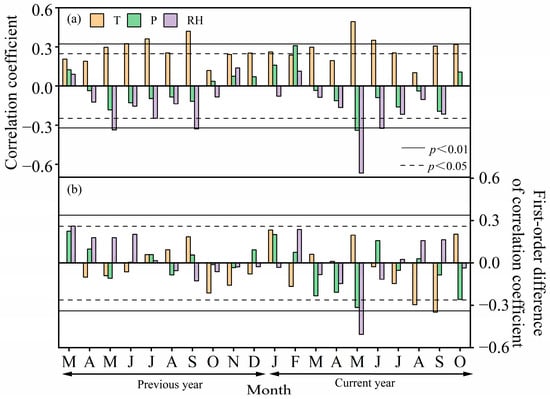
Figure 4.
(a) Correlations between tree-ring width chronology and monthly temperature (T), precipitation (P) and relative humidity (RH) from the previous March to the current October during 1959–2017; (b) First-difference correlation analysis. Solid and dashed lines indicate significance levels at 0.01 and 0.05, respectively.
3.3. Regional May Relative Humidity Reconstruction
Based on the above analyses and findings, we developed a linear regression model to reconstruct historical relative humidity in the study area. The model was statistically validated using a split-sample calibration and verification test. Tree-ring width chronology was used as the predictor variable, while the RHc5 served as the response variable. The model explains 44.6% of the variance in observed May RH (43.6% after adjusting for degrees of freedom) during 1959–2017. The Durbin-Watson statistic (D/W = 1.733) falls within the 1.616–2.384 range (n = 59), indicating no first-order autocorrelation at the 1% significance level and confirming the independence of residuals [43]. The reconstructed values closely align with the instrumental observations during the overlap period (1959–2017) (Figure 5). The quality and stability of the reconstruction model were further evaluated through cross-validation tests (Table 2). The reduction of error (RE = 0.30–0.38) and coefficient of efficiency (CE = 0.25–0.34) were both positive, indicating that the model is statistically robust and suitable for historical climate reconstruction [44]. Accordingly, we reconstructed the RHc5 for the study area over the past 146 years (1872–2017) (Figure 6). Reconstructed RHc5 ranged from 55.61% to 75.98%, with a mean of 64.25% and a standardized deviation of 3.03% over the full reconstruction period. Using the threshold of ±1.5 standard deviations from the mean to define extremely wet or dry years, six extremely wet years (1903, 1916, 1967, 1970, 1975, and 1977) and eleven extremely dry years (1879–1881, 1895, 1900, 1928–1929, 1945, and 2006–2008) were identified (Table 3). Periods with 11-year FFT smoothed values remaining above (below) the mean for at least 11 consecutive years were defined as extremely wet (dry) phases. Based on the smoothed curve, three dry periods (1874–1901, 1921–1932, and 2001–2011) and two wet periods (1902–1920 and 1955–2000) were identified.
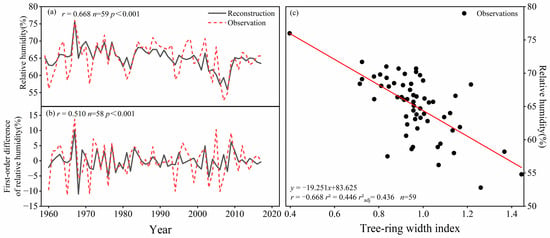
Figure 5.
(a) Comparison between observed and reconstructed relative humidity during 1959–2017; (b) First-differenced comparison of observed and reconstructed values (1960–2017); (c) Scatter plot between tree-ring chronology and observed relative humidity.

Table 2.
Statistics of the calibration and Cross-Validation tests for the regression model for May relative humidity reconstruction.
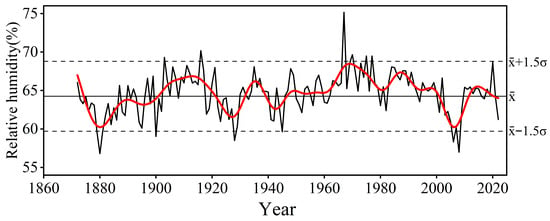
Figure 6.
Reconstructed May relative humidity (black line) and its 11-year low-pass FFT filter (red line) since 1872. The solid line indicates the mean value of the reconstruction, and the horizontal dashed lines indicate the thresholds of ±1.5 standard deviations.

Table 3.
The Driest and Wettest Years in the Reconstructed Relative Humidity Series.
4. Discussion
4.1. Tree Growth and Climate Response
P. cathayana is a fast-growing, shallow-rooted broadleaf species predominantly distributed in the humid, high-elevation mountainous regions of southwestern China, typically growing along river valleys or near water sources [45]. Its radial growth shows a significant positive correlation with precipitation in February (p < 0.05). February precipitation mainly occurs in the form of snow and ice, and the melting process provides sufficient water in early spring, meeting the moisture requirements for bud burst and cambial reactivation, thereby promoting the resumption of spring growth [46]. In contrast, a significant negative correlation was observed between tree-ring width and May precipitation (p < 0.01), which may be associated with the humid characteristics of the habitat. Since P. cathayana usually grows near water sources where soil moisture is generally adequate, additional rainfall can cause excessive soil wetness and reduced sunlight duration, limiting the accumulation of photosynthetic products and lignification, and ultimately resulting in narrower tree rings [47,48]. Moreover, temperatures in almost all months showed positive correlations with tree-ring width, indicating that temperature plays a crucial role in regulating the growth of P. cathayana. As a broadleaf species, its radial growth strongly depends on the synthesis and allocation of photosynthetic products. Higher temperatures promote leaf expansion, enhance photosynthetic activity, and coordinate reproductive and vegetative growth processes [49,50]. When the air temperature exceeds the growth threshold of approximately 5 °C, the physiological activity of P. cathayana increases significantly, thereby promoting tree-ring formation [51].
In addition to precipitation and temperature, relative humidity (RH) also plays an important physiological role in tree growth. Gas exchange in trees occurs through stomata, enabling CO2 uptake and O2 release. Excessively high RH can reduce stomatal aperture, thereby limiting CO2 assimilation and suppressing photosynthetic activity [26]. Previous studies have emphasized that moisture conditions strongly influence tree-ring formation. For instance, based on tree-ring stable carbon isotopes, RH from March to October was reconstructed in the upper Tarim River basin [26], while June–August RH was reconstructed from δ18O and δD isotopes on the Batang–Litang Plateau in western China [52]. These isotope-based reconstructions revealed strong linkages between isotopic signals and atmospheric humidity or precipitation under water stress, identifying stomatal conductance as a key physiological factor influencing tree growth. Similarly, Zhao et al. [53] reported negative correlations between δ18O values and mean RH from March to May, reflecting enhanced evapotranspiration and temperature fluctuations.
Taken together, these results indicate that the growth of P. cathayana is primarily regulated by temperature and early-spring moisture availability, while RH further modulates these effects through its influence on stomatal conductance and photosynthetic efficiency. This finding highlights the sensitivity of P. cathayana to atmospheric humidity and supports its potential as an effective proxy for reconstructing regional hydroclimatic variability.
4.2. Spatial Representativeness of the Reconstruction
To assess the regional representativeness of the reconstructed RHc5 series, spatial correlation analyses were performed with the SPEI, vapor pressure (VP), mean maximum temperature (Tmax), and potential evaporation (PE) (Figure 7). The RHc5 series shows significant correlations with multiple climatic variables across surrounding regions, demonstrating its strong regional applicability. Because saturation vapor pressure is highly temperature-dependent, RH variations reflect both moisture availability and the coupled effects of temperature and evaporation processes [54,55,56]. At the regional scale, RHc5 is positively correlated with the SPEI and VP, as precipitation events increase atmospheric water vapor and actual vapor pressure while lowering temperature and saturation vapor pressure, resulting in higher RH [57,58]. Conversely, RHc5 is negatively correlated with Tmax and PE [28], since rising temperatures enhance atmospheric evaporative demand and increase saturation vapor pressure, leading to reduced RH when moisture supply is limited. These spatial correlations confirm that the RHc5 reconstruction reliably captures regional hydroclimatic variability and represents a robust indicator of moisture conditions on the eastern Tibetan Plateau.
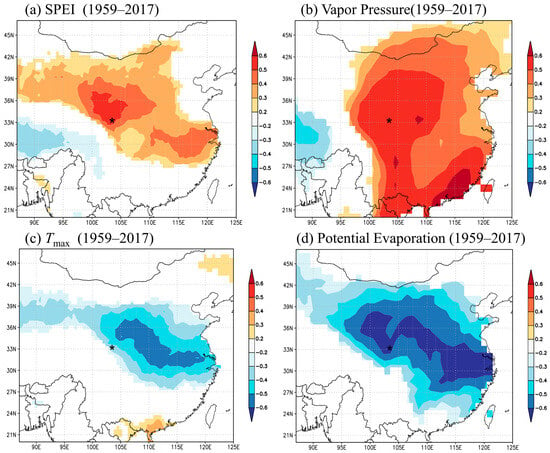
Figure 7.
Spatial correlation analysis of the reconstructed RHc5 with standardized precipitation evapotranspiration index (a), vapor pressure (b), mean maximum temperature (c) and potential evaporation (d) datasets for May during the observation period. The black asterisk indicates the study area.
The RHc5 reconstruction reveals clear multi-decadal fluctuations and distinct dry and wet periods over the past century, reflecting substantial variability in regional moisture conditions on the eastern Tibetan Plateau. Notably, several prolonged dry intervals, such as those during the late 1870s and late 1920s, correspond to severe drought events documented in historical records. The extreme drought from 1876 to 1879, known as the “Dingwu Catastrophe”—one of the most devastating droughts in 19th-century northern China [59], is clearly captured in our reconstruction as a pronounced decline in RH in 1879. Similarly, the drought of 1928–1930, recognized as one of the most severe of the 20th century [60], is reflected as consecutive dry years (1928–1929) in our record. These findings indicate that the RHc5 reconstruction effectively captures major hydroclimatic extremes and long-term variability in regional humidity.
To further evaluate the reliability and regional representativeness of our reconstruction, RHc5 was compared with other independent large-scale reconstructions. The RHc5 series shows a significant negative correlation with reconstructed summer (June–August) temperature over the eastern Tibetan Plateau (r = −0.335, n = 134, p < 0.01; Figure 8a) and a strong positive correlation with July–August soil moisture across East Asia (r = 0.560, n = 131, p < 0.01; Figure 8b) [61,62]. These consistent relationships confirm that the RHc5 reconstruction coherently reflects regional hydrothermal conditions, where lower relative humidity corresponds to warmer and drier environments. Taken together, these results demonstrate that the RHc5 record is both robust and regionally representative, effectively capturing large-scale moisture variability across the eastern Tibetan Plateau and its surrounding regions.
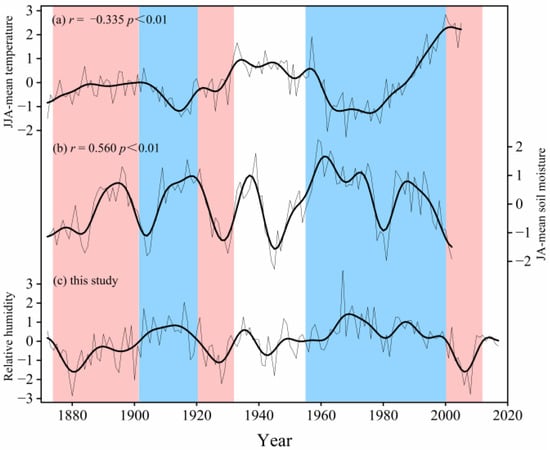
Figure 8.
Comparison of the reconstructed RHc5 series with other tree-ring-based climate records (a) Reconstructed June–August mean temperature over the Eastern Tibetan Plateau [61]; (b) Reconstructed July–August mean soil moisture [62]; (c) This study. All data were standardized using Z-scores. Bold curves denote 11-year low-pass FFT filtered series. The vertical pink and blue shadings denote the dry and wet phases of the reconstruction, respectively.
4.3. Connections of RHc5 Variability with ENSO and the EASM
Red-noise spectral analysis revealed several notable periodicities in the reconstructed relative humidity series (Figure 9). Significant interannual periodic oscillations with timescales of 2.0–2.04 years and 4.56–4.87 years at the 95% confidence level, and 2.0–2.1 years and 4.63–4.71 years at the 99% confidence level, were identified for the period 1872–2017. Wavelet analysis further indicated that interannual cycles dominated the variations in relative humidity throughout the entire reconstruction period, with the 2–5 years cycle and multidecadal cycle being particularly pronounced during 1872–1970 (Figure 10). These observed 2–7 years periodicities are consistent with the tree-ring records reported in previous studies [63,64,65,66], suggesting a close linkage between relative humidity variability and interannual-scale ENSO activity.
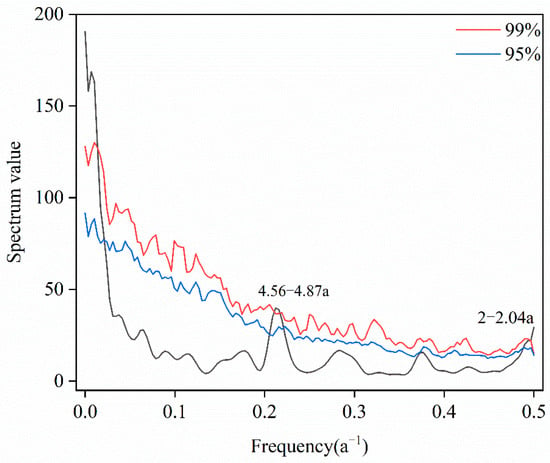
Figure 9.
Red-noise spectrum analysis of the reconstructed RHc5 from 1872 to 2017. Red and blue lines indicate the 95% and 99% confidence levels, respectively.
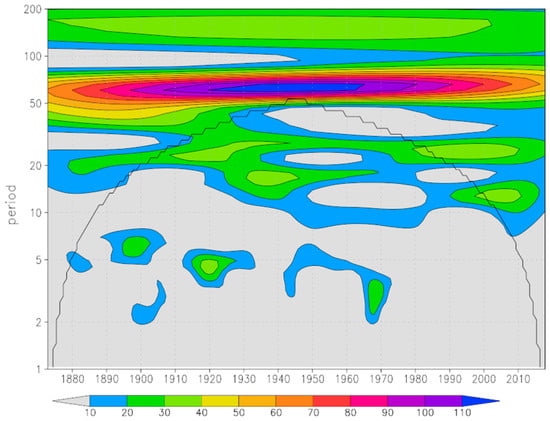
Figure 10.
Wavelet analysis of the reconstructed RHc5 during 1872–2017.
To further investigate the specific mechanism by which ENSO influences relative humidity changes, this study compared the reconstructed RHc5 and the EASM index (Figure 11). The EASM index is derived from the 200 hPa zonal wind field and comprehensively reflects wind anomaly variations in the East Asian region [40]. The long-term trend of RHc5 closely matched the low-frequency variation pattern of the EASM index. Correlation analysis demonstrated a significant positive relationship between the reconstructed RHc5 and the EASM index (r = 0.501, n = 146, p < 0.01) after applying a 11-year low-pass FFT filter. Mechanistically, ENSO modulates the intensity of the EASM by influencing the strength and position of the western Pacific subtropical high [67,68,69], thereby affecting moisture transport and relative humidity levels in the study region. A stronger EASM facilitates greater moisture influx, leading to increased relative humidity, while a weakened monsoon suppresses moisture input, resulting in decreased relative humidity. Notably, since the 1990s, there has been a gradual reduction in monsoonal moisture supply accompanied by a slow decline in relative humidity, reflecting a trend consistent with the overall weakening of the East Asian Summer Monsoon. Although this study highlights the important influence of ENSO and EASM variability on regional relative humidity, the precise physical mechanisms require further investigation, due to the complexity of internal climate system processes and interactions among multiple climate drivers. Therefore, accurate predictions of future humidity trends in this region remain a considerable challenge.
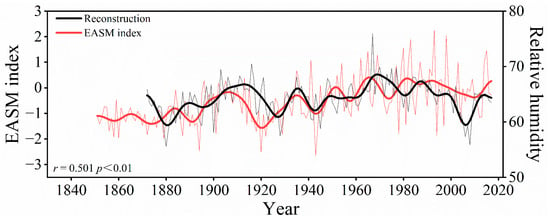
Figure 11.
Comparison between the reconstructed RHc5 and the EASM index [40] during 1872–2017. Bold curves indicate 11-year low-pass FFT filtered series.
5. Conclusions
In this study, we developed a tree-ring width chronology of P. cathayana on the eastern Tibetan Plateau. Climate-tree growth relationships indicated that tree growth of P. cathayana is significantly limited by the current May relative humidity. Based on this relationship, a 146-year May relative humidity reconstruction was developed. The RHc5 reconstruction is highly consistent with other nearby climate records, demonstrating that the tree-ring width chronology of P. cathayana not only captures local climate signals but also has the potential to reflect broader regional climate variability. Further analysis reveals a coherent response between May relative humidity fluctuations and the strength of the EASM. A stronger monsoon enhances moisture supply and increases relative humidity, indicating the EASM’s critical role in modulating moisture variability in the study area. Moreover, the EASM intensity is modulated by ENSO activity, and these ocean-atmosphere coupled processes are clearly recorded in the tree-ring width time series, reflecting a significant large-scale influence on the hydrological and climatic systems of the eastern Tibetan Plateau. In the context of global warming, these records are valuable for identifying ongoing drying trends in the region and for improving the understanding of ocean-atmosphere coupling dynamics.
Author Contributions
Z.L. and T.L. conceptualized the study. Z.L., T.L., J.L. and T.F.A. conducted the field investigation. Z.L. wrote the original draft, with contributions from T.L., J.L. and T.F.A. for review and editing. All authors have read and agreed to the published version of the manuscript.
Funding
This research was funded by the National Natural Science Foundation of China (No. 42105155), Hong Kong Research Grants Council (No. 17317722), and the National Geographic Society (No. EC-95776R-22).
Data Availability Statement
The original contributions presented in this study are included in the article. Further inquiries can be directed to the corresponding author(s).
Conflicts of Interest
The authors declare no conflicts of interest.
References
- Latif, A.; Ilyas, S.; Zhang, Y.; Xin, Y.; Zhou, L.; Zhou, Q. Review on Global Change Status and Its Impacts on the Tibetan Plateau Environment. J. Plant Ecol. 2019, 12, 917–930. [Google Scholar] [CrossRef]
- Wu, Y.; Gao, J.; Zhao, A. Cloud Properties and Dynamics over the Tibetan Plateau—A Review. Earth Sci. Rev. 2024, 248, 104633. [Google Scholar] [CrossRef]
- Chou, C.-M. Complexity Analysis of Rainfall and Runoff Time Series Based on Sample Entropy in Different Temporal Scales. Stoch. Environ. Res. Risk Assess. 2014, 28, 1401–1408. [Google Scholar] [CrossRef]
- Dee, S.; Bailey, A.; Conroy, J.L.; Atwood, A.; Stevenson, S.; Nusbaumer, J.; Noone, D. Water Isotopes, Climate Variability, and the Hydrological Cycle: Recent Advances and New Frontiers. Environ. Res. Clim. 2023, 2, 22002. [Google Scholar] [CrossRef]
- Li, X.; Du, S.; Hu, S.; Dong, D.; Jiang, D.; Cao, C.; Lin, G.; Fu, J. Simulation of Surface Water–Groundwater Interaction in Coal Mining Subsidence Areas: A Case Study of the Kuye River Basin in China. J. Hydrol. 2025, 659, 133243. [Google Scholar] [CrossRef]
- Sui, H.; Liu, C.; Ye, C.; Xu, X.; Sui, T. Analysis of Ecosystem Resilience in Jiuzhaigou Valley Scenic Area under the Effect of Geohazards. Front. Earth Sci. 2023, 10, 1053327. [Google Scholar] [CrossRef]
- Kaushal, R.; Ghosh, P.; Bindeman, I.N. Triple Oxygen Isotopes of Rice (Oryza sativa L.) Phytoliths as a Quantitative Proxy for Relative Humidity. Chem. Geol. 2025, 687, 122823. [Google Scholar] [CrossRef]
- Trenberth, K.E. Conceptual Framework for Changes of Extremes of the Hydrological Cycle With Climate Change. Clim. Change 1999, 42, 327–339. [Google Scholar] [CrossRef]
- Huntington, T.G. Climate Warming-Induced Intensification of the Hydrologic Cycle. In Advances in Agronomy; Elsevier: Amsterdam, The Netherlands, 2010. [Google Scholar]
- Intergovernmental Panel on Climate Change (IPCC). Climate Change 2021—The Physical Science Basis: Working Group I Contribution to the Sixth Assessment Report of the Intergovernmental Panel on Climate Change, 1st ed.; Cambridge University Press: Cambridge, UK, 2023. [Google Scholar]
- Rind, D.; Chiou, E.W.; Chu, W.; Larsen, J.; Oltmans, S.; Lerner, J.; McMaster, L. Positive water vapour feedback in climate models confirmed by satellite data. Nature 1991, 349, 500–503. [Google Scholar] [CrossRef]
- Allan, R.P. The Role of Water Vapour in Earth’s Energy Flows. Surv. Geophys. 2012, 33, 557–564. [Google Scholar] [CrossRef]
- Dunn, R.J.H.; Willett, K.M.; Ciavarella, A.; Stott, P.A. Comparison of Land Surface Humidity Between Observations and CMIP5 Models. Earth Syst. Dyn. 2017, 8, 719–747. [Google Scholar] [CrossRef]
- Tibbitts, T.W. Humidity and Plants. Bioscience 1979, 29, 358–363. [Google Scholar] [CrossRef]
- Romero, F.; Cazzato, S.; Walder, F.; Vogelgsang, S.; Bender, S.F.; Van Der Heijden, M.G.A. Humidity and High Temperature Are Important for Predicting Fungal Disease Outbreaks Worldwide. New Phytol. 2022, 234, 1553–1556. [Google Scholar] [CrossRef]
- Novick, K.A.; Ficklin, D.L.; Grossiord, C.; Konings, A.G.; Martínez-Vilalta, J.; Sadok, W.; Trugman, A.T.; Williams, A.P.; Wright, A.J.; Abatzoglou, J.T.; et al. The Impacts of Rising Vapour Pressure Deficit in Natural and Managed Ecosystems. Plant Cell Environ. 2024, 47, 3561–3589. [Google Scholar] [CrossRef]
- Dhyani, R.; Shekhar, M.; Joshi, R.; Bhattacharyya, A.; Ranhotra, P.S.; Pal, A.K.; Thakur, S.; Nandi, S.K. Reconstruction of Pre-Monsoon Relative Humidity since 1800 C.E. Based on Tree-Ring Data of Pinus roxburghii Sarg. (Chir–Pine) from Pithoragarh, Western Himalaya. Quat. Int. 2022, 629, 4–15. [Google Scholar] [CrossRef]
- Fritts, H.C. Tree Rings and Climate; Academic Press: London, UK; New York, NY, USA, 1976. [Google Scholar]
- Liu, Y.; Wang, Y.; Li, Q.; Song, H.; Zhang, Y.; Yuan, Z.; Wang, Z. A Tree-Ring-Based June-September Mean Relative Humidity Reconstruction since 1837 from the Yiwulü Mountain Region, China. Int. J. Climatol. 2015, 35, 1301–1308. [Google Scholar] [CrossRef]
- Peng, J.; Li, J.; Yang, L.; Li, J.; Huo, J. A 216-Year Tree-Ring Reconstruction of April-July Relative Humidity from Mt. Shiren, Central China. Int. J. Climatol. 2020, 40, 6055–6066. [Google Scholar] [CrossRef]
- Pumijumnong, N.; Muangsong, C.; Panthi, S.; Buajan, S.; Cai, B.; Kulsuwan, P.; Kongsombat, P. A 225-Year Pine (Pinus latteri) Tree-Ring Record of Pre-Monsoon Relative Humidity Variation in Nan Province of Northern Thailand and the Linkage with Large-Scale Ocean-Atmospheric Circulations. Glob. Planet. Change 2023, 230, 104277. [Google Scholar] [CrossRef]
- Peng, Y.; Chen, K. Phylogeographic Pattern of Populus cathayana in the Southeast of Qinghai-Tibetan Plateau of China Revealed by cpSSR Markers. Silva Fenn. 2011, 45, 94. [Google Scholar] [CrossRef][Green Version]
- Akylai, M. Comparison Growth Situation of Tree-Ring Width Between Poplars and Betula at the Floodplain Irtysh River, Altai, China. Asian J. Plant Sci. Res. 2017, 7, 124–132. [Google Scholar][Green Version]
- Wang, Y.; Li, Q.; Liu, Y.; Duan, X.; Sun, C.; Song, H.; Cai, Q.; Liu, X. Tree-Ring Stable Carbon Isotope-Based Mean Maximum Temperature Reconstruction in Northwest China and Its Connection with Atmospheric Circulations. Forests 2022, 13, 1815. [Google Scholar] [CrossRef]
- Qi, Y.; Keyimu, M.; Zeng, F.; Li, Z.; Fan, Z.-X.; Gui, D. Radial Growth Response of Euphrates Poplar to Thermo-Hydroclimatic Changes in a Desert Oasis Ecotone. Ecol. Front. 2025, 45, 68–77. [Google Scholar] [CrossRef]
- Ye, Y.; Liu, Y.; Li, Q.; Ren, M.; Cai, Q.; Sun, C.; Song, H.; Li, T.; Ye, M.; Zhang, T. A 195-Year Growing Season Relative Humidity Reconstruction Using Tree-Ring Cellulose δ13C in the Upper Tarim River Basin, NW China. Forests 2023, 14, 682. [Google Scholar] [CrossRef]
- Fan, J.; Wei, X.; Shi, W.; Guo, Q.; Zhang, S.; Xu, H.; Song, H.; Xu, C.; An, W.; Jiang, H. Response of Tree Rings to Earthquakes During the Past 350 Years at Jiuzhaigou in the Eastern Tibet. Sci. Total Environ. 2020, 731, 138714. [Google Scholar] [CrossRef]
- Cui, L.; Li, J.; An, W.; Qin, N.; Song, H.; Liu, Y. The Recent High Occurrence of Spring Atmospheric Droughts over Central Hengduan Mountains Is Unprecedented in 669-Year Tree-Ring Records. Palaeogeogr. Palaeoclimatol. Palaeoecol. 2024, 649, 112318. [Google Scholar] [CrossRef]
- Holmes, R.L. Computer-Assisted Quality Control in Tree-Ring Dating and Measurement. Tree-Ring Bull. 1983, 43, 69–78. [Google Scholar]
- Melvin, T.M.; Briffa, K.R. A “Signal-Free” Approach to Dendroclimatic Standardisation. Dendrochronologia 2008, 26, 71–86. [Google Scholar] [CrossRef]
- Cook, E.R.; Kairiukstis, L.A. Methods of Dendrochronology: Applications in the Environmental Sciences; Springer Science & Business Media: Dordrecht, The Netherlands, 1990. [Google Scholar]
- Meko, D.; Graybill, D.A. Tree-Ring Reconstruction of Upper Gila Rwer Discharge. J. Am. Water Resour. Assoc. 1995, 31, 605–616. [Google Scholar] [CrossRef]
- Jevšenak, J.; Džeroski, S.; Zavadlav, S.; Levanič, T. A Machine Learning Approach to Analyzing the Relationship Between Temperatures and Multi-Proxy Tree-Ring Records. Tree-Ring Res. 2018, 74, 210–224. [Google Scholar] [CrossRef]
- Jevšenak, J.; Levanič, T.; Džeroski, S. Comparison of an Optimal Regression Method for Climate Reconstruction with the Compare_methods() Function from the dendroTools R Package. Dendrochronologia 2018, 52, 96–104. [Google Scholar] [CrossRef]
- Briffa, K.R.; Jones, P.D.; Pilcher, J.R.; Hughes, M.K. Reconstructing Summer Temperatures in Northern Fennoscandinavia Back to A.D. 1700 Using Tree-Ring Data from Scots Pine. Arct. Alp. Res. 1988, 20, 385–394. [Google Scholar] [CrossRef]
- Sorensen, H.; Jones, D.; Heideman, M.; Burrus, C. Real-Valued Fast Fourier Transform Algorithms. IEEE Trans. Acoust. Speech Signal Process. 1987, 35, 849–863. [Google Scholar] [CrossRef]
- Harris, I.; Osborn, T.J.; Jones, P.; Lister, D. Version 4 of the CRU TS Monthly High-Resolution Gridded Multivariate Climate Dataset. Sci. Data 2020, 7, 109. [Google Scholar] [CrossRef]
- Torrence, C.; Compo, G.P. A Practical Guide to Wavelet Analysis. Bull. Am. Meteorol. Soc. 1998, 79, 61–78. [Google Scholar] [CrossRef]
- Schulz, M.; Mudelsee, M. REDFIT: Estimating Red-Noise Spectra Directly from Unevenly Spaced Paleoclimatic Time Series. Comput. Geosci. 2002, 28, 421–426. [Google Scholar] [CrossRef]
- Zhao, G.; Huang, G.; Wu, R.; Tao, W.; Gong, H.; Qu, X.; Hu, K. A New Upper-Level Circulation Index for the East Asian Summer Monsoon Variability. J. Clim. 2015, 28, 9977–9996. [Google Scholar] [CrossRef]
- Wigley, T.M.; Briffa, K.R.; Jones, P.D. On The Average Value of Correlated Time Series, With Applications in Dendroclimatology and Hydrometeorology. J. Clim. Appl. Meteor. 1984, 23, 201–213. [Google Scholar] [CrossRef]
- Li, T.; Peng, J.; Au, T.F.; Li, J. April–September Minimum Temperature Reconstruction Based on Sabina tibetica Ring-Width Chronology in the Central Eastern Tibetan Plateau, China. J. For. Res. 2024, 35, 37. [Google Scholar] [CrossRef]
- Durbin, J.; Watson, G.S. Testing for serial correlation in least squares regression: I. Biometrika 1950, 37, 409–428. [Google Scholar] [PubMed]
- Cook, E.R.; Briffa, K.R.; Jones, P.D. Spatial Regression Methods in Dendroclimatology: A Review and Comparison of Two Techniques. Int. J. Climatol. 1994, 14, 379–402. [Google Scholar] [CrossRef]
- Lu, Z.; Wang, Y.; Peng, Y.; Korpelainen, H.; Li, C. Genetic Diversity of populus cathayana Rehd Populations in Southwestern China Revealed by ISSR Markers. Plant Sci. 2006, 170, 407–412. [Google Scholar] [CrossRef]
- Ren, P.; Rossi, S.; Camarero, J.J.; Ellison, A.M.; Liang, E.; Peñuelas, J. Critical Temperature and Precipitation Thresholds for the Onset of Xylogenesis of Juniperus przewalskii in a Semi-Arid Area of the North-Eastern Tibetan Plateau. Ann. Bot. 2018, 121, 617–624. [Google Scholar] [CrossRef]
- Tullus, A.; Kupper, P.; Sellin, A.; Parts, L.; Sõber, J.; Tullus, T.; Lõhmus, K.; Sõber, A.; Tullus, H. Climate Change at Northern Latitudes: Rising Atmospheric Humidity Decreases Transpiration, N-Uptake and Growth Rate of Hybrid Aspen. PLoS ONE 2012, 7, e42648. [Google Scholar] [CrossRef]
- Sell, M.; Ostonen, I.; Rohula-Okunev, G.; Rusalepp, L.; Rezapour, A.; Kupper, P. Responses of Fine Root Exudation, Respiration and Morphology in Three Early Successional Tree Species to Increased Air Humidity and Different Soil Nitrogen Sources. Tree Physiol. 2021, 42, 557–569. [Google Scholar] [CrossRef] [PubMed]
- Keitel, C.; Matzarakis, A.; Rennenberg, H.; Gessler, A. Carbon Isotopic Composition and Oxygen Isotopic Enrichment in Phloem and Total Leaf Organic Matter of European Beech (Fagus sylvatica L.) along a Climate Gradient. Plant Cell Environ. 2006, 29, 1492–1507. [Google Scholar] [CrossRef]
- Vitasse, Y.; Bottero, A.; Cailleret, M.; Bigler, C.; Fonti, P.; Gessler, A.; Lévesque, M.; Rohner, B.; Weber, P.; Rigling, A.; et al. Contrasting Resistance and Resilience to Extreme Drought and Late Spring Frost in Five Major European Tree Species. Glob. Change Biol. 2019, 25, 3781–3792. [Google Scholar] [CrossRef]
- Charlet De Sauvage, J.; Vitasse, Y.; Meier, M.; Delzon, S.; Bigler, C. Temperature Rather than Individual Growing Period Length Determines Radial Growth of Sessile Oak in the Pyrenees. Agric. For. Meteorol. 2022, 317, 108885. [Google Scholar] [CrossRef]
- An, W.; Liu, X.; Leavitt, S.W.; Xu, G.; Zeng, X.; Wang, W.; Qin, D.; Ren, J. Relative Humidity History on the Batang-Litang Plateau of Western China since 1755 Reconstructed from Tree-Ring δ18O and δD. Clim. Dyn. 2014, 42, 2639–2654. [Google Scholar] [CrossRef]
- Zhao, F.; Fan, Z.; Su, T.; Li, S.; Tang, H.; Spicer, T.E.V.; Zhou, Z. Tree-Ring δ18O Inferred Spring Drought Variability over the Past 200 Years in the Hengduan Mountains, Southwest China. Palaeogeogr. Palaeoclimatol. Palaeoecol. 2019, 518, 22–33. [Google Scholar] [CrossRef]
- Anderson, D.B. Relative Humidity or Vapor Pressure Deficit. Ecology 1936, 17, 277–282. [Google Scholar] [CrossRef]
- Alduchov, O.A.; Eskridge, R.E. Improved Magnus’ Form Approximation of Saturation Vapor Pressure. J. Appl. Meteorol. 1996, 35, 601–609. [Google Scholar] [CrossRef]
- Betts, A.K.; Desjardins, R.; Worth, D.; Beckage, B. Climate Coupling Between Temperature, Humidity, Precipitation, and Cloud Cover over the Canadian Prairies. J. Geophys. Res. Atmos. 2014, 119, 13,305–13,326. [Google Scholar] [CrossRef]
- Shi, F.; Zhao, C.; Zhou, X.; Li, X. Spatial Variations of Climate-Driven Trends of Water Vapor Pressure and Relative Humidity in Northwest China. Asia-Pac. J. Atmos. Sci. 2019, 55, 221–231. [Google Scholar] [CrossRef]
- Meseguer-Ruiz, O.; Serrano-Notivoli, R.; Aránguiz-Acuña, A.; Fuentealba, M.; Nuñez-Hidalgo, I.; Sarricolea, P.; Garreaud, R. Comparing SPI and SPEI to Detect Different Precipitation and Temperature Regimes in Chile Throughout the Last Four Decades. Atmos. Res. 2024, 297, 107085. [Google Scholar]
- Zhang, D.; Liang, Y. A Long Lasting and Extensive Drought Event over China in 1876–1878. Adv. Clim. Change Res. 2010, 1, 91–99. [Google Scholar]
- Kang, S.; Yang, B.; Qin, C.; Wang, J.; Shi, F.; Liu, J. Extreme Drought Events in the Years 1877–1878, and 1928, in the Southeast Qilian Mountains and the Air–Sea Coupling System. Quat. Int. 2013, 283, 85–92. [Google Scholar] [CrossRef]
- Wang, J.; Yang, B.; Ljungqvist, F.C. A Millennial Summer Temperature Reconstruction for the Eastern Tibetan Plateau from Tree-Ring Width*. J. Clim. 2015, 28, 5289–5304. [Google Scholar] [CrossRef]
- Zhang, P.; Jeong, J.-H.; Yoon, J.-H.; Kim, H.; Wang, S.-Y.S.; Linderholm, H.W.; Fang, K.; Wu, X.; Chen, D. Abrupt Shift to Hotter and Drier Climate over Inner East Asia Beyond the Tipping Point. Science 2020, 370, 1095–1099. [Google Scholar] [CrossRef]
- Liu, Y.; Liu, H.; Song, H.; Li, Q.; Burr, G.S.; Wang, L.; Hu, S. A Monsoon-Related 174-Year Relative Humidity Record from Tree-Ring δ18O in the Yaoshan Region, Eastern Central China. Sci. Total Environ. 2017, 593–594, 523–534. [Google Scholar] [CrossRef]
- Liu, Y.; Fang, C.; Li, Q.; Song, H.; Ta, W.; Zhao, G.; Sun, C. Tree-Ring δ18O Based PDSI Reconstruction in the Mt. Tianmu Region since 1618 AD and Its Connection to the East Asian Summer Monsoon. Ecol. Indic. 2019, 104, 636–647. [Google Scholar] [CrossRef]
- Zhao, Q.; Xu, C.; An, W.; Liu, Y.; Guo, Z. Increased Extreme Drought Events in South-Central China since the Last Century: Evidence from Oxygen Isotope Signatures Preserved in Tree Ring Cellulose. Dendrochronologia 2022, 74, 125973. [Google Scholar] [CrossRef]
- Li, J.; Peng, K.; Wei, X.; Liu, Y.; Li, J.; Peng, M.; Li, X.; Zhang, K.; Peng, J. May-June Relative Humidity Variation Recorded by Tree Ring Widths of Pinus armandii Franch since 1863 in the Funiu Mountains, Central China. Quat. Int. 2024, 696, 38–49. [Google Scholar] [CrossRef]
- Chung, P.-H.; Sui, C.-H.; Li, T. Interannual Relationships Between the Tropical Sea Surface Temperature and Summertime Subtropical Anticyclone over the Western North Pacific. J. Geophys. Res. 2011, 116, D13111. [Google Scholar] [CrossRef]
- Anisetty, S.K.A.V.P.R.; Brahmanandam, P.S.; Uma, G.; Babu, A.N.; Huang, C.-Y.; Kumar, G.A.; Ram, S.T.; Wang, H.-L.; Chu, Y.-H. Planetary-Scale Wave Structures of the Earth’s Atmosphere Revealed from the COSMIC Observations. J. Meteorol. Res. 2014, 28, 281–295. [Google Scholar] [CrossRef]
- He, C.; Zhou, T.; Wu, B. The Key Oceanic Regions Responsible for the Interannual Variability of the Western North Pacific Subtropical High and Associated Mechanisms. J. Meteorol. Res. 2015, 29, 562–575. [Google Scholar] [CrossRef]
Disclaimer/Publisher’s Note: The statements, opinions and data contained in all publications are solely those of the individual author(s) and contributor(s) and not of MDPI and/or the editor(s). MDPI and/or the editor(s) disclaim responsibility for any injury to people or property resulting from any ideas, methods, instructions or products referred to in the content. |
© 2025 by the authors. Licensee MDPI, Basel, Switzerland. This article is an open access article distributed under the terms and conditions of the Creative Commons Attribution (CC BY) license (https://creativecommons.org/licenses/by/4.0/).