Abstract
The growing awareness of the health advantages offered by forests has underscored the significance of forest exposure as an upstream preventive measure against disease. While numerous studies have confirmed the physical and mental health benefits associated with forests, there is still a lack of quantitative understanding regarding the relationship between forest exposure and physiological health benefits (PHB). Particularly, there is insufficient knowledge about the threshold effects derived from short-term forest exposure. In this study, we propose a PHB threshold model for assessing forest exposure that introduces the concepts of efficiency threshold and benefits threshold. A pilot study was conducted in three typical natural forest sites to validate the proposed model. Electroencephalogram (EEG) was continuously measured as the physiological indicator, while meteorological, environmental, and demographic factors were simultaneously collected. The results show that: (1) the proposed PHB threshold model is applicable in a natural forest environment; (2) despite the longer time required to reach the PHB thresholds, forest exposure yielded more significant and prolonged health benefits compared to urban green spaces; (3) meteorological factors, such as temperature and relative humidity, play a crucial role in impacting the PHB threshold model; and (4) exposure to forests is better for deep thinking and relaxation than urban green spaces. These findings emphasize the potential of forests to offer a respite from the stresses of modern life and promote holistic well-being.
1. Introduction
Exposure to natural environments, particularly forests, has been extensively researched and shown to offer numerous health benefits [1,2,3,4]. Research suggests that being in forest settings can effectively prevent the occurrence of stress and stress-related diseases [4,5,6,7], which is crucial considering the adverse impact of chronic stress on physical and mental well-being. In addition to stress reduction, forest exposure has been associated with a reduced risk of various diseases and overall mortality in the population [8]. Spending time in forests has been found to regulate blood pressure and alleviate psychological disorders like anxiety and depression [1]. Immersion in forests has also been associated with improved immunity, enhanced sleep quality, and better memory [9]. Some scholars have conducted research on the impact of forest environments on the health of forest visitors, identifying the qualitative and quantitative chemical components of various types of forest air, and finding that the structure of terpenes may be responsible for the positive health effects of forests [10,11]. As a result, forest exposure is gaining recognition as an important way to promote social and human health, providing more effective preventive measures than dealing with the “downstream” health consequences of disease [12].
Several theoretical frameworks support the physiological health benefits (PHB) of forests. Attention Recovery Theory [13], Stress Recovery Theory [14], and Biophilia Hypothesis have all confirmed the positive effects of forests on human physiological health. These healing effects of forest environments have been applied to promote public health and address health inequalities [4,15]. To further explore the underlying mechanisms and potential interventions to maximize the health benefits of forest exposure, an increasing amount of research has begun to focus on quantifying the relationship between forest exposure and PHB. Dose-response assessment quantitatively reflects the probability and extent of human health effects based on specific levels and conditions of natural exposure [3,10,14,15]. Research has indicated that the dose-response curve for the health benefits of forest exposure may not follow a linear pattern [16]. Threshold effects and diminishing marginal returns have also been observed [3,17].
Despite the potential advantages of the dose-response framework, it is less explicitly used in the context of the nature-PHB linkages [4,16]. Limited studies have focused on investigating the relationship between urban green space exposure and its effects on human health, and these studies have shown that nature exposure can enhance both physical and mental well-being within a short timeframe [17,18]. For instance, Kondo et al. [19] found that emotional changes in response to urban green space were more significant within 10 min compared to within 30 min, indicating that the relationship between exposure to green spaces and emotional changes may be temporary. Another study by Yao et al. [12] proposed a PHB threshold model and found that the desired thresholds for urban green space exposure can be attained within a short period of time. However, it remained unclear whether exposure to forests can achieve the same threshold of effects as compared to artificial green infrastructure. In today’s fast-paced modern lifestyle, people have limited opportunities and time to connect with forests, which further emphasizes the importance of gaining a deeper understanding of this issue to fully comprehend and harness the therapeutic benefits of forests.
To effectively track the short-term effects of forest exposure on physical health, it is crucial to select appropriate PHB indicators for real-time monitoring. Several studies [20,21] have suggested that indicators such as brainwaves, heart rate, blood pressure, and salivary gland secretion can provide valuable insights into the immediate physiological responses related to nature exposure. Moreover, it is important to consider factors that may influence the dose-response relationship and thresholds. Population-level studies indicate that demographic factors including age, gender, and frequency of nature exposure play significant roles in determining the PHB associated with nature exposure [12,17,22]. Furthermore, field studies have highlighted the significance of meteorological factors such as temperature, humidity, and wind speed in influencing the physiological responses to nature exposure [16]. Therefore, it is crucial to consider these demographic and meteorological factors when analyzing the effects of forest exposure on physical health.
In this study, we drew upon the PHB threshold model proposed by Yao et al. [12] and utilized a combination of “efficiency threshold” and “benefit threshold” along with calculations of AUCg (the area under the curve of the ground) and AUCi (area under the curve of increase), to construct a physiological health threshold model for forest exposure. We selected participants as subjects and monitored their electroencephalogram (EEG) data and simultaneously recorded various external factors in forests to investigate the health effects on individuals or groups exposed to real natural forest environments [23]. Through the pilot study conducted in three representative forest sites, we hope to explore the following scientific questions: (1) Is the constructed PHB model for forest exposure feasible? Are there thresholds for forest exposure? (2) Will the threshold model be influenced by demographic, environmental, and/or meteorological factors? (3) Are there any differences between the thresholds observed in forests and those in urban green spaces? By conducting this study, we can not only enhance and expand the theoretical knowledge regarding nature exposure and its associated health benefits but also develop more specific and comprehensive approaches for planning and maintaining forests.
2. Materials and Methods
2.1. Physiological Health Benefit Threshold Model
The threshold model for quantifiable PHB of forest exposure was constructed, taking inspiration from the urban green space threshold model proposed by Yao et al. [12] (Figure 1). The structural framework of the model is as follows: (1) First, the exposure time in the forests is plotted on the X-axis, while physiological index data such as EEG, heart rate, blood pressure, skin temperature, and heart rate variability are plotted on the Y-axis to construct a dose-response curve. (2) To capture the various shapes of the curves, functional models such as growth/decline stable, U-shaped, or inverted U-shaped are utilized for curve fitting. (3) The efficiency threshold and benefit threshold are determined using the law of diminishing marginal interest. These thresholds help identify the point at which maximum efficiency and benefits are achieved. (4) AUCg and AUCi are calculated based on the trapezoid rule. These AUC metrics have been applied in studies investigating the relationship between nature exposure and health [10,19]. It is important to note that our study focused primarily on short-term PHB of forest exposure. Studies that require long-term testing were not considered.
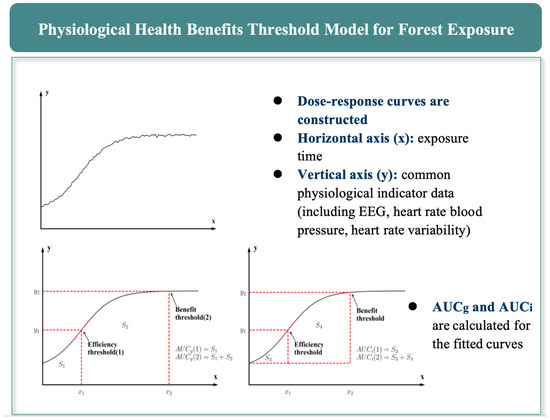
Figure 1.
Conceptual diagram of the PHB threshold model (using a growth-stabilization curve type as an example): (1) the initial dose-response curve; calculation of the efficiency threshold and benefit threshold after curve fitting; (2) calculation of AUCg and calculation of AUCi.
2.2. Definitions and Calculations of Thresholds and AUC
In the proposed PHB threshold model, the concepts of efficiency threshold and benefit threshold have been employed to determine how forest exposure can lead to the fastest and greatest health benefits, taking into account diminishing marginal benefits. Assuming a continuously differentiable function y = f(x) represents that the relationship between exposure time and PHB (Figure 1), as x increases, the y value initially either increases or decreases. However, at a certain point, the slope of the curve gradually decreases. This point is defined as the efficiency threshold, where the benefit growth is maximized. As x continues to increase beyond the efficiency threshold, it eventually reaches a specific point where the slope of the curve gradually decreases to zero. This point is known as the benefit threshold, indicating that the PHB has reached its maximum (or minimum) value or has stabilized (Figure 1). After reaching the benefit threshold point, the benefit will either stabilize or decrease with long-term exposure.
The concepts of AUCg and AUCi were introduced by Pruessner et al. They are based on the commonly used concept of AUC, which is a method to evaluate dose-response relationships. In recent years, AUCg and AUCi have been applied in studies investigating the relationship between nature exposure and health benefits [12,21]. To calculate AUCg and AUCi, the integration method based on the trapezoidal rule can be used (Figure 1). For a continuously differentiable function f(x) on the interval [a, b], the calculation of AUCg can be expressed using the following formula:
Similarly, AUCi can be calculated using the following formula:
where, f(x) represents the value of the physiological indicator of the fitted curve at x, and dx is a smaller horizontal length. It is important to note that the overall trend of the curve after forest exposure may increase or decrease. Therefore, when calculating AUCi, it is necessary to determine the values of f(a) and f(b) accordingly.
2.3. Case Studies
To validate the proposed PHB model for forests, a pilot study was conducted in Jingning County (longitude 119°41′45″ E, latitude 27°53′53″ N) in China. Three representative forest sites were selected: Caoyutang, Daji, and Meiqi. Given the high proportion of forested land and diversity of tree species found at the three proposed test sites, these sites exhibit significant ecological diversity. They provide the ideal habitat for firs, cypress trees and a variety of other plants to grow, creating a lush, healthy forest environment. Therefore, these sites were chosen for the experiment (Table S1). The selection of these sites ensures that they have typical characteristics of natural forests and demonstrate effective restoration results. To evaluate this, several measures were taken, including the perception recovery scale (PRS), green vision rate (GVI), and sky proportion (Text S1, Table S2). The experiment was carried out over four days, specifically during late autumn, from 13 November to 16 November 2023. The time frame for conducting the experiment was set from 8:30 a.m. to 5:30 p.m.
The experimental design aimed to investigate the difference between open-eye (OE) and closed-eye (BF) conditions to verify whether the established PHB threshold model is applicable to forest exposure. The experiment consisted of multiple trials, with each trial involving two participants—one from the OE group and one from the BF group. During the entire experiment, a total of 52 individuals completed the test, providing a diverse sample for analysis. Demographic information, such as age, gender, and other relevant factors, was collected for each participant.
2.3.1. Experimental Procedure
When developing the experimental procedure, we considered previous studies that have demonstrated that physiological health indicators can be measured within 5–10 min of exposure to green spaces [3,19]. To obtain a more accurate assessment of the physiological health threshold benefit, we set the experiment time to 20 min, with 16 min dedicated to forest exposure. The overall process involved the following steps (Figure 2): (1) participants filled in relevant personal information and questionnaires; (2) participants were provided Emotiv EPOC X EEG earphones (EMOTIV Inc., San Francisco, CA, USA); (3) participants were asked to complete a pressure test lasting 4 min; and (4) participants were exposed to the natural forest in a seated position for 16 min. The pressure tests required participants to perform complex mathematic calculations while loud music played. In the OE group, participants viewed the green space through a 1.2 m viewfinder to control variables and ensure consistent visual exposure. In the BF group, participants wore an eye mask (Figure 2). The whole process lasted approximately 40 min.
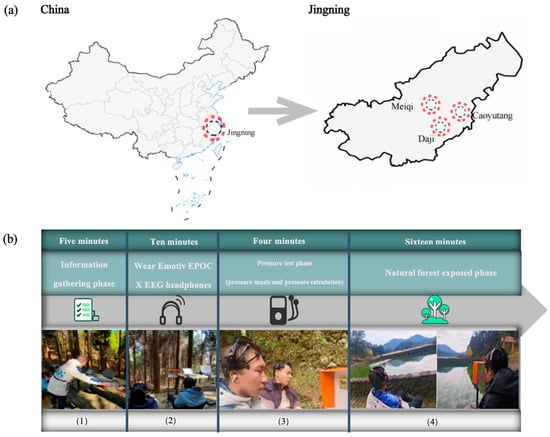
Figure 2.
Research area and experimental locations (a), and experimental procedure (b). And experimental procedure: (1) fill out personal information questions; (2) wear EEG headphones; (3) pressure test; and (4) two participants were exposed in the natural forest with eyes open or blindfolded.
2.3.2. Participants’ Basic Information and Meteorological Data Collection
A total of 52 participants, including 20 women and 32 men, took part in the experiment. The age of the participants ranged from 18–56 years. The participants included tourists, forestry staff, and volunteers recruited in advance within the university. All participants confirmed that they had no history of physical or mental disorders. Prior to the experiment, the details and purpose of the experiment were thoroughly explained to the participants, and their informed consent was obtained. This ensured that they were fully aware of the experimental procedures, potential risks, and their rights as participants. Throughout the course of the experiment, we strictly adhered to the ethical standards set by the China Science Ethics Committee, as well as the relevant guidelines outlined in the 1964 Declaration of Helsinki and its subsequent amendments. These ethical standards ensure the protection of participants’ rights, privacy, and well-being during any scientific research involving human subjects.
The information questionnaire for the participants was mainly divided into four parts (Text S2): (1) data collection of perceptual recovery scale (Table S2); (2) World Health Organization Well-being Index data collection (WHO-5 questionnaire) (Table S3); (3) demographic data collection (including gender, age, BMI, occupation and other personal information) (Table S4); and personal data surveys (frequency of exposure to forests, alcohol or tobacco use, etc.) (Table S4).
The meteorological data were collected using DJ-509 automatic microclimate measurement system (Dianjiang Tech. Co., Ltd., Shanghai, China). The recorded meteorological factors include air temperature (Ta), relative humidity (RH), wind speed (Ws), atmospheric pressure (AP), and light intensity (L) (see Text S3 and Table S5 for details). Measurements were taken at a height of 1.2 m from ground level and recorded at one-minute intervals. This approach ensures that the collected data reflects the microclimate in which human exposure occurs.
2.3.3. EEG Data Collection and Pre-Processing
In this study, EEG was used as the physiological index to evaluate individuals’ short-term response to forest exposure. The EEG data was measured using a non-invasive Emotiv EPOC X EEG headset (EMOTIV Inc., San Francisco, CA, USA). With 14 channels aligned with the international 10–20 position system, the device is able to accurately record brain response data at a sampling frequency of 128 Hz. The recorded data are transmitted wirelessly to the associated computer. The reliability and accuracy of the headset have been demonstrated in previous studies [20,24]. To minimize potential external factors that could influence brain waves during EEG measurement, participants were instructed to maintain stillness and remain quiet throughout the experiment.
We used the EEGLAB toolbox in MATLAB R2022b to process the original EEG data. The entire process includes electrode positioning, removal of unwanted electrodes, re-reference, filtering, independent component analysis (ICA) artifact removal. The processed data are converted into a spectrum for subsequent analysis using discrete Fourier Transform. Based on frequency band information, spontaneous EEG activity can be divided into different frequency bands.
In this study, several representative EEG indexes were selected as physiological health indicators (Text S4): (1) relative α, β and θ index, (2) β/α index, and (3) relative (α + θ) index. Higher relative α index indicates relaxation, while elevated relative β indices are associated with stressful situations, anxiety, or the need for concentration. Participants with a higher β/α index experienced greater levels of stress, whereas those with a lower β/α index tended to be more relaxed and calmer [25]. θ waves with higher amplitude are linked to physical recovery, repair, and emotional stability. Values of relative (α + θ) index are associated with rumination.
2.3.4. Data Analysis
Using MATLAB R2022b, the pretreated EEG data was divided into two stages: the pressure test stage (0–4 min) and the forest exposure stage (4–20 min). To improve accuracy, the data was further processed by fitting curves, with calculations performed every 30 s. Subsequently, a line chart was generated to analyze the preliminary change trends of each EEG index (Text S5).
A Generalized Logistic Function was utilized to fit the curves. The fitting process was achieved using the minimize function from the optimize module of Python’s scipy package (Python-3.11). This involved iterative optimization to minimize the difference between the values predicted by the fitting function and the actual data (Table S6). The fitting process was controlled by setting tolerance levels and the maximum number of iterations, resulting in improved curve fitting and facilitating the quantification of dose-response relationships. Moreover, multivariate analysis of variance (MANOVA) was employed to explore the significant correlation between AUCg and AUCi in different groups. Additionally, the Spearman correlation method was utilized to investigate the factors influencing the PHB threshold model of forest exposure (Text S6).
In the process of multiple linear regression analysis, estimation models were constructed considering environmental factors such as temperature and wind speed, as well as demographic factors such as gender and age, multiple regression. To prevent the model from becoming too complex and potentially overfitting, variable screening was performed before establishing the regression estimation model. Variable screening involved several steps. Firstly, a random forest regression was conducted on all variables, aiming to identify the top 8 variables with the highest importance. Subsequently, a collinearity test was performed on these variables to eliminate any variables with variance inflation factor (VIF) values greater than 5. Finally, the initially screened variables were included in the full subset regression for final screening [26]. To assess the contribution of each selected variable and obtain the adjusted estimation model R2 (to account for the influence of the variable count on R2), variance decomposition was carried out. For this purpose, the “randomForest” and “MuMin” packages of R-4.1.3 software were utilized for random forest regression and full subset regression, respectively. Additionally, the “rdacca. hp” package of R-4.1.3 software was employed for conducting the variance decomposition [27].
3. Results
3.1. Thresholds and AUC of PHB of Different Indices
In both the OE (open-eyed) group and the BF (blindfolded) group, nearly all of the selected EEG indexes showed a positive effect when participants were exposed to a natural forest environment. This finding suggests that being in a forest setting helped improve participants’ overall psychological and physiological well-being, leading to a state of relaxation and deep thinking. However, it is worth noting that the relative α index and relative (α + θ) index of the BF group showed a negative effect (Figure 3b,h). The negative effects can be attributed to the fear and anxiety experienced by blindfolded participants in the natural forest [28]. The heightened state of alertness and apprehension experienced by blindfolded participants in the BF group may have hindered their ability to fully relax and benefit from the calming and restorative qualities of the forest. This could have impeded their capacity to achieve a state of deep thinking and fully immerse themselves in the experience. This is in contrast to the participants in the OE group who had visual access to the forest surroundings and did not experience the same level of fear and anxiety.
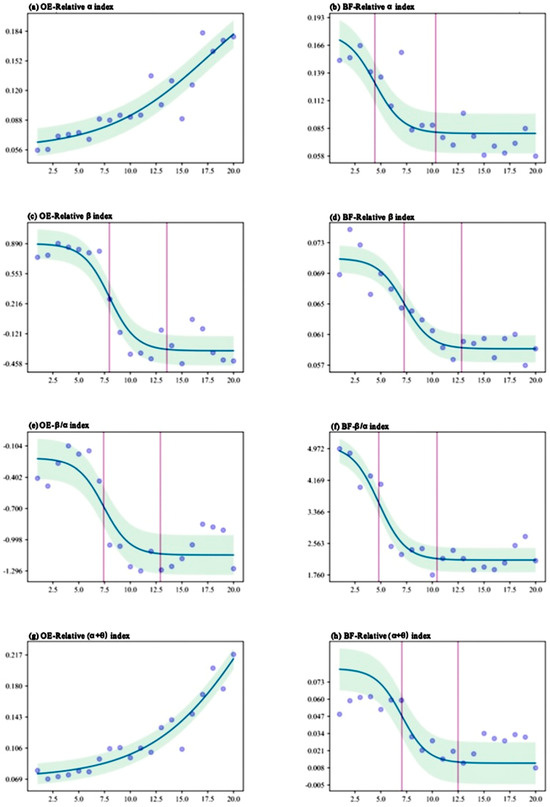
Figure 3.
The shape of the curve after fitting (the first vertical line represents the efficiency threshold, and the second vertical line represents the benefit threshold).
The results of the curve-fitting analysis showed that in the OE group, the efficiency threshold was observed around the 3rd minute, while the benefit threshold appeared between the 8th and 9th minute. In contrast, in the BF group, the efficiency threshold occurred within the first 1–3 min, and the benefit threshold was observed between the 6th and 8th minutes (Figure 3). Additionally, we conducted a comparison of AUCg and AUCi, and examined the disparities between the OE group and the BF group regarding forest exposure. The findings provide compelling evidence revealing a substantial difference: the AUCg of the OE group was 61% higher than that of the BF group, while the AUCi value for the OE group was found to be an impressive 6.7 times greater than that of the BF group. This significant difference indicates that visual perception plays a vital role in delivering health benefits through forests. Interestingly, during the exposure experiment, the relative α index and relative (α + θ) index of the OE group showed a positive effect, while no thresholds were observed (Figure 3a,g). This result suggests that in cold seasons, entering a state of relaxation, deep thinking, or meditation may require a longer exposure time to reach optimal efficiency and maximize the associated benefits.
3.2. Factors Affecting the Threshold Model of PHB
Overall, meteorological factors have a significant impact on the PHB threshold model of natural forest exposure (refer to Figure 4 and Table S7 for details). It can be observed that temperature (Ta), wind speed (Ws), and light intensity (L) are generally positively correlated with multiple indicators of relative β index, while they are negatively correlated with multiple indicators of relative α index and the β/α index, showing significant correlations. On the other hand, relative humidity (RH) and air pressure (AP) are mainly negatively correlated with multiple indicators of relative β index and positively correlated with multiple indicators of relative α index, the β/α index, and the correlation are also significant.
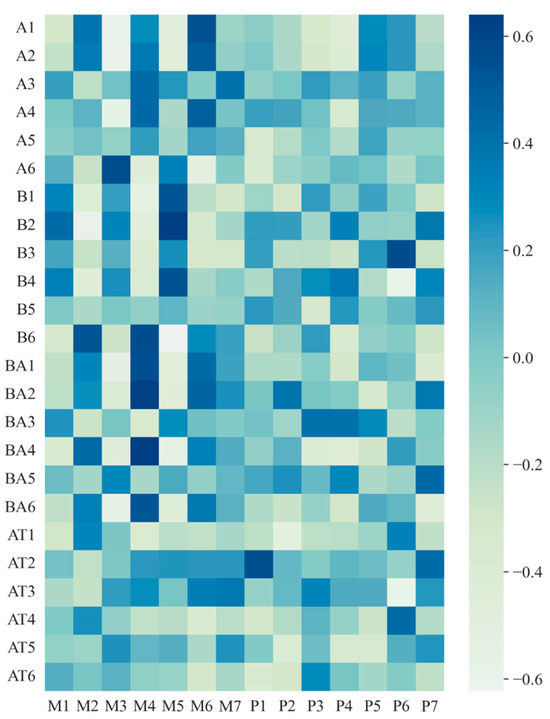
Figure 4.
Heat map of Spearman correlation analysis of factors influencing the physiological health effect threshold model. Physiological indicators: A: relative α index; B: relative β index; BA: β/α index; AT: relative (α + θ) index; 1: AUCg; 2: AUCi; 3: efficiency threshold (x); 4: efficiency threshold (y); 5: benefit threshold (x); 6: benefit threshold (y). Participants’ basic information: Pl: age; P2: BMI; P3: major; P4: green space exposure frequency; P5: WHO-5 scores; P6: whether they smoke or not; P7: whether they drink. Meteorological data: M1: Ta; M2: RH; M3: Ws; M4: AP; M5: L; M6: oxygen concentration; M7: carbon dioxide index.
4. Discussion
4.1. Significance of PHB Threshold Model in Forest Exposure
Nature exposure is a multidisciplinary field that combines ecology and population health. Threshold models, such as the PHB threshold model, have been widely recognized and utilized to address various issues related to urban ecology, healthcare, and climate change [29,30]. In the context of forest exposure, it is important and meaningful to introduce the PHB threshold model to quantify short-term health benefits. Previous studies conducted in urban green spaces have confirmed the presence of efficiency and benefit thresholds for obtaining physiological health benefits through exposure to these spaces [12]. Building upon existing models, this experiment specifically investigates forests as the target environment. Notably, for the first time, this study provides empirical evidence that confirms the applicability of the PHB threshold model in investigating forest exposure. The results obtained from this study provide valuable insights and guidance to enable individuals to make better use of forests and maximize the health benefits derived from such exposure. This research contributes significantly to the field by expanding our understanding of the relationship between forest exposure and human health, particularly in terms of physiological effects.
The PHB threshold model serves as a valuable tool for quantifying the intricate relationship between forest exposure and human health, providing a solid foundation for future research endeavors to delve deeper into this topic and broaden our theoretical understanding. Furthermore, studying the health benefits associated with forest exposure establishes a strong theoretical basis for exploring the practical implications of nature exposure on human health. Broadening the implementation of the PHB threshold model to encompass different types of forests characterized by diverse tree species composition, structural features, and aesthetic landscape values will prove invaluable in deepening our understanding of the benefits derived from forest exposure. This approach will provide significant insights into optimizing the effects of forest environments on human health and well-being.
4.2. Significance of Meteorological Factors in Impacting the PHB Threshold Model
The β/α index refers to the ratio between β wave activity (associated with active cognitive processing) and α wave activity (associated with relaxation and calmness) in the brain. It is considered the most appropriate measure among all EEG indicators for assessing a participant’s relaxed and calm state. Therefore, the β/α index was chosen as a proxy for PHB to further examine the contributions of various impacting factors to the threshold model of PHB. After conducting random forest regression analysis, a multiple linear regression analysis was performed on the top 8 variables obtained from the measured forest exposure data. These variables included meteorological factors such as Ta, RH, Ws, environmental factors such as CO2 concentration, as well as demographic factors like age and BMI. The results indicate that Ta, RH, Ws, AP, and CO2 concentration exhibit higher rates of explanation for both the efficiency and benefit thresholds. As for AUCg and AUCi, Ta, RH, AP, L, and CO2 concentrations show higher interpretation rates. This suggests that in forests, lower RH and AP, as well as higher Ta, Ws, and L, may lead to higher PHB of participants. However, it may also result in slower achievement of benefit and efficiency thresholds. In terms of demographic factors, age is inversely correlated with several physiological indicators, although the correlation is not significant. Occupation may be a factor influencing the PHB threshold model. Participants working in environmental protection-related professions and landscape architecture may require more time to reach the thresholds of the relative α index and the relative (α + θ) index, while the thresholds for efficiency and benefit may be relatively low. Overall, the findings suggest that meteorological factors play a dominant role in explaining the observed patterns, while environmental and demographic factors also contribute to some extent.
It is important to highlight that the selected variables in this study accounted for only 57.9%, 60.3%, 55.7%, and 65.3% of the total variance in the efficiency threshold, benefit threshold, AUCg, and AUCi, respectively (Figure 5). The remaining unexplained variance, approximately 40%, suggests the existence of other factors that could potentially impact the PHB model. These factors, such as landscape aesthetics, atmospheric volatile organic compounds (VOCs) concentration, and air pollution, were not measured in this research but should be taken into account in future studies [31,32,33]. By considering these additional variables, a more comprehensive understanding of PHB of forest exposure can be achieved. Studying the impact of meteorological factors on the PHB threshold model can provide valuable insights for forest managers and policy makers, enabling them to adapt their approaches to forest management accordingly. This knowledge can guide the implementation of appropriate measures, such as reforestation efforts, adjusting harvesting practices, or implementing conservation strategies that account for the specific meteorological conditions of a region. Consequently, this will lead to more effective decision-making processes aimed at maintaining and improving the health and resilience of forests.
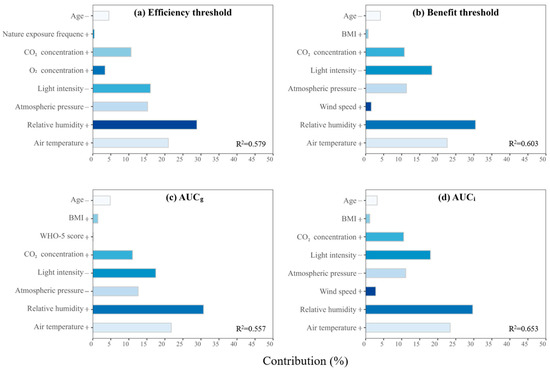
Figure 5.
The contribution of each variable to the efficiency threshold (a), benefit threshold (b), AUCg (c), and AUCi (d) of the PHB model. R2 represents the total explanation rate of all variables to the dependent variable, “+” means positive correlation, “−” means negative correlation.
4.3. Comparison of PHB between Exposure to Forests and Green Spaces
This study found that there are efficiency and benefit thresholds for PHB model associated with forest exposure, similar to what has been observed in urban green spaces [10]. In the BF group, the PHB model used in forests allows for faster attainment of both the efficiency and benefit thresholds compared to urban green spaces. This discrepancy can be attributed to the fact that the BF group relied solely on auditory information and was unable to visually perceive the benefits of forests and urban green spaces. The noise levels in urban environments are generally higher than in forests, which may hinder the closed-eye group from reaching the efficiency and benefit thresholds within the required time and depth. However, in the natural forest environment, natural sounds such as the wind, flowing water, and birds chirping can facilitate faster achievement of health thresholds [34].
Conversely, in the OE group, it took longer to reach the efficiency and benefit thresholds for forest exposure compared to urban green space exposure (Table 1). This can be explained by the fact that the OE group experienced a broader and more consistent forest landscape in forests, while the urban green space was smaller in size and stood out amidst the gray cityscape, potentially stimulating the participants to reach the thresholds at a faster pace [35].

Table 1.
Comparison of efficiency threshold and benefit threshold between natural forest and urban green space.
Despite the longer time required to reach the thresholds, the OE group’s experience in the natural forest yielded more significant and prolonged health benefits (Figure 3). The AUCg and AUCi values of the OE group exposed to the natural forest were higher than those exposed to urban green spaces [36]. This suggests that the slower pace of reaching the thresholds for forest exposure was compensated by the enhanced quality of the health benefits received. The extended duration and superior health effects can be attributed to the participants experiencing a wider and more consistent forest landscape compared to the urban green spaces. The natural forest setting allowed for a deeper and more profound engagement with nature, ultimately leading to greater physiological well-being [37]. Furthermore, during the experiment, the relative (α + θ) index of the OE group increased in the natural forest while it decreased in the urban green space. This opposing effect indicates that the noisy and cluttered environment of urban green spaces is not conducive to people concentrating and entering a state of deep contemplation, such as meditation [34].
Overall, we can conclude that individuals can obtain more PHB in natural forest environments compared to urban green spaces. This finding serves as a valuable reference for future construction and management of urban green spaces with the aim of enhancing their health benefits. When developing urban green spaces, it is important to prioritize nature-based solutions to create landscapes that resemble forests. Maintaining a large area, providing a wider green field of view, and ensuring effective noise reduction are crucial factors to enhance the physiological health benefits of urban green spaces.
4.4. Limitations
This study has certain limitations that should be addressed: (1) The experiment’s test duration was limited, resulting in irregular curve shapes in the collected EEG data during fitting. Consequently, it becomes challenging to determine the threshold point of certain individual EEG indicators using the established PHB threshold model. To overcome this limitation, it is essential to extend the duration of future tests for a more accurate determination of the threshold point. Additionally, increasing the diversity of physiological indicators considered will enhance the reliability and applicability of the findings. (2) This study did not account for the impact of different seasons on meteorological factors. To better understand the relationship between forest exposure and health benefits, long-term monitoring should be conducted, taking into account seasonal variations. This would provide valuable insights into the effect of changing weather conditions on individuals’ well-being. (3) The pilot study involved a small number of participants, consisting of 52 individuals from various backgrounds, including landscape architects, university faculty, students, and forest rangers. While the sample size is sufficient to support the experiment, future studies should aim to increase the sample size. Doing so will enhance the accuracy and generalizability of the model, allowing for more robust conclusions about the impact of green space exposure on health benefits. (4) The experiment would benefit from considering additional factors that may influence the health benefits of forests. By incorporating a broader range of variables, such as landscape aesthetics, air quality, environmental biodiversity, allergenic plant pollen and noise levels, researchers can gain a more comprehensive understanding of the multifaceted factors associated with the health benefits derived from natural environments [38,39].
5. Conclusions
We propose a physiological health benefits (PHB) threshold model for forest exposure. Through this pilot study, we utilized EEG data to confirm the applicability of the PHB model. The results demonstrate the crucial role meteorological factors play in affecting the PHB threshold model. Despite the longer time required to reach the PHB thresholds, forest exposure yields more significant and prolonged health benefits compared to urban green spaces. Overall, we can conclude that individuals can obtain more PHB in natural forest environments compared to urban green spaces.
This study provides valuable insights into quantifiable relationships between exposure to forests and physical health benefits. However, the PHB model of forest exposure is still in the preliminary stage and requires further consideration of impacting factors and additional physiological health indicators. The proposal of this model can enrich and improve the theoretical knowledge of nature exposure and related health effects. The conclusions of this model can provide practical suggestions for the public to conduct more targeted forest rehabilitation activities, and for policymakers to design more efficient forest management strategies.
Supplementary Materials
The following supporting information can be downloaded at: https://www.mdpi.com/article/10.3390/f15030555/s1, Text S1. The present situation of the experimental site is the site element. Text S2. Participant information collection. Text S3. Environmental meteorological factors information collection. Text S4. More representative EEG evaluation indexes were selected. Text S5. The preprocessing of original EEG data. Text S6. The process of fitting a curve. Table S1. Main tree species at the study site. Table S2. Descriptive statistics of Perceptual Recovery Scale (PRS) scores. Table S3. World Health Organization Five Physical and Mental Health Indicators (WHO-5). Table S4. Participant information collection. Table S5. Environmental meteorological factors information collection. Table S6. Parameters and residual standard error of the fitted fourth-order logistic function. Table S7. Spearman’s correlation analysis of the effect of covariates on changes in health indicators. References [25,40,41,42,43,44] are cited in the supplementary materials.
Author Contributions
B.Y.: Conceptualization, Methodology, Software, Data curation, Writing—Original draft; W.T.: Investigation, Formal analysis, Software; W.D.: Investigation, Visualization; D.M.: Investigation, Visualization; J.D.: Investigation; H.L.: Investigation; D.D.: Investigation; J.C.: Supervision, Validation; S.Z.: Software, Writing—Original Draft; Y.S.: Supervision, Validation; J.P.: Supervision, Validation; Y.R.: Conceptualization, Writing—review & editing, Methodology. All authors have read and agreed to the published version of the manuscript.
Funding
This work was supported by the National Natural Science Foundation of China (Grant No. 32101573), the Zhejiang Provincial Natural Science Foundation of China (Grant No. LQ20D050002) and the National Key Research and Development Program of China (Grant No. 2023YFF1304604).
Data Availability Statement
The data that support the findings of this study are available from the corresponding author upon reasonable request.
Acknowledgments
We would like to express our gratitude to L.J. Chen, M.F. Li, B. Wang, T.H. Zhou, Y.Y. Qiu, H. Peng, S.Q Shao, and H.C. Diao for their valuable contributions to the measurement and data collection efforts.
Conflicts of Interest
The authors declare no conflicts of interest.
References
- Park, B.J.; Tsunetsugu, Y.; Kasetani, T.; Kagawa, T.; Miyazaki, Y. The physiological effects of Shinrin-yoku (taking in the forest atmosphere or forest bathing): Evidence from field experiments in 24 forests across Japan. Environ. Health Prev. Med. 2010, 15, 18–26. [Google Scholar] [CrossRef]
- Bowler, D.E.; Buyung-Ali, L.M.; Knight, T.M.; Pullin, A.S. A systematic review of evidence for the added benefits to health of exposure to natural environments. BMC Public Health 2010, 10, 456. [Google Scholar] [CrossRef]
- Barton, J.; Griffin, M.; Pretty, J. Exercise-, nature- and socially interactive-based initiatives improve mood and self-esteem in the clinical population. Perspect. Public Health 2012, 132, 89–96. [Google Scholar] [CrossRef]
- Antonelli, M.; Barbieri, G.; Donelli, D. Effects of forest bathing (shinrin-yoku) on levels of cortisol as a stress biomarker: A systematic review and meta-analysis. Int. J. Biometeorol. 2019, 63, 1117–1134. [Google Scholar] [CrossRef] [PubMed]
- Song, L.; Huang, S.-S.C.; Wise, A.; Castanon, R.; Nery, J.R.; Chen, H.; Watanabe, M.; Thomas, J.; Bar-Joseph, Z.; Ecker, J.R. A transcription factor hierarchy defines an environmental stress response network. Science 2016, 354, aag1550. [Google Scholar] [CrossRef] [PubMed]
- Chen, H.-T.; Yu, C.-P.; Lee, H.-Y. The Effects of Forest Bathing on Stress Recovery: Evidence from Middle-Aged Females of Taiwan. Forests 2018, 9, 403. [Google Scholar] [CrossRef]
- Hedblom, M.; Gunnarsson, B.; Iravani, B.; Knez, I.; Schaefer, M.; Thorsson, P.; Lundström, J.N. Reduction of physiological stress by urban green space in a multisensory virtual experiment. Sci. Rep. 2019, 9, 10113. [Google Scholar] [CrossRef] [PubMed]
- Kasdagli, M.-I.; Katsouyanni, K.; Dimakopoulou, K.; Samoli, E. Air pollution and Parkinson’s disease: A systematic review and meta-analysis up to 2018. Int. J. Hyg. Environ. Health 2019, 222, 402–409. [Google Scholar] [CrossRef] [PubMed]
- Richardson, M.; Dobson, J.; Abson, D.J.; Lumber, R.; Hunt, A.; Young, R.; Moorhouse, B. Applying the pathways to nature connectedness at a societal scale: A leverage points perspective. Ecosyst. People 2020, 16, 387–401. [Google Scholar] [CrossRef]
- Antonelli, M.; Donelli, D.; Barbieri, G.; Valussi, M.; Maggini, V.; Firenzuoli, F. Forest Volatile Organic Compounds and Their Effects on Human Health: A State-of-the-Art Review. Int. J. Environ. Res. Public Health 2020, 17, 6506. [Google Scholar] [CrossRef]
- Salehi, B.; Upadhyay, S.; Orhan, I.E.; Jugran, A.K.; Jayaweera, S.L.; Dias, D.A.; Sharopov, F.; Taheri, Y.; Martins, N.; Baghalpour, N.; et al. Therapeutic Potential of α- and β-Pinene: A Miracle Gift of Nature. Biomolecules 2019, 9, 738. [Google Scholar] [CrossRef]
- Yao, X.; Yu, Z.; Ma, W.; Xiong, J.; Yang, G. Quantifying threshold effects of physiological health benefits in greenspace exposure. Landsc. Urban Plan. 2024, 241, 104917. [Google Scholar] [CrossRef]
- Kaplan, R.; Kaplan, S. The Experience of Nature: A Psychological Perspective; Cambridge University Press: New York, NY, USA, 1989. [Google Scholar]
- Ulrich, R.S.; Simons, R.F.; Losito, B.D.; Fiorito, E.; Miles, M.A.; Zelson, M. Stress recovery during exposure to natural and urban environments. J. Environ. Psychol. 1991, 11, 201–230. [Google Scholar] [CrossRef]
- Lanki, T.; Siponen, T.; Ojala, A.; Korpela, K.; Pennanen, A.; Tiittanen, P.; Tsunetsugu, Y.; Kagawa, T.; Tyrväinen, L. Acute effects of visits to urban green environments on cardiovascular physiology in women: A field experiment. Environ. Res. 2017, 159, 176–185. [Google Scholar] [CrossRef] [PubMed]
- Shanahan, D.F.; Bush, R.; Gaston, K.J.; Lin, B.B.; Dean, J.; Barber, E.; Fuller, R.A. Health Benefits from Nature Experiences Depend on Dose. Sci. Rep. 2016, 6, 28551. [Google Scholar] [CrossRef]
- Hartig, T.; Mitchell, R.; de Vries, S.; Frumkin, H. Nature and Health. Annu. Rev. Public Health 2014, 35, 207–228. [Google Scholar] [CrossRef]
- Mao, Y.; He, Y.; Xia, T.; Xu, H.; Zhou, S.; Zhang, J. Examining the Dose–Response Relationship between Outdoor Jogging and Physical Health of Youths: A Long-Term Experimental Study in Campus Green Space. Int. J. Environ. Res. Public Health 2022, 19, 5648. [Google Scholar] [CrossRef] [PubMed]
- Kondo, M.C.; Oyekanmi, K.O.; Gibson, A.; South, E.C.; Bocarro, J.; Hipp, J.A. Nature prescriptions for health: A review of evidence and research opportunities. Int. J. Environ. Res. Public Health 2020, 17, 4213. [Google Scholar] [CrossRef]
- Lin, W.; Chen, Q.; Jiang, M.; Zhang, X.; Liu, Z.; Tao, J.; Wu, L.; Xu, S.; Kang, Y.; Zeng, Q. The effect of green space behaviour and per capita area in small urban green spaces on psychophysiological responses. Landsc. Urban Plan. 2019, 192, 103637. [Google Scholar] [CrossRef]
- Veitch, J.; Ball, K.; Rivera, E.; Loh, V.; Deforche, B.; Best, K.; Timperio, A. What entices older adults to parks? Identification of park features that encourage park visitation, physical activity, and social interaction. Landsc. Urban Plan. 2022, 217, 104254. [Google Scholar] [CrossRef]
- White, M.P.; Alcock, I.; Wheeler, B.W.; Depledge, M.H. Would You Be Happier Living in a Greener Urban Area? A Fixed-Effects Analysis of Panel Data. Psychol. Sci. 2013, 24, 920–928. [Google Scholar] [CrossRef]
- Barry, R.J.; De Blasio, F.M. EEG differences between eyes-closed and eyes-open resting remain in healthy ageing. Biol. Psychol. 2017, 129, 293–304. [Google Scholar] [CrossRef]
- Neale, C.; Aspinall, P.; Roe, J.; Tilley, S.; Mavros, P.; Cinderby, S.; Coyne, R.; Thin, N.; Bennett, G.; Thompson, C.W. The Aging Urban Brain: Analyzing Outdoor Physical Activity Using the Emotiv Affectiv Suite in Older People. J. Urban Health 2017, 94, 869–880. [Google Scholar] [CrossRef]
- Suh, Y.A.; Yim, M.-S. “High risk non-initiating insider” identification based on EEG analysis for enhancing nuclear security. Ann. Nucl. Energy 2018, 113, 308–318. [Google Scholar] [CrossRef]
- Cheshmehzangi, A.; Li, Y.; Li, H.; Zhang, S.; Huang, X.; Chen, X.; Su, Z.; Sedrez, M.; Dawodu, A. A hierarchical study for urban statistical indicators on the prevalence of COVID-19 in Chinese city clusters based on multiple linear regression (MLR) and polynomial best subset regression (PBSR) analysis. Sci. Rep. 2022, 12, 1964. [Google Scholar] [CrossRef]
- Lai, J.; Zou, Y.; Zhang, J.; Peres-Neto, P.R. Generalizing hierarchical and variation partitioning in multiple regression and canonical analyses using the rdacca.hp R package. Methods Ecol. Evol. 2022, 13, 782–788. [Google Scholar] [CrossRef]
- Chiang, Y.-C.; Nasar, J.L.; Ko, C.-C. Influence of visibility and situational threats on forest trail evaluations. Landsc. Urban Plan. 2014, 125, 166–173. [Google Scholar] [CrossRef]
- Hass, A.L.; Ellis, K.N. Using wearable sensors to assess how a heatwave affects individual heat exposure, perceptions, and adaption methods. Int. J. Biometeorol. 2019, 63, 1585–1595. [Google Scholar] [CrossRef] [PubMed]
- Lamarche, D.T.; Meade, R.D.; D’Souza, A.W.; Flouris, A.D.; Hardcastle, S.G.; Sigal, R.J.; Boulay, P.; Kenny, G.P. The recommended Threshold Limit Values for heat exposure fail to maintain body core temperature within safe limits in older working adults. J. Occup. Environ. Hyg. 2017, 14, 703–711. [Google Scholar] [CrossRef]
- Li, D.; Lee, C.; Park, A.H.; Lee, H.; Ding, Y. Contextual and environmental factors that influence health: A within-subjects field experiment protocol. Front. Public Health 2023, 11, 1019885. [Google Scholar] [CrossRef] [PubMed]
- Deng, L.; Li, X.; Luo, H.; Fu, E.-K.; Ma, J.; Sun, L.-X.; Huang, Z.; Cai, S.-Z.; Jia, Y. Empirical study of landscape types, landscape elements and landscape components of the urban park promoting physiological and psychological restoration. Urban For. Urban Green. 2020, 48, 126488. [Google Scholar] [CrossRef]
- Zeng, C.; Lin, W.; Li, N.; Wen, Y.; Wang, Y.; Jiang, W.; Zhang, J.; Zhong, H.; Chen, X.; Luo, W.; et al. Electroencephalography (EEG)-Based Neural Emotional Response to the Vegetation Density and Integrated Sound Environment in a Green Space. Forests 2021, 12, 1380. [Google Scholar] [CrossRef]
- Li, A.; Li, Q.; Zhou, B.; Ge, X.; Cao, Y. Temporal dynamics of negative air ion concentration and its relationship with environmental factors: Results from long-term on-site monitoring. Sci. Total Environ. 2022, 832, 155057. [Google Scholar] [CrossRef]
- Wu, J.; Zhong, Y.; Wang, Y.; Gong, C. Investigating the Relation between Visitor Attention and Visual Quality of Forest Landscape: A Mobile EEG Study. Forests 2022, 13, 1668. [Google Scholar] [CrossRef]
- Yu, Z.; Yang, G.; Lin, T.; Zhao, B.; Xu, Y.; Yao, X.; Ma, W.; Vejre, H.; Jiang, B. Exposure ecology drives a unified understanding of the nexus of (urban) natural ecosystem, ecological exposure, and health. Ecosyst. Health Sustain. 2024, 10, 0165. [Google Scholar] [CrossRef]
- Arnberger, A.; Eder, R.; Allex, B.; Ebenberger, M.; Hutter, H.-P.; Wallner, P.; Bauer, N.; Zaller, J.G.; Frank, T. Health-Related Effects of Short Stays at Mountain Meadows, a River and an Urban Site—Results from a Field Experiment. Int. J. Environ. Res. Public Health 2018, 15, 2647. [Google Scholar] [CrossRef] [PubMed]
- Hanski, I.; von Hertzen, L.; Fyhrquist, N.; Koskinen, K.; Torppa, K.; Laatikainen, T.; Karisola, P.; Auvinen, P.; Paulin, L.; Mäkelä, M.J.; et al. Environmental biodiversity, human microbiota, and allergy are interrelated. Proc. Natl. Acad. Sci. USA 2012, 109, 8334–8339. [Google Scholar] [CrossRef]
- Dudek, T.; Kasprzyk, I.; Dulska-Jeż, A. Forest as a place for recreation but also the source of allergenic plant pollen: To come or avoid? Eur. J. For. Res. 2018, 137, 849–862. [Google Scholar] [CrossRef]
- Hartig, T.; Kaiser, F.G.; Bowler, P.A. Further Development of a Measure of Perceived Environmental Restorativeness; Uppsala Universitet: Uppsala, Sweden, 1997. [Google Scholar]
- Zou, B.C.; Liu, Y.; Guo, M.; Wang, Y. EEG-Based Assessment of Stereoscopic 3D Visual Fatigue Caused by Vergence-Accommodation Conflict. J. Disp. Technol. 2015, 11, 1076–1083. [Google Scholar] [CrossRef]
- Hsu, B.W.; Wang, M.J. Evaluating the effectiveness of using electroencephalogram power indices to measure visualfatigue. Percept. Mot. Ski. 2013, 116, 235–252. [Google Scholar] [CrossRef] [PubMed]
- Kim, J.Y.; Kim, J.T.; Kim, W. Psycho-physiological responses of drivers to road section types and elapsed driving time on a freeway. Can. J. Civ. Eng. 2015, 42, 881–888. [Google Scholar] [CrossRef]
- Lagopoulos, J.; Xu, J.; Rasmussen, I.; Vik, A.; Malhi, G.S.; Eliassen, C.F.; Arntsen, I.E.; Sæther, J.G.; Hollup, S.; Holen, A.; et al. Increased theta and alpha EEG activity during nondirective meditation. J. Altern. Complement. Med. 2009, 15, 1187–1192. [Google Scholar] [CrossRef] [PubMed]
Disclaimer/Publisher’s Note: The statements, opinions and data contained in all publications are solely those of the individual author(s) and contributor(s) and not of MDPI and/or the editor(s). MDPI and/or the editor(s) disclaim responsibility for any injury to people or property resulting from any ideas, methods, instructions or products referred to in the content. |
© 2024 by the authors. Licensee MDPI, Basel, Switzerland. This article is an open access article distributed under the terms and conditions of the Creative Commons Attribution (CC BY) license (https://creativecommons.org/licenses/by/4.0/).