Article

A Multi-Scale Convolutional Neural Network Combined with a Portable Near-Infrared Spectrometer for the Rapid, Non-Destructive Identification of Wood Species

1
Research Institute of Wood Industry, Chinese Academy of Forestry, Beijing 100091, China
2
College of Material Science and Technology, Beijing Forestry University, Beijing 100083, China
*
Author to whom correspondence should be addressed.
Forests 2024, 15(3), 556; https://doi.org/10.3390/f15030556
Submission received: 8 February 2024 / Revised: 3 March 2024 / Accepted: 5 March 2024 / Published: 19 March 2024
(This article belongs to the Section Wood Science and Forest Products)

Abstract

:
The swift and non-destructive classification of wood species holds crucial significance for the utilization and trade of wood resources. Portable near-infrared (NIR) spectrometers have the potential for rapid and non-destructive wood species identification, and while several studies have explored related methodologies, further research on their practical application is needed. To address this research gap, this study proposes a multi-scale convolutional neural network (CNN) combined with a portable NIR spectrometer (wavelengths range: 908 to 1676 nm) for wood species identification. To enhance the capability of directly extracting robust features from NIR spectral data collected by a portable spectrometer, the Gramian angular field (GAF) method is introduced to transform 1-dimensional (1D) NIR spectral data into 2-dimensional (2D) data matrices. Furthermore, a multi-scale CNN model is utilized for direct feature extraction. The representation by 2D matrices, instead of 1D NIR spectral data, aligns with 2D convolutional operations and enables a more robust extraction of discriminative features. In the experimental phase, eight wood species were identified using the proposed method, alongside commonly used multivariate data analysis and machine learning (ML) methods. The StratifiedGroupKFold dataset partitioning approach and five-fold cross-validation were used. Additionally, nine spectral preprocessing methods were compared, and principal component analysis (PCA) was used for feature extraction in the ML method. Evaluation metrics, such as accuracy, precision, and recall, were adopted to assess the performance of the methods. The proposed multi-scale CNN model, in combination with 2D GAF matrices of the 1D spectral data, yielded the most accurate results with a mean accuracy of 97.34% in the five-fold validation. These findings present a new approach for the construction of a rapid, non-destructive, and automatic wood species identification method using a portable NIR spectrometer.

1. Introduction

Wood materials, recognized as crucial renewable resources, play a significant role in various sectors such as construction, furniture, and packaging [1]. The increasing activities related to the processing, utilization, and trading of wood raw materials and products have heightened the technological demand for the on-site, swift, and non-destructive identification of wood species [2]. However, traditional wood species identification relies on experienced professionals who assess samples based on their macroscopic and microscopic characteristics. This approach demands a significant time investment from experienced wood anatomists to prepare wood slices [3], and it frequently encounters challenges in the identification of wood samples at the species level [4]. The rapidly evolving field of computer-aided identification techniques has stimulated the exploration of non-destructive, on-site methods for the rapid identification of wood species, aiming to address the limitations of traditional identification method. The near-infrared (NIR) spectroscopy technique, characterized by minimal sample preparation, non-destructive detection, rapid operation, cost-effectiveness, and on-site deployability [5], stands out as an auxiliary technology for on-site wood species identification. However, the practical application of the portable NIR spectrometer requires further investigation.
Compared to other wood species identification techniques, NIR spectroscopy identification technology relies on modeling methods. The construction of an appropriate model is one of the key factors for the successful identification of wood species. The current methods for wood species identification based on NIR spectral data modeling can be classified into two categories, the first of which comprises multivariate data analysis methods. Partial least squares for discriminant analysis (PLS-DA) and principal component analysis (PCA) are the two most commonly used multivariate data analysis methods in the identification of wood species via NIR spectroscopy. NIR spectra modeled by PLS-DA have been reported to distinguish true mahogany wood from wood species exhibiting similar features under varying sample conditions [6,7,8,9]. This approach has also been used to successfully classify seven Dalbergia species [10], identify six endangered species in Amazon tropical forests [11], and differentiate the origin of wood samples [12]. NIR spectroscopy coupled with PCA has been reported to classify softwood and hardwood samples from ancient wooden statues [13] and identify five softwood species [14]. However, multivariate data analysis methods comprise linear models. These methods, which are based on linear assumptions, lack sufficient flexibility, making it difficult to adapt to complex data structures or nonlinear relationships. For example, the anisotropy of wood and its intricate industrial setting pose challenges to the effectiveness of these methods.
Methods belonging to the second category involve the utilization of machine learning (ML) modeling. ML methods involve the introduction of a nonlinear model to fit the NIR spectral data of different wood species, and include the support vector machine (SVM), k-nearest neighbors (KNN), and random forest (RF) models. In a study of twelve types of wood identified by NIR spectroscopy combined with three nonlinear and two linear ML modeling methods, Luo et al. reported that the nonlinear models were more effective than the linear models [15]. However, optimal feature engineering is necessary for ML classifiers. The features extracted by the designed feature engineering may not be optimal for the identification of unknown samples, possibly leading to constrained generalization capabilities. Moreover, the separation of the classifier selection process from the feature extraction process renders the classifier sensitive to specific features, potentially causing instability in the identification accuracy during practical applications.
Deep learning (DL) is a branch of ML. The rapidly developing DL technique overcomes certain disadvantages of ML classifiers and provides an advanced method for the direct extraction of features from high-dimensional data [16]. Convolutional neural networks (CNNs), which are excellent algorithms used in DL approaches, are renowned for their capability to enhance performance in image (two-dimensional (2D) data) classification [17]. This method has also been introduced into NIR spectroscopy modeling [18]; to match NIR spectral data (one-dimensional (1D) data), a 1D convolutional kernel is used in the model, and the result is called the 1D CNN model. In the investigations of Yang et al. [1] and Pan et al. [19], the integration of 1D CNN with NIR spectra resulted in the more successful identification of wood species as compared to conventional NIR spectral modeling methods. While encouraging results were reported, it is crucial to note that laboratory analytical spectrometers were used in these studies.
The portable NIR spectrometer provides numerous benefits for on-site analysis, with advantages including a compact size, affordability, ease of analysis, a user-friendly sample interface, and portability [20]. Some studies have investigated the feasibility of the combination of the portable NIR spectrometer with multivariate data analysis methods for wood species identification [8,9,21,22]. However, no study has reported the use of a portable NIR spectrometer combined with DL methods for the same purpose. The reason for this may be that, compared to laboratory analytical spectrometers, portable instruments commonly have shorter wavelengths and lower resolution. Therefore, the 1D convolution operation of the CNN model cannot directly extract robust features from short-wavelength NIR spectral data with the same effectiveness as the data obtained by laboratory analytical spectrometers.
Numerous studies have proven that the CNN method can achieve state-of-the-art performance for the extraction of features from 2D data. Inspired by the high performance of the CNN in 2D image data classification, the transformation of shorter 1D NIR spectral data to 2D data may enhance the ability of the CNN model to extract robust features from shorter-wavelength NIR spectral data. Therefore, this study introduces the Gramian angular field (GAF) method [23] to encode 1D short-wavelength NIR spectral data as 2D matrices, and these 2D matrices are then combined with a multi-scale CNN model for wood species identification to bridge the existing research gap. Eight species from five genera of Fabaceae were used in this study to evaluate the efficacy of the proposed method. Among these species, Dalbergia balansae, Dalbergia obtusifolia, and Dalbergia szemaoeasis are identified as excellent host tree species for lac insects, capable of producing shellac, thus holding considerable economic value, leading to cultivation in southern China. Additionally, the wood derived from these three species is of superior quality and is highly regarded for furniture and handicraft production. However, unlike the other species, untreated wood from Dalbergia balansae is prone to insect infestation and necessitates insecticide treatment prior to utilization. Both Dalbergia balansae and Dalbergia szemaoeasis are categorized as endangered species and are listed in the Endangered category of the International Union for Conservation of Nature (IUCN) Red List. Maackia amurensis possesses beautiful grain patterns, ease of processing, and exceptional resistance to decay, rendering it an excellent material for architectural and fine furniture purposes, with export potential. Cladrastis delavayi and Cladrastis sinensis, commonly cultivated as roadside trees, offer wood suitable for construction. Erythrina stricta serves as an outstanding pioneering tree species, suitable for furniture making, art carving, and similar applications. Derris robusta also presents practical value. Consequently, these woods necessitate identification and classification in trade and processing utilization.
This research makes two important contributions. First, a multi-scale CNN model is created for combination with a portable NIR spectrometer for wood species identification. Second, the GAF method is introduced to convert low-resolution and short-wavelength NIR spectral data into 2D data. The aim is to improve the capability of the CNN model to extract features directly from the NIR spectral data, thereby enhancing wood species identification.

2. Materials and Methods

2.1. Sample Preparation and NIR Spectra Collection

Eight wood species within the Fabaceae family were used in the experiment conducted in this study. As listed in Table 1, all samples were assigned the species ID in the xylarium of Southwest Forestry University. Furthermore, 30 samples from each species were randomly selected, and it was ensured that they were without defects and from distinct trees. The average thickness, width, and length (longitudinal) sizes of these samples were 15, 80, and 150 mm, respectively. The NIR spectral data were obtained from two transverse sections of each sample, which were carefully sanded using grits 400, 800, and 1000, sequentially, to avoid surface oxidation before spectral data collection. As shown in Figure 1, a transverse section picture of the polished surface for Dalbergia szemaoeasis is presented.
The portable MicroNIR™ 1700 OnSite spectrometer (Viavi Solutions, Inc., Chandler, AZ, USA) was used for NIR spectral scan. This device has a wavelength range between 908 and 1676 nm with a resolution of ~12.5 nm and an interval between wavelengths of 6.2 nm, which allows for the acquisition of 125 wavelength bands for absorbance values in a spectrum. The spectrometer was held directly against the transverse section of the wood sample for spectral scanning in the experiment. A standard polytetrafluoroethylene whiteboard provided by the equipment manufacturer was used for instrument calibration. The spectrometer was recalibrated with the whiteboard after 30 min. Before conducting spectral measurements, consecutive numbers from 1 to 30 were assigned to each sample representing individual species. Spectra obtained from the same sample were treated as belonging to the same group, with the group number matching the assigned sample number. Four spectra were scanned from different points on each transverse section, and eight spectra were scanned for each wood specimen, resulting in a total of 240 spectra for each species.

2.2. 1D NIR Spectral Data to 2D Data Transformation

In the proposed method, the GAF method is used to convert 1D NIR spectral data into 2D data by mapping the NIR spectral data onto an angular coordinate system. As shown in Figure 2, given 1D NIR spectral data P = { p 1 , p 2 , p k p n } consisting of n wavelength bands, P is first scaled to the range of −1 to 1, or 0 to 1, to obtain P ¯ . Consequently, the normalized spectral data P ¯ are represented in an angular coordinate system by representing the values as the angular cosine ( φ ) and the wavelength bands as the radius ( r ). The φ and the r are calculated according to Equation (1):
φ = arccos P ¯ k , 1 P ¯ k 1 , P ¯ k P ¯ r = w k C ,
where w k is the spectral wavelength band value and C is a constant factor. Then, after the rescaled 1D NIR spectral data are transformed into the polar coordinate system, the NIR spectral correlation with the different wavelength bands can be identified by the trigonometric sum/difference between each point. The sum/difference calculations result in two different 2D NIR spectral Gramian matrices, respectively known as the Gramian summation angular field (GASF) and the Gramian difference angular field (GADF), which are respectively defined by Equations (2) and (3):
N I R G A S F = cos φ i + φ j = P ¯ T × P ¯ I P ¯ 2 T × I P ¯ 2 ,
N I R G A D F = sin φ i φ j = I P ¯ 2 T × P ¯ P ¯ × I P ¯ 2 ,
where I represents the row vector. Finally, two 2D data matrices representing different features of NIR spectral data in different modes are obtained by the transformation. The NIR GASF and GADF matrices have dimensions of n × n , where n corresponds to the number of wavelength bands in the provided NIR spectral data. Therefore, 1D NIR spectral data with dimensions of 1 × 125 are transmitted into two 2D data matrices with dimensions of 125 × 125 and one channel. To maximize the information in the data, the two 2D matrices are concatenated along channels to obtain data with dimensions of 125 × 125 and two channels (Figure 2). These data can be directly used as the inputs of the 2D CNN model when the input layer of the CNN model is modified to receive the data with two channels.

2.3. CNN Model Architectures

The convolutional operation of CNN methods involves the operation of the convolution kernel on a local region of the input data. Consequently, the 1D NIR spectra represented by GAF matrices could enhance the data alignment with the convolution operation, thus facilitating the extraction of more robust discriminative features. The extraction of features of different scales from 2D data is crucial for the classification capability of the model due to the consideration of the features expressed by the data matrix.
Therefore, to achieve better feature extraction and wood species identification, the two CNN model frameworks shown in Figure 3 are proposed and are respectively referred to as the NIR-Net and NIR-Inception models [24]. The Inception module can effectively capture multi-scale features by simultaneously employing convolutional kernels of different sizes (1 × 1, 3 × 3, 5 × 5) and pooling layers. Hence, the Inception block is introduced in the designed multi-scale CNN model framework to achieve better feature extraction. As illustrated in Figure 4, convolution kernels with sizes of 7 × 7, 9 × 9, and 11 × 11 are added to the base Inception block to effectively capture multi-scale features from the data. In the NIR-Net model, nine convolution layers are included. The first two layers have kernel sizes of 11 × 11 and 9 × 9 with a stride of one, respectively, and the other six layers have kernel sizes of 3 × 3 with a stride of one. A batch normalization layer is connected after the ninth layer, and two max-pooling layers with a pooling size of 3 × 3 and a stride of two are connected to the second and ninth layers. The third, fifth, and seventh layers of NIR-Net are replaced by the modified Inception module, resulting in the new NIR-Inception model. In both models, 64 filters are used in the first eight layers, and 128 filters are used in the ninth layer. A fully connected layer is employed in the model, the outputs of which are used for classification.

2.4. Dataset Partitioning and Model Evaluation

The StratifiedGroupKFold method was employed for the partitioning of the spectral dataset in this study. In contrast to the direct utilization of the K-fold partitioning method, the group number of samples (as described in Section 2.1) is also a parameter for the StratifiedGroupKFold method. The method aims to divide the dataset with the constraint of non-overlapping groups between divided parts and maintain the percentage of samples for each class to the greatest possible extent. Consequently, spectra from the same sample only appear in either the training or testing data in each training–testing process. This ensures that spectra from the same sample do not simultaneously appear in both the training and testing datasets. Five-fold cross-validation with the StratifiedGroupKFold partitioning method was applied in this experiment, and the average was considered the final result.
All modeling experiments were conducted using Python (version 3.9) with scikit-learn (version 1.2.2), Keras (version 2.6.0), and TensorFlow (version 2.6.0). Accuracy, precision, and recall serve as identification metrics for the proposed model and are respectively calculated using Equations (4)–(6):
A c c u r a c y = T P + T N T P + T N + F P + F N ,
P r e c i s i o n = T P T P + F P ,
R e c a l l = T P T P + F N ,
where TP represents true positives, TN represents true negatives, FP represents false positives, and FN represents false negatives.

3. Results and Discussion

The first segment of this section centers on assessing the effectiveness of NIR GAF matrices in conjunction with the proposed CNN model for wood species identification. The second segment involves the implementation of nine spectral preprocessing methods on the spectral data to determine an optimal choice for NIR spectra from a portable spectrometer within the proposed methodology. Finally, the comparative analysis of the proposed approach and two nonlinear ML methods is reported.

3.1. Efficacy of NIR GAF Matrices Combined with the CNN for Wood Species Identification

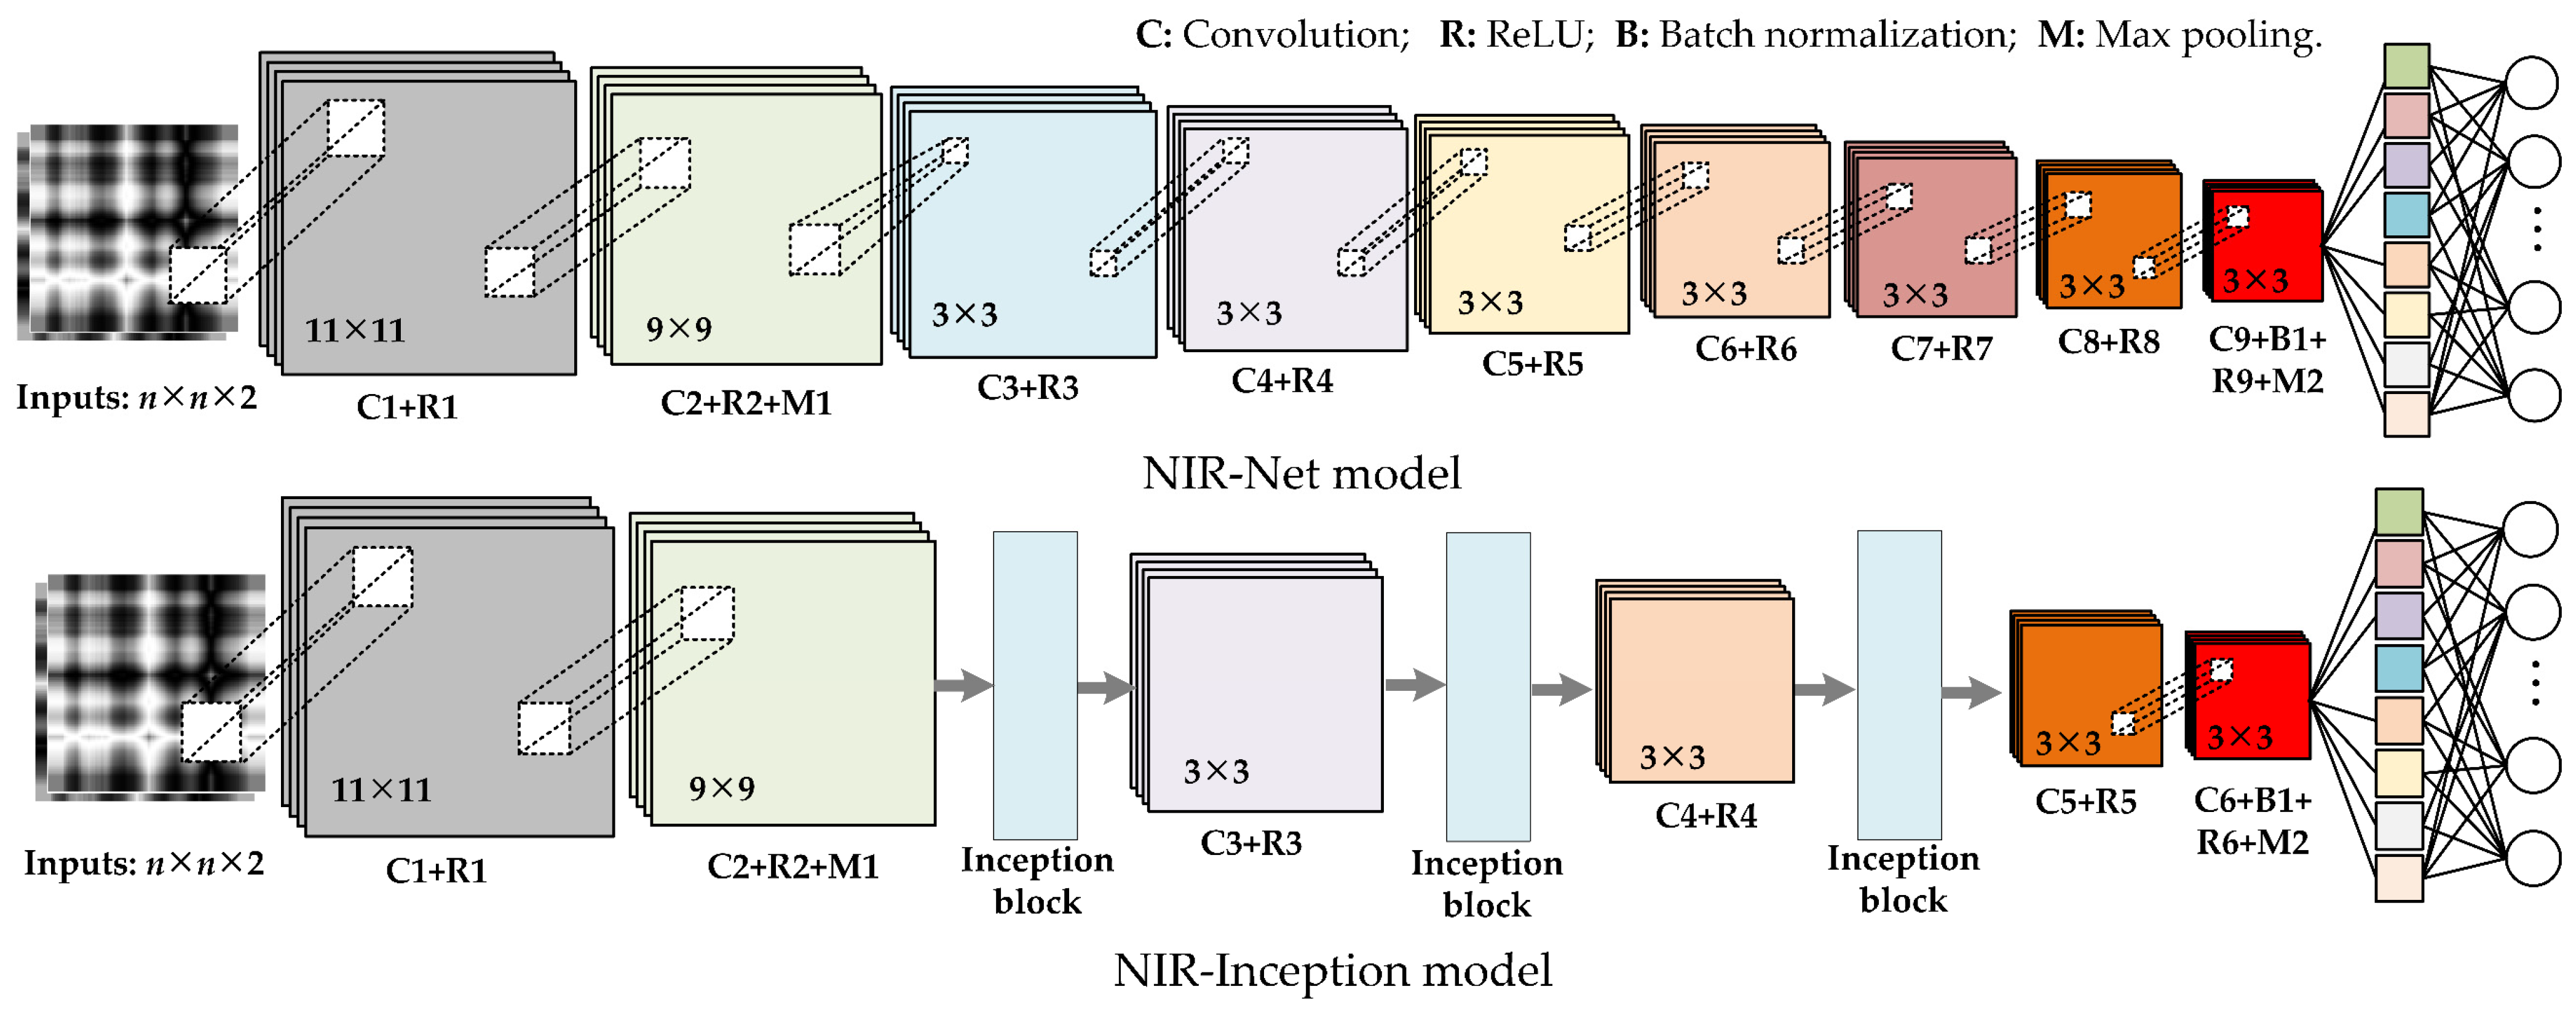
The dimensions of the 1D NIR spectral data collected by the portable spectrometer were 1 × 125. These 1D spectral data were converted into 2D GAF data matrixes with two dimensions, namely 125 × 125 and 63 × 63, respectively, to determine suitable dimensions for species identification. Subsequently, the concatenated data matrices with two channels served as the inputs of the NIR-Net and NIR-Inception models to demonstrate their effectiveness. Furthermore, the performance of the NIR-Net and NIR-Inception models was compared with that of the 1D NIR-Net and 1D NIR-Inception models in which 1D convolution was used instead of 2D convolution, and 1D NIR spectral data were used directly as inputs. For an effective comparison, the widely used PLS-DA multivariate data analysis method was employed for testing the 1D portable NIR spectral data.
As depicted in Table 2, when 1D NIR spectral data were directly used, the PLS-DA method achieved mean accuracy, precision, and recall values of 88.3%, 88.9%, and 87.9%, respectively, in the five-fold cross-validation; these are similar to the identification results of the 1D NIR-Net model. Moreover, the numbers of components in the PLS-DA method were compared, and the optimal number in each fold from 1 to 20 was selected. Similarly, the parameters of the 1D NIR-Net and 1D NIR-Inception models were also compared and selected in the training-validation process. For the 1D NIR-Inception model, the mean accuracy, precision, and recall values of 92.0%, 92.5%, and 91.8% were respectively obtained, thereby slightly surpassing the results of the PLS-DA and 1D NIR-Net models. Regarding the identification results obtained by the 2D NIR GAF matrices in conjunction with the proposed CNN model, the optimal result was achieved when using GAF matrices with dimensions of 63 × 63 combined with the NIR-Inception model. This resulted in a mean accuracy of 96.6%, a mean precision of 96.7%, and a mean recall of 96.6%. These results signify an approximately 4% enhancement in the performance of the model as compared to the 1D NIR-Inception model, and about an 8% improvement as compared to the PLS-DA method. Although the NIR-Net and NIR-Inception models combined with the 125 × 125 NIR GAF data did not achieve the best results, they attained mean accuracies of 95.6% and 94.6%, respectively. These values represent respective improvements of approximately 8.6% and 2.6% in model performance as compared to the corresponding 1D NIR spectral model. It should also be noted that, in the same model, the use of 63 × 63 GAF data achieved a better result than the outcome obtained by the use of 125 × 125 GAF data. This difference can be attributed to the use of the piecewise aggregation approximation method in the GAF method to modify the dimensions of the NIR spectral data to obtain a designed data size [23]. The GAF data dimensions of 125 × 125 indicate that the NIR spectral data were not subjected to an aggregation process; however, the dimensions of 63 × 63 indicate that the NIR spectra underwent 2-point piecewise aggregation approximation. This demonstrates that 63 × 63 GAF data are more suitable for wood species identification via the proposed method.
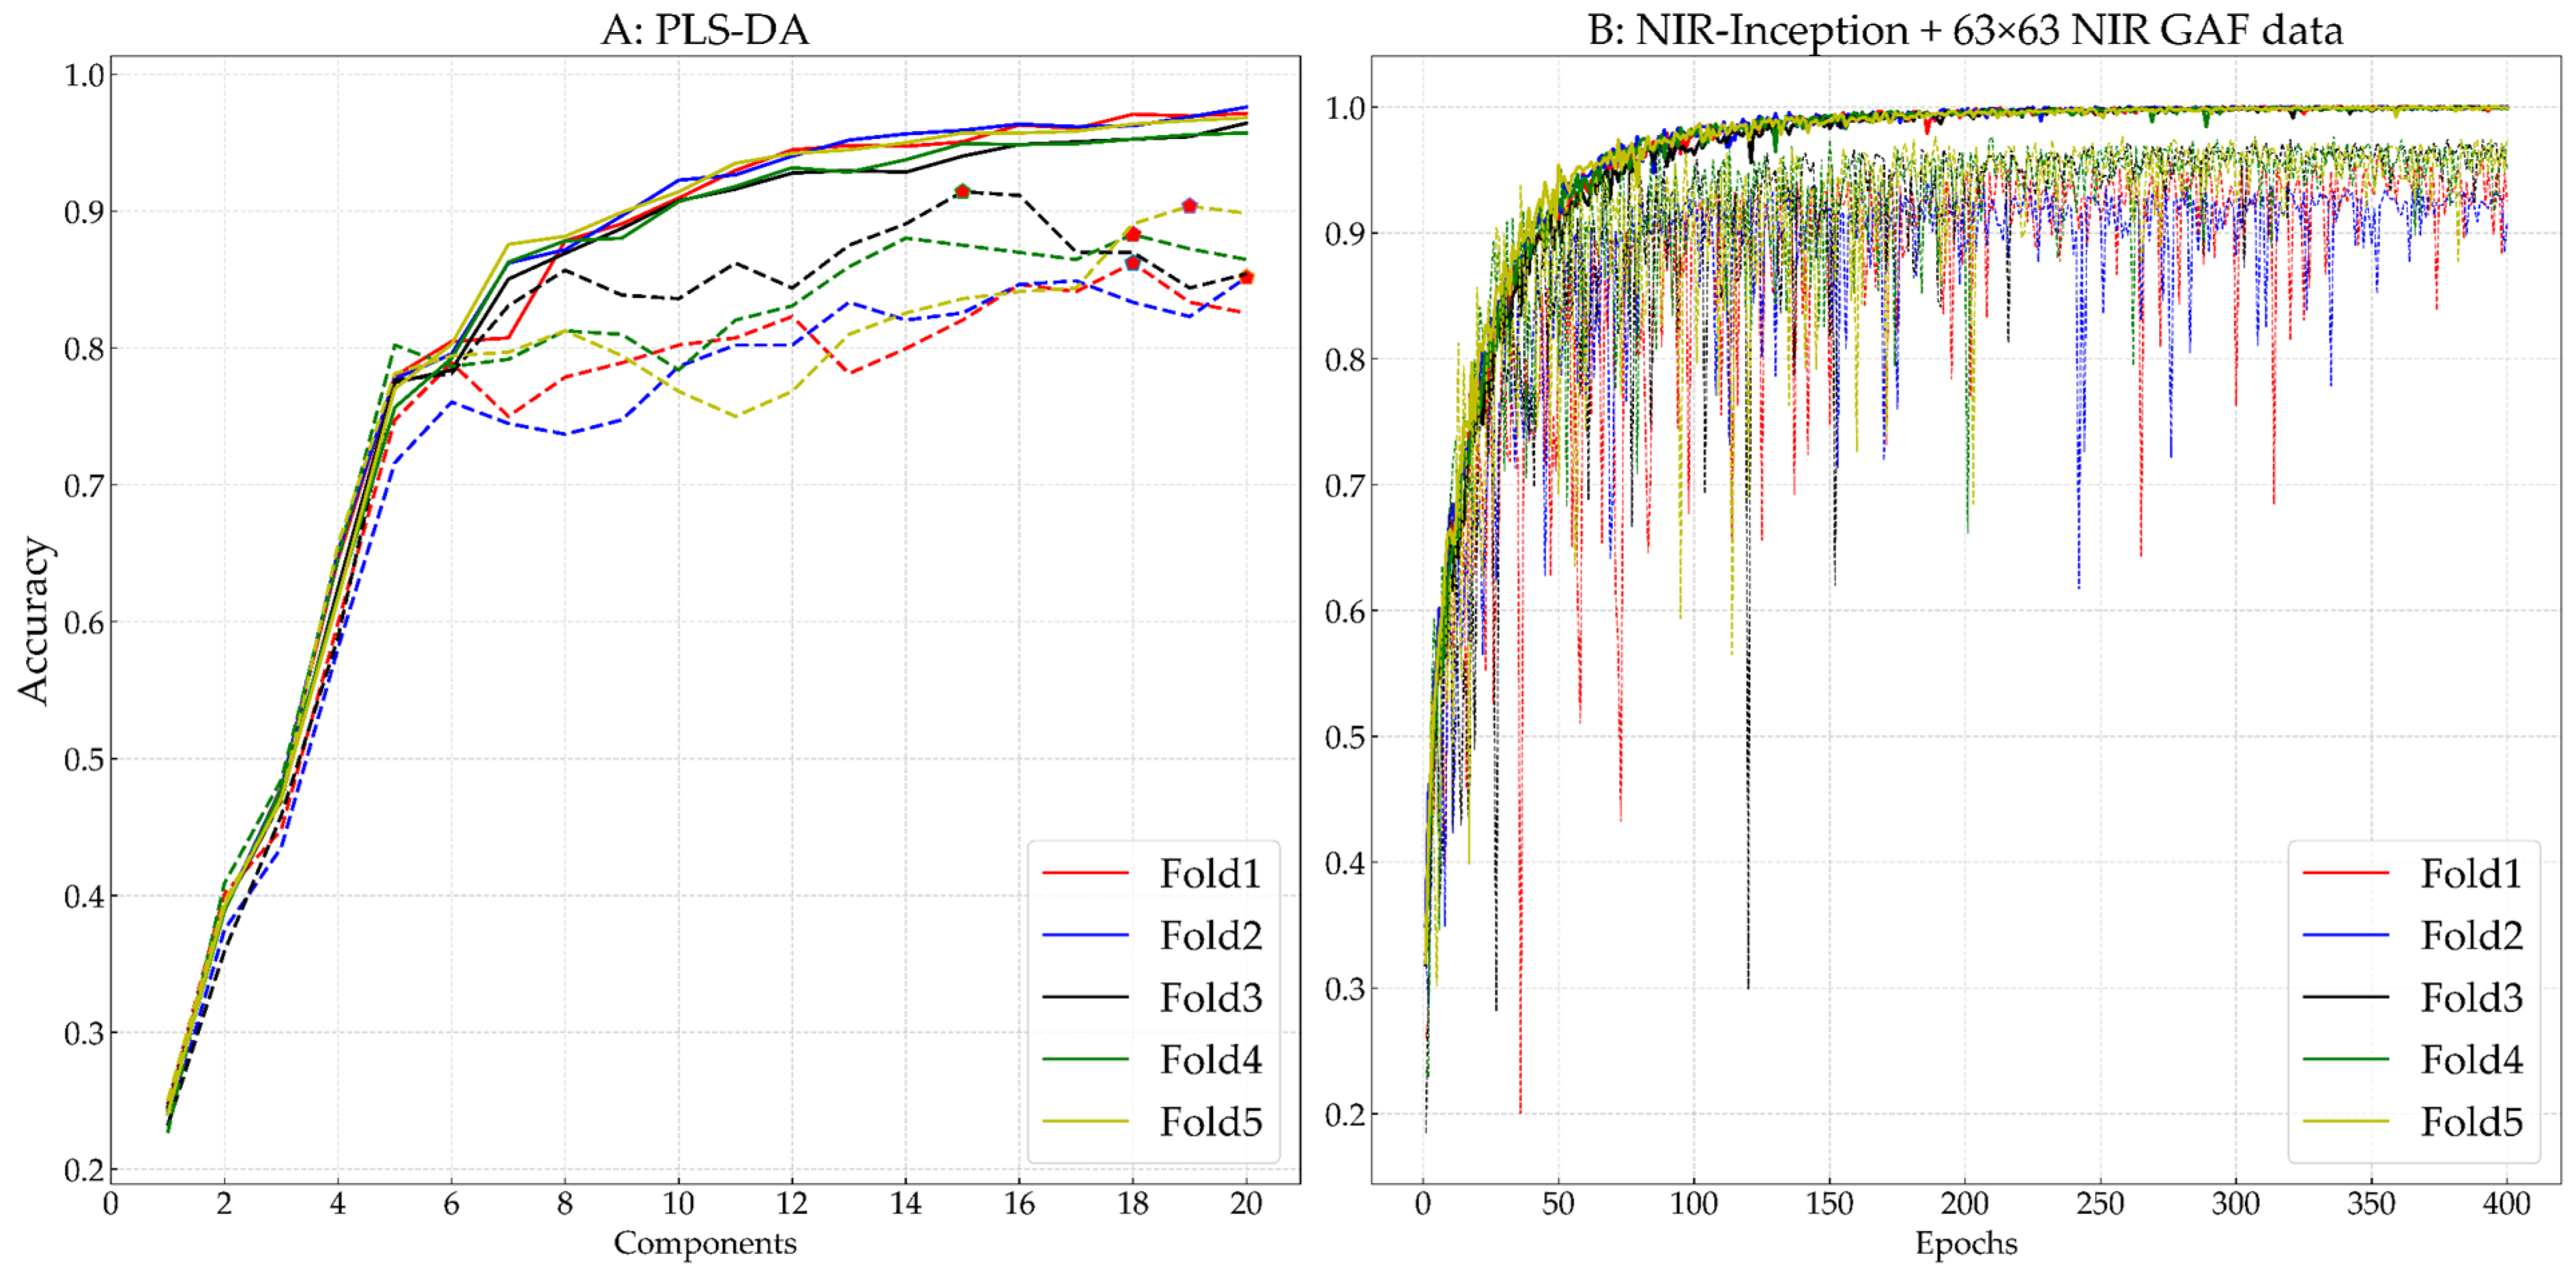
Figure 5 presents the training and validation accuracies for the PLS-DA method (Figure 5A) and the proposed NIR-Inception model combined with the 63 × 63 NIR GAF data (Figure 5B) in each validation fold. In the figure, lines of the same color represent the training and validation accuracies for the same fold, among which solid lines represent the change in training accuracy, and dotted lines represent the change in validation accuracy. For the PLS-DA method (Figure 5A), the x-axis represents the selected number of components of PLS-DA, while for the NIR-Inception method (Figure 5B), the x-axis represents the number of training epochs. After comparison, 18, 20, 15, 18, and 19 components were selected for the PLS-DA method for the first to fifth folds, respectively. It is evident that when the number of components was below six, the validation accuracy increased with the training accuracy. However, when the number of components exceeded six, the validation accuracy did not always increase with the training accuracy. Only when the number of components exceeded 10 did the training accuracy exceed 90%. A small number of components could hinder the model’s performance; however, even when a relatively high number of components was selected, the model still could not fit the validation data, with a validation accuracy below 90%, which was possibly due to a significant loss of spectral information. In the training of the NIR-Inception model combined with 63 × 63 GAF data, stochastic gradient descent (SGD) was used as the learning optimization algorithm, with the application of a learning rate of 0.0009 and a learning rate decay of 0.0001. The number of training epochs was set to 400, and the batch size was set to 32. From the training and validation curves, it can be seen that the gap between training and validation was significantly lower than that for the PLS-DA method for all five folds. Although the validation accuracy of folds 1 and 2 was not stable during the training process, after 350 training iterations, the stability increased, and the validation accuracy exceeded 94%. The results indicate that the proposed NIR-Inception model can effectively extract features directly from NIR GAF data.
Figure 6 exhibits the recall value of the proposed NIR-Net (Figure 6A) and NIR-Inception (Figure 6B) models for each species in conjunction with 63 × 63 GAF data. Some spectral data from the Dalbergia balansae, Dalbergia obtusifolia, and Dalbergia szemaoeasis species were difficult to identify, resulting in a relatively lower recall value of 87.50% in some folds.
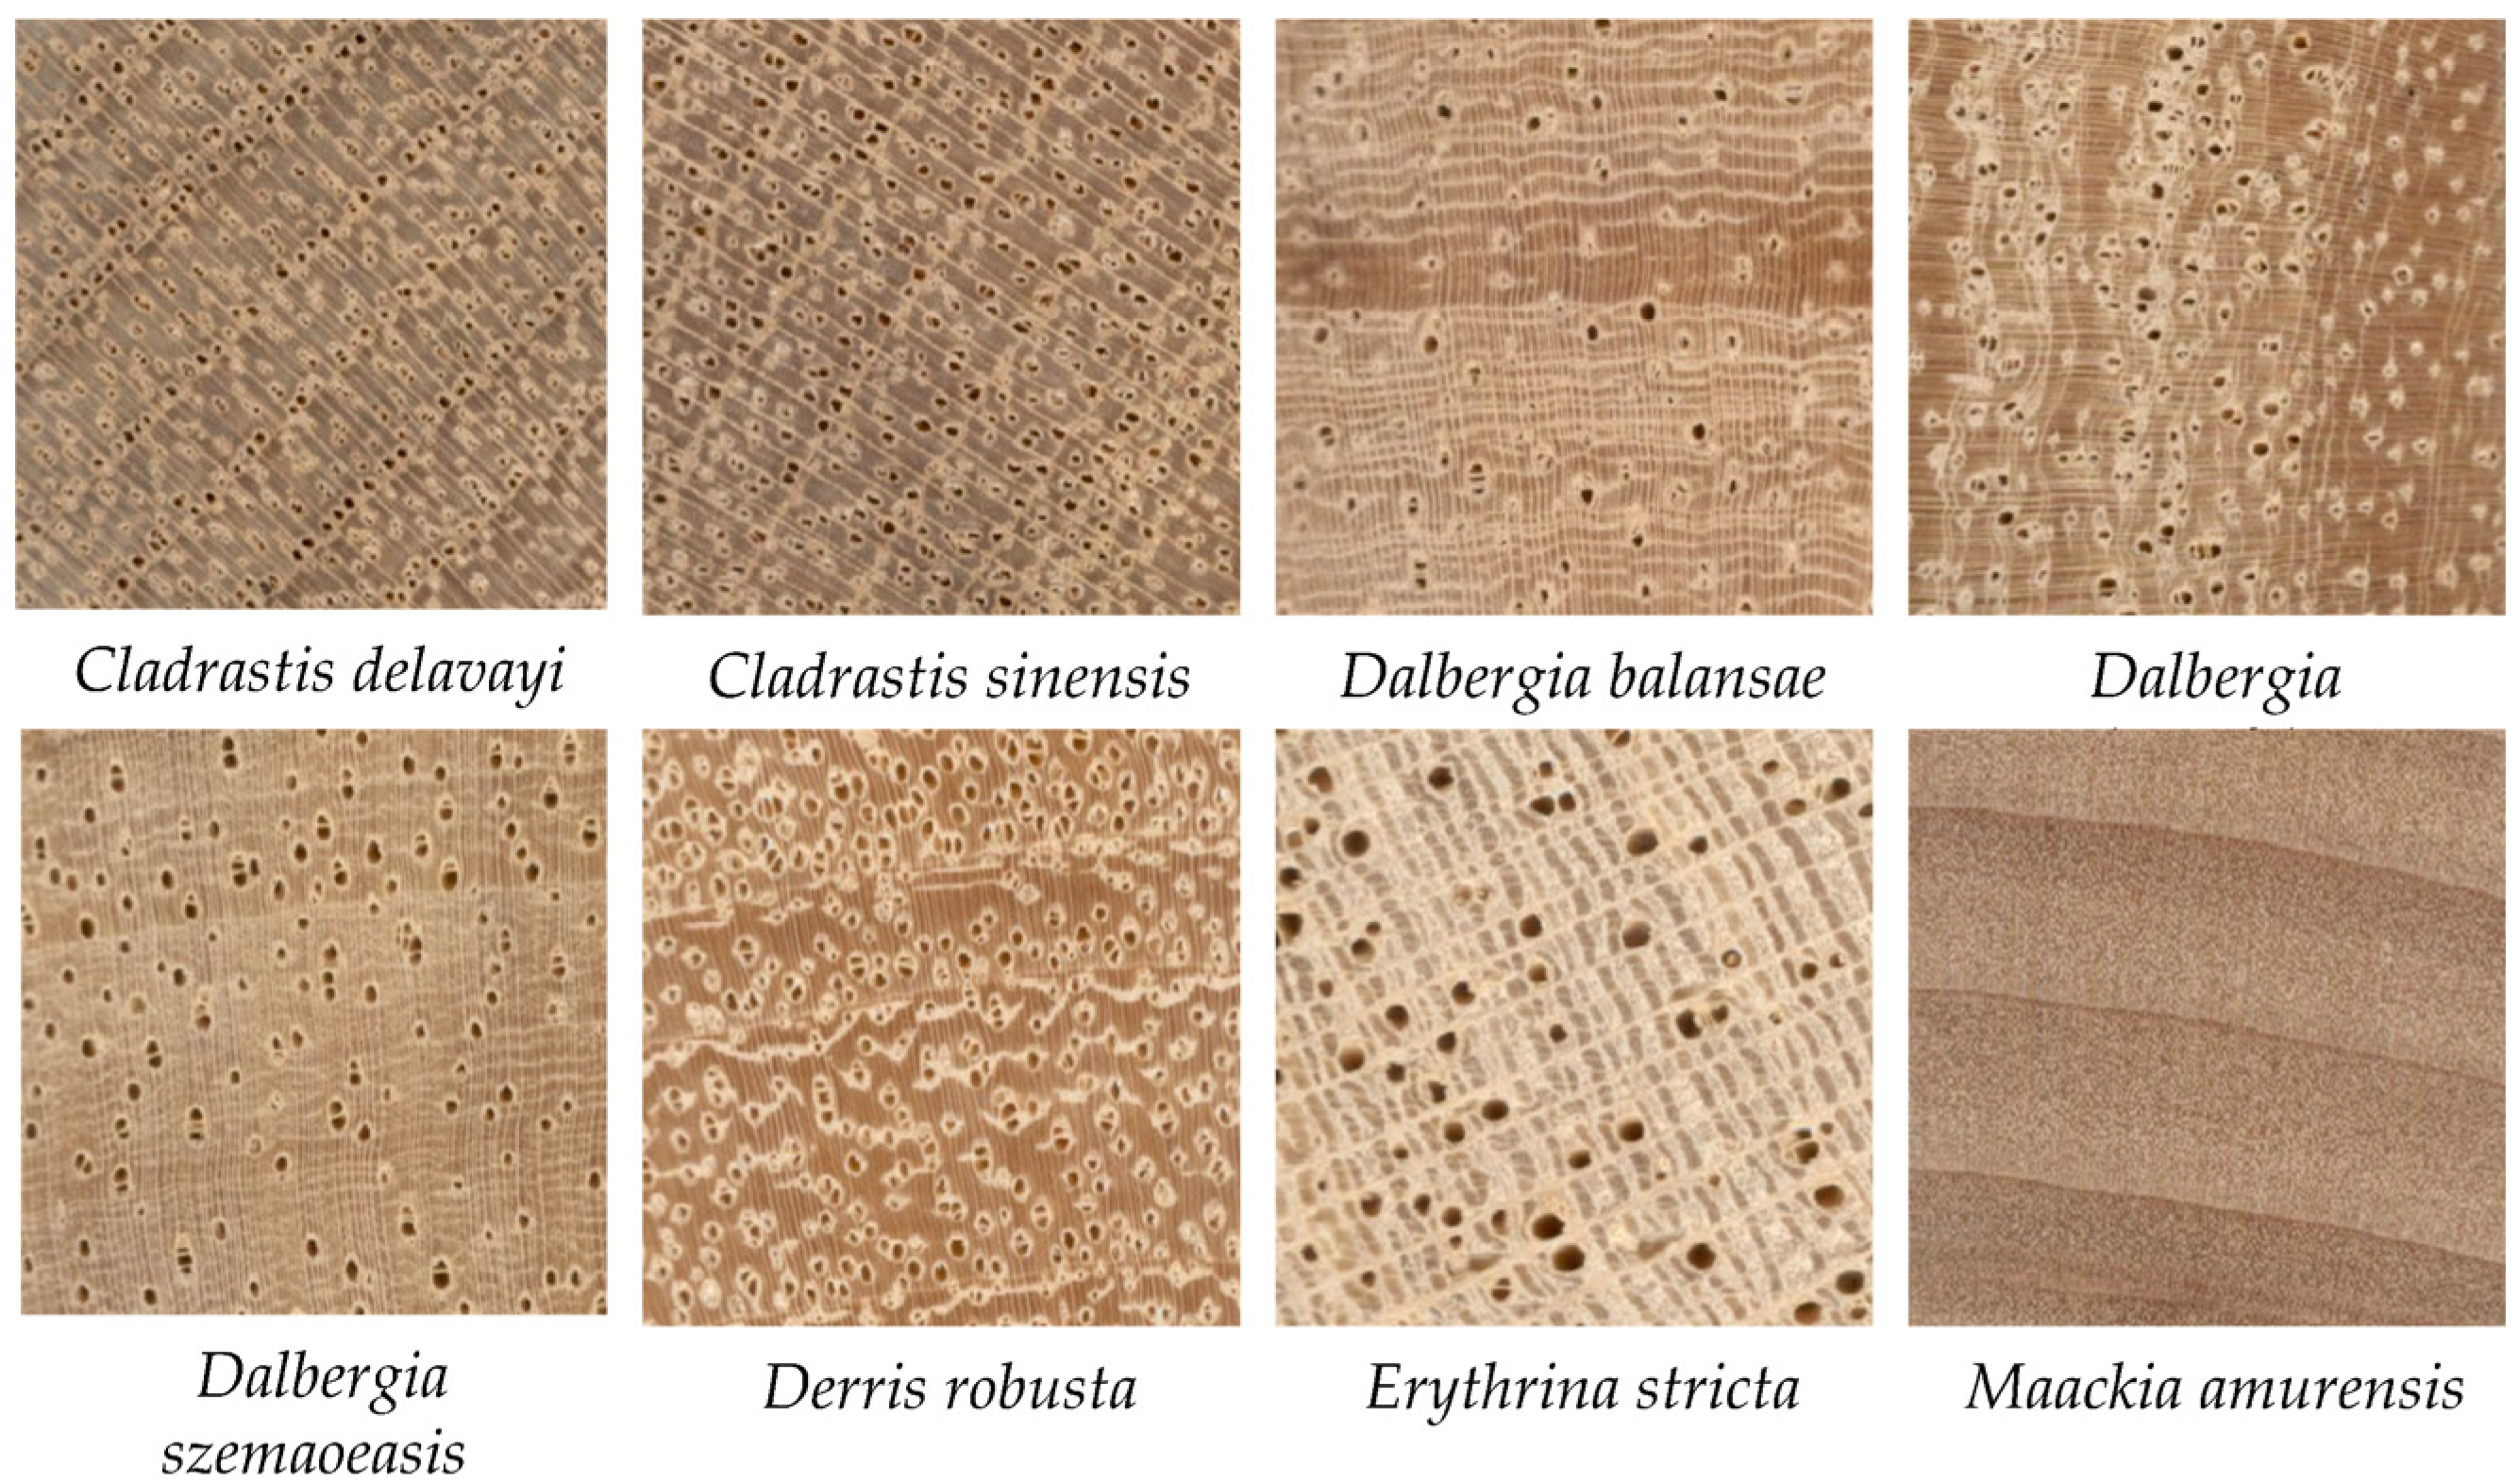
Figure 7 exhibits the transverse section images of eight wood species. Notably, Maackia amurensis lacks an obvious vessel structure compared to the other seven species. This may be the reason why Maackia amurensis is not confused with the other species.

3.2. Influence of Spectral Preprocessing on the Performance of the Proposed Method

To compare the influences of various spectral preprocessing methods on the performance of the two proposed CNN models and select a suitable method, the 1D spectral data were preprocessed with nine preprocessing methods before transforming them into 2D GAF data. Table 3 exhibits the comparative results of these nine preprocessing methods along with the raw spectral data. The nine preprocessing methods and their parameters were as follows: (1) mean center (MC); (2) first derivative (Savitzky–Golay derivative: polynomial order = 2 and window length = 2) (SG1st); (3) second derivative (Savitzky–Golay derivative: polynomial order = 2 and window length = 9) (SG2nd); (4) standard normal variate (SNV); (5) multiplicative scatter correction (MSC); (6) combining MC and SG1st (MC-SG1st); (7) combining MC and SG2nd (MC-SG2nd); (8) combining MC, DG1st, and SNV (MC-SG1st-SNV); (9) combining MC, SG2nd, and SNV (MC-SG2nd-SNV).
From Table 3, it is evident that some preprocessing strategies substantially enhanced the identification performance of the two proposed CNN models. For the NIR-Net model, among the nine preprocessing methods, the best classification result was obtained by the preprocessing strategy that combined MC and SG1st, which achieved mean accuracy, precision, and recall values of 96.7%, 96.8%, and 96.7%, respectively. The preprocessing strategy of combining MC, SG1st, and SNV achieved the second-best result with mean accuracy, precision, and recall values of 96.6%, 96.7%, and 96.6%, respectively. In contrast to the NIR-Net model, the preprocessing strategy of combining MC, SG1st, and SNV yielded the best result for the NIR-Inception model, which achieved mean accuracy, precision, and recall values of 97.3%, 97.4%, and 97.3%, respectively. The method of combining MC and SG1st yielded the second-best result for the NIR-Inception model, with mean accuracy, precision, and recall values of 97.3%, 97.4%, and 97.3%, respectively.
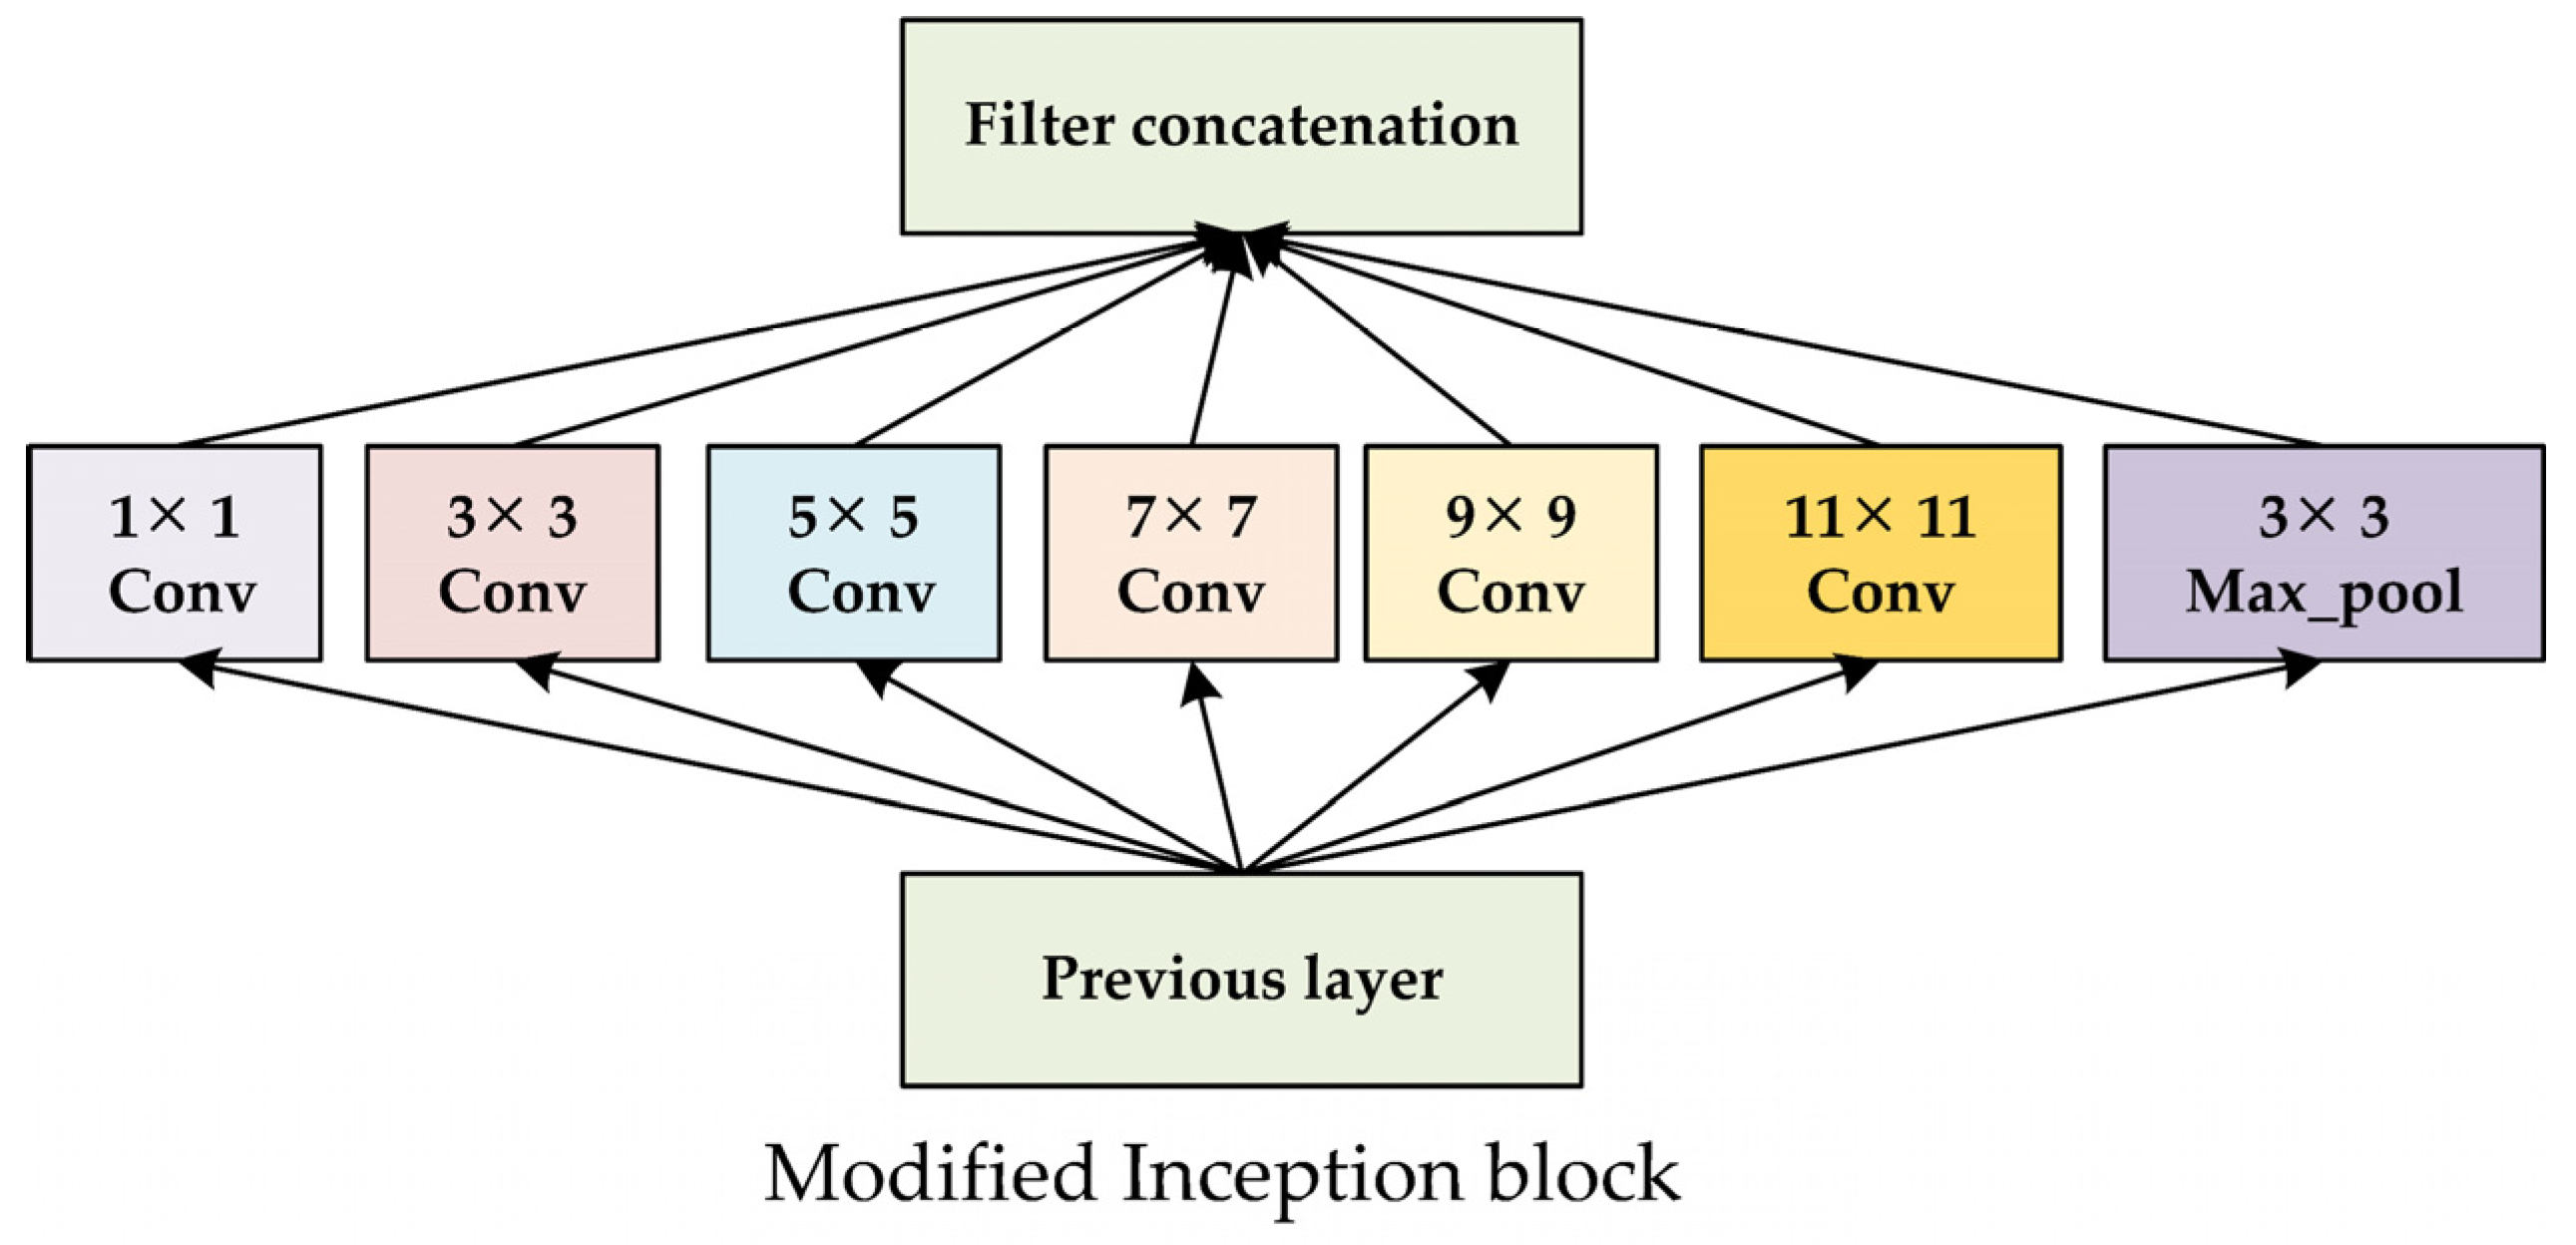
However, some preprocessing strategies, such as SG2nd, combining MC and SG2nd, and combining MC, SG2nd, and SNV, disappointingly introduced more interference as compared to the use of the raw spectral data, resulting in significant decreases in the identification effect of the model. The results indicate that the utilization of an appropriate preprocessing approach to remove noise from 1D NIR spectral data can undoubtedly further improve the identification of wood species via the proposed method. It should also be noted that the same preprocessing approaches behaved differently in the NIR-Net and NIR-Inception models, respectively. Overall, the NIR-Inception model outperformed the NIR-Net model, suggesting that the Inception module can extract more robust features with multi-scale convolution kernels from the NIR GAF data and achieve better identification results.
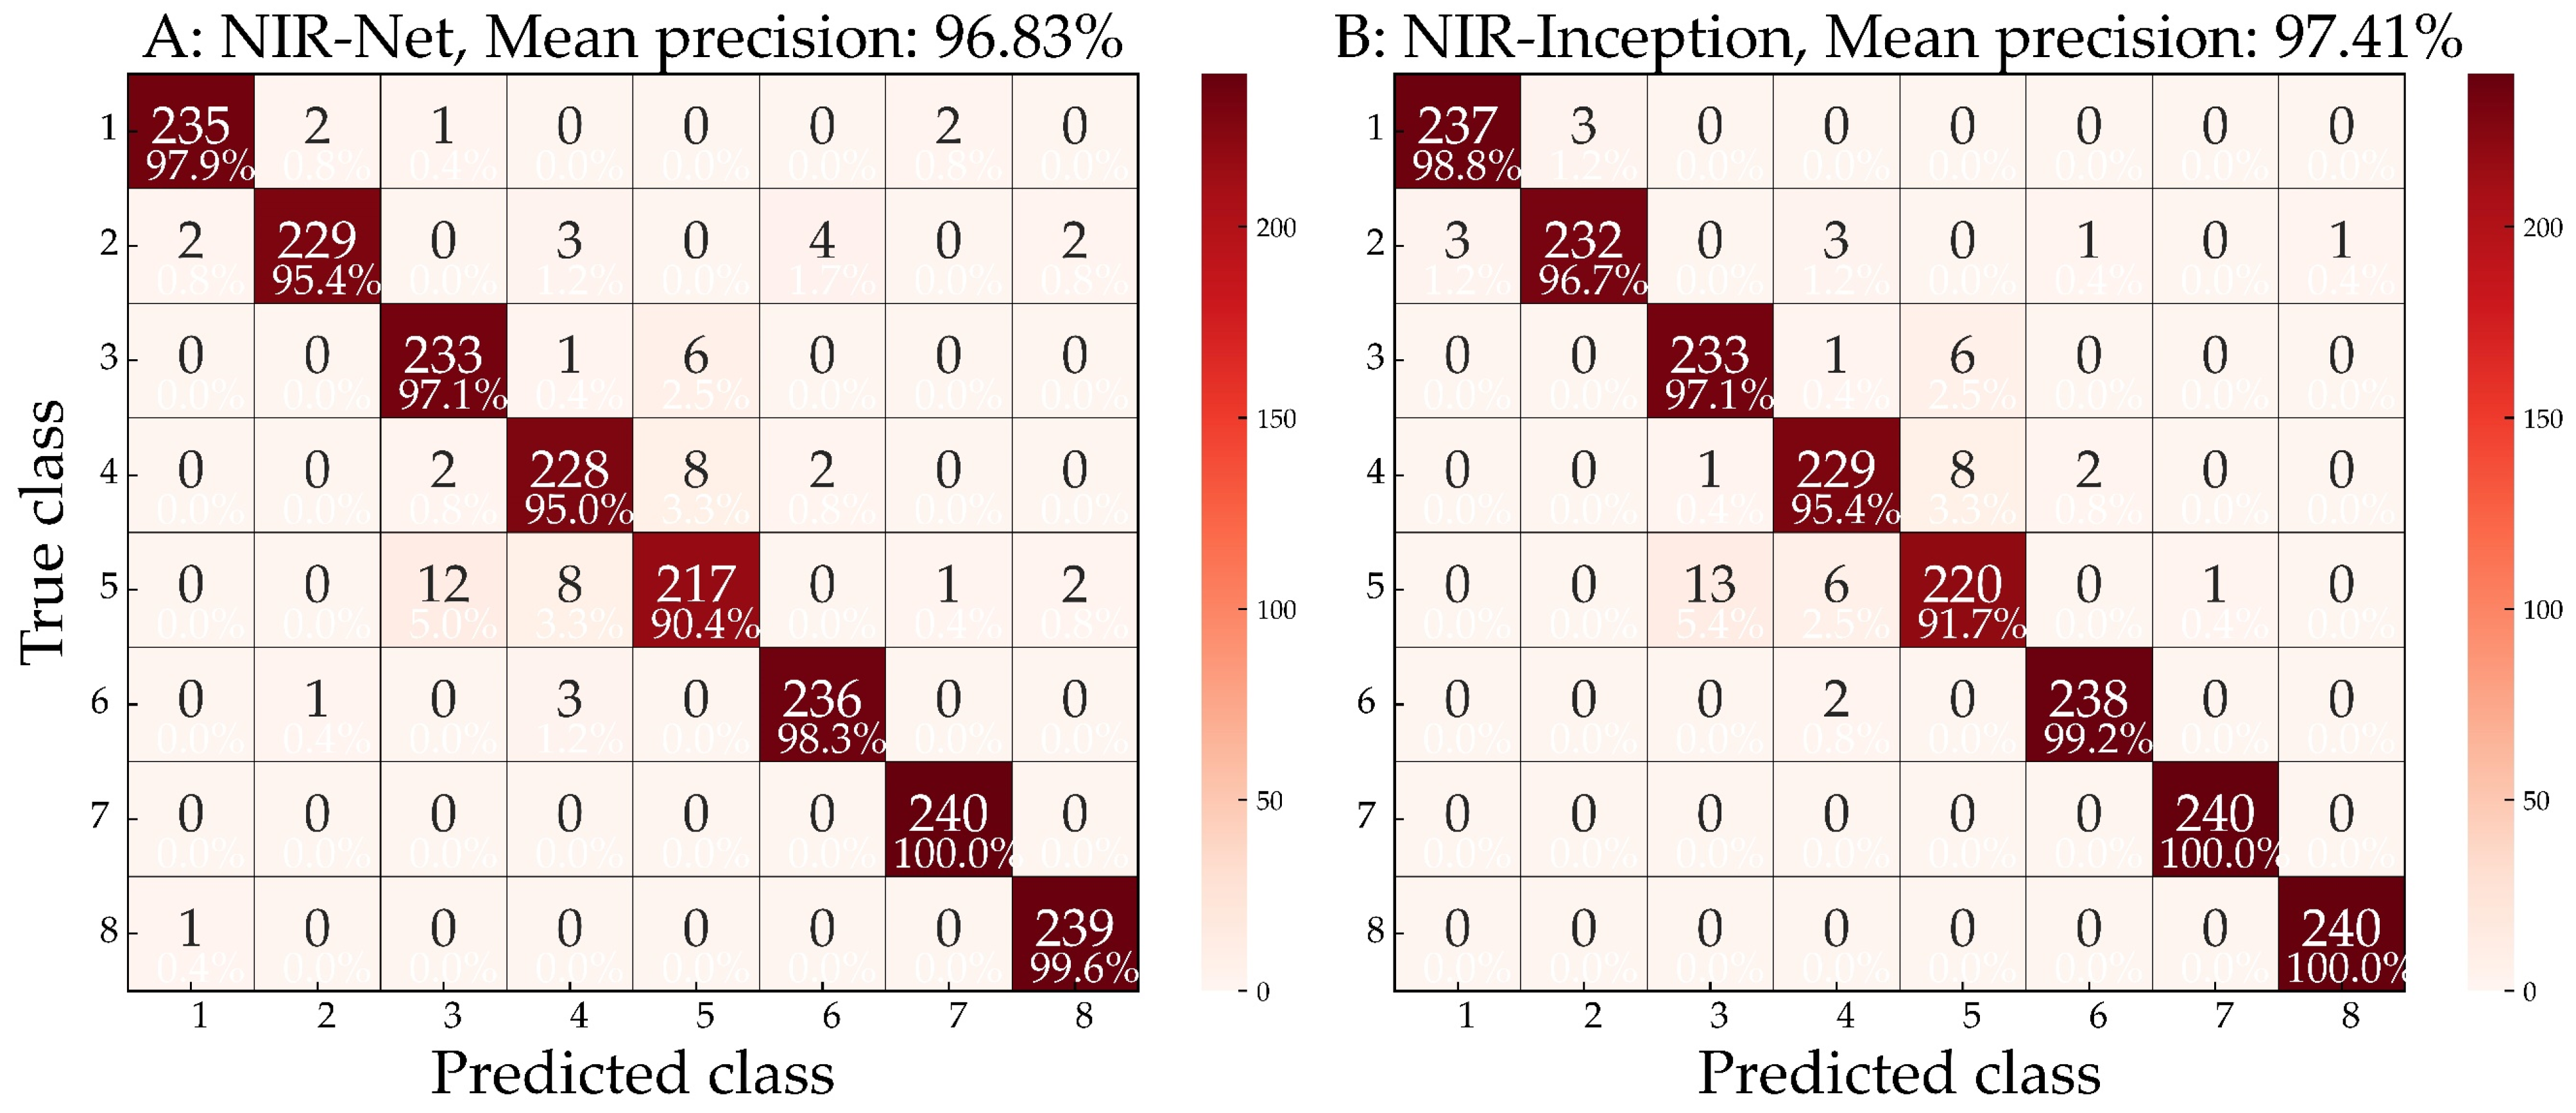
Figure 8 illustrates the results of correctly classified and misidentified species during five-fold validation using the NIR-Net model with MC-SG1st preprocessed spectral GAF data (Figure 8A), and those of the NIR-Inception model with MC-SG1st-SNV preprocessed spectral GAF data (Figure 8B). Diagonal values represent the percentages of accurately identified species, while the off-diagonal values represent the percentages of misclassified species. Notably, some spectral data in the NIR-Net model were misclassified into species from different genera, such as the misclassification of Cladrastis sinensis. However, this situation improved in the NIR-Inception model, although species from the same genus were still more easily confused. For instance, spectral data from Dalbergia balansae and Dalbergia obtusifolia were misclassified as Dalbergia szemaoeasis, and vice versa. Additionally, spectral data from Cladrastis delavayi and Cladrastis sinensis were mutually misclassified. Overall, the NIR-Inception model outperformed the NIR-Net model and is more suitable for wood species identification. Notably, Dalbergia szemaoeasis was the most challenging species to identify, for which a mean precision of only 91.70% was achieved.

3.3. Comparison with Conventional Methods

To compare the identification effectiveness of the NIR-Inception model with traditional ML methods, two nonlinear methods, namely the SVM and KNN models, were employed for the identification of the eight species. The MC-SG1st-SNV preprocessing method performed well in both CNN models, and both raw and MC-SG1st-SNV preprocessed spectral data were used in the comparative experiment. In the two ML methods, PCA was employed for dimensionality reduction to eliminate redundant information from the NIR spectral data. The grid search method combined with three-fold cross-validation was used to optimize the parameters of the SVM and KNN methods at different PCA components ranging from one to fourteen.
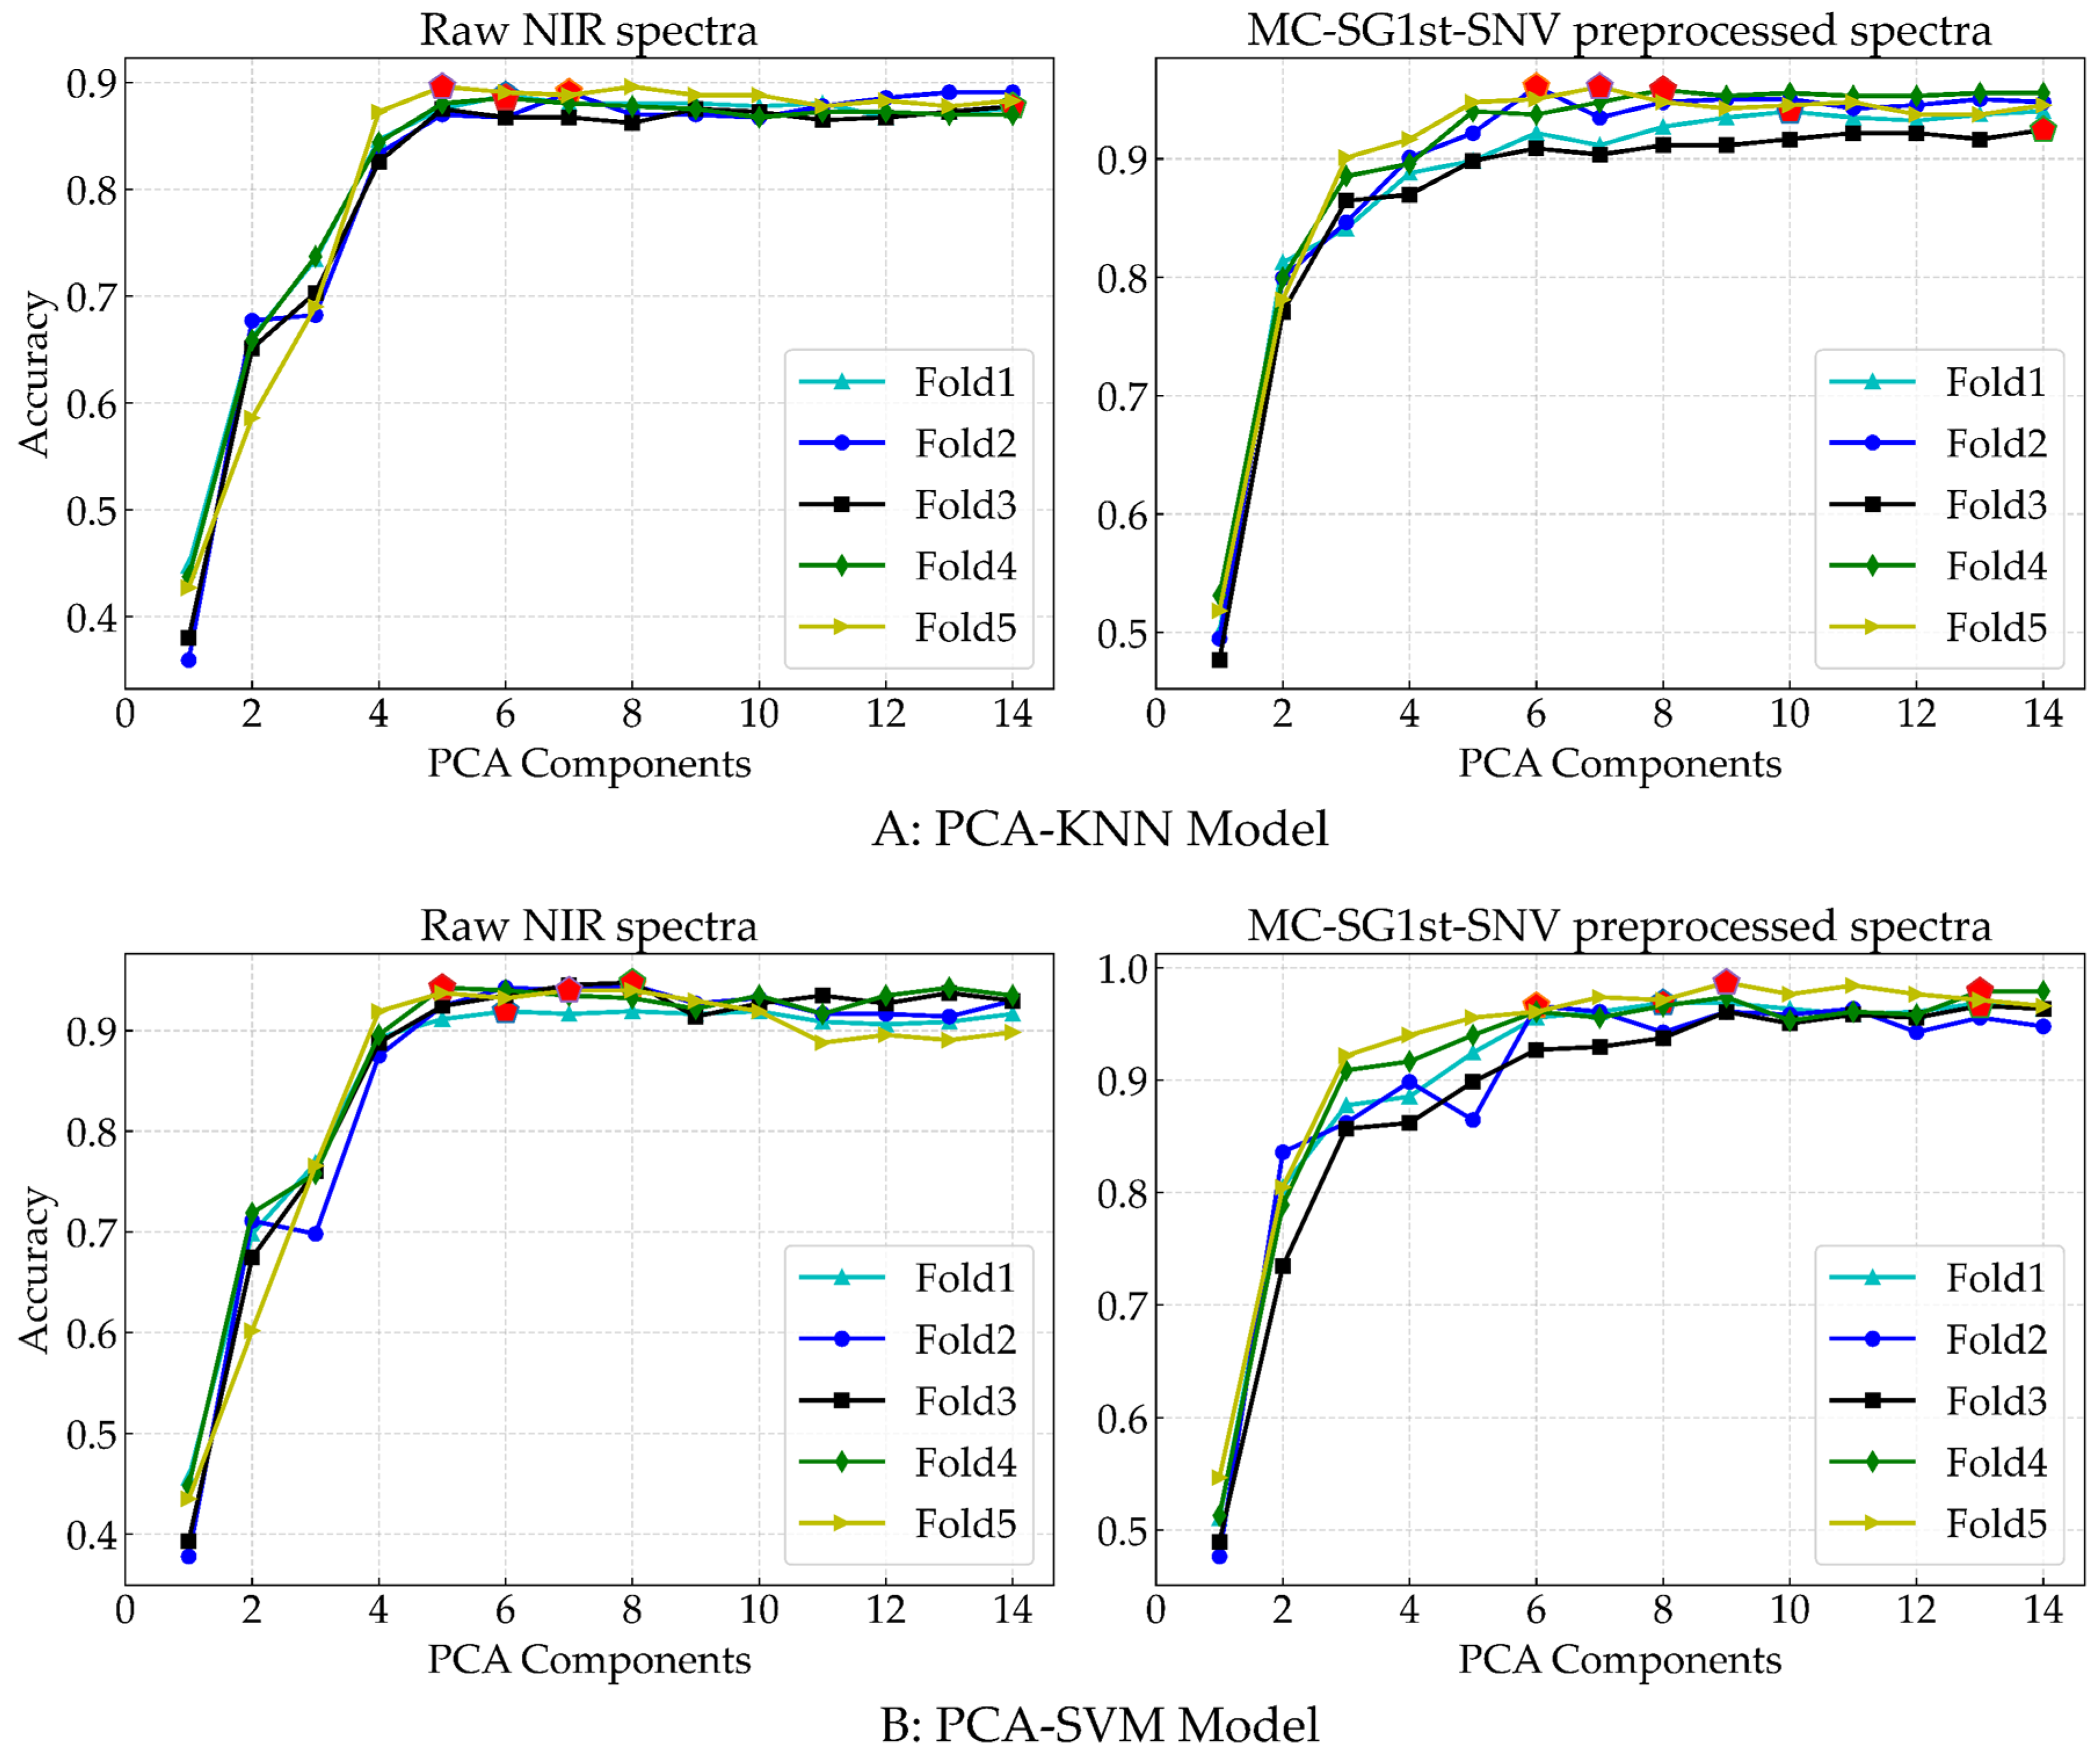
In Figure 7, the x-axis represents different PCA components, and the y-axis represents the corresponding accuracy of the optimal KNN (Figure 9A) and SVM (Figure 9B) model parameters for each fold. From the figure, it is evident that the number of PCA components significantly influenced the identification performance of the KNN and SVM models. A small number of PCA components led to a substantial loss of feature information, consequently decreasing the identification accuracy of the models. Both the KNN and SVM models demonstrated good performance on the MC-SG1st-SNV preprocessed spectral data as compared to the raw spectral data. Additionally, a notable difference was observed in the optimal number of PCA components for different methods and datasets. Overall, the SVM model outperformed the KNN model on both the raw and MC-SG1st-SNV preprocessed spectral data.
Table 4 presents the mean accuracy, precision, and recall of two nonlinear ML methods and the proposed NIR-Inception model using raw and MC-SG1st-SNV preprocessed spectral data. In the case of raw spectral data, the KNN model achieved mean accuracy, precision, and recall values of 88.8%, 89.3%, and 88.7%, respectively, indicating insufficient accuracy for precise species identification. In contrast, the NIR-Inception model significantly outperformed the two ML methods. For the MC-SG1st-SNV preprocessed spectral data, the identification results of all three models exhibited further improvements as compared to the raw spectral data, with the NIR-Inception model achieving the best result among the three models. Notably, the SVM combined with MC-SG1st-SNV preprocessed spectral data achieved mean accuracy, precision, and recall values of 97.0%, 97.1%, and 97.0%, respectively. However, these results were slightly below those of the NIR-Inception model, which may suggest that the NIR-Inception model can directly extract more robust feature information from the NIR GAF data. In comparison, the PCA dimensional reduction of spectral data in the two ML methods could lead to the loss of some feature information, thus potentially bottlenecking their identification performance.

4. Conclusions

This study proposed a multi-scale CNN model designed to extract feature information from shorter-wavelength NIR spectral data, the goal of which was to construct a wood species identification methodology suitable for on-site application using a portable NIR spectrometer. In the proposed model, the GAF method is used to convert 1D NIR spectral data into 2D data matrices, thereby enhancing the ability of the multi-scale CNN model to extract more robust discriminative features from spectral data. The effectiveness of the proposed method was evaluated based on the identification of eight wood species within the Fabaceae family. The experimental results clearly demonstrate enhanced identification performance as compared to conventional multivariate data analysis methods (PLS-DA) and two nonlinear ML methods in terms of mean accuracy, precision, and recall in five-fold cross-validation. The study suggests that employing the GAF method for shorter 1D NIR spectral data, in combination with a multi-scale CNN model, offers a useful approach for conducting rapid, non-destructive, and automatic wood species identification using a portable NIR spectrometer. Further research should expand the capabilities of the proposed method by applying it to larger datasets with increased spectral feature diversity and refining a more robust multi-scale CNN method for wood species identification.

Author Contributions

Conceptualization, X.P. and Z.Y. (Zhong Yang); methodology, X.P.; sample collection and preparation, X.P.; software, X.P. and Z.Y. (Zhong Yang); formal analysis, X.P. and Z.Y. (Zhong Yang); Validation, X.P. and Z.Y. (Zhong Yang); writing—original draft preparation, X.P.; writing—review and editing, X.P. and Z.Y. (Zhiming Yu); supervision, Z.Y. (Zhong Yang); project administration, Z.Y. (Zhong Yang); funding acquisition, Z.Y. (Zhong Yang). All authors have read and agreed to the published version of the manuscript.

Funding

This work was supported by the China National Natural Science Funds [grant nos. 31770766 and 31370711], and the Fundamental Research Funds for Central Public Welfare Research Institutes [grant no. CAFYBB2021ZJ001].

Data Availability Statement

The datasets generated and/or analyzed during the current study are not publicly available as they are part of a larger dataset.

Acknowledgments

The authors gratefully acknowledge the Xylarium of Southwest Forestry University for supporting the wood specimens used in this study. Additionally, the authors thank Beijing Great Technology Co., Ltd. (Beijing, China) for supporting the portable NIR spectrometer.

Conflicts of Interest

The authors declare no conflict of interest.

References

  1. Yang, S.-Y.; Kwon, O.; Park, Y.; Chung, H.; Kim, H.; Park, S.-Y.; Choi, I.-G.; Yeo, H. Application of Neural Networks for Classifying Softwood Species Using near Infrared Spectroscopy. J. Near Infrared Spectrosc. 2020, 28, 298–307. [Google Scholar] [CrossRef]
  2. Zhou, Z.; Rahimi, S.; Avramidis, S. On-Line Species Identification of Green Hem-Fir Timber Mix Based on near Infrared Spectroscopy and Chemometrics. Eur. J. Wood Prod. 2020, 78, 151–160. [Google Scholar] [CrossRef]
  3. Sun, Y.; Lin, Q.; He, X.; Zhao, Y.; Dai, F.; Qiu, J.; Cao, Y. Wood Species Recognition with Small Data: A Deep Learning Approach. Int. J. Comput. Intell. Syst. 2021, 14, 1451. [Google Scholar] [CrossRef]
  4. He, T.; Jiao, L.; Wiedenhoeft, A.C.; Yin, Y. Machine Learning Approaches Outperform Distance- and Tree-Based Methods for DNA Barcoding of Pterocarpus Wood. Planta 2019, 249, 1617–1625. [Google Scholar] [CrossRef]
  5. Zahir, S.A.D.M.; Omar, A.F.; Jamlos, M.F.; Azmi, M.A.M.; Muncan, J. A Review of Visible and Near-Infrared (Vis-NIR) Spectroscopy Application in Plant Stress Detection. Sens. Actuators A Phys. 2022, 338, 113468. [Google Scholar] [CrossRef]
  6. Braga, J.W.B.; Pastore, T.C.M.; Coradin, V.T.R.; Camargos, J.A.A.; da Silva, A.R. The Use of near Infrared Spectroscopy to Identify Solid Wood Specimens of Swietenia Macrophylla0 (Cites Appendix II). IAWA J. 2011, 32, 285–296. [Google Scholar] [CrossRef]
  7. Pastore, T.C.M.; Braga, J.W.B.; Coradin, V.T.R.; Magalhães, W.L.E.; Okino, E.Y.A.; Camargos, J.A.A.; de Muñiz, G.I.B.; Bressan, O.A.; Davrieux, F. Near Infrared Spectroscopy (NIRS) as a Potential Tool for Monitoring Trade of Similar Woods: Discrimination of True Mahogany, Cedar, Andiroba, and Curupixá. Holzforschung 2011, 65, 73–80. [Google Scholar] [CrossRef]
  8. Rocha, H.S.; Braga, J.W.B.; Kunze, D.C.G.C.; Coradin, V.T.R.; Pastore, T.C.M. Identification of Mahogany Sliced Veneer Using Handheld Near-Infrared Spectroscopy Device and Multivariate Data Analysis. IAWA J. 2021, 42, 336–347. [Google Scholar] [CrossRef]
  9. Bergo, M.C.J.; Pastore, T.C.M.; Coradin, V.T.R.; Wiedenhoeft, A.C.; Braga, J.W.B. NIRS identification of swietenia macrophylla is robust across specimens from 27 countries. IAWA J. 2016, 37, 420–430. [Google Scholar] [CrossRef]
  10. Snel, F.A.; Braga, J.W.B.; da Silva, D.; Wiedenhoeft, A.C.; Costa, A.; Soares, R.; Coradin, V.T.R.; Pastore, T.C.M. Potential Field-Deployable NIRS Identification of Seven Dalbergia Species Listed by CITES. Wood Sci. Technol. 2018, 52, 1411–1427. [Google Scholar] [CrossRef]
  11. Novaes1, T.V.; Ramalho, F.M.G.; da Silva Araujo, E.; Lima, M.D.R.; da Silva, M.G.; Ferreira, G.C.; Hein, P.R.G. Discrimination of Amazonian Forest Species by NIR Spectroscopy: Wood Surface Effects. Eur. J. Wood Prod. 2022, 81, 159–172. [Google Scholar] [CrossRef]
  12. Silva, D.C.; Pastore, T.C.M.; Soares, L.F.; de Barros, F.A.S.; Bergo, M.C.J.; Coradin, V.T.H.; Gontijo, A.B.; Sosa, M.H.; Chacón, C.B.; Braga, J.W.B. Determination of the Country of Origin of True Mahogany (Swietenia Macrophylla King) Wood in Five Latin American Countries Using Handheld NIR Devices and Multivariate Data Analysis. Holzforschung 2018, 72, 521–530. [Google Scholar] [CrossRef]
  13. Abe, H.; Kurata, Y.; Watanabe, K.; Ishikawa, A.; Noshiro, S.; Fujii, T.; Iwasa, M.; Kaneko, H.; Wada, H. The Separation of Softwood and Hardwood in Historical Wooden Statues of the Nazenji-Temple in Japan Using NIR Spectroscopy. IAWA J. 2020, 41, 740–750. [Google Scholar] [CrossRef]
  14. Park, S.-Y.; Kim, J.-C.; Kim, J.-H.; Yang, S.-Y.; Kwon, O.; Yeo, H.; Cho, K.-C.; Choi, I.-G. Possibility of Wood Classification in Korean Softwood Species Using Near-Infrared Spectroscopy Based on Their Chemical Compositions. J. Korean Wood Sci. Technol. 2017, 45, 202–212. [Google Scholar] [CrossRef]
  15. Luo, L.; Xu, Z.-J.; Na, B. Building Machine Learning Models to Identify Wood Species Based on Near-Infrared Spectroscopy. Holzforschung 2023, 77, 326–337. [Google Scholar] [CrossRef]
  16. Wang, Y.; Zhang, W.; Gao, R.; Jin, Z.; Wang, X. Recent Advances in the Application of Deep Learning Methods to Forestry. Wood Sci. Technol. 2021, 55, 1171–1202. [Google Scholar] [CrossRef]
  17. Sermanet, P.; Chintala, S.; LeCun, Y. Convolutional Neural Networks Applied to House Numbers Digit Classification. In Proceedings of the 21st International Conference on Pattern Recognition (ICPR2012), Tsukuba, Japan, 11–15 November 2012. [Google Scholar]
  18. Passos, D.; Mishra, P. Perspectives on Deep Learning for Near-Infrared Spectral Data Modelling. NIR News 2022, 33, 9–12. [Google Scholar] [CrossRef]
  19. Pan, X.; Qiu, J.; Yang, Z. Identification of Softwood Species Using Convolutional Neural Networks and Raw Near-Infrared Spectroscopy. Wood Mater. Sci. Eng. 2023, 18, 1338–1348. [Google Scholar] [CrossRef]
  20. dos Santos, C.A.T.; Lopo, M.; Páscoa, R.N.M.J.; Lopes, J.A. A Review on the Applications of Portable Near-Infrared Spectrometers in the Agro-Food Industry. Appl. Spectrosc. 2013, 67, 1215–1233. [Google Scholar] [CrossRef]
  21. Raobelina, A.C. Use of a portable near infrared spectrometer for wood identification of four dalbergia species from Madagascar. Wood Fiber Sci. 2023, 55, 4–17. [Google Scholar] [CrossRef]
  22. Pan, X.; Qiu, J.; Yang, Z. Identification of Five Similar Cinnamomum Wood Species Using Portable Near-Infrared Spectroscopy. Spectroscopy 2022, 37, 16–23. [Google Scholar] [CrossRef]
  23. Wang, Z.; Oates, T. Imaging Time-Series to Improve Classification and Imputation. arXiv 2015, arXiv:1506.00327. [Google Scholar]
  24. Szegedy, C.; Liu, W.; Jia, Y.; Sermanet, P.; Reed, S.; Anguelov, D.; Erhan, D.; Vanhoucke, V.; Rabinovich, A. Going Deeper with Convolutions. In Proceedings of the 2015 IEEE Conference on Computer Vision and Pattern Recognition (CVPR), Boston, MA, USA, 7–12 June 2015; pp. 1–9. [Google Scholar]
Figure 1. A transverse section picture of the polished surface for Dalbergia szemaoeasis.
Forests 15 00556 g001
Figure 2. The transformation of 1D NIR spectral data to 2D data matrices by the GAF method.
Forests 15 00556 g002
Figure 3. The architecture of the CNN model.
Forests 15 00556 g003
Figure 4. The modified Inception module.
Forests 15 00556 g004
Figure 5. The training and validation process of the PLS-DA (A) and NIR-Inception (B) models.
Forests 15 00556 g005
Figure 6. The recall comparison of the proposed NIR-Net (A) and NIR-Inception (B) models for each species (1: Cladrastis delavayi, 2: Cladrastis sinensis, 3: Dalbergia balansae, 4: Dalbergia obtusifolia, 5: Dalbergia szemaoeasis, 6: Derris robusta, 7: Erythrina stricta, 8: Maackia amurensis).
Forests 15 00556 g006
Figure 7. Transverse section image of eight wood species.
Forests 15 00556 g007
Figure 8. The classification confusion matrixes of five-fold validation using (A) the NIR-Net model with MC-SG1st preprocessed data and (B) the NIR-Inception model with MC-SG1st-SNV preprocessed GAF data with dimensions of 63 × 63. Labels 1 to 8 correspond to the wood sample numbers exhibited in Table 1 and Figure 5.
Forests 15 00556 g008
Figure 9. The KNN (A) and SVM (B) model performance with different PCA components and two modes of spectral data in the five-fold cross-validation. The x-axis represents different components selected by PCA, and the y-axis represents the corresponding accuracy.
Forests 15 00556 g009
Table 1. The samples of wood species used in the study.
NumberScientific NameGenusFamilySpecimen ID
1Cladrastis delavayiCladrastisFabaceaeSWFUW-H00968
2Cladrastis sinensisSWFUW-H00973
3Dalbergia balansaeDalbergiaSWFUW-H00978
4Dalbergia obtusifoliaSWFUW-H00980
5Dalbergia szemaoeasisSWFUW-H00983
6Derris robustaDerrisSWFUW-H00984
7Erythrina strictaErythrinaSWFUW-H00985
8Maackia amurensisMaackiaSWFUW-H00987
Table 2. The identification results of different models combined with NIR GAF matrices or 1D NIR spectral data.
DataDimensionsModelAccuracy (%)Precision (%)Recall (%)
1D NIR1 × 125PLS-DA88.388.987.9
1D NIR-Net87.588.987.0
1D NIR-Inception92.092.591.8
NIR GAF125 × 125NIR-Net95.695.895.6
NIR-Inception94.694.894.7
63 × 63NIR-Net96.096.196.0
NIR-Inception96.696.796.6
Table 3. The classification results of the proposed CNN models adopting nine different spectral preprocessing methods.
Preprocessing MethodNIR-NetNIR-Inception
Accuracy (%)Precision (%)Recall (%)Accuracy (%)Precision (%)Recall (%)
None96.096.196.096. 696.796.6
MC96.096.296.0096.396.496.2
SG1st93.193.493.197.197.397.1
SG2nd92.292.592.292.893.392.9
SNV95.295.495.296.896.996.8
MSC95.195.295.196.496.696.4
MC-SG1st96.796.896.797.397.497.3
MC-SG2nd94.995.194.995.996.195.7
MC-SG1st-SNV96.696.796.697.397.497.3
MC-SG2nd-SNV95.395.495.395.695.895.6
Table 4. The identification results of two nonlinear ML methods compared with the proposed method.
MethodPreprocessing MethodAccuracy (%)Precision (%)Recall (%)
PCA-KNNNone88.889.388.7
MC-SG1st-SNV94.995.094.9
PCA-SVMNone93.994.193.9
MC-SG1st-SNV97.097.197.0
NIR-InceptionNone96. 696.796.6
MC-SG1st-SNV97.397.497.3
Disclaimer/Publisher’s Note: The statements, opinions and data contained in all publications are solely those of the individual author(s) and contributor(s) and not of MDPI and/or the editor(s). MDPI and/or the editor(s) disclaim responsibility for any injury to people or property resulting from any ideas, methods, instructions or products referred to in the content.

