Determination of the Static Bending Properties of Green Beech and Oak Wood by the Frequency Resonance Technique


Abstract
1. Introduction
2. Materials and Methods
2.1. Materials
2.2. Dynamic Measurement
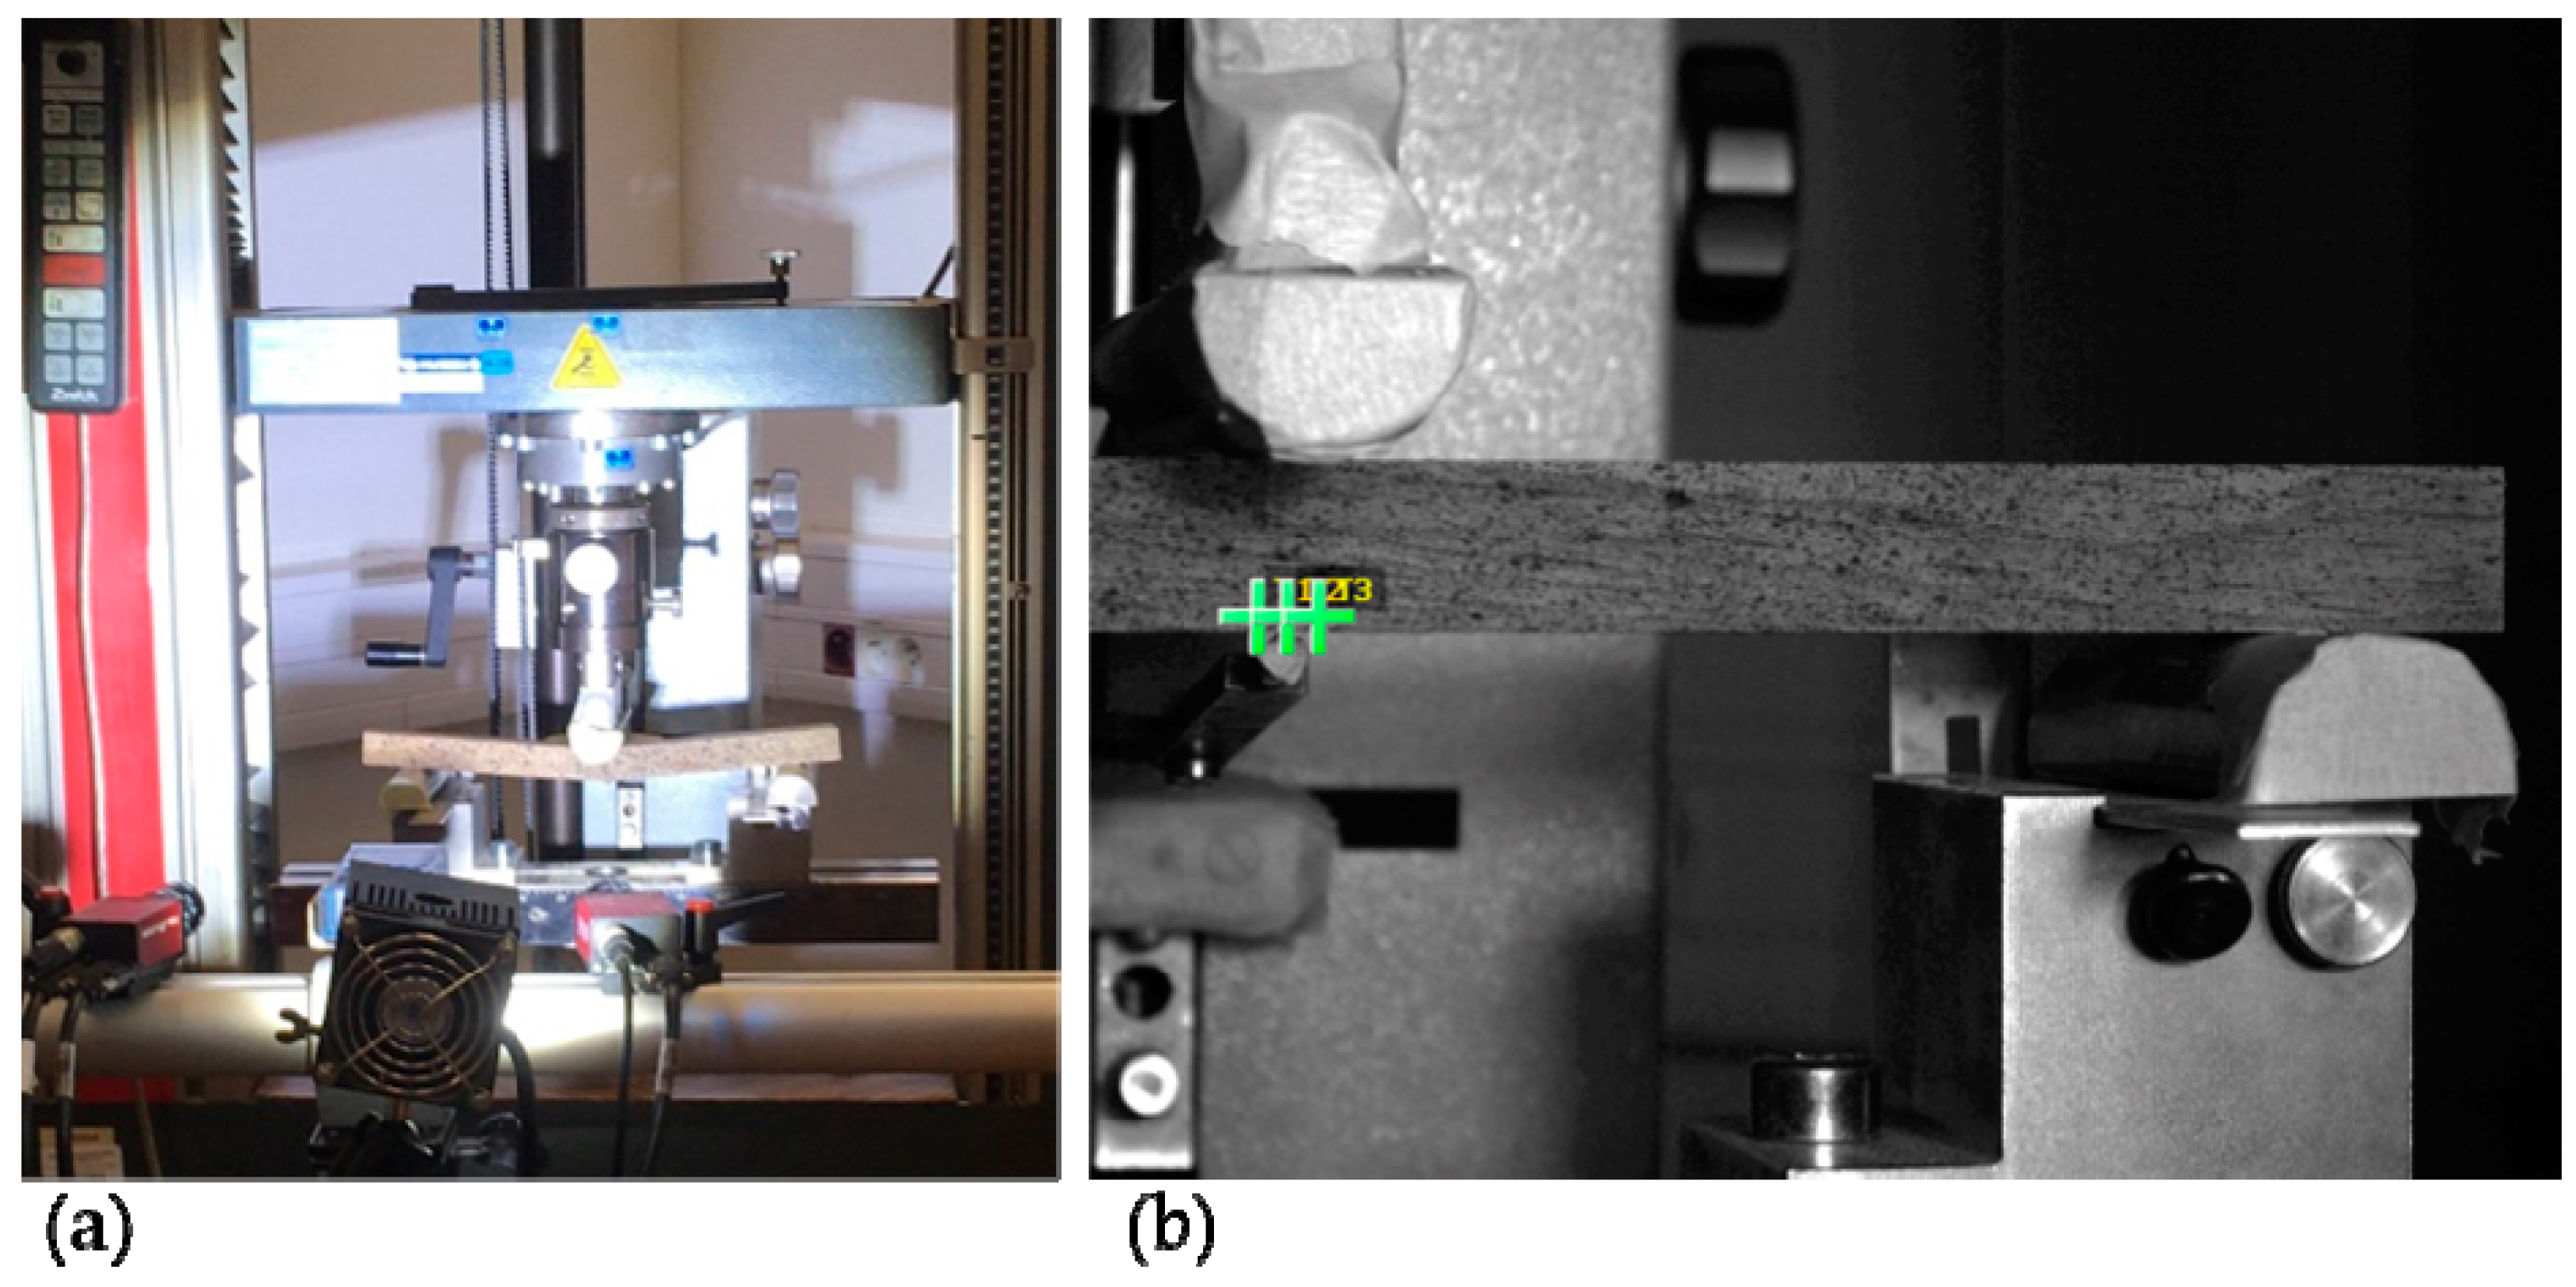
2.3. Static Mechanical Testing
2.4. Determination of Bending Parameters and Data Analysis
3. Results and Discussion
4. Conclusions
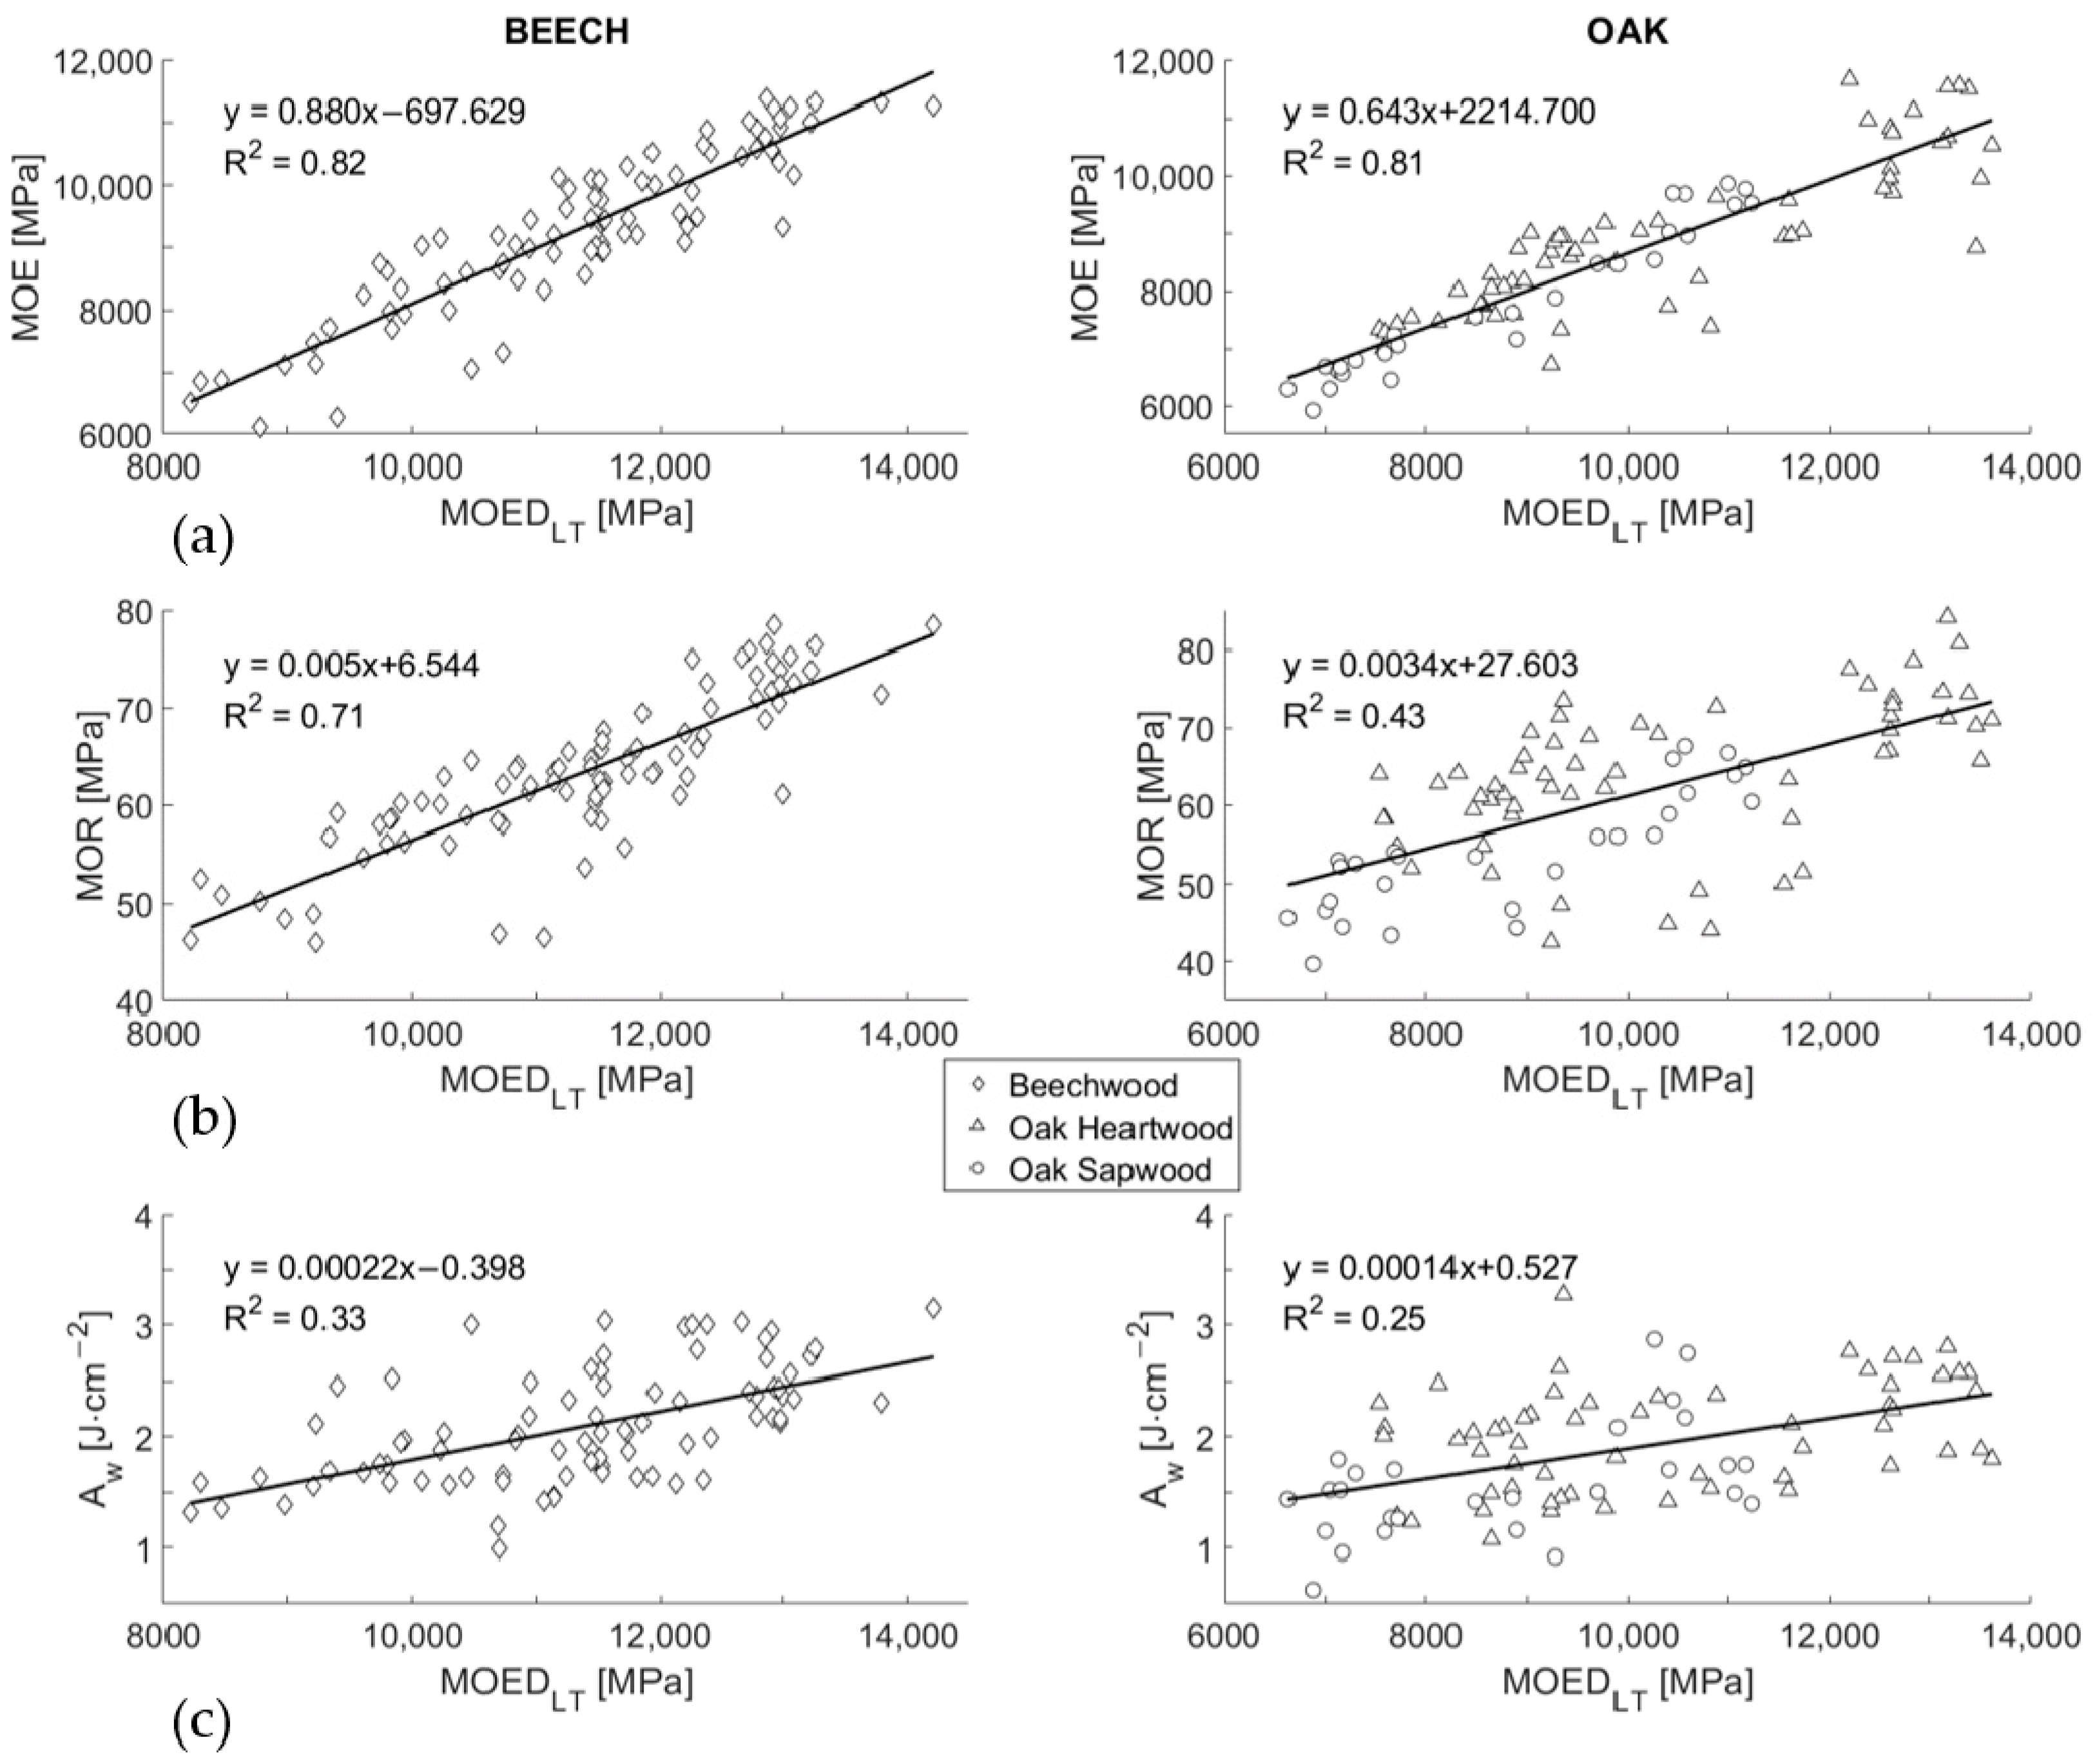
- Significant correlations were found between MOEDLT/LR and static bending properties (R = 0.91 and 0.90 between MOED and MOE; R = 0.84 and 0.66 between MOED and MOR; R = 0.58 and 0.50 between MOED and Aw). The correlation decreased with the degree of involvement of the plastic region of the stress-strain diagram on the static parameter determination. In addition to determining MOE from MOED, it was also possible to determine MOR from MOED for beech, but not for oak (R2 < 0.5). This leads to the conclusion that the possibility of determining static bending properties based on dynamic moduli is also affected by anatomical factors such as vessel dimensions and their arrangement (diffuse-porous and ring-porous species);
- MOED and MOE for oak (as an example of ring-porous hardwoods) could be predicted from ρb. This relationship can be used for a preliminary grading of the investigated species. According to the results, this is not possible for beech (as an example of diffuse-porous species);
- Compared to the similar bending properties reported in the literature for oak heartwood and sapwood with MC around 15%, there were statistically significant differences in the observed bending parameters between heartwood and sapwood above the FSP;
- Among all static parameters, the weakest (not significant) correlation with MOED was proven for Aw. This was caused by the high impact of the plastic deformation zone (typical for green wood) on Aw, while MOED is derived from the elastic material response.
Author Contributions
Funding
Data Availability Statement
Conflicts of Interest
Correction Statement
References
- Spatz, H.C.; Pfisterer, J. Mechanical Properties of Green Wood and Their Relevance for Tree Risk Assessment. Arboric. Urban For. 2013, 39, 218–225. [Google Scholar]
- Llana, D.F.; Short, I.; Harte, A.M. Use of Non-Destructive Test Methods on Irish Hardwood Standing Trees and Small-Diameter Round Timber for Prediction of Mechanical Properties. Ann. For. Sci. 2020, 77, 62. [Google Scholar] [CrossRef]
- Mvondo, R.R.N.; Meukam, P.; Jeong, J.; Meneses, D.D.S.; Nkeng, E.G. Influence of Water Content on the Mechanical and Chemical Properties of Tropical Wood Species. Results Phys. 2017, 7, 2096–2103. [Google Scholar] [CrossRef]
- Nocetti, M.; Brunetti, M.; Bacher, M. Effect of Moisture Content on the Flexural Properties and Dynamic Modulus of Elasticity of Dimension Chestnut Timber. Eur. J. Wood Wood Prod. 2014, 73, 51–60. [Google Scholar] [CrossRef]
- Sandoz, J.L. Moisture Content and Temperature Effect on Ultrasound Timber Grading. Wood Sci. Technol. 1993, 27, 373–380. [Google Scholar] [CrossRef]
- Niklas, K.J.; Spatz, H.C. Worldwide Correlations of Mechanical Properties and Green Wood Density. Am. J. Bot. 2010, 97, 1587–1594. [Google Scholar] [CrossRef]
- Kretschmann, D.E. Chapter 5—Mechanical Properties of Wood. In Wood Handbook—Wood as an Engineering Material; Forest Products Laboratory (US): Madison, WI, USA, 2010; pp. 1–46. [Google Scholar]
- Wessolly, L.; Erb, M. Manual of Tree Statics and Tree Inspection; Patzer Verlag: Berlin/Hanover, Germany, 2016. [Google Scholar]
- Ray, P.M.; Bret-Harte, M.S. Elastic and Irreversible Bending of Tree and Shrub Branches under Cantilever Loads. Front. Plant Sci. 2019, 10, 59. [Google Scholar] [CrossRef] [PubMed]
- Takahashi, Y.; Ishiguri, F.; Aiso, H.; Takashima, Y.; Hiraoka, Y.; Iki, T.; Ohshima, J.; Iizuka, K.; Yokota, S. Inheritance of Static Bending Properties and Classification of Load-Deflection Curves in Cryptomeria Japonica. Holzforschung 2021, 75, 105–113. [Google Scholar] [CrossRef]
- Walley, S.M.; Rogers, S.J. Is Wood a Material? Taking the Size Effect Seriously. Materials 2022, 15, 5403. [Google Scholar] [CrossRef]
- Niemz, P.; Mannes, D. Non-Destructive Testing of Wood and Wood-Based Materials. J. Cult. Herit. 2012, 13 (Suppl. S3), S26–S34. [Google Scholar] [CrossRef]
- Madhoushi, M.; Boskabadi, Z. Relationship between the Dynamic and Static Modulus of Elasticity in Standing Trees and Sawn Lumbers of Paulownia Fortunei Planted in Iran. Cienc. Tecnol. 2019, 21, 35–44. [Google Scholar] [CrossRef]
- Grabianowski, M.; Manley, B.; Walker, J.C.F. Acoustic Measurements on Standing Trees, Logs and Green Lumber. Wood Sci. Technol. 2006, 40, 205–216. [Google Scholar] [CrossRef]
- Yang, T.H.; Wang, S.Y.; Lin, C.J.; Tsai, M.J. Evaluation of the Mechanical Properties of Douglas Fir and Japanese Cedar Lumber and Its Structural Glulam by Nondestructive Techniques. Constr. Build. Mater. 2008, 22, 487–493. [Google Scholar] [CrossRef]
- Qin, R.; Qiu, Q.; Lam, J.H.M.; Tang, A.M.C.; Leung, M.W.K.; Lau, D. Health Assessment of Tree Trunk by Using Acoustic-Laser Technique and Sonic Tomography. Wood Sci. Technol. 2018, 52, 1113–1132. [Google Scholar] [CrossRef]
- Arciniegas, A.; Prieto, F.; Brancheriau, L.; Lasaygues, P. Literature Review of Acoustic and Ultrasonic Tomography in Standing Trees. Trees 2014, 28, 1559–1567. [Google Scholar] [CrossRef]
- Baar, J.; Tippner, J.; Gryc, V. Wood Anatomy and Acoustic Properties of Selected Tropical Hardwoods. IAWA J. 2016, 37, 69–83. [Google Scholar] [CrossRef]
- Faydi, Y.; Brancheriau, L.; Pot, G.; Collet, R. Prediction of Oak Wood Mechanical Properties Based on the Statistical Exploitation of Vibrational Response. BioResources 2017, 12, 5913–5927. [Google Scholar] [CrossRef]
- Nop, P.; Tippner, J. Influence of Dimensions of Wooden Samples for Determination of Acoustic Parameters and Sound Timbre. Appl. Acoust. 2022, 196, 108895. [Google Scholar] [CrossRef]
- Tippner, J.; Vojáčková, B.; Zlámal, J.; Kolařík, J.; Paulic, V.; Funai, J. The Role of Geometry Precision in Frequency-Resonance Method for Non-Destructive Wood Assessment—Numerical Case Study on Sugar Maple. Wood Mater. Sci. Eng. 2022, 18, 792–800. [Google Scholar] [CrossRef]
- ASTM E1876-15; Standard Test Method for Dynamic Young’s Modulus, Shear Modulus and Poisson’s Ratio by Impulse Excitation of Vibration. American Society for Testing and Materials: Philadelphia, PA, USA, 2013. [CrossRef]
- ASTM E1875-20; Standard Test Method for Dynamic Young’s Modulus, Shear Modulus and Poisson’s Ratio by Sonic Resonance. American Society for Testing and Materials: Philadelphia, PA, USA, 2020. [CrossRef]
- Bucur, V. A Review on Acoustics of Wood as a Tool for Quality Assessment. Forests 2023, 14, 1545. [Google Scholar] [CrossRef]
- Chauhan, S.; Sethy, A. Differences in Dynamic Modulus of Elasticity Determined by Three Vibration Methods and Their Relationship with Static Modulus of Elasticity. Cienc. Tecnol. 2016, 18, 373–382. [Google Scholar] [CrossRef]
- Guntekin, E.; Ozkan, S.; Yilmaz, T. Prediction of Bending Properties for Beech Lumber Using Stress Wave Method. Cienc. Tecnol. 2014, 16, 93–98. [Google Scholar] [CrossRef]
- Halabe, U.B.; Bidigalu, G.M.; Gangarao, H.V.S.; Ross, R.J. Nondestructive Evaluation of Green Wood Using Stress Wave and Transverse Vibration Techniques. Mater. Eval. 1995, 55, 1013–1018. [Google Scholar]
- Carreira, M.R.; Dias, A.A. Influence of Moisture Content on the Dynamic Modulus of Elasticity; Influência do Teor de Umidade no Módulo de Elasticidade Dinâmico; Influencia del Contenido de Humedad en el Módulo Dinámico de Elasticidad. Res. Soc. Dev. 2022, 11, e232111133687. [Google Scholar] [CrossRef]
- Ross, R.J. (Ed.) Nondestructive Evaluation of Wood, 2nd ed.; General Technical Report FPL-GTR-238; Department of Agriculture, Forest Service, Forest Products Laboratory: Madison, WI, USA, 2015; 169p.
- Unterwieser, H.; Schickhofer, G. Influence of Moisture Content of Wood on Sound Velocity and Dynamic MOE of Natural Frequency and Ultrasonic Runtime Measurement. Eur. J. Wood Wood Prod. 2011, 69, 171–181. [Google Scholar] [CrossRef]
- Rais, A.; Pretzsch, H.; van de Kuilen, J. European Beech Log and Lumber Grading in Wet and Dry Conditions Using Longitudinal Vibration. Holzforschung 2020, 74, 939–947. [Google Scholar] [CrossRef]
- Emmerich, L.; Wülfing, G.; Brischke, C. The Impact of Anatomical Characteristics on the Structural Integrity of Wood. Forests 2019, 10, 199. [Google Scholar] [CrossRef]
- Plos, M.; Fortuna, B.; Šuligoj, T.; Turk, G. From Visual Grading and Dynamic Modulus of European Beech (Fagus sylvatica) Logs to Tensile Strength of Boards. Forests 2022, 13, 77. [Google Scholar] [CrossRef]
- Purba, C.Y.C.; Dlouha, J.; Ruelle, J.; Fournier, M. Mechanical Properties of Secondary Quality Beech (Fagus sylvatica L.) and Oak (Quercus petraea (Matt.) Liebl.) Obtained from Thinning, and Their Relationship to Structural Parameters. Ann. For. Sci. 2021, 78, 81. [Google Scholar] [CrossRef]
- ASTM D143-22; Standard Test Methods for Small Clear Specimens of Timber. American Society for Testing and Materials: Philadelphia, PA, USA, 2022.
- BS 373; British Standard: Methods of Testing Small Clear Specimens of Timber. British Standard Institution: London, UK, 1957.
- ASTM D2395; Standard Test Methods for Density and Specific Gravity (Relative Density) of Wood and Wood-Based Materials. American Society for Testing and Materials: Philadelphia, PA, USA, 2014.
- ČSN 49 0115; Wood. Determination of the Modulus of Rupture in Static Bending [in Slovak]. Office for Standardization and Measurement: Prague, Czech Republic, 1979.
- ČSN 49 0116; Wood. Method for Determination of Modulus of Elasticity in Static Bending [in Slovak]. Office for Standardization and Measurement: Prague, Czech Republic, 1986.
- Borůvka, V.; Novák, D.; Šedivka, P. Comparison and Analysis of Radial and Tangential Bending of Softwood and Hardwood at Static and Dynamic Loading. Forests 2020, 11, 896. [Google Scholar] [CrossRef]
- Brischke, C. Interrelationship between Static and Dynamic Strength Properties of Wood and its Structural Integrity. Drv. Ind. 2017, 68, 53–60. [Google Scholar] [CrossRef]
- Arnold, M. Effect of Moisture on the Bending Properties of Thermally Modified Beech and Spruce. J. Mater. Sci. 2010, 45, 669–680. [Google Scholar] [CrossRef]
- Ruiz-Aquino, F.; González-Peña, M.M.; Valdez-Hernández, J.I.; Romero-Manzanares, A.; Fuentes-Salinas, M. Mechanical Properties of Wood of Two Mexican Oaks: Relationship to Selected Physical Properties. Eur. J. Wood Wood Prod. 2018, 76, 69–77. [Google Scholar] [CrossRef]
- Merela, M.; Čufar, K. Density and Mechanical Properties of Oak Sapwood versus Heartwood. Drv. Ind. 2013, 64, 323–334. [Google Scholar] [CrossRef]
- Teranishi, M.; Koizumi, A.; Hirai, T. Evaluation of Quality Indexes of Bending Performance and Hardness for Hardwoods. J. Wood Sci. 2008, 54, 423–428. [Google Scholar] [CrossRef]
- Muñoz, G.R.; Gete, A.R. Prediction of Strength and Elasticity in Oak Beams on the Basis of External Wood Characteristics. Adv. Mater. Res. 2013, 778, 152–158. [Google Scholar] [CrossRef]
- Muñoz, G.R.; Gete, A.R. Relationships between Mechanical Properties of Oak Timber (Quercus robur L.). Holzforschung 2011, 65, 749–755. [Google Scholar] [CrossRef]


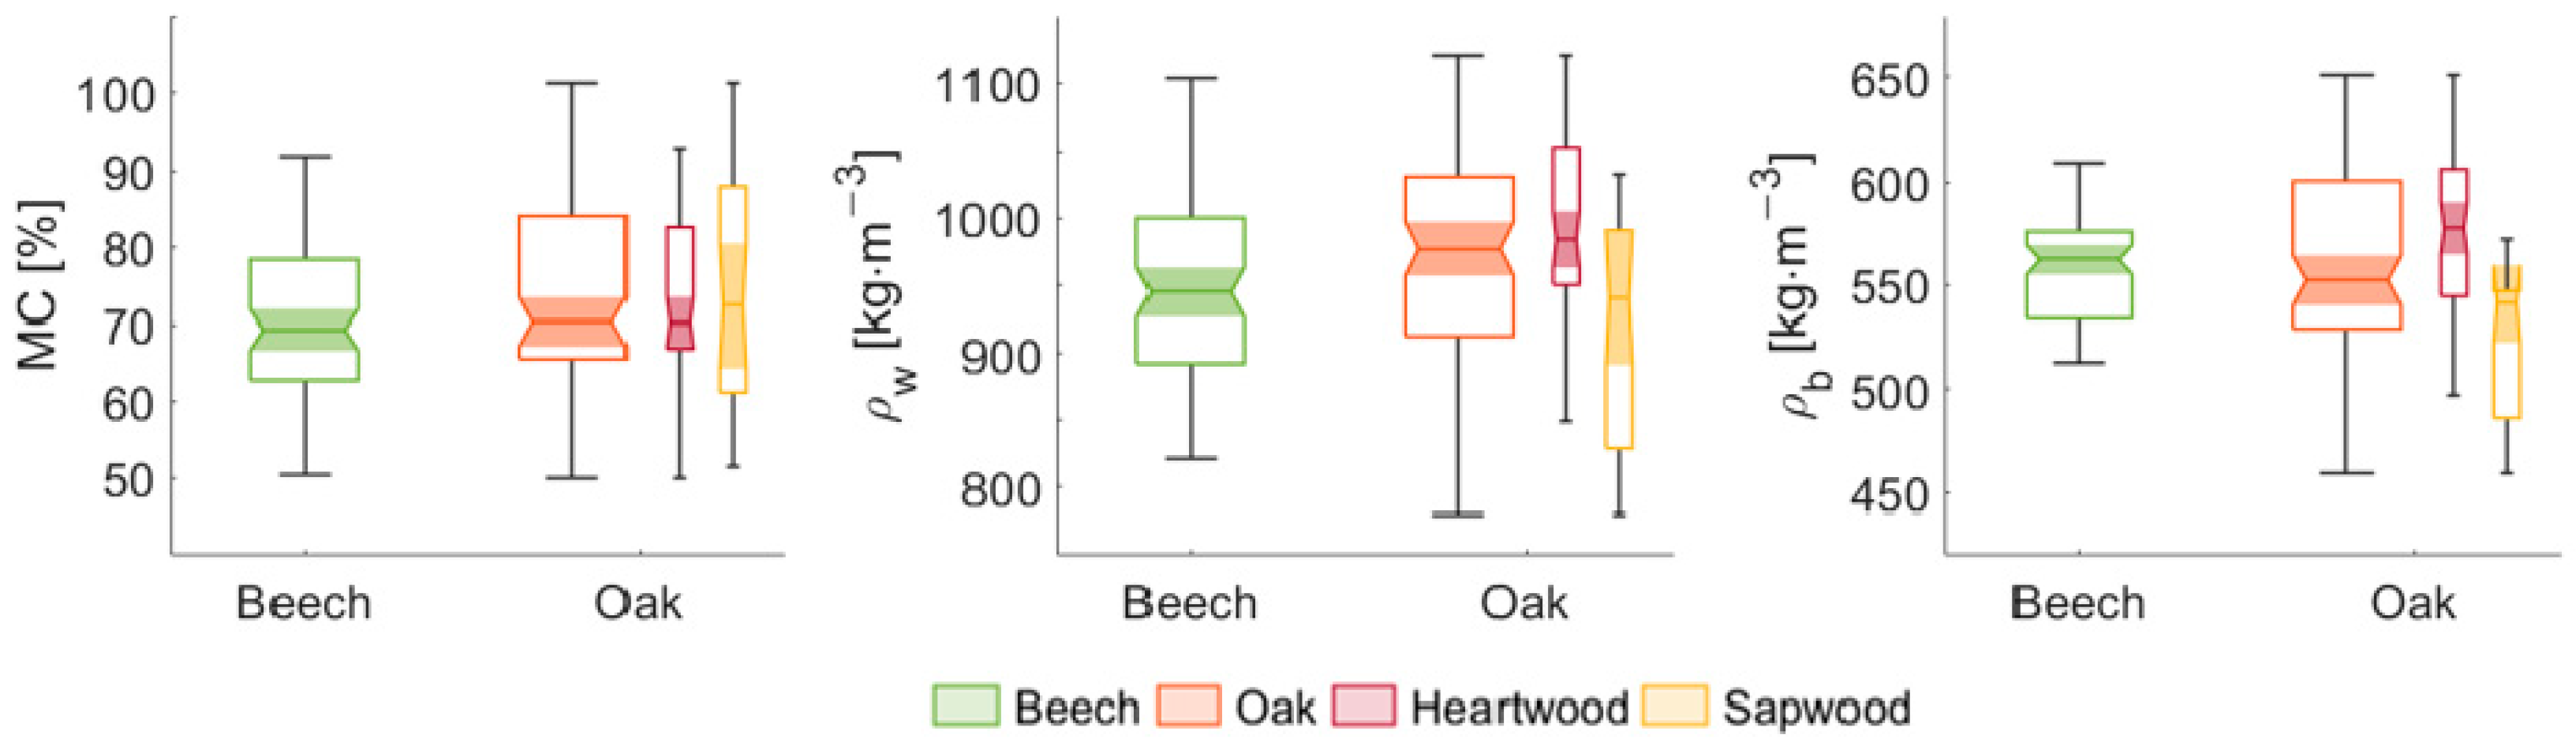
| Species | MC [%] | ρw [kg·m−3] | ρb [kg·m−3] |
|---|---|---|---|
| Beech (Fagus sylvatica L.) | 69 (14.8%) | 945 (7.1%) | 562 (4.3%) |
| Oak (Quercus robur L.) | 70 (17.6%) | 977 (8.6%) | 552 (8.4%) |
| Heartwood | 70 (14.9%) | 984 (7.1%) | 578 (7.3%) |
| Sapwood | 72 (21.9%) | 940 (9.3%) | 541 (6.4%) |
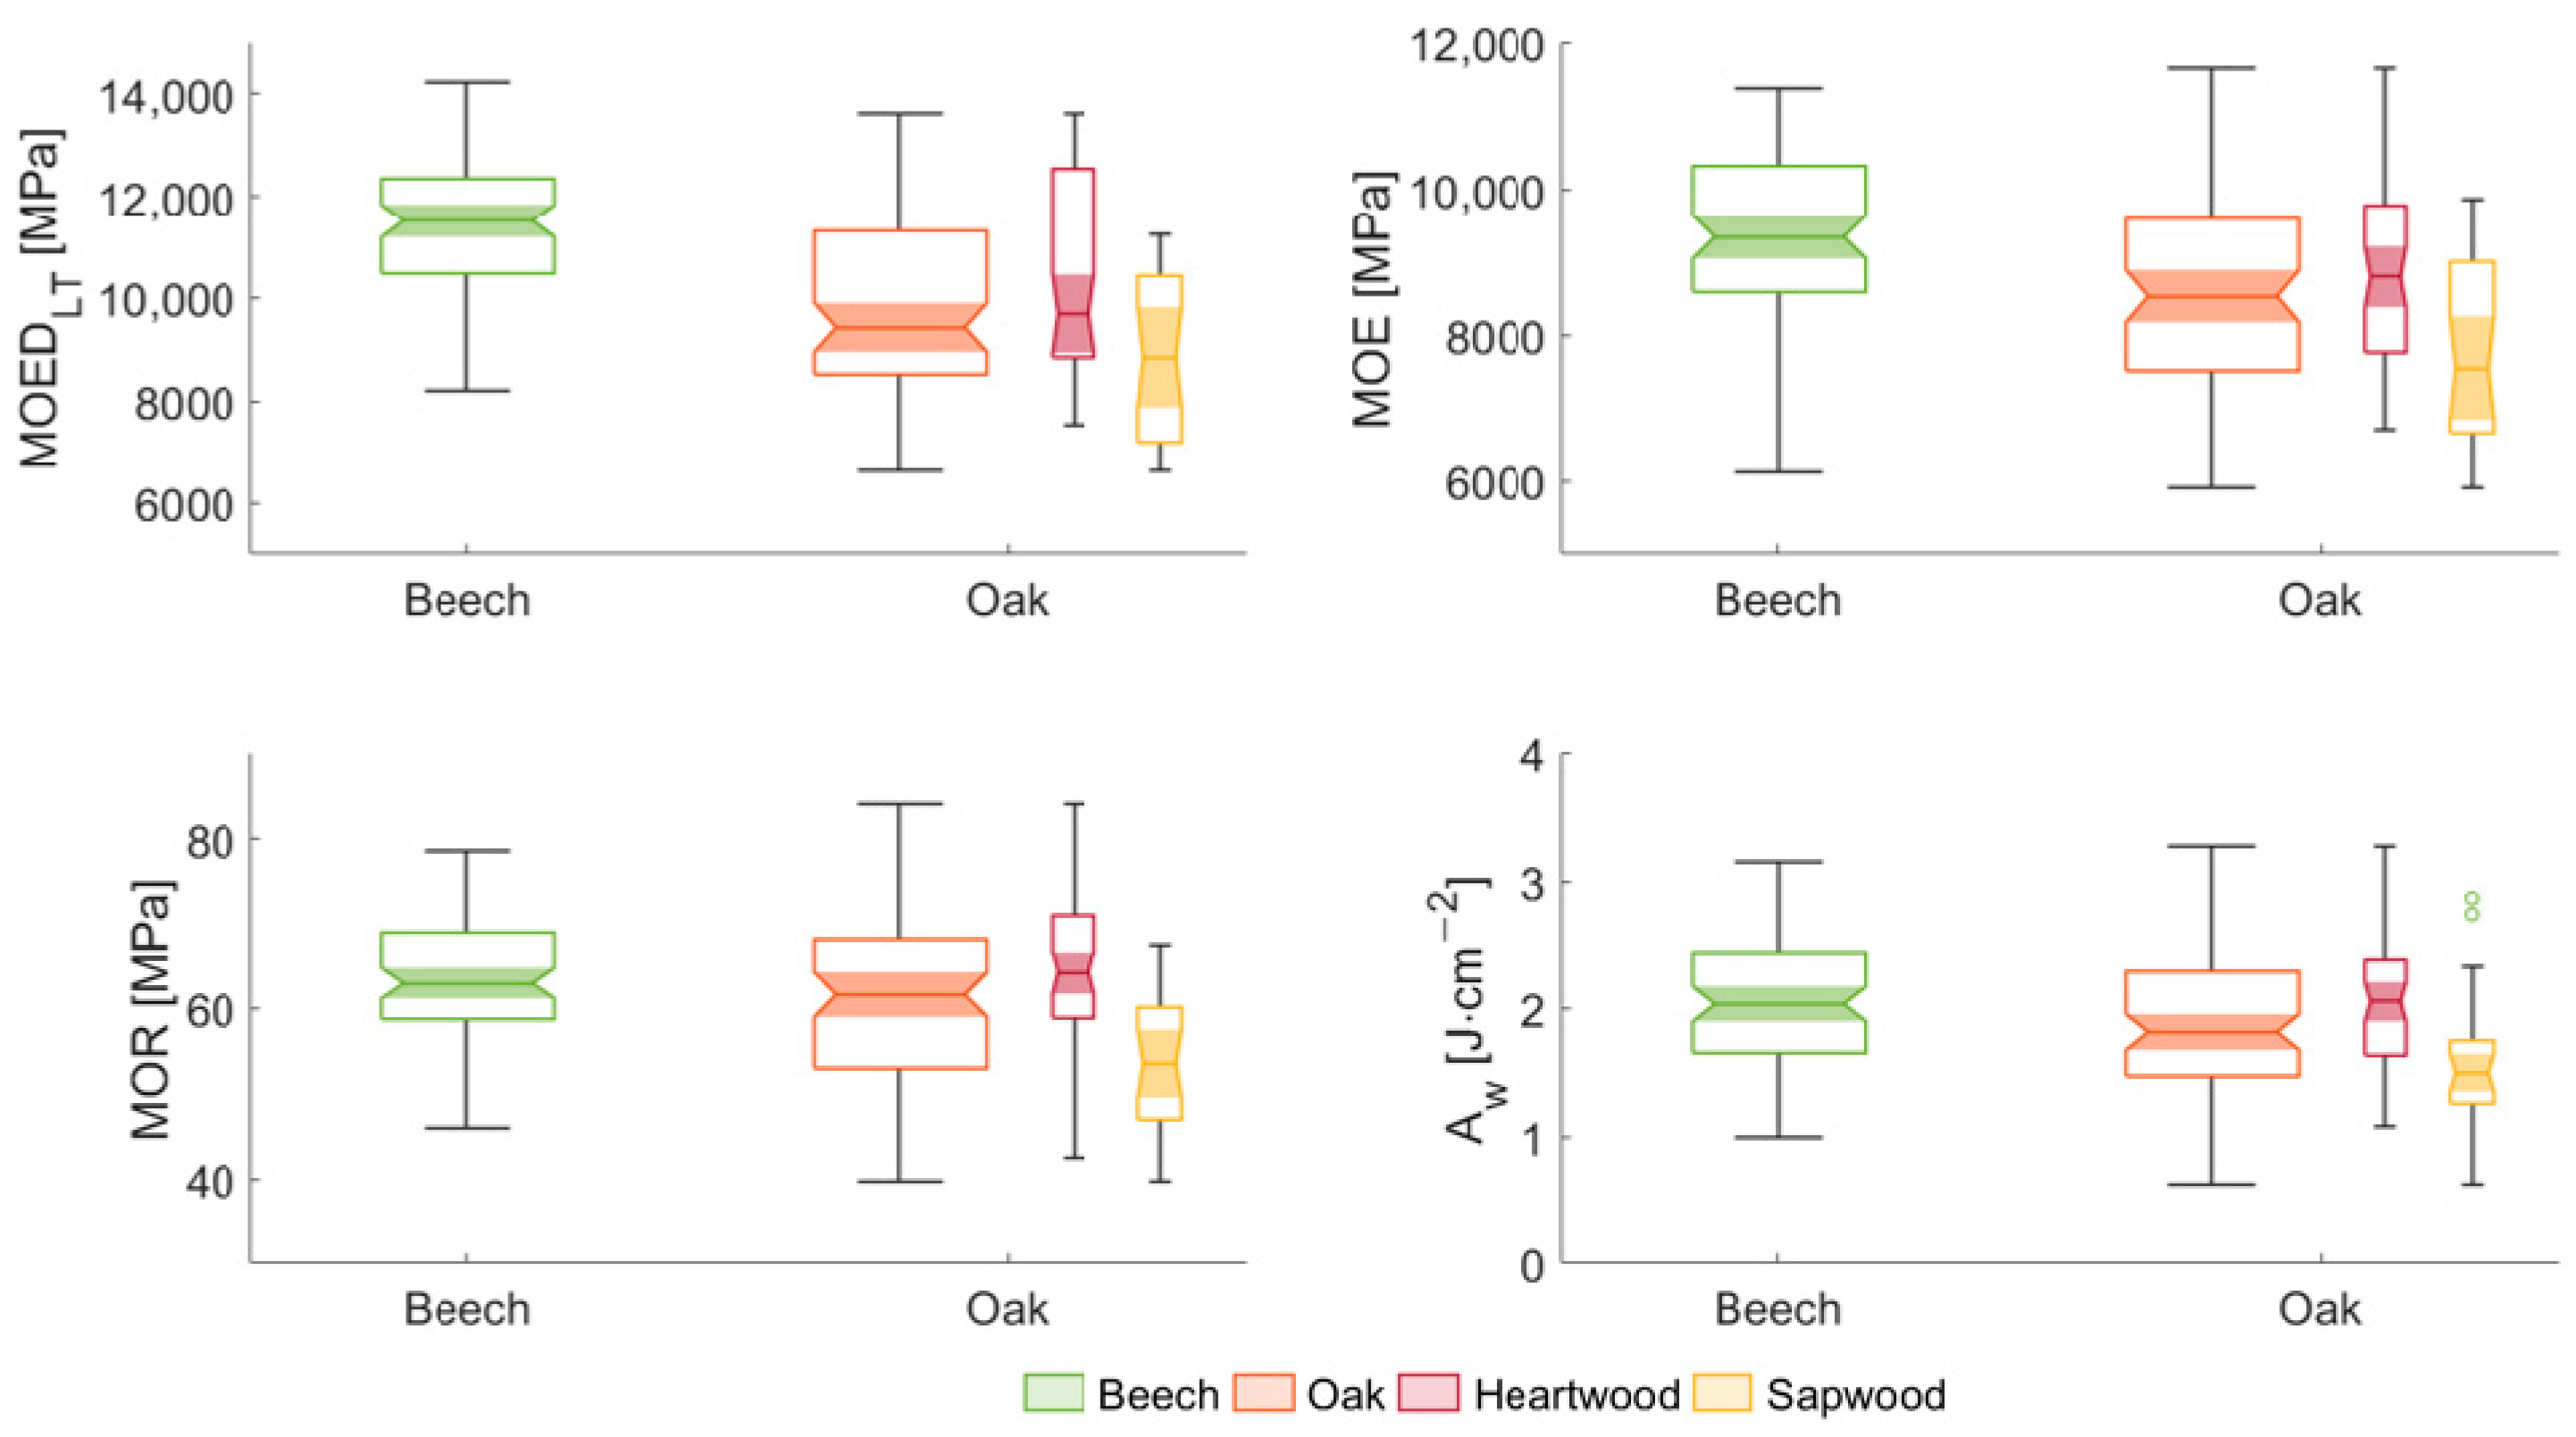
| Species | MOEDLT [MPa] | MOEDLR [MPa] | MOE [MPa] | MOR [MPa] | Aw [J·cm−2] |
|---|---|---|---|---|---|
| Beech (Fagus sylvatica L.) | 11,518 (11.6%) | 11,620 (12.2%) | 9338 (13.9%) | 62.9 (12.6%) | 2.03 (24.9%) |
| Oak (Quercus robur L.) | 9435 (20.7%) | 9420 (19.3%) | 8530 (16.4%) | 61.6 (16.3%) | 1.81 (29.2%) |
| Heartwood | 9703 (19.8%) | 10,094 (19.1%) | 8792 (14.9%) | 64.2 (14.6%) | 2.05 (23.5%) |
| Sapwood | 8854 (18.3%) | 9148 (18.1%) | 7551 (17.2%) | 53.5 (14.6%) | 1.5 (34.5%) |
 |
 |
Disclaimer/Publisher’s Note: The statements, opinions and data contained in all publications are solely those of the individual author(s) and contributor(s) and not of MDPI and/or the editor(s). MDPI and/or the editor(s) disclaim responsibility for any injury to people or property resulting from any ideas, methods, instructions or products referred to in the content. |
© 2024 by the authors. Licensee MDPI, Basel, Switzerland. This article is an open access article distributed under the terms and conditions of the Creative Commons Attribution (CC BY) license (https://creativecommons.org/licenses/by/4.0/).
Share and Cite
Nop, P.; Cristini, V.; Zlámal, J.; Vand, M.H.; Šeda, V.; Tippner, J. Determination of the Static Bending Properties of Green Beech and Oak Wood by the Frequency Resonance Technique. Forests 2024, 15, 150. https://doi.org/10.3390/f15010150
Nop P, Cristini V, Zlámal J, Vand MH, Šeda V, Tippner J. Determination of the Static Bending Properties of Green Beech and Oak Wood by the Frequency Resonance Technique. Forests. 2024; 15(1):150. https://doi.org/10.3390/f15010150
Chicago/Turabian StyleNop, Patrik, Valentino Cristini, Jan Zlámal, Mojtaba Hassan Vand, Vít Šeda, and Jan Tippner. 2024. "Determination of the Static Bending Properties of Green Beech and Oak Wood by the Frequency Resonance Technique" Forests 15, no. 1: 150. https://doi.org/10.3390/f15010150
APA StyleNop, P., Cristini, V., Zlámal, J., Vand, M. H., Šeda, V., & Tippner, J. (2024). Determination of the Static Bending Properties of Green Beech and Oak Wood by the Frequency Resonance Technique. Forests, 15(1), 150. https://doi.org/10.3390/f15010150