Article

Analyzing the Impact of Simulated Nitrogen Deposition on Stoichiometric Properties and Yield of Ma Bamboo (Dendrocalamus latiflorus Munro) Shoots, Leaves, and Soil Substrate

1
Forestry College, Fujian Agriculture and Forestry University, Fuzhou 350002, China
2
College of Landscape Architecture and Art, Fujian Agriculture and Forestry University, Fuzhou 350002, China
*
Author to whom correspondence should be addressed.
Forests 2024, 15(1), 151; https://doi.org/10.3390/f15010151
Submission received: 2 December 2023 / Revised: 27 December 2023 / Accepted: 29 December 2023 / Published: 11 January 2024
(This article belongs to the Section Forest Ecophysiology and Biology)

Abstract

:
The growth dynamics of Ma bamboo (Dendrocalamus latiflorus Munro) are intricately linked to nitrogen availability, a pivotal nutrient. Escalating global nitrogen deposition, primarily driven by anthropogenic factors, is reshaping nutrient fluxes and productivity within forest and bamboo ecosystems. Such alterations bear significant implications for the growth equilibrium and yields of rapid-growth species such as Ma bamboo, thereby influencing their sustainable management strategies. This investigation delves into the responses of Ma bamboo under varying nitrogen deposition scenarios (0 g·clump−1, 11.2 g·clump−1, 13.5 g·clump−1, and 22.5 g·clump−1), examining stoichiometric attributes in bamboo shoots, leaves, and soil across distinct growth phases. Our empirical findings reveal that in the early growth stage, nitrogen enrichment markedly augmented N and P concentrations in the foliage and shoots, alongside a corresponding enhancement in soil P content. This was paralleled by a substantial reduction in the C:N ratio in leaves and the C:P ratio in shoots and soil, indicating an amplified uptake of P and N in both plant and soil matrices. During the middle stage, all nitrogen treatments boosted nitrogen levels across various plant tissues, while concurrently, soil C content exhibited a notable decline with increased nitrogen supplementation. In the late stage, leaf and soil N content continued to ascend; however, alterations in C content in both soil and leaves were not pronounced. Contrastingly, N and P levels in shoots showed a gradual decrement. Yield assessments disclosed that during the early stage, the N3 treatment (22.5 g·clump−1) not only delayed shoot emergence by 14 days but also surged the yield by 115.87% in comparison to the control (CK). In the late stage, the N2 treatment (13.5 g·clump−1) extended emergence duration by 10 days, with the yield apex under N3 treatment (22.5 g·clump−1) evidencing a 116.67% yield augmentation over CK. In summation, this study elucidates the stoichiometric balancing and distribution strategies within the plant–soil system of Ma bamboo, investigating its adaptability and responsive feedback to diverse nitrogen deposition gradients. This research contributes to a deeper understanding of plant nutrient adaptation mechanisms in the context of nitrogen deposition, enriches the discourse on plant population stoichiometry, and offers valuable insights and scientific underpinnings for broader-scale community or ecosystem stoichiometry studies.

1. Introduction

As China’s industrialization progresses, nitrogen deposition has been escalating, with levels in China now markedly surpassing the global average [1,2]. This intensifying nitrogen deposition significantly influences plant growth, metabolism, and nutrient stoichiometry regulation within forest ecosystems [3,4]. The stoichiometric balance of carbon (C), nitrogen (N), and phosphorus (P) in plants is crucial, reflecting their elemental proportions in physiological and ecological contexts [5,6]. C, essential for synthesizing plant cellular structures and organic compounds, is primarily obtained through photosynthesis. Nitrogen, vital for protein and nucleic acid construction, often limits plant growth due to its crucial role in amino acid and protein synthesis. Phosphorus, key in energy transduction and as a genetic material component, is indispensable for maintaining cellular functionality and plant development. The interaction and relative proportions of these elements, especially under increased nitrogen deposition, are pivotal in determining plant growth rates, physiological efficiency, and environmental adaptability [6].
Recent studies have shown that nitrogen deposition alters nitrogen allocation in ecosystems, speeding up nitrogen cycling and impacting C-N-P stoichiometry by changing nutrient availability and mineralization rates in soil. Atmospheric nitrogen’s entry into terrestrial ecosystems significantly disrupts soil elemental balance, influenced by plant uptake and microbial assimilation [7,8]. Sun et al. [9] observed that nitrogen addition significantly increases soil C, N, and P levels while altering soil C:N ratios, varying with ecosystem type, nitrogen intensity, and duration. Conversely, Li et al. [10] noted minimal impact on soil P due to nitrogen addition, leading to higher soil N:P and C:P ratios. Over a decade, Li et al. [11] found unchanged soil N, P, and N:P ratios in subtropical forests, attributed to shifts in organic nitrogen and NH4+ content under local climatic conditions. Hence, the effects of nitrogen addition on soil C-N-P stoichiometry remain an open question.
Nitrogen deposition also affects the intricate relationship between plants and soil, indirectly influencing plant nutrient properties by altering soil nutrients. In nitrogen-poor areas, nitrogen deposition typically enhances plant leaf nutrient content. For instance, Xu et al. [12] found that nitrogen deposition increases leaf N in Quercus variabilis and Quercus mongolica seedlings, alleviating drought stress effects. Yuan et al. [13] reported significant leaf N content increases with nitrogen deposition. In tropical areas, Feng et al. [14] discovered that nitrogen deposition boosts phosphatase activity in forest soils, enhancing soil P availability and plant P absorption, thereby increasing leaf P content. However, increasing nitrogen deposition elevates leaf N content in both woody and herbaceous plants, without significantly altering leaf P content [8,15,16]. Liu et al. [17] noted that excessive nitrogen leads to stoichiometric imbalances in plants, decreasing growth rates and biomass accumulation, and increasing phenolic compounds. Plant nutrient responses to nitrogen deposition are influenced by climate and species, with nitrogen deposition reducing leaf P content and increasing leaf N:P ratios in Picea asperata, Pinus armandii, and Cunninghamia lanceolata [18]. Short-term nitrogen deposition impacts bamboo and soil stoichiometry, with increased leaf C, N, and P content in Moso bamboo, correlating with nitrogen deposition intensity [19]. Zhang et al. [20] observed Moso bamboo’s stoichiometric sensitivity to nitrogen deposition, with varied responses of C, N, and P ratios among different bamboo ages. Song et al. [21] studied nitrogen deposition’s impact on Moso bamboo leaf stoichiometry under various management practices, finding increased leaf N and P concentrations but decreased leaf N:P ratio. However, exceeding 60 kg N per hectare negates these benefits, exacerbating P deficiency. Research on bamboo plants within plant–soil systems under nitrogen deposition, particularly during different shoot periods, is still limited and warrants further exploration.
Ma bamboo (Dendrocalamus latiflorus Munro), a significant bamboo resource in southern China, is renowned for its short growth cycles and rapid growth rates [22,23]. Widely used in construction, furniture, and handicrafts, and with its nutritionally rich shoots used in Asian cuisine, Ma bamboo also plays a crucial role in ecological engineering and carbon sequestration for sustainable development. The impact of varying nitrogen deposition intensities on the chemical stoichiometry of Ma bamboo shoots, leaves, and soil remains underexplored. Our study focused on 5-year-old seedlings, using different nitrogen levels (0 g·clump−1, 11.2 g·clump−1, 13.5 g·clump−1, and 22.5 g·clump−1) to simulate varying nitrogen deposition effects on bamboo shoot, leaf, and soil stoichiometry. We employed structural equation modeling to investigate nitrogen’s direct and indirect roles in Ma bamboo growth and production, aiming to elucidate the link between bamboo productivity and limiting nutrients. This study seeks to provide a theoretical basis for the adaptive cultivation of Ma bamboo amidst increasing nitrogen deposition.

2. Materials and Methods

The study locale is situated in Fuzhou City, within Fujian Province, China, geographically positioned at 26°5′ N latitude and 119°14′ E longitude. This area is characterized by its subtropical monsoon climate, as illustrated in Figure 1. Predominantly, the climate is warm and humid, marked by substantial solar irradiation and copious precipitation. Statistical climatic data indicate an average annual rainfall of approximately 1500 mm, accompanied by a mean yearly temperature of 20.8 °C. The region benefits from an average of 1685 h of sunshine per annum. Furthermore, it boasts a prolonged frost-free duration, extending approximately 326 days annually.
For the potted bamboo plants used in our experiments, soil samples were collected at three different shoot stages, and relevant parameters were measured. The fundamental chemical properties of the potted soil are presented in Table 1 for reference.

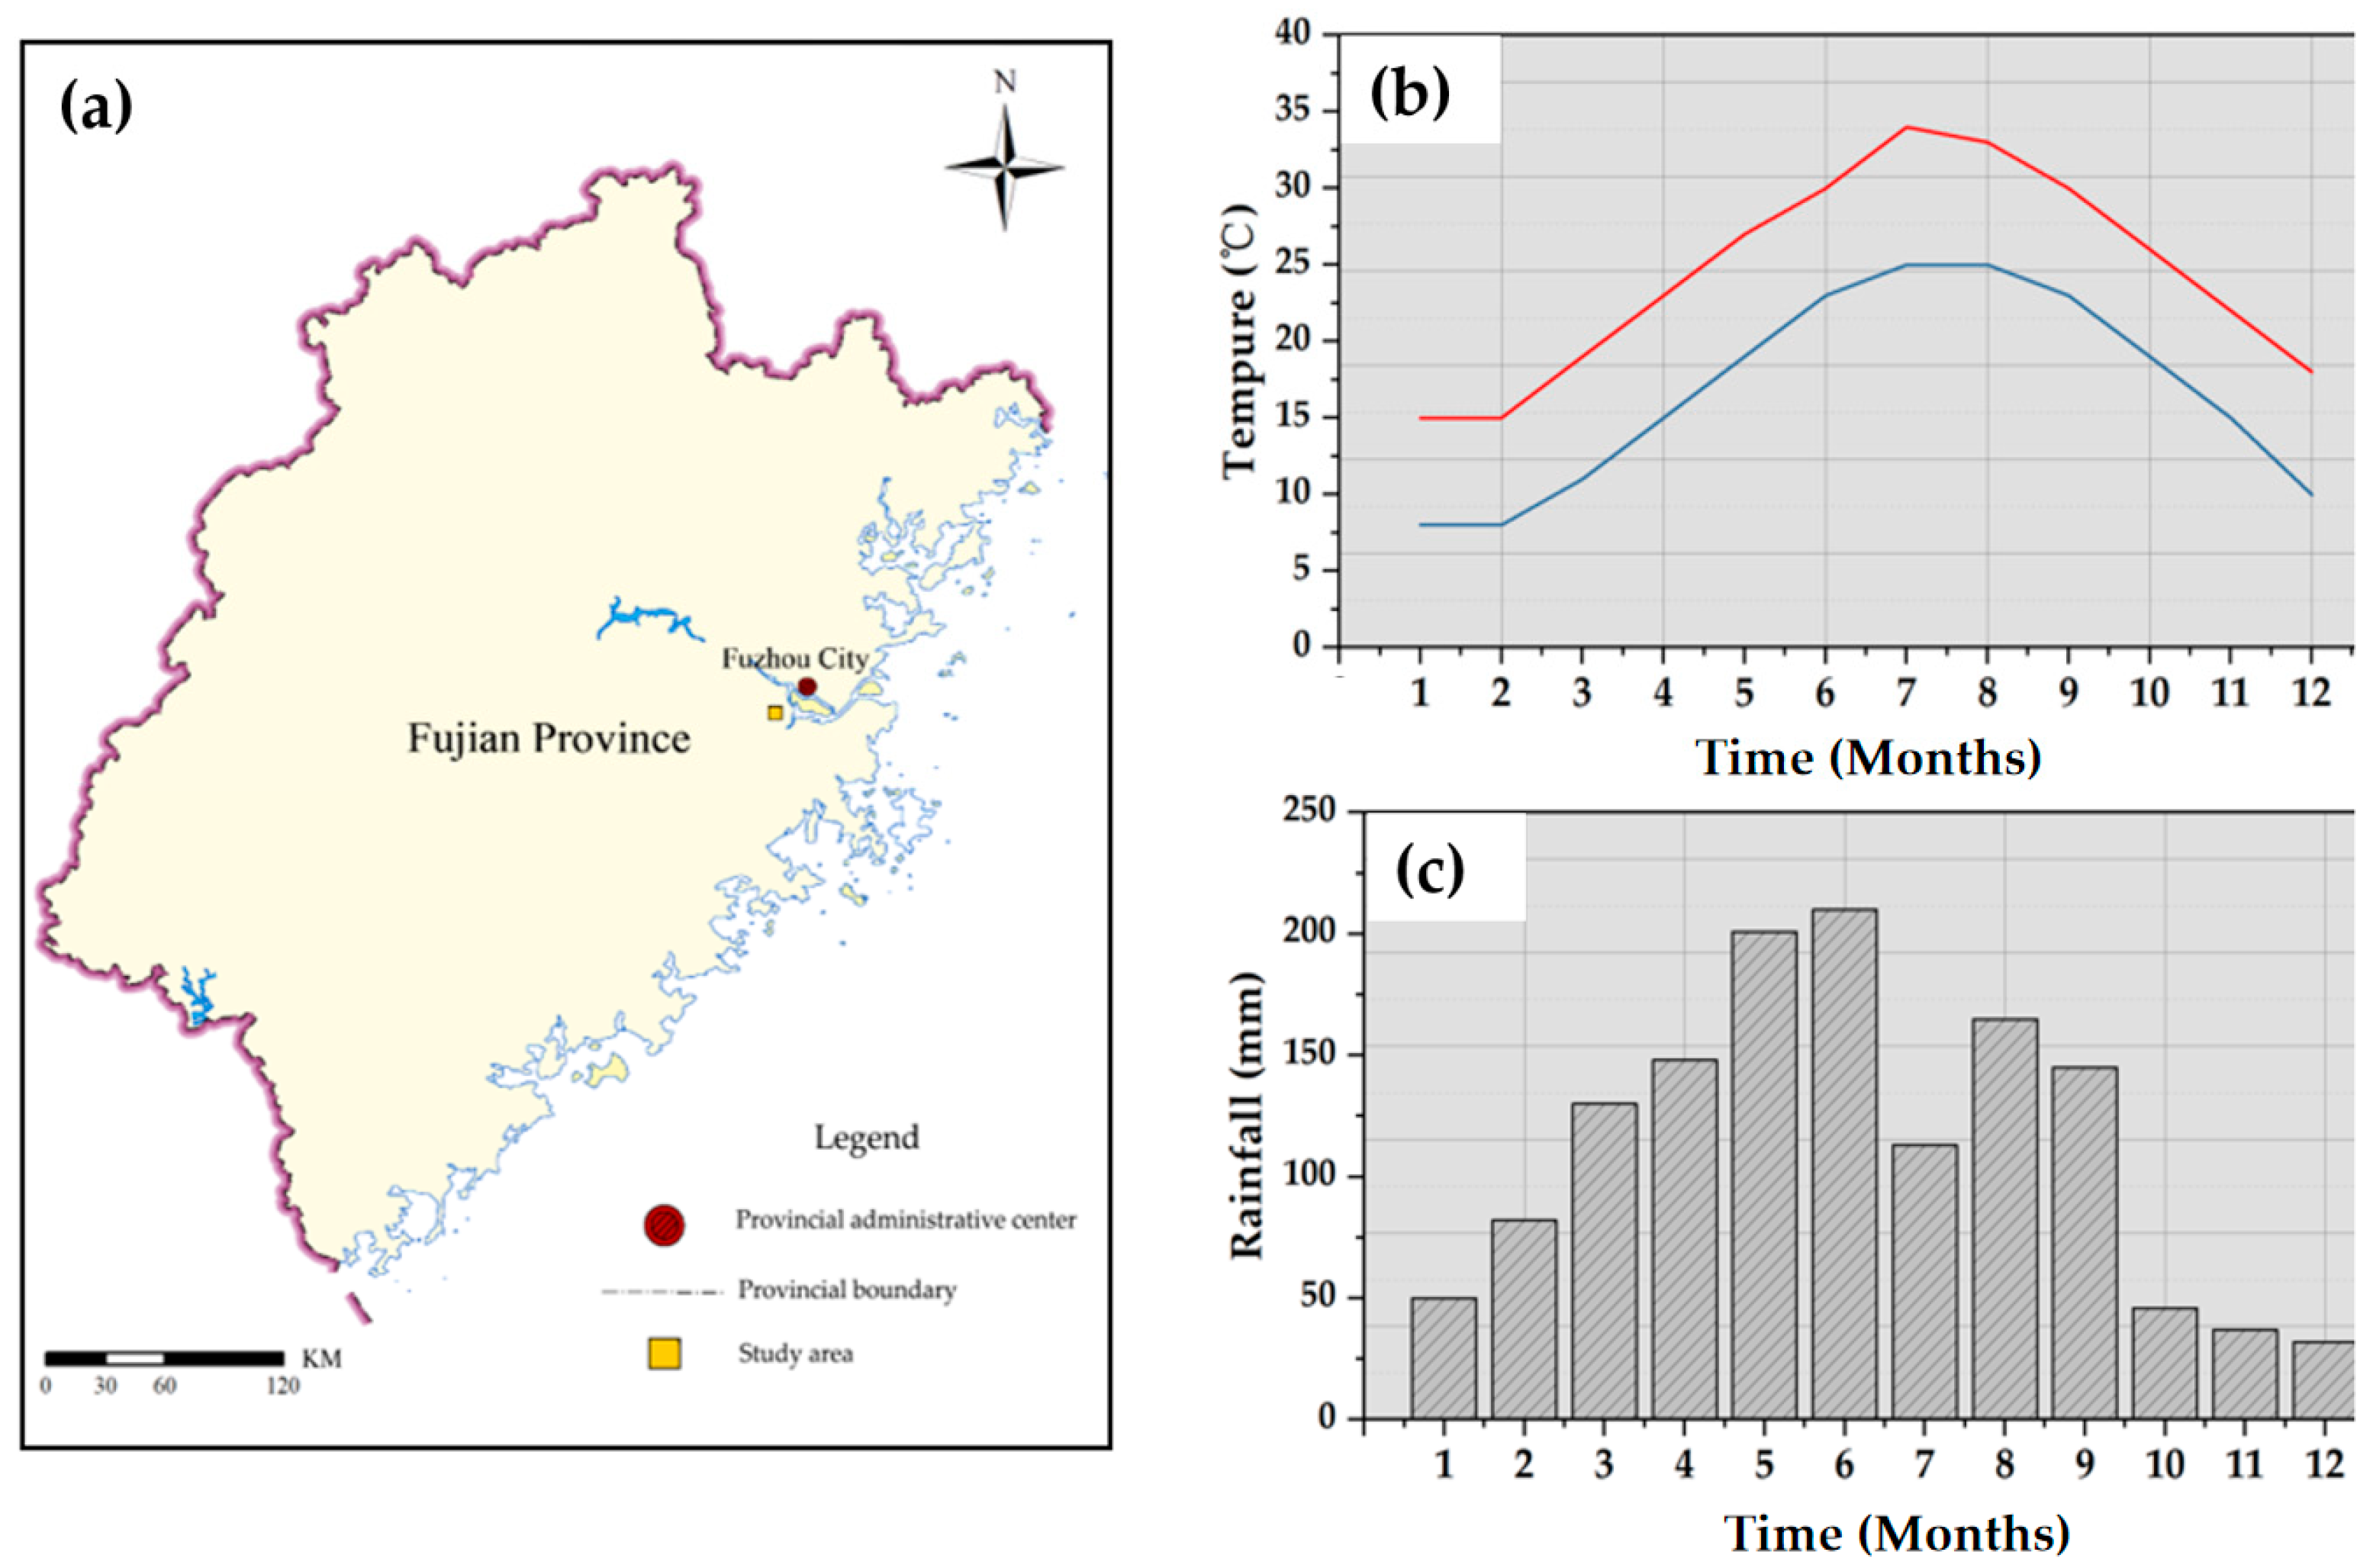
2.1. Experimental Materials

In this research, we utilized five-year-old seedlings of Phyllostachys edulis as our experimental subjects. Each seedling was meticulously examined to document key growth parameters. These included the diameter at breast height (DBH) of the bamboo, overall plant height, crown width, and the height of the branches. We selected a cohort of 60 Phyllostachys edulis specimens, all demonstrating comparable growth conditions, for our study. These specimens were methodically numbered from 1 to 60.
To maintain consistent conditions conducive to the experiment, we employed standard horticultural practices, including weeding and pruning, at the site. A critical component of this study involved simulating nitrogen deposition. To this end, urea, with a nitrogen content of 46%, was chosen as the nitrogen source. This approach allowed us to closely examine the impact of nitrogen on the growth dynamics of Phyllostachys edulis under controlled conditions.

2.2. Nitrogen Deposition Simulation and Sample Collection

Nitrogen treatments were applied to Phyllostachys edulis during the period from May to September 2021. Four nitrogen treatment levels were used: 0 g·cluster−1 (CK control group), 11.2 g·cluster−1 (N1), 13.5 g·cluster−1 (N2), and 22.5 g·cluster−1 (N3). Each treatment had five replicates, resulting in a total of 15 pots per treatment. Nitrogen was applied in three stages, namely, early shoot stage, middle shoot stage, and late shoot stage, at proportions of 30%, 40%, and 30%, respectively. In this experiment, the growth of Phyllostachys edulis shoots exhibited distinct phases, with shoots initiating from late May to late June (early shoot stage), a substantial increase from early July to late August (middle shoot stage), and reduced shoot production from early September to early October (late shoot stage). These shoot development phases were used to determine the timing of nitrogen application. The day following nitrogen application was considered the first day, and subsequent measurements were taken accordingly, with sampling performed 30 days after nitrogen application, using bamboo leaf samples.
The nitrogen was applied by dissolving urea in an appropriate amount of water and directly applying the solution to the soil. All seedlings received an equal degree of pruning to ensure consistent light intensity. On the morning of the 30th day after nitrogen application, between 9:00 am and 11:00 am, leaf samples were collected from each pot of Phyllostachys edulis plants, including leaves from the upper, middle, and lower canopy layers, which were subsequently mixed for each canopy layer. Soil samples were collected 30 days after nitrogen application by mixing samples from the CK, N1, N2, and N3 treatments. Bamboo shoot samples were collected after reaching a height of 50 cm or more.

2.3. Indicator Determination

For each leaf, soil, and bamboo shoot sample, they were individually placed in parchment paper bags and placed in a YETUO 101-2A drying chest (YETUO Technology Co., Ltd., Shanghai, China). The samples were withered at 105 °C for 30 min and then dried at a constant temperature of 70 °C until a constant weight was achieved. The leaves and shoots were ground using a F-GT-24 high-throughput tissue grinder (Focucy Technology Co., Ltd., Changsha, China) and stored in centrifuge tube. The soil samples were air-dried and sieved through a 0.149 mm mesh filter, with each sample weighing 1.0 g. The determination methods were as follows: total N was analyzed using the Kjeldahl semi-micro determination method [24]. Total P was determined using the sulfuric acid–perchloric acid digestion method [25,26,27]. Organic C was determined using the potassium dichromate oxidation method with additional heating [28,29].

2.4. Data Analysis and Processing

2.4.1. Partial Least Squares Structural Equation Model

In this study, a partial least squares structural equation model (PLS-SEM) was used to analyze the effects of nitrogen addition on the chemical stoichiometry of Ma bamboo shoots, leaves, and soil at different shoot stages [30]. In the structural equation, a hypothetical model is proposed based on existing experience or theory, and the relationships between variables are connected using a path diagram [5]. This study assumed that nitrogen addition could influence the chemical stoichiometry of Ma bamboo soil at different shoot stages, thereby further affecting the chemical stoichiometry of leaves and bamboo shoots. Model analysis was conducted using the R language package PLSPM in the R version 4.2.1 environment.

2.4.2. Other Data Analysis

One-way analysis of variance (one-way ANOVA) [31] was used to test the differences in nutrient content of bamboo shoots, bamboo leaves, and soil under different nitrogen treatments. Multiple comparisons between treatments were performed using the least significant difference (LSD) method, with a significance level set at 0.05. All statistical analyses were conducted using SPSS software, and Origin 2021 software was used for data visualization. The data in the figures and tables represent means ± standard deviations.

3. Results

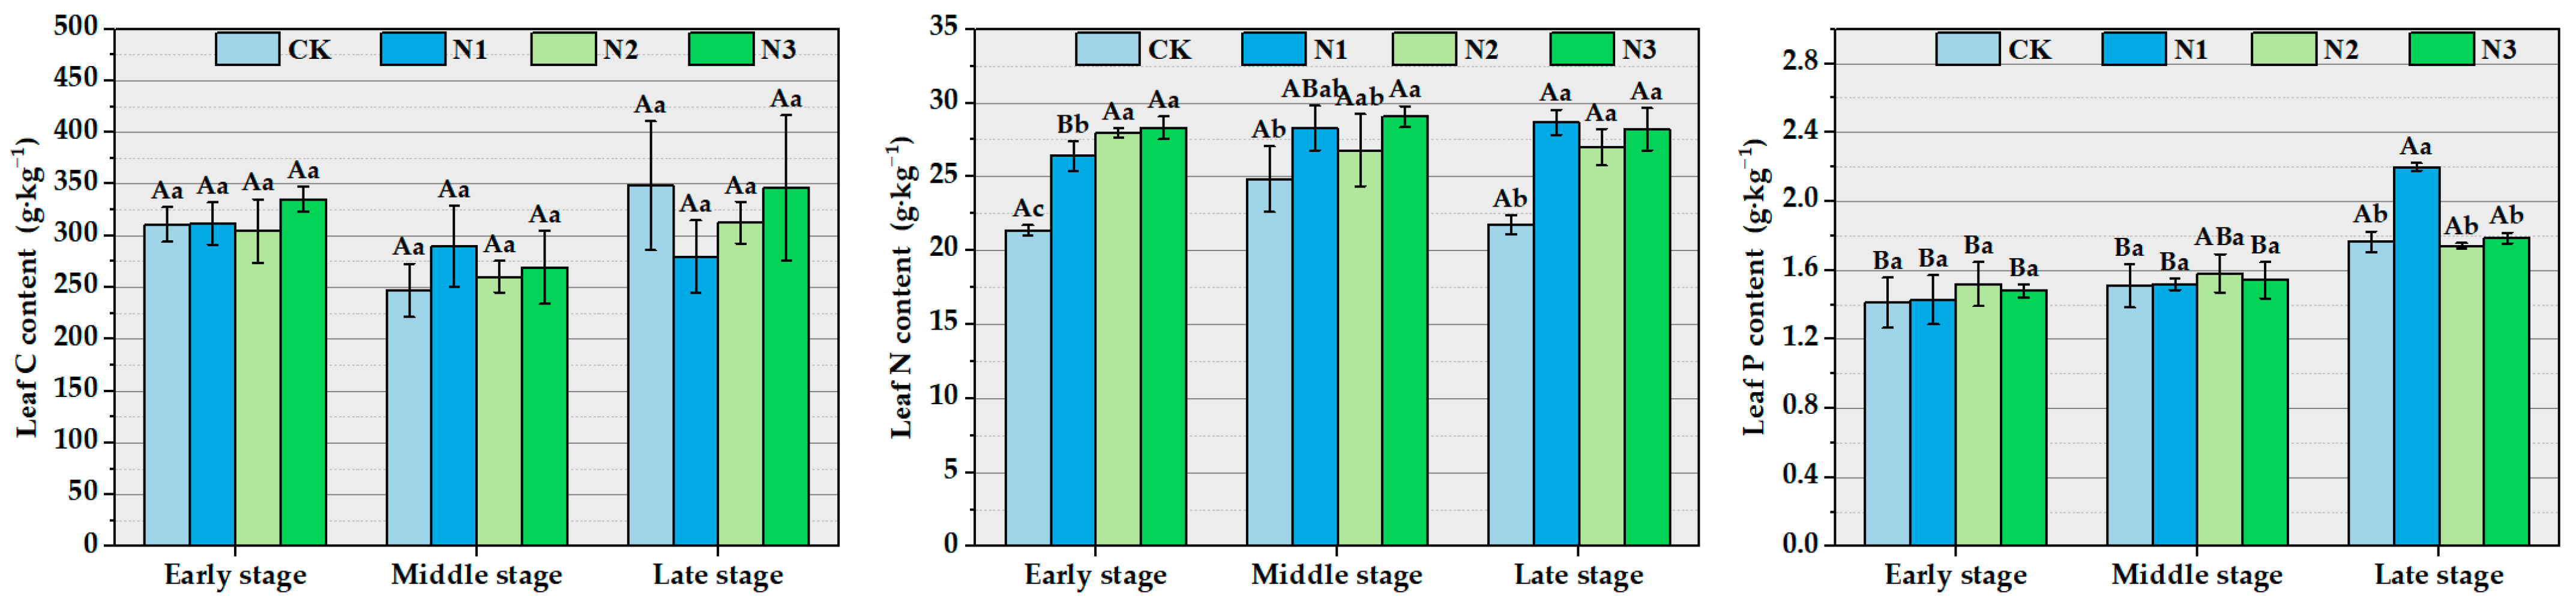
3.1. The Impact of Different Concentrations of Nitrogen Addition on Chemical Stoichiometry Characteristics and Stoichiometric Ratios of Ma Bamboo Leaves

Increased levels of N were observed to exert minimal impact on leaf C content, as evidenced by insignificant deviations from control (CK) values across various time intervals and treatment conditions. Following N application, a consistent elevation in leaf N content was noted across all observed phases. Significantly, during the initial and final stages of shoot growth, leaf N content in N-enhanced groups exhibited marked increases when compared with the CK group. Particularly in the early shoot stage, the N concentration in leaves under N2 treatment demonstrated a pronounced elevation, surpassing levels observed under identical treatment conditions at different times. At the experiment’s conclusion, a substantial augmentation in leaf P content was detected under the N1 treatment. This increase was significantly distinct, especially when comparing P content during the late shoot stage against other stages of shoot development, as illustrated in Figure 2.
The leaf C:N ratio significantly decreased after nitrogen application in the late stage, but the differences between treatments were not significant. Under the N1 treatment, the C:P ratio significantly decreased in the late stage, and it also showed a significant reduction compared with other periods under the same treatment. The N:P ratio significantly increased in the early and late stages compared with the control, but in the late stage, the N1 treatment showed a significant decrease compared with the other stages (Figure 3).

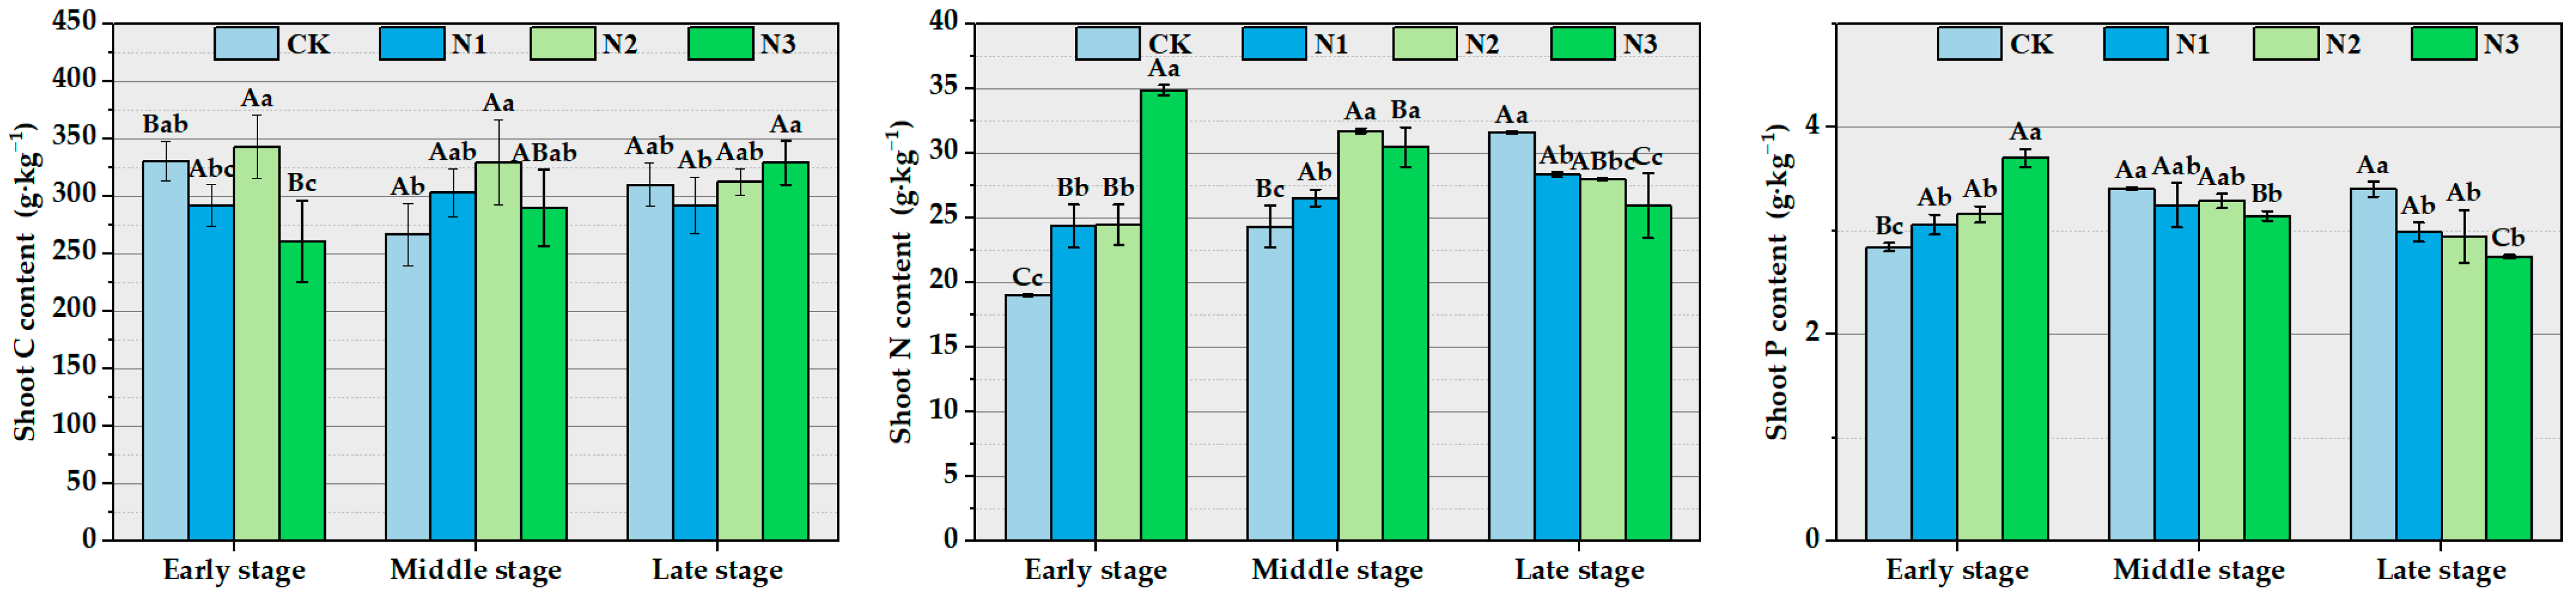
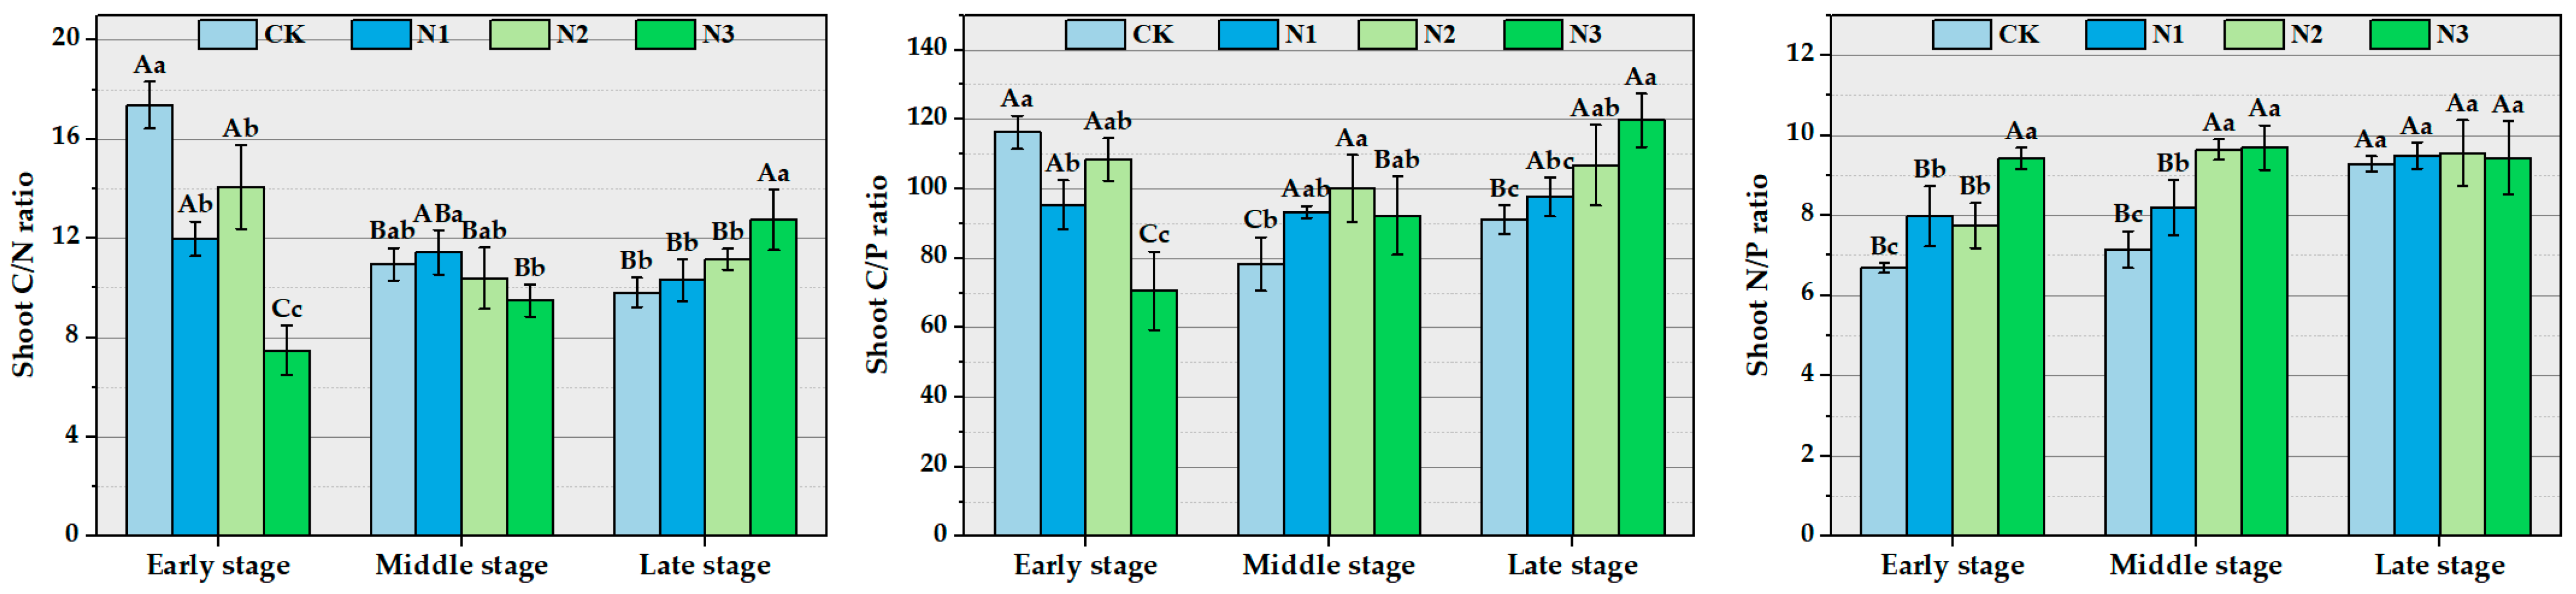
3.2. The Impact of Different Concentrations of Nitrogen Addition on the Stoichiometric Characteristics and Stoichiometric Ratios of Ma Bamboo Shoots

The C content in Ma bamboo shoots initially exhibited an increasing trend with increasing N application in both the early and middle stages, reaching its highest level in the N2 treatment during the same period. However, the C content increased with nitrogen application in the late stage, but the differences were not significant. N content in Ma bamboo shoots increased with nitrogen levels during the early and middle stages but gradually decreased in the late stage as nitrogen application increased. In the N1 treatment, the total N content in bamboo shoots increased with shoot development, while the N2 treatment showed an initial increase followed by a decrease, and the N3 treatment exhibited a decrease in N content with shoot development, with significant differences between the control group (CK) and the treated groups. The P content in Ma bamboo shoots increased with nitrogen application during the early stage but exhibited the opposite trend during the middle and late stages. Under the N3 treatment, P content in bamboo shoots significantly decreased with shoot development (Figure 4).
After nitrogen application, the C:N ratio in Ma bamboo shoots significantly decreased during the early stage but significantly increased with higher nitrogen levels in the late stage, with the N3 treatment showing significant differences in both the early and late stages. The C:P ratio exhibited an initial increase followed by a decrease with nitrogen application during the early and middle stages, while in the late stage, it increased with higher nitrogen levels. The C:P ratio significantly increased with the N3 treatment during all three shoot development stages. Overall, the N:P ratio gradually increased with increasing nitrogen application during the early and middle stages but did not exhibit significant differences in the late stage (Figure 5).

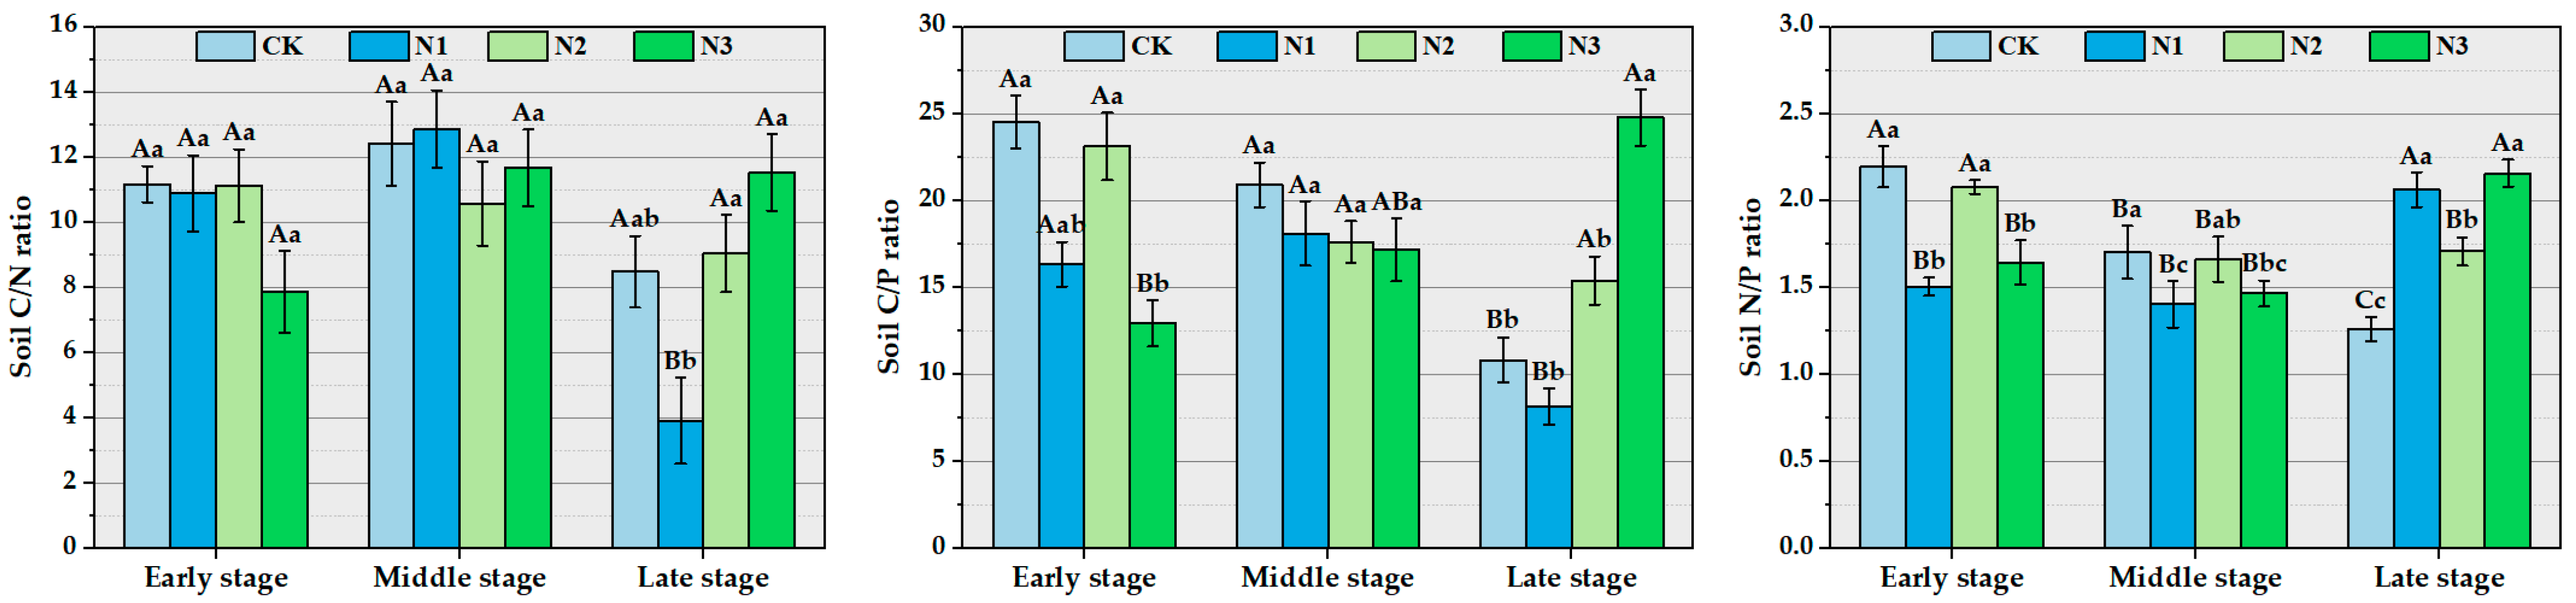
3.3. The Impact of Different Concentrations of Nitrogen Addition on Soil Stoichiometry and Stoichiometric Ratios

Nitrogen application during the middle stage of bamboo shoot growth led to a slight, albeit non-significant, reduction in soil organic C content. However, significant increases in soil C content were observed in the later stages. Notably, the N1 treatment exhibited a significant difference in soil C content compared with the other stages of shoot growth. Following nitrogen application, soil N content showed an initial increase followed by a subsequent decreasing trend, with mid-term nitrogen application resulting in significantly lower soil N content compared with the control (CK). In the early stages, soil P content significantly increased after nitrogen application. However, in the mid-term, it gradually decreased with increasing nitrogen doses, and in the late stage, it exhibited an initial increase followed by a decreasing trend. The N2 treatment significantly decreased soil P content in the early stage compared to the middle and late stages, while the N3 treatment showed a significant reduction in the late stage compared with other periods (Figure 6).
Soil C:N and C:P ratios exhibited a gradual increase during the late stage. There were no significant differences in soil C:N ratios between the early and middle stage bamboo growth. Notably, the N1 treatment resulted in a significant decrease in C:N and C:P ratios in the late stage compared with the other stages, while the N3 treatment exhibited significantly reduced C:P content in the early stage. Soil N:P ratios under the N1 and N3 treatments followed a similar trend across different growth stages (Figure 7).

3.4. Correlation Analysis of Nitrogen Application Treatment on C, N and P Contents of Leaves, Bamboo Shoots and Soil at Different Bamboo Shoot Stages

In the early stage of bamboo shoot growth, nitrogen addition showed significant positive correlations (Table 2) with leaf N, leaf N:P, and soil P (p < 0.05), while a highly significant negative correlation was observed between leaf C:N and soil P (p < 0.01). There was also a highly significant negative correlation between leaf N:P and soil N:P (p < 0.01). Shoot C exhibited significant positive correlations with soil C, soil C:N, and soil C:P (p < 0.05) and a highly significant positive correlation with soil N:P (p < 0.01). Shoot N showed a significant positive correlation with soil P (p < 0.05) and a highly significant negative correlation with soil C:P (p < 0.01), soil C:N, and soil N:P (p < 0.01). Shoot P displayed a significant positive correlation with soil P (p < 0.05) and a highly significant negative correlation with soil C:P (p < 0.01). There was a highly significant negative correlation between shoot and shoot N (p < 0.01). Soil C:P exhibited significant positive correlations with shoot C, shoot C:N, and shoot C:P (p < 0.05), a significant negative correlation with shoot N:P (p < 0.05), and a highly significant negative correlation with shoot P (p < 0.01). Soil N:P demonstrated a significant positive correlation with shoot C:N (p < 0.05), highly significant positive correlations with shoot C and shoot C:P (p < 0.01), and highly significant negative correlations with shoot N and shoot N:P (p < 0.01).
In the middle stage of bamboo shoot growth under nitrogen addition, leaf N exhibited a significant negative correlation (Table 3) with soil N (p < 0.05) and highly significant negative correlations with soil C and soil P (p < 0.01). Soil N:P showed a significant negative correlation with soil P (p < 0.05). Shoot P displayed highly significant positive correlations with soil C and soil N (p < 0.01), while shoot C:N exhibited a highly significant positive correlation with soil P (p < 0.01).
In the late stage of bamboo shoot growth under nitrogen addition, leaf N exhibited a highly significant positive correlation (Table 4) with soil N (p < 0.01) and a significant positive correlation with soil N:P (p < 0.05). Leaf C:N had a significant negative correlation with soil N:P (p < 0.05), while leaf N:P showed a highly significant positive correlation with soil C (p < 0.01) and significant positive correlations with soil N and soil C:P (p < 0.05). Shoot N displayed significant negative correlations with soil N, soil C:P, and soil N:P (p < 0.05), and a highly significant negative correlation with soil C (p < 0.01). Shoot P exhibited significant negative correlations with soil N and soil N:P (p < 0.05). Shoot C:N showed highly significant positive correlations with soil N and soil C:N (p < 0.01), and significant positive correlations with soil C, soil C:P, and soil N:P (p < 0.05). Soil C:P had a significant positive correlation with soil N (P < 0.05) and highly significant positive correlations with soil C, soil C:P, and soil N:P (p < 0.01).

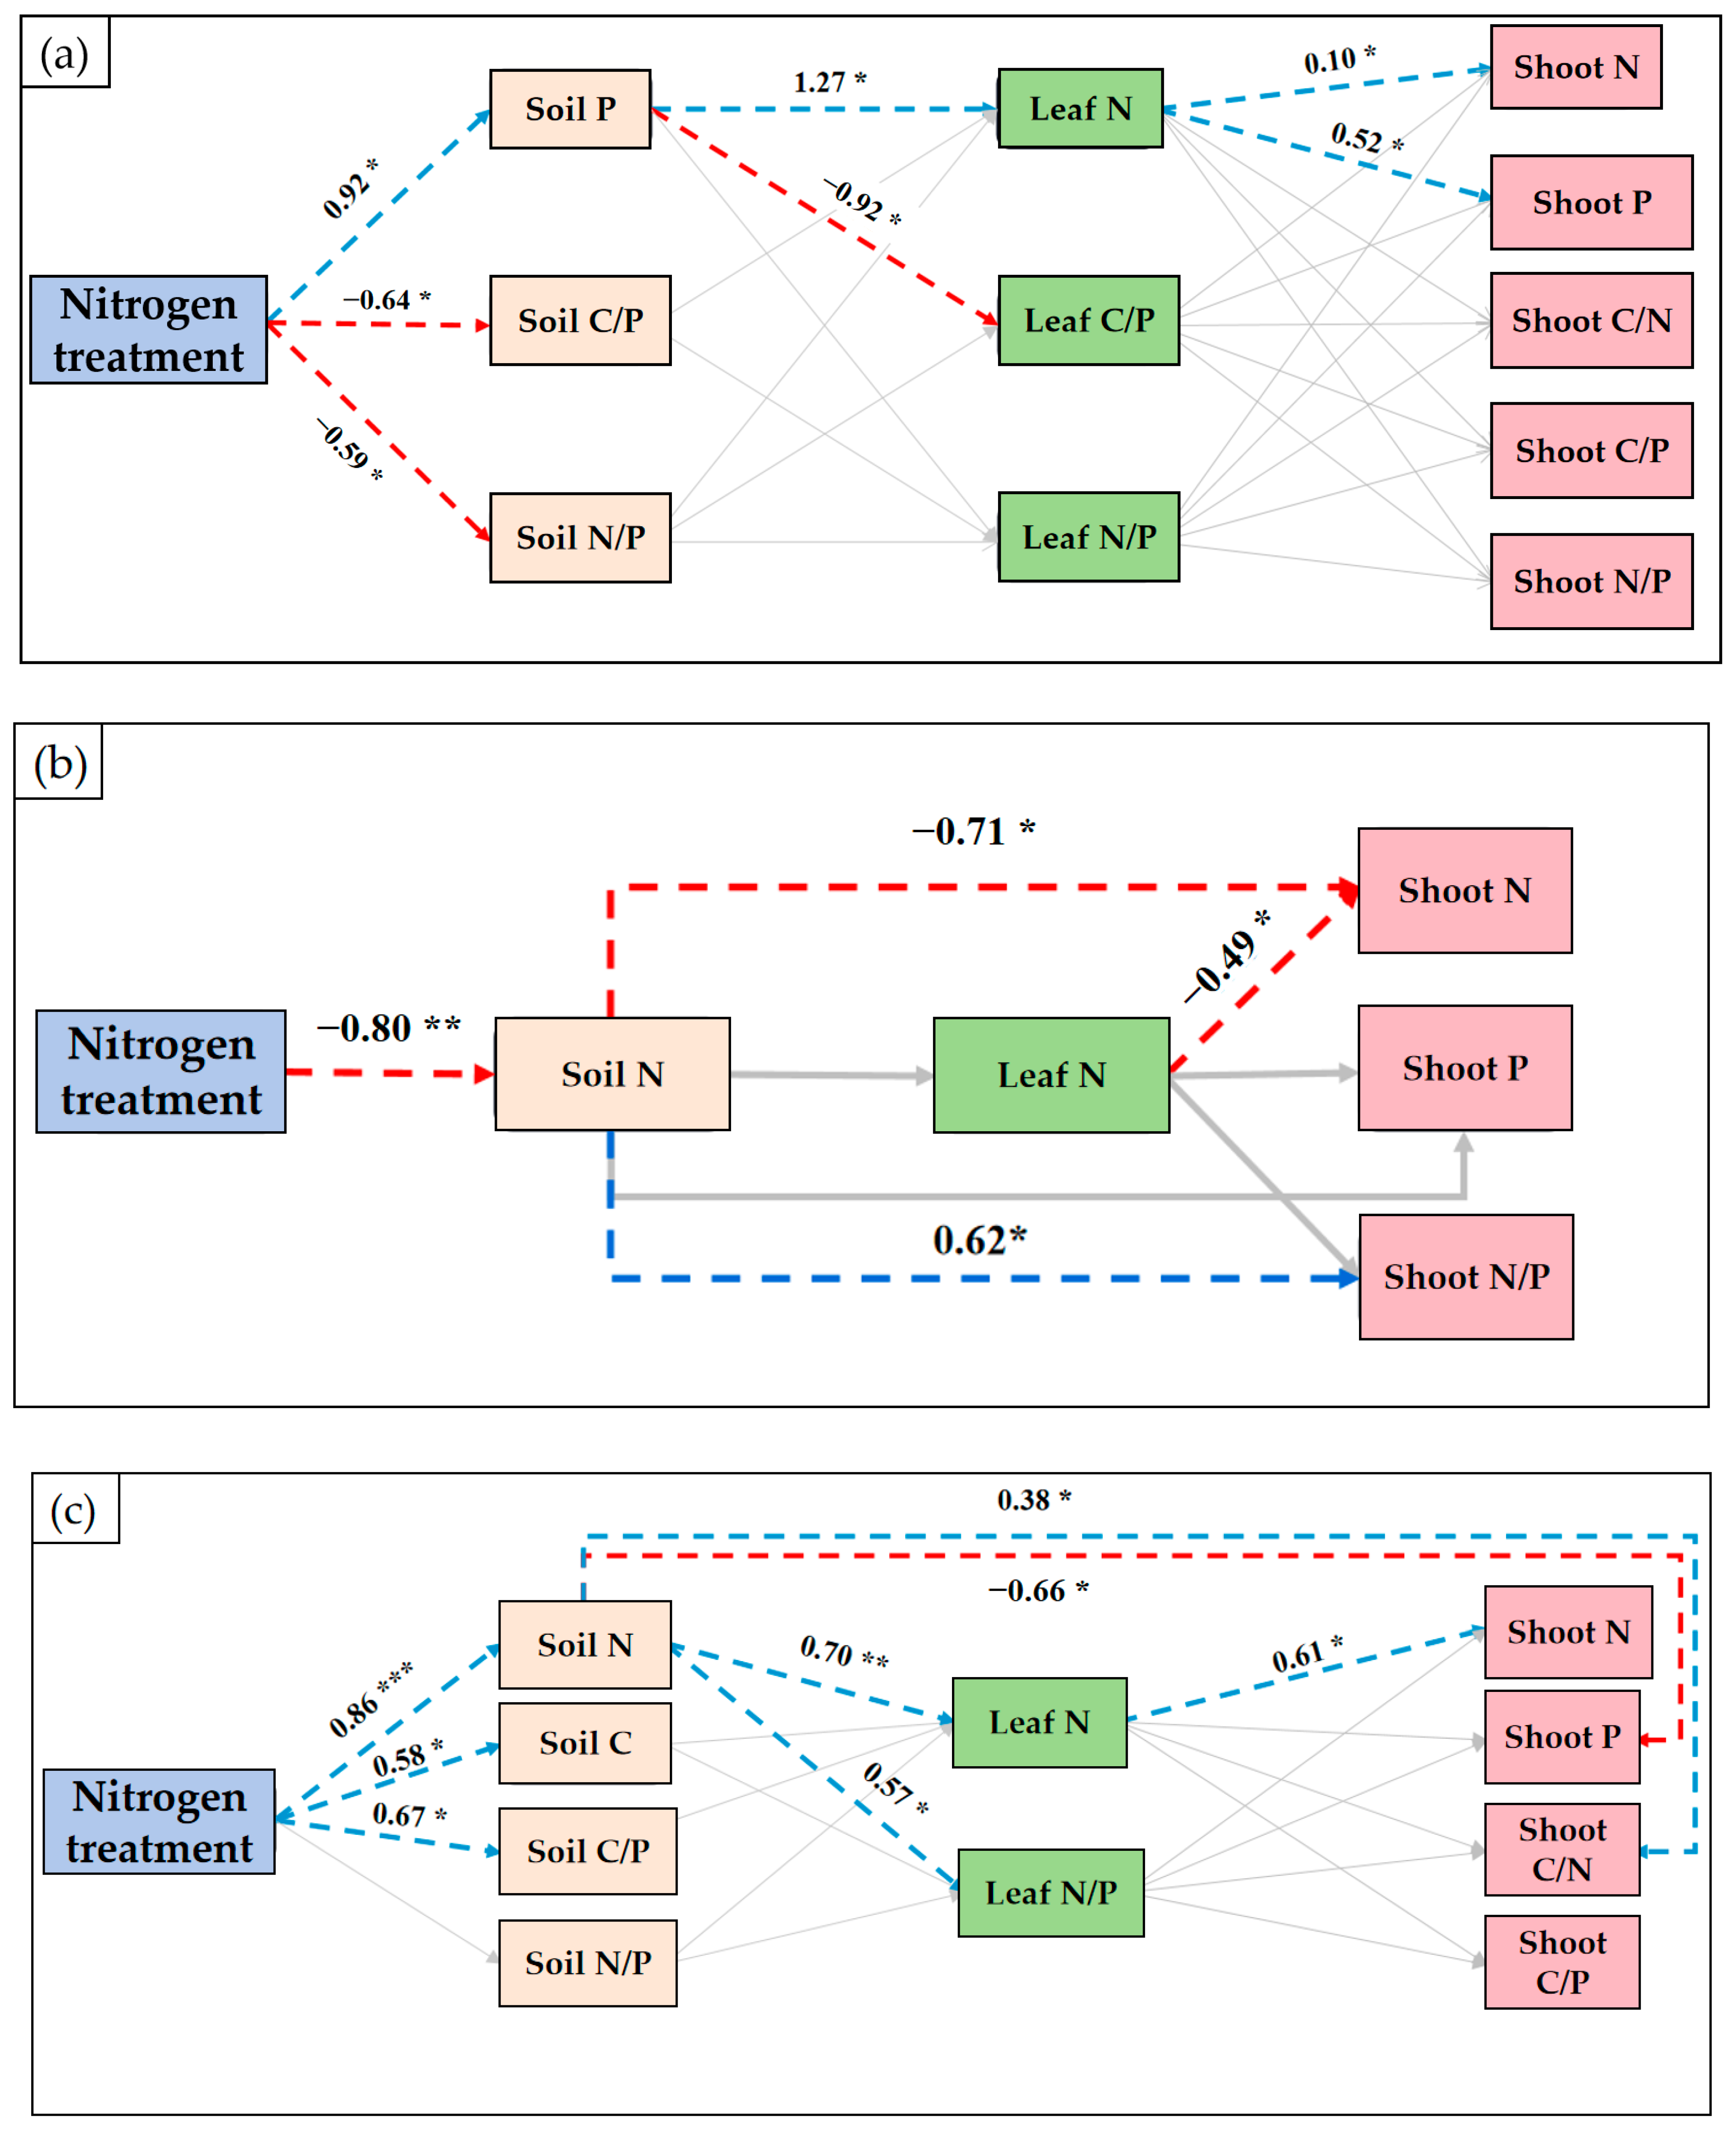
3.5. Direct and Indirect Effects of Nitrogen Treatment on Stoichiometry of Ma Bamboo Leaves, Bamboo Shoots, and Soil

According to the results of the structural equation model (Figure 8), it is evident that there exist intricate relationships among various chemical stoichiometric factors at different bamboo shoot growth stages. In the early stage of bamboo shoot growth (Figure 8a), nitrogen treatment significantly affects soil P, soil C:P, and soil N:P, with the most pronounced impact on soil P content, with path coefficients of 0.92 (p < 0.05), −0.64 (p < 0.05), and −0.59 (p < 0.05), respectively. Furthermore, changes in soil P content directly influence leaf N and leaf C:N, with path coefficients of 1.27 (p < 0.05) and −0.92 (p < 0.05), respectively. Additionally, leaf N significantly influences bamboo shoot N and bamboo shoot P content, with the strongest effect on bamboo shoot N, followed by bamboo shoot P, with total path coefficients of 0.11 (p < 0.05) and 0.52 (p < 0.05), respectively.
In the middle stage of bamboo shoot growth (Figure 8b), nitrogen treatment has a highly significant effect on soil N content, with a path coefficient of −0.80 (p < 0.05). Changes in soil N content have direct and indirect effects on bamboo shoot N and N:P, with path coefficients of −0.71 (p < 0.05) and 0.62 (p < 0.05), respectively. However, leaf N only has a direct effect on bamboo shoot N, with a total path coefficient of −0.49 (p < 0.05).
In the late bamboo shoot stage (Figure 8c), soil N content directly influences leaf N content and N:P, with path coefficients of 0.70 (p < 0.01) and 0.57 (p < 0.05), respectively. Additionally, it has direct and indirect effects on bamboo shoot P content and C:N, with path coefficients of −0.67 (p < 0.05) and 0.38 (p < 0.05), respectively. Similar to the early and middle stages, leaf N still exerts a direct and significant impact on bamboo shoot N, with a path coefficient of 0.61 (p < 0.05).
In summary, the overall path coefficients combined with the structural equation results for different stages of bamboo shoot growth indicate that soil N and P content have a significant influence on the chemical characteristics of bamboo leaves and shoots. Leaf N content exerts a direct impact on bamboo shoot N content throughout the entire growth process.

3.6. Response of Shoot Emergence, Shoot Yield, and Shoot Germination Time to Different Nitrogen Treatments

The deposition of nitrogen at varying concentrations exerts a direct influence on the yield and quality of bamboo shoots. Simulated nitrogen treatments resulted in increased shoot emergence and shoot yield, with the most significant increment observed for the N3 treatment. During the three stages of shoot emergence, the late stage of shoot emergence exhibited the highest increase under the N3 treatment compared with the control (CK), with a remarkable enhancement of 116.67%. The N1 and N2 treatments demonstrated the highest increase during the early stage of shoot emergence, with an enhancement of 66.67%. However, this enhancement decreased as the shoot emergence stages progressed. The trends in shoot yield enhancement were consistent with those observed for shoot emergence. Notably, the N3 treatment showed the most significant enhancement during the early stage of shoot emergence, with an increase of 115.87%. As the shoot emergence stages progressed, the magnitude of yield enhancement decreased due to the increased levels of nitrogen deposition. During the middle stage of shoot emergence, the N2 treatment yielded lower enhancement compared with the N1 treatment. Amiong the three stages, the N1 and N2 treatments exhibited the lowest enhancement during the middle stage of shoot emergence, possibly attributed to differences in nitrogen application and the vigorous growth of bamboo during this stage. Consequently, the differences between N1 and N2 treatments were not statistically significant (Table 5).
In addition, the experiments demonstrated that increasing N content within a certain range can lead to an earlier initiation of bamboo shoot emergence, resulting in an advanced emergence date and an extended peak period of shoot emergence. With the escalation of nitrogen application, the number of days in the early and middle stages of shoot emergence showed a positive correlation with the nitrogen level, while the late shooting stage under N3 treatment exhibited a lower value compared with N2 treatment. This phenomenon may be attributed to a decrease in temperature during the late shooting stage, which subsequently reduced enzymatic activity and impacted substance transport. Notably, the N3 treatment extended the duration of the early shooting stage by the most significant margin, with a maximum of 14 days, whereas the middle and late stages saw reductions, indicating a gradual narrowing of differences with increasing nitrogen application.

4. Discussion

4.1. The Impact of Nitrogen Addition on Soil Nutrients

The chemical stoichiometric characteristics of C, N, and P in the soil of Ma bamboo forests at different stages of bamboo shooting under nitrogen treatment can reflect the nutritional status provided by the soil for Ma bamboo and its ability to improve environmental conditions. This study revealed that, during the early and middle stages, nitrogen treatment did not significantly affect soil C content. This is because Ma bamboo, when facing sufficient nutrient supply, does not require the allocation of more photosynthetic products to its underground parts for nutrient uptake. Conversely, in the late stage, with the increase in nitrogen application levels, the organic C content significantly increased [32]. This is because, in the late stage of Ma bamboo shoot emergence, the development of various organs increases their nutrient demands. However, the soil’s nutrient supply becomes insufficient, limiting plant growth. External nitrogen addition enhances soil nutrient availability. Ma bamboo adjusts its resource acquisition strategy, reducing C allocation to the rhizosphere, leading to reduced microbial activity and diminished priming effects. This results in reduced microbial respiration, inhibition of microbial decomposition of soil organic C, and an increase in soil organic C content [2].
The total P content in the soil was significantly positively correlated with nitrogen treatment during the early stage. This may be due, in part, to the acidification of the soil caused by external nitrogen addition, promoting the mineralization of organic P in the soil, thereby increasing available P content. This, in turn, reduces the fixation of soil P, allowing the formation of phosphate that plants can absorb and use, ultimately increasing the total P content in the soil during the early stage [33]. On the other hand, nitrogen affects soil microbial activity. Nitrogen addition promotes microbial growth, increasing the biomass P content of soil microbes and, consequently, the level of available P in the soil [34]. This is primarily attributed to the ammonium nitrate component in nitrogen fertilizer, which reduces soil pH. These factors collectively promote the microbial decomposition of inorganic P [27].
This study found that mid-term nitrogen treatment promoted the absorption of nitrogen by Ma bamboo, leading to a reduction in mineral nitrogen content in the soil. In the late stage, nitrogen fertilizer application showed a significant positive correlation, directly enhancing the soil’s nitrogen supply capacity to plants. This difference may be due to the impact of nitrogen treatment on changes in soil C content [29,32,35]. Specifically, as soil C content increases, soil microbes accumulate more nitrogen rather than mineralizing it, with most nitrogen elements participating in the synthesis of organic matter, ultimately reducing nitrogen mineralization rates [36]. The C:N ratio is an important indicator of the internal nutrient cycling in soil, intuitively reflecting plants’ nutrient utilization. The average C:N ratio of the soil under nitrogen treatment was 10.133, and N:P ratios were all below 14, indicating that soil nitrogen is a key limiting factor controlling soil organic C content. Higher soil nitrogen content usually accelerates the decomposition of soil organic C by soil microbes and promotes soil respiration, leading to a relatively slow accumulation of soil organic C, resulting in a lower soil C:N ratio.

4.2. Changes in the Chemical Stoichiometric Characteristics of C, N, and P in Ma Bamboo Leaves and Shoots with Nitrogen Addition

Nitrogen treatment increased the C content in Ma bamboo leaves, indicating that nitrogen fertilizer can increase the content of organic compounds in Ma bamboo leaves, thus enhancing leaf C storage capacity. At the same time, nitrogen application increased the content of readily available nitrogen in the soil, facilitating nitrogen absorption by Ma bamboo leaves, thereby increasing leaf N content. With the addition of external nitrogen, the C:N ratio of plant tissues decreased, and the N:P increased. High nitrogen content in leaves satisfies the nutrient requirements for rapid fruit growth. Under the same nitrogen application level, N2 and N3 treatments better maintained stable leaf N content, ensuring the required nitrogen level for Ma bamboo growth and bamboo shoot development. This is likely to have been due to the small and frequent applications of nitrogen fertilizer, which ensured a stable and continuous nitrogen supply, meeting the continuous nitrogen demands of Ma bamboo at different growth stages. Leaf P content was relatively less affected by nitrogen application levels. Ma bamboo leaves have a low N:P ratio, mainly because Ma bamboo has a fast growth rate, and the growth rate of plant bodies is determined by the speed of protein synthesis. In the cells, P primarily exists in the form of nucleic acid P [37]. The C:N ratio in Ma bamboo leaves is lower during the middle stage of bamboo shoot growth, which is related to the greater impact of nitrogen treatment on N content than on organic C content, particularly during the middle stage of bamboo shoot growth. This study found that nitrogen treatment increases the N:P ratio, reaching its highest value during the middle stage of bamboo shoot growth, consistent with the results of Gu Daxing et al. [22]. The average N:P ratios for leaves under nitrogen treatment during the early and middle stages were 18.745 and 18.182, respectively, indicating that P is a limiting element for the early and mid-stage growth of Ma bamboo. In the late stage, the average N:P ratio for leaves was 14.816, suggesting that in the late stage, the growth of Ma bamboo is either not limited by nitrogen or P or is not limited at all. Adequate nitrogen application levels help alleviate the degree of nitrogen limitation for Ma bamboo, which is consistent with the results of Fan et al. [38].
Nitrogen treatment significantly increased the nitrogen content of bamboo shoots during the early and middle stages, while in the late stage, the nitrogen content decreased with increasing nitrogen application levels, possibly due to reduced nitrogen utilization efficiency in the late stage of Ma bamboo growth. The study found that bamboo shoots had a higher P content, indicating that nitrogen treatment promotes the accumulation of P in bamboo shoots, which is related to their faster growth rate and higher productivity [19]. Since P is related to cell division intensity, various metabolic processes increase during Ma bamboo shoot emergence, and derivatives of nucleotides play a crucial role in plant metabolism. P is a component of nucleotides, leading to higher P content in Ma bamboo shoots [20]. In rapidly growing plant bodies, P concentration is higher, causing different rates of change in the total amounts of N and P elements in the organism, ultimately altering the C:P and N:P ratios in the organism. The N:P ratio was significantly higher in bamboo shoots of all three stages under nitrogen treatment compared with the control group, indicating that nitrogen treatment has a greater impact on the total N content in bamboo shoots than on the total P content.

4.3. Response of Bamboo Shoot Emergence Characteristics to Varied Nitrogen Application Levels at Different Shoot Stages

In this experiment, as the nitrogen application rate increased, both the yield and the number of shoots of bamboo exhibited an upward trend. Notably, the N3 treatment showed the highest increase, with a remarkable 116.67% increase in shoot production during the middle stage of shoot growth. This surge in shoot production was attributed to the significant enhancement of chlorophyll content in bamboo leaves due to the nitrogen application, resulting in strengthened photosynthesis. This, in turn, facilitated the synthesis and accumulation of photosynthetic products, ultimately leading to increased shoot yield and numbers. Comparatively, the shoot yield under the N3 treatment decreased from 44.70% in the early shoot stage to 1.05% in the late shoot stage compared with the N2 treatment. The narrowing gap between the two treatments indicated reduced efficiency with increased nitrogen application, thus diminishing the beneficial effect on shoot production [1,20].
Furthermore, the nitrogen application also had a noticeable effect on the duration of shoot emergence. Our research revealed that nitrogen application could prolong the duration of shoot emergence, leading to earlier shoot emergence and an extended peak period of shoot emergence. Optimal nitrogen application during the early and middle stages of shoot growth was observed with the N3 treatment, whereas the N2 treatment was most effective during the late stage of shoot growth. This divergence may be attributed to reduced utilization of nitrogen fertilizer during the late stage of the N3 treatment, resulting in a shortened duration of shoot emergence [39,40]. Appropriate nitrogen application can effectively advance the timing of shoot emergence and extend the peak period [41].

4.4. Limitations and Future Prospects

In this study, we focused on analyzing the plant–soil stoichiometry of Ma bamboo within a singular region. The widespread distribution of this species, however, constrains our ability to comprehensively and accurately assess its response to environmental changes. Future research should broaden the geographical scope to include diverse climates and soil types, thereby enhancing our understanding of Ma bamboo’s adaptability to environmental variations. Moreover, integrating vegetation, soil, and microbiological studies is essential. This multidimensional approach aims to reveal the ecological stoichiometry of C-N-P within the ‘plant–microbe–soil’ continuum of Dendrocalamus latiflorus Munro and elucidate the intrinsic connections and mechanisms of action between these stoichiometric variations and atmospheric nitrogen deposition. Such a comprehensive methodology will not only aid in understanding the impact of nitrogen deposition on a single species but also provide insights into the complex interactions at the ecosystem level, offering a scientific basis for nitrogen deposition management and ecosystem conservation.

5. Conclusions

This study examines the stoichiometric characteristics of leaf and shoot tissues of Ma bamboo under varying nitrogen application levels to simulate the nitrogen deposition mechanism during Ma bamboo growth. The conclusions and results can be summarized as follows:
(1).
Impact on Nitrogen Content and Stoichiometry
Nitrogen application notably increased the N content in both leaves and shoots of Ma bamboo, slightly enhanced leaf C content at later stages, and significantly altered the C:N:P stoichiometric ratios. This includes a decrease in C:N ratio at the initial and final stages, a decrease in C:P under N1 treatment at the final stage, and an increase in N:P during initial and middle stages as nitrogen levels increased.
(2).
Response of Phosphorus Content and Soil Nutrient Influence
The P content in leaves and shoots showed no conspicuous response to nitrogen application. However, structural equation modeling indicates that soil N and P content had a significant impact on the stoichiometric characteristics of Ma bamboo leaves and shoots, particularly the direct effect of leaf N content on shoot N content throughout the growth process.
(3).
Enhancement of Bamboo Shoot Yield and Emergence Duration
Nitrogen application significantly boosted the yield and number of bamboo shoots, with the N3 treatment demonstrating the most favorable results. Notably, there was a remarkable increase in shoot numbers (116.67% increment compared with control in the late stage) and early shoot yield (115.87% increment compared with control). Additionally, nitrogen application substantially extended the duration of emergence of bamboo shoots across all stages, with N3 treatment being the most effective in the early and middle stages, and N2 treatment in the late stage.
(4).
Optimal Nitrogen Treatment Levels
Different nitrogen treatments (N1, N2, and N3) showed varying degrees of effectiveness at different growth stages of bamboo shoots. In the early stage, N1 and N2 treatments resulted in the highest increments in shoot numbers, while in the late stage, the N3 treatment showed the highest increase. The yield of shoots maximally increased in the early stage, indicating the importance of the timing and quantity of nitrogen application for optimizing bamboo growth and yield.
In conclusion, this study sheds light on the stoichiometric balancing and distribution strategies in the plant–soil system of Ma bamboo, particularly focusing on its adaptability and response to varying nitrogen deposition levels. This research not only deepens our understanding of plant nutrient adaptation mechanisms in the context of nitrogen deposition but also broadens the conversation on plant population stoichiometry. Crucially, it provides valuable insights and scientific foundations for further studies on community or ecosystem stoichiometry. In addition, its adaptability to different nitrogen levels suggests that Ma bamboo could be effectively utilized in diverse ecological and geographical settings, contributing to biomass production and offering an eco-friendly alternative in industries reliant on plant-based materials. This underlines the significance of Ma bamboo biomass yields in both environmental conservation and the development of renewable resources.

Author Contributions

Conceptualization, Y.L., J.S. and S.Z.; methodology, L.C. and J.R.; software, Y.L. and T.H.; validation, J.S., J.R., T.H. and S.Z.; formal analysis, L.C. and J.R.; investigation, Y.Z. and Y.Z.; resources, Y.Z.; data curation, Y.Z.; writing—original draft preparation, Y.L. and Y.Z.; writing—review and editing, Y.L., J.S., S.Z. and J.R.; funding acquisition, Y.Z., L.C. and T.H. All authors have read and agreed to the published version of the manuscript.

Funding

This work was supported by the 14th Five-Year National Key Research and Development Program: ‘Geographical Differentiation of Important Bamboo and Rattan Germplasm Biomass Formation’ (2021YFD2200501), and the Fujian Province Science and Technology Innovation Team Project: ‘Innovative Team for Precise Cultivation and Utilization of Environmentally Friendly Bamboo Resources’ (Minjiaoke 2018 (49)).

Institutional Review Board Statement

Not applicable.

Informed Consent Statement

Not applicable.

Data Availability Statement

Data are contained within the article.

Conflicts of Interest

The authors declare no conflicts of interest.

References

  1. Yu, G.R.; Jia, Y.L.; He, N.P.; Zhu, J.X.; Chen, Z.; Wang, Q.F.; Piao, S.L.; Liu, X.J.; He, H.L.; Guo, X.B.; et al. Stabilization of atmospheric nitrogen deposition in China over the past decade. Nat. Geosci. 2019, 12, 424–429. [Google Scholar] [CrossRef]
  2. Botez, F.; Postolache, C. Nitrogen deposition impact on terrestrial ecosystems. Rom. Biotechnol. Lett. 2013, 18, 8723–8742. [Google Scholar]
  3. Wu, F.; Yang, W.; Lu, Y. Effects of dwarf bamboo (Fargesia denudata) density on biomass, carbon and nutrient distribution pattern. Acta Ecol. Sin. 2009, 29, 192–198. [Google Scholar] [CrossRef]
  4. Krapp, A.; Castaings, L. Plant adaptation to nitrogen availability. Biol. Aujourd’hui 2012, 206, 323–335. [Google Scholar] [CrossRef] [PubMed]
  5. Duan, X.G. Stoichiometric characteristics of woody plant leaves and responses to climate and soil factors in China. PLoS ONE 2023, 18, e0291957. [Google Scholar] [CrossRef] [PubMed]
  6. Guo, J.Y.; Wang, Y.X.; Li, J.L. Effects of nitrogen addition on plant-soil carbon dynamics in terrestrial ecosystems of China. Acta Ecol. Sin. 2022, 42, 4823–4833. [Google Scholar] [CrossRef]
  7. Liang, X.Y.; Zhang, T.; Lu, X.K.; Ellsworth, D.S.; BassiriRad, H.; You, C.M.; Wang, D.; He, P.C.; Deng, Q.; Liu, H.; et al. Global response patterns of plant photosynthesis to nitrogen addition: A meta-analysis. Glob. Change Biol. 2020, 26, 3585–3600. [Google Scholar] [CrossRef] [PubMed]
  8. Tian, D.; Du, E.; Jiang, L.; Ma, S.; Zeng, W.; Zou, A.; Feng, C.; Xu, L.; Xing, A.; Wang, W.; et al. Responses of forest ecosystems to increasing N deposition in China: A critical review. Environ. Pollut. 2018, 243, 75–86. [Google Scholar] [CrossRef]
  9. Sun, Y.; Wang, C.T.; Chen, H.Y.H.; Ruan, H.H. Responses of C:N stoichiometry in plants, soil, and microorganisms to nitrogen addition. Plant Soil 2020, 456, 277–287. [Google Scholar] [CrossRef]
  10. Li, L.; Liu, Y.; Xiao, T.H.; Hou, F.J. Different responses of soil C:N:P stoichiometry to stocking rate and nitrogen addition level in an alpine meadow on the Qinghai-Tibetan Plateau. Appl. Soil Ecol. 2021, 165, 103961. [Google Scholar] [CrossRef]
  11. Li, Z.; Qiu, X.; Sun, Y.; Liu, S.; Hu, H.; Xie, J.; Chen, G.; Xiao, Y.; Tang, Y.; Tu, L. C:N:P stoichiometry responses to 10 years of nitrogen addition differ across soil components and plant organs in a subtropical Pleioblastus amarus forest. Sci. Total Environ. 2021, 796, 148925. [Google Scholar] [CrossRef] [PubMed]
  12. Xu, N.; Guo, W.; Liu, J.; Du, N.; Wang, R. Increased nitrogen deposition alleviated the adverse effects of drought stress on Quercus variabilis and Quercus mongolica seedlings. Acta Physiol. Plant. 2015, 37, 107. [Google Scholar] [CrossRef]
  13. Yuan, Z.Y.; Chen, H.Y.H. Negative effects of fertilization on plant nutrient resorption. Ecology 2015, 96, 373–380. [Google Scholar] [CrossRef] [PubMed]
  14. Feng, C.; Zheng, C.; Tian, D. Impacts of nitrogen addition on plant phosphorus content in forest ecosystems and the underlying mechanisms. Chin. J. Plant Ecol. 2019, 43, 185–196. [Google Scholar] [CrossRef]
  15. Yue, K.; Yang, W.Q.; Peng, Y.; Peng, C.H.; Tan, B.; Xu, Z.F.; Zhang, L.; Ni, X.Y.; Zhou, W.; Wu, F.Z. Individual and combined effects of multiple global change drivers on terrestrial phosphorus pools: A meta-analysis. Sci. Total Environ. 2018, 630, 181–188. [Google Scholar] [CrossRef] [PubMed]
  16. Lu, X.; Vitousek, P.M.; Mao, Q.; Gilliam, F.S.; Luo, Y.; Zhou, G.; Zou, X.; Bai, E.; Scanlon, T.M.; Hou, E.; et al. Plant acclimation to long-term high nitrogen deposition in an N-rich tropical forest. Proc. Natl. Acad. Sci. USA 2018, 115, 5187–5192. [Google Scholar] [CrossRef] [PubMed]
  17. Liu, Y.; Chen, P.; Chen, S.; Hang, Z.; Jin, S. Simulated organic-inorganic nitrogen deposition changes the growth rate, leaf stoichiometry, and phenolic content of Cyclocarya paliurus. For. Ecol. Manag. 2023, 546, 121313. [Google Scholar] [CrossRef]
  18. Yin, M.Z.; Guo, W.J.; Zhu, X.M.; Zhang, Z.L.; Liu, Q.; Yin, H.J. Nutrient limiting characteristics of subalpine coniferous forests under conditions of nitrogen deposition in the southwest mountains of China. Chin. J. Appl. Environ. Biol. 2021, 27, 1–7. [Google Scholar] [CrossRef]
  19. Du, M.Y.; Fan, S.H.; Liu, G.L.; Feng, H.Y.; Guo, B.H.; Tang, X.L. Stoichiometric characteristics of carbon, nitrogen and phosphorus in Phyllostachys edulis forests of China. Chin. J. Plant Ecol. 2016, 40, 760–774. [Google Scholar] [CrossRef]
  20. Zhang, R.; Wu, J.S.; Li, Q.; Hänninen, H.; Peng, C.J.; Yao, H.; Song, X.Z.; Ying, Y.Q. Nitrogen Deposition Enhances Photosynthesis in Moso Bamboo but Increases Susceptibility to Other Stress Factors. Front. Plant Sci. 2017, 8, 1975. [Google Scholar] [CrossRef]
  21. Song, X.; Gu, H.; Wang, M.; Zhou, G.; Li, Q. Management practices regulate the response of Moso bamboo foliar stoichiometry to nitrogen deposition. Sci. Rep. 2016, 6, 24107. [Google Scholar] [CrossRef] [PubMed]
  22. Jin, K.M.; Wang, Y.J.; Zhuo, R.Y.; Xu, J.; Lu, Z.C.; Fan, H.J.; Huang, B.Y.; Qiao, G.R. TCP Transcription Factors Involved in Shoot Development of Ma Bamboo (Dendrocalamus latiflorus Munro). Front. Plant Sci. 2022, 13, 884443. [Google Scholar] [CrossRef]
  23. Chen, K.; Hu, K.Q.; Xi, F.H.; Wang, H.H.; Kohnen, M.V.; Gao, P.F.; Liao, J.K.; Wei, W.T.; Liu, X.Q.; Zhang, H.X.; et al. High-Efficient and Transient Transformation of Moso Bamboo (Phyllostachys edulis) and Ma Bamboo (Dendrocalamus latiflorus Munro). J. Plant Biol. 2023, 66, 75–86. [Google Scholar] [CrossRef]
  24. Fawcett, J.K. The semi-micro Kjeldahl method for the determination of nitrogen. J. Med. Lab. Technol. 1954, 12, 330–340. [Google Scholar]
  25. He, Y.; Tang, Y.; Lin, L.; Shi, W.; Ying, Y. Differential responses of phosphorus accumulation and mobilization in Moso bamboo (Phyllostachys edulis (Carriere) J. Houz) seedlings to short-term experimental nitrogen deposition. Ann. For. Sci. 2023, 80, 10. [Google Scholar] [CrossRef]
  26. Guan, F.; Xia, M.; Tang, X.; Fan, S. Spatial variability of soil nitrogen, phosphorus and potassium contents in Moso bamboo forests in Yong’an City, China. CATENA 2017, 150, 161–172. [Google Scholar] [CrossRef]
  27. Shuai, X.; Yost, R.S.; Wendroth, O. State-space estimation of the intrinsic soil phosphorus pools from soil phosphorus tests. Geoderma 2014, 214, 239–245. [Google Scholar] [CrossRef]
  28. Lei, Z.; Sun, H.; Li, Q.; Zhang, J.; Song, X. Effects of Nitrogen Deposition on Soil Dissolved Organic Carbon and Nitrogen in Moso Bamboo Plantations Strongly Depend on Management Practices. Forests 2017, 8, 452. [Google Scholar] [CrossRef]
  29. Nóbrega, G.N.; Ferreira, T.O.; Artur, A.G.; de Mendona, E.S.; Leao, R.A.D.; Teixeira, A.S.; Otero, X.L. Evaluation of methods for quantifying organic carbon in mangrove soils from semi-arid region. J. Soils Sediments 2015, 15, 282–291. [Google Scholar] [CrossRef]
  30. Sun, T.; Mao, X.L.; Han, K.F.; Wang, X.J.; Cheng, Q.; Liu, X.; Zhou, J.J.; Ma, Q.X.; Ni, Z.H.; Wu, L.H. Nitrogen addition increased soil particulate organic carbon via plant carbon input whereas reduced mineral-associated organic carbon through attenuating mineral protection in agroecosystem. Sci. Total Environ. 2023, 899, 165705. [Google Scholar] [CrossRef]
  31. Norton, B.J.; Strube, M.J. Guide for the interpretation of one-way analysis of variance. Phys. Ther. 1985, 65, 1888–1896. [Google Scholar] [CrossRef] [PubMed]
  32. Li, J.; Yang, Z.; Tang, X.; Liu, L.; Lai, Y.; Lei, J.; Zeng, C.; Ma, X.; Du, M.; Cai, C.; et al. Differential Response of Soil Respiration and Total Belowground Carbon Allocation to Simulated Nitrogen and Phosphorus Deposition in Moso Bamboo Forests. Forests 2022, 13, 1860. [Google Scholar] [CrossRef]
  33. Zhang, J.; Lv, J.; Li, Q.; Ying, Y.; Peng, C.; Song, X. Effects of nitrogen deposition and management practices on leaf litterfall and N and P return in a Moso bamboo forest. Biogeochemistry 2017, 134, 115–124. [Google Scholar] [CrossRef]
  34. Feng, J.G. Effects of nitrogen and phosphorus addition on soil organic carbon: Review and prospects. Chin. J. Plant Ecol. 2022, 46, 855–870. [Google Scholar] [CrossRef]
  35. Sardar, M.F.; Younas, F.; Farooqi, Z.U.R.; Li, Y.L. Soil nitrogen dynamics in natural forest ecosystem: A review. Front. For. Glob. Change 2023, 6, 1144930. [Google Scholar] [CrossRef]
  36. Huang, C.Y.; Jien, S.H.; Chen, T.H.; Tian, G.L.; Chiu, C.Y. Soluble organic C and N and their relationships with soil organic C and N and microbial characteristics in moso bamboo (Phyllostachys edulis) plantations along an elevation gradient in Central Taiwan. J. Soils Sediments 2014, 14, 1061–1070. [Google Scholar] [CrossRef]
  37. Gu, D.X.; Chen, H. Effects of soil nitrogen and phosphonium on leaf nitrogen and phosphonium stoichiometric characteristics and chlorophyll content of Oligostachyum lubricum. Chin. J. Plant Ecol. 2011, 35, 1219–1225. [Google Scholar] [CrossRef]
  38. Fan, L.; Tarin, M.W.K.; Han, Y.; Li, B.; Rong, J.; Chen, L.; He, T.; Zheng, Y. Effects of soil exogenous nitrogen on bamboo (dendrocalamus latiflorus munro) shoots, photosynthetic characteristics, and nitrogen metabolism. Appl. Ecol. Environ. Res. 2022, 20, 3911–3926. [Google Scholar] [CrossRef]
  39. Padgurschi, M.C.G.; Vieira, S.A.; Stefani, E.J.F.; Nardoto, G.B.; Joly, C.A. Nitrogen input by bamboos in neotropical forest: A new perspective. PeerJ 2018, 6, e6024. [Google Scholar] [CrossRef]
  40. Su, W.H.; Fan, S.H.; Zhao, J.C.; Cai, C.J. Effects of various fertilization placements on the fate of urea-15N in moso bamboo forests. For. Ecol. Manag. 2019, 453, 117632. [Google Scholar] [CrossRef]
  41. Yang, K.B.; Zhu, C.L.; Zhang, J.B.; Li, Z.Y.; Liu, Y.; Song, X.Z.; Gao, Z.M. Nitrogen fertilization in bamboo forest accelerates the shoot growth and alters the lignification process in shoots. Ind. Crops Prod. 2022, 187, 115368. [Google Scholar] [CrossRef]
Figure 1. Study area overview map. (a) Map of Fujian Province showing the provincial boundary, the administrative center at Fuzhou City, and the designated study area. (b) The figure illustrates the trend of monthly average temperatures, where the red line represents the monthly average maximum temperature and the blue line indicates the monthly average minimum temperature. (c) The figure illustrates the monthly rainfall distribution.
Forests 15 00151 g001
Figure 2. Changes in chemical stoichiometry characteristics of leaves of Ma bamboo after nitrogen addition at different periods of shoot emergence. Note: Different uppercase letters indicate significant differences between the three shoot stages under the same treatment (p < 0.05); different lowercase letters denote significant differences within the same shoot stage under different treatments (p < 0.05).
Forests 15 00151 g002
Figure 3. Changes in stoichiometric ratios of leaves of Ma bamboo after nitrogen addition at different shoot emergence periods. Note: Different uppercase letters indicate significant differences between the three shoot stages under the same treatment (p < 0.05); different lowercase letters denote significant differences within the same shoot stage under different treatments (p < 0.05).
Forests 15 00151 g003
Figure 4. Changes in chemical stoichiometry characteristics of shoots of Ma bamboo after nitrogen addition at different periods of shoot emergence. Note: Different uppercase letters indicate significant differences between the three shoot stages under the same treatment (p < 0.05); different lowercase letters denote significant differences within the same shoot stage under different treatments (p < 0.05).
Forests 15 00151 g004
Figure 5. Changes in chemical stoichiometry ratio of shoots of Ma bamboo after nitrogen addition at different periods of shoot emergence. Note: Different uppercase letters indicate significant differences between the three shoot stages under the same treatment (p < 0.05); different lowercase letters denote significant differences within the same shoot stage under different treatments (p < 0.05).
Forests 15 00151 g005
Figure 6. Changes in chemical stoichiometry characteristics of soil of Ma bamboo after nitrogen addition at different periods of shoot emergence. Note: Different uppercase letters indicate significant differences between the three shoot stages under the same treatment (p < 0.05); different lowercase letters denote significant differences within the same shoot stage under different treatments (p < 0.05).
Forests 15 00151 g006
Figure 7. Changes in chemical stoichiometry ratio of soil of Ma bamboo after nitrogen addition at different periods of shoot emergence periods. Note: Different uppercase letters indicate significant differences between the three shoot stages under the same treatment (p < 0.05); different lowercase letters denote significant differences within the same shoot stage under different treatments (p < 0.05).
Forests 15 00151 g007
Figure 8. Direct and indirect effects of N treatment on bamboo leaves, bamboo shoots, and soil stoichiometry in the structural equation model. (a) The structure equation of early-stage hemp bamboo leaves, bamboo shoots, and soil stoichiometry. (b) The structure equation of middle-stage hemp bamboo leaves, bamboo shoots, and soil stoichiometry. (c) The structure equations of end-stage hemp bamboo leaves, bamboo shoots, and soil stoichiometry. Note: The blue dashed line in the figure indicates the positive correlation between the two variables, the red dashed line indicates the negative correlation between the two variables, the online number is the path coefficient, no significant effect is indicated by the gray dashed line; *, **, *** are significant at the significance levels of 10%, 5% and 1%, respectively.
Forests 15 00151 g008
Table 1. Basic physical and chemical properties of soil.
StageTotal Nitrogen/(g·kg−1)Hydrolyzable Nitrogen
/(mg·kg−1)
Total Phosphorus
/(g·kg−1)
Effective Phosphorus
/(mg·kg−1)
Total Potassium
/(g·kg−1)
Rapidly Available Potassium
/(mg·kg−1)
pHElectric ConductivityOrganic Carbon
/(g·kg−1)
Early1.12181.110.634.7516.495.186.0085.718.73
Middle1.15180.560.595.916.105.736.0587.078.73
Late1.13180.980.605.3416.295.455.9886.798.69
Table 2. Early-stage stoichiometric characteristics and ratio correlation results.
Early Stage.LeafBamboo Shoot
CNPC:NC:PN:PCNPC:NC:PN:P
SoilC−0.09−0.030.08−0.01−0.11−0.090.83 *−0.41−0.310.59 **0.65 **−0.44
N0.040.470.30−0.41−0.100.260.230.310.38−0.12−0.030.23
P0.460.87 *0.07−0.63 **0.240.84 *−0.500.88 *0.80 *−0.87 *−0.73 *0.90 *
C:N−0.11−0.25−0.050.20−0.02−0.230.75 *−0.58 **−0.520.67 **0.715 *−0.56
C:P−0.24−0.450.010.34−0.16−0.480.84 *−0.71 *−0.59 **0.84 *0.826 *−0.75 *
N:P−0.34−0.530.110.38−0.29−0.62 **0.60 **−0.59 **−0.480.71 *0.64 **−0.66 **
Note: *, **, are significant at the significance levels of 5%, and 1%, respectively.
Table 3. Middle-stage stoichiometric characteristics and ratio correlation results.
Middle StageLeafBamboo Shoot
CNPC:NC:PN:PCNPC:NC:PN:P
SoilC−0.08−0.69 **−0.090.44−0.01−0.500.03−0.410.64 **0.52−0.18−0.52
N−0.49−0.71 *−0.030.07−0.44−0.55−0.13−0.310.62 **0.20−0.33−0.44
P−0.13−0.67 **0.460.38−0.33−0.80 *0.13−0.380.430.58 **−0.02−0.45
C:N0.18−0.34−0.100.4270.24−0.200.13−0.270.400.49−0.01−0.34
C:P−0.04−0.47−0.310.310.12−0.19−0.01−0.280.530.34−0.18−0.38
N:P−0.43−0.23−0.37−0.23−0.230.01−0.23−0.040.31−0.21−0.32−0.12
Note: *, **, are significant at the significance levels of 5%, and 1%, respectively.
Table 4. Late-stage stoichiometric characteristics and ratio correlation results.
Late StageLeafBamboo Shoot
CNPC:NC:PN:PCNPC:NC:PN:P
SoilC0.350.11−0.530.120.460.60 **0.48−0.64 **−0.460.763 *0.63 **−0.20
N−0.050.66 **−0.24−0.440.040.87 *0.30−0.77 *−0.78 *0.68 **0.73 *0.13
P0.31−0.45−0.74 *0.430.520.230.210.220.27−0.04−0.06−0.07
C:N0.45−0.14−0.560.340.550.370.44−0.41−0.220.599 **0.44−0.26
C:P0.290.21−0.370.030.350.54 *0.48−0.73 *−0.540.832 *0.68 **−0.217
N:P−0.310.88 *0.45−0.71 *−0.420.450.06−0.78 *−0.82 *0.567 *0.60 **0.153
Note: *, **, are significant at the significance levels of 5%, and 1%, respectively.
Table 5. The response of bamboo shoot yield index to different n application and the dynamic change of shoot period.
Nitrogen TreatmentNumber of Bamboo Shoots
Early StageMiddle StageLate Stage
CK386
N15117
N25127
N361613
Nitrogen treatmentBamboo shoot yield (g)
Early stageMiddle stageLate stage
CK23.95141.8778.00
N150.64166.2785.63
N235.73165.65121.33
N351.70220.79122.61
Nitrogen treatmentBamboo shoot germination time (day)
Early stageMiddle stageLate stage
CK393723
N1424324
N2524533
N3534629
Disclaimer/Publisher’s Note: The statements, opinions and data contained in all publications are solely those of the individual author(s) and contributor(s) and not of MDPI and/or the editor(s). MDPI and/or the editor(s) disclaim responsibility for any injury to people or property resulting from any ideas, methods, instructions or products referred to in the content.

