Article

Criteria and Indicators to Define Priority Areas for Biodiversity Conservation in Vietnam

1
College of Land Management and Rural Development, Vietnam National University of Forestry, Hanoi 13417, Vietnam
2
Institute of Photogrammetry and Remote Sensing, Technical University of Dresden, 01069 Dresden, Germany
3
Institute of Environmental Economics and World Trade, Leibniz University of Hannover, 30167 Hannover, Germany
*
Author to whom correspondence should be addressed.
Forests 2022, 13(9), 1341; https://doi.org/10.3390/f13091341
Submission received: 11 July 2022 / Revised: 15 August 2022 / Accepted: 18 August 2022 / Published: 23 August 2022
(This article belongs to the Special Issue Biodiversity and Conservation of Forests)

Abstract

:
Balancing biodiversity conservation with land use for agricultural production is a major societal challenge. Conservation activities must be prioritized since funds and resources for conservation are insufficient in the context of current threats, and conservation competes with other societal priorities. In order to contribute to conservation priority-setting literature, we applied an environmental model, Pressure–State–Response (PSR), to develop a set of criteria for identifying priority areas for biodiversity conservation in Vietnam. Our empirical data have been compiled from 185 respondents and categorized into three groups: Governmental Administration and Organizations, Universities and Research Institutions, and Protected Areas. The Analytic Hierarchy Process (AHP) theory was used to identify the weight of all criteria. Our results show that the priority levels for biodiversity conservation identified by these three factors are 41% for “Pressure”, 26% for “State”, and 33% for “Response”. Based on these three factors, seven criteria and seventeen indicators were developed to determine priority areas for biodiversity conservation. Besides, our study also reveals that the groups of Governmental Administration and organizations and Protected Areas put a focus on the “Pressure” factor, while the group of Universities and Research Institutions emphasized the importance of the “Response” factor in the evaluation process. We suggest that these criteria and indicators be used to identify priority areas for biodiversity conservation in Vietnam.

1. Introduction

Humans and their wellbeing, health, and livelihood have benefitted significantly from biodiversity [1,2,3,4]. However, biodiversity conservation remains one of the greatest challenges facing the modern world. It is estimated that humans have caused the extinction of between 5 and 20% of all species around the world [5], and recent extinction rates are between 100 to 1000 times their pre-human levels [5,6]. Coping with land cover conflicts caused by different stakeholder interests, biodiversity conservation often has to take a step back in relation to other interests [7]. Increasing demands on land are offset by increasingly scarce land resources. Thus, it is of crucial importance for the conservation of biodiversity to have an objective framework for the selection of areas at hand that allows high-priority areas to be identified. Priority areas should cover the most critical areas needed for biodiversity [8,9]. Identifying priority areas is one of the crucial tasks in the process of establishing protected areas since humans are not able to protect all places on Earth that contribute to biodiversity conservation [10]. However, the identification of priority areas for conservation requires the integration of biodiversity data together with socio-economic data on human pressures and responses.
There has been an increasing need for methods that define biodiversity conservation priorities to demarcate where the need for conservation action is most urgent and where the benefits of conservation strategies might be maximized [11]. Previous reviews on the criteria to identify priority areas for biodiversity conservation have mainly focused on an extensive list of relevant ecological and biological criteria [12,13,14]. From a perspective of a geographic scale for investigation, the establishment of biodiversity conservation priorities can be classified into three categories [11]. At the local scale, researchers and conservationists use criteria relating to genetic diversity and indicator species to provide a focus for establishing conservation priorities [11]. At the regional scale, the Habitat Conservation Planning (HCP) practice is applied to make use of information on the home range and state of organisms to designate habitat reserves. At the regional to a global scale, priority areas for biodiversity conservation are identified by using criteria such as species richness, rarity, endemism, representativeness, and complementarity to drive the conservation effort [15,16,17]. Nevertheless, there remains a surprising lack of empirically substantiated research that attempts to integrate both biological and socio-economic aspects into the criteria for identifying priority areas for biodiversity conservation.
Vietnam is one of the most important hotspots for biodiversity in the world [18,19]. Previous studies indicated substantial values of biodiversity in Vietnam such as climate change mitigation and adaptation, poverty reduction, education and cultural values [20,21]. However, the rate of biodiversity loss in Vietnam is alarming [16,22]. Like many other countries, much of the conservation effort in Vietnam is put into the formulation of a protected area system as an essential strategy to protect the remaining biodiversity. Currently, establishing a protected area in Vietnam requires feasibility studies to be undertaken to provide information on location, demarcation, area, and biodiversity value. Although the number of protected areas is predicted to increase in the coming years [23], there are still inherent obstacles to identify priority areas for biodiversity conservation in this country, such as limited comprehensive data, lack of time and resources for surveys and assessments, and a deficit of reliable methods. This is the main motivation for our study aimed at developing criteria and indicators for prioritizing areas for biodiversity conservation in Vietnam.
The remaining part of the paper is structured as follows. Section 2 briefly describes the environmental model “Pressure-State-Response”. Section 3 provides background information on Vietnam and reviews the literature. Section 4 describes the data and methods. Section 5 presents, and Section 6 discusses, the results. Section 7 concludes.

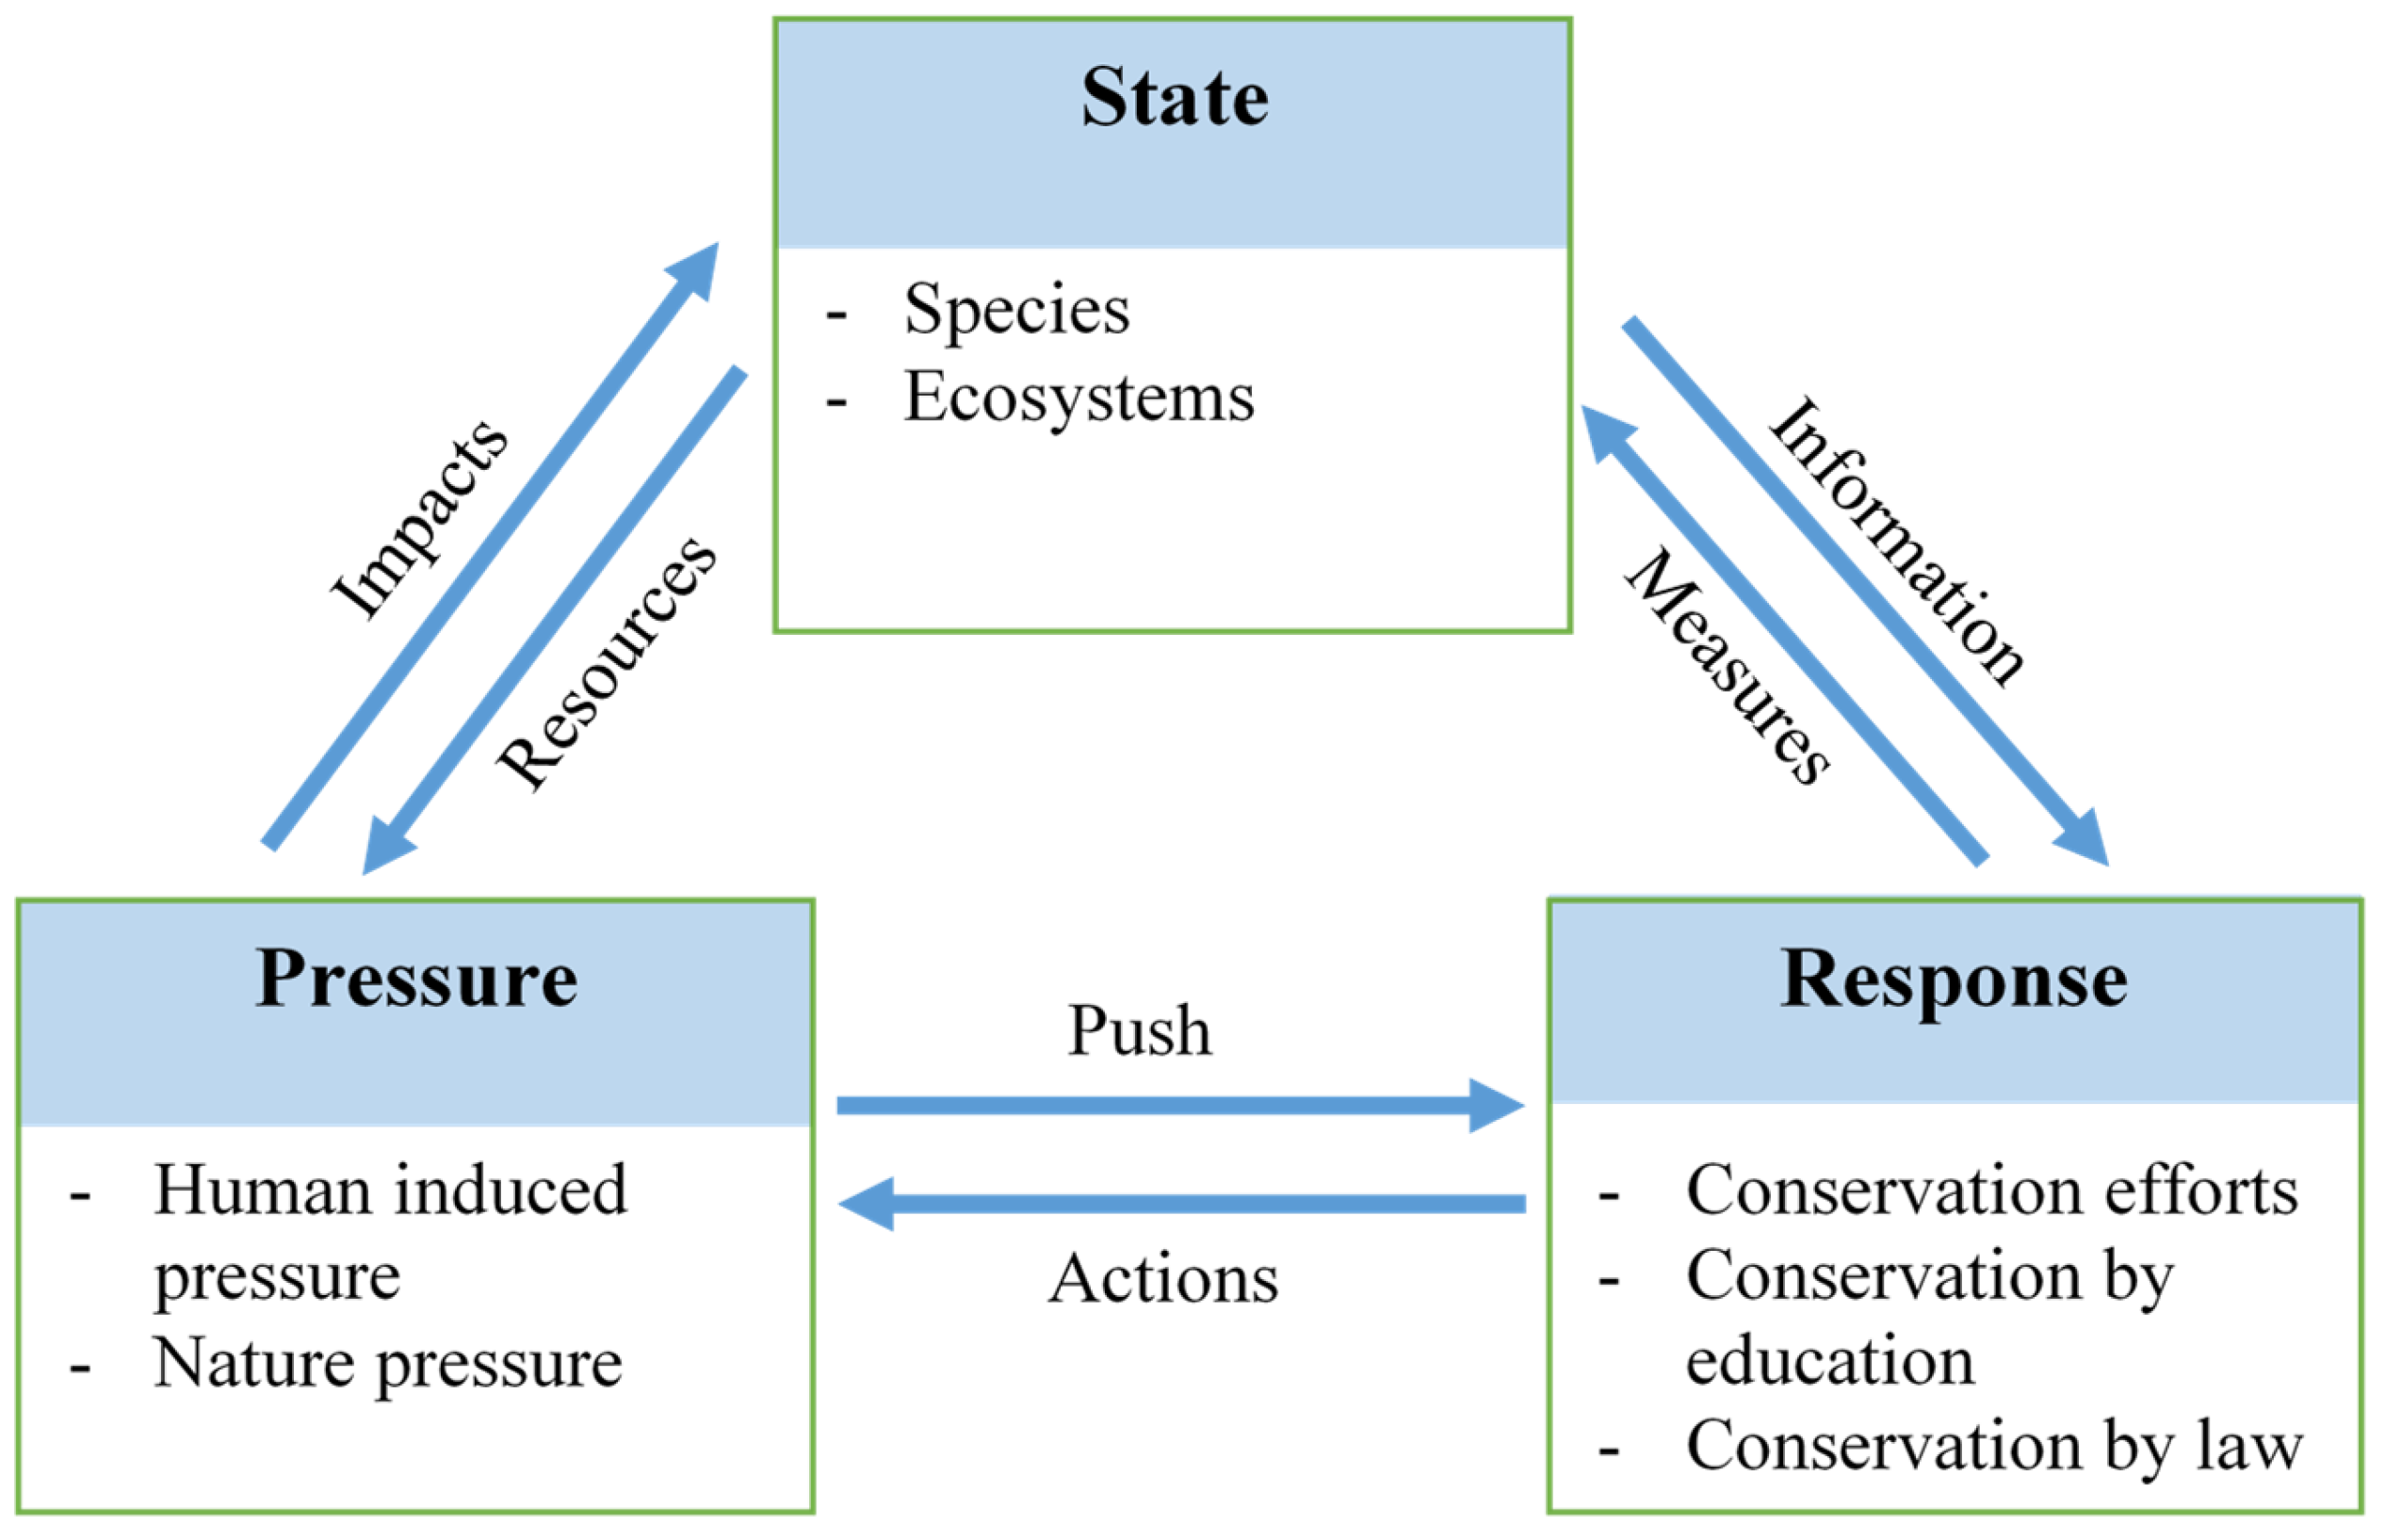
2. Analytical Framework: “Pressure-State-Response” Model

The Pressure–State–Response (PSR) was first developed in 1993 by the Organization for Economic Co-operation and Development [24]. This framework includes three factors: Pressure (P), State (S), and Response (R), and is based on a concept of causality: human activities create pressure on the environment that changes the quality and quantity of resources (state), and then society responds to these changes with adaptive, preventive and mitigation actions [25].
The PSR (Figure 1) presents the linkages between the pressures exerted on biodiversity conservation caused by human activities (pressure box), the change in quality and quantity of biodiversity (state box), and the response to these changes as society tries to reduce the pressure and conserve the biodiversity resources (response box). The interchanges among these boxes form a continuous feedback mechanism that can be monitored and used for the assessment of biodiversity resources. Therefore, the factor “Pressure” describes developments in physical and biological agents, the use of resources, and the use of land. The pressures exerted by society are transported and transformed into a variety of natural processes to manifest themselves in changes in environmental conditions. The factor “State” describes the quantity and quality of physical, biological, and chemical phenomena in a particular area, while the factor “Response” refers to responses by groups and individuals in society and government attempts to prevent, compensate, ameliorate, or adapt to changes in the state of the environment [26].
This framework has been used to develop criteria and indicators in many fields, for example, in sustainable development [25], which formulate environmental indicators and land quality indicators, and establish state-of-the environment reporting and national environmental performance reviews [27]. Indeed, the PSR model provides a useful tool to formalize environmental problems due to its intuitive structure–human pressure on environmental state and political responses to adopt solutions [28]. The model focused on where ecological system dynamics depend exclusively on human activities [28]. This framework has been adopted by many OECD countries and by the World Bank for environmental reporting [27].
In our study, the PRS model is used to serve as a conceptual framework for analyzing the links between socio-economic activities and biodiversity change. From a theoretical perspective, this study contributes to closing gaps in our understanding of the interrelations between these three factors, namely Pressure, State, and Response, for analyzing problems of biodiversity conservation and identifying criteria for defining priority areas.

3. Literature Review and Research Context

3.1. Literature Review: Determining Priority Areas for Biodiversity Conservation

Biodiversity conservation has been one of the critical environmental issues, which aims to preserve the varieties of species and communities as well as the genetic and functional diversity of species [22,29]. According to BirdLife International, the priority areas of biodiversity conservation are Endemic Bird Areas (EBAs) [30]. Although the critical areas for biodiversity conservation are either EBAs or the diversity of all species and communities, the functions of biodiversity conservation are entirely to preserve species diversity, ecosystem diversity, soil and water conservation functions, and prevent potential threats [31].
Due to a lack of available resources for biodiversity conservation, humans cannot preserve all places on the planet that contribute to biodiversity. Thus, selecting priority areas plays a crucial role in maximizing the effectiveness of conservation and saves resources for other goals. To systemize the setting of priority areas for biodiversity conservation, a combination of criteria and scoring and ranking procedures have developed over the last couple of decades [8,32]. In these processes, multiple criteria such as diversity, rarity, naturalness, and size, among others, have been determined and given scores based on literature reviews and participation techniques [31,33,34]. These ratings have been then combined for each selected area. The areas have been ranked, and the highest priority has been given to the areas with the highest top scores [8]. Although several conservation organizations have proposed criteria to define priority areas for biodiversity conservation, they only focused on those main criteria that they have a great interest in. While BirdLife International puts stress on the state of species and ecosystems, the Alliance for Zero Extinction emphasized the importance of endemic and threatened species to zone priority areas for biodiversity conservation [22]. However, there remains a surprising lack of studies related to the synthesis of a systematic set of criteria and indicators that support identifying priority areas for biodiversity conservation. To contribute to literature on methods of defining priority areas for biodiversity conservation, this study used the environmental PSR model as a conceptual framework to monitor biodiversity based on three key factors, including state, pressure, and response. One of the strengths of the PSR model is to show the relationships among human activities, biodiversity, and management solutions to assess the influence levels on biodiversity conservation [24,35,36,37]. Since the criteria were categorized into three factors of the PSR model, the number of pairs of criteria could be reduced to efficiently apply the method of pairwise comparison. Besides, the application of the PSR model also helps to have an insight into negative and positive aspects that influence biodiversity conservation.
The assessment of biodiversity conservation is an important task where conservationists and policymakers have to choose criteria to define potential areas for biodiversity conservation carefully. Previous studies have shown that the Analytic Hierarchy Process (AHP) is a helpful tool for handling complicated decision making and supporting the decision-maker in determining priorities and making the best decision in multiple-use planning of forest resources [38,39,40] as well as in environmental planning processes [39,41,42,43]. The pairwise comparison of the AHP method helps to reduce the difficulties of complex decisions and captures both subjective and objective aspects of a choice [44]. The AHP approach is the most suitable tool to determine the weights of assessment factors that significantly impact decision-making processes [42,45,46,47]. Although the AHP theory was first developed in the late 1970s and has been used as a decision support tool in various fields, few studies have applied it in the fields of forestry, agriculture, and natural resources [48]. Some examples of such applications include the decision making for forest planning [39,40,49,50]; selection of risk factors for forest protection [51,52,53,54]; forest management [55,56,57,58,59,60,61]; and suitability analysis of land use [45,62,63,64,65,66]. However, previous studies have not pointed and compared the influence levels of criteria on biodiversity conservation. From a technical perspective, our contribution is to calculate the weights of criteria that are used to show the influence levels of criteria on defining priority areas for biodiversity conservation.

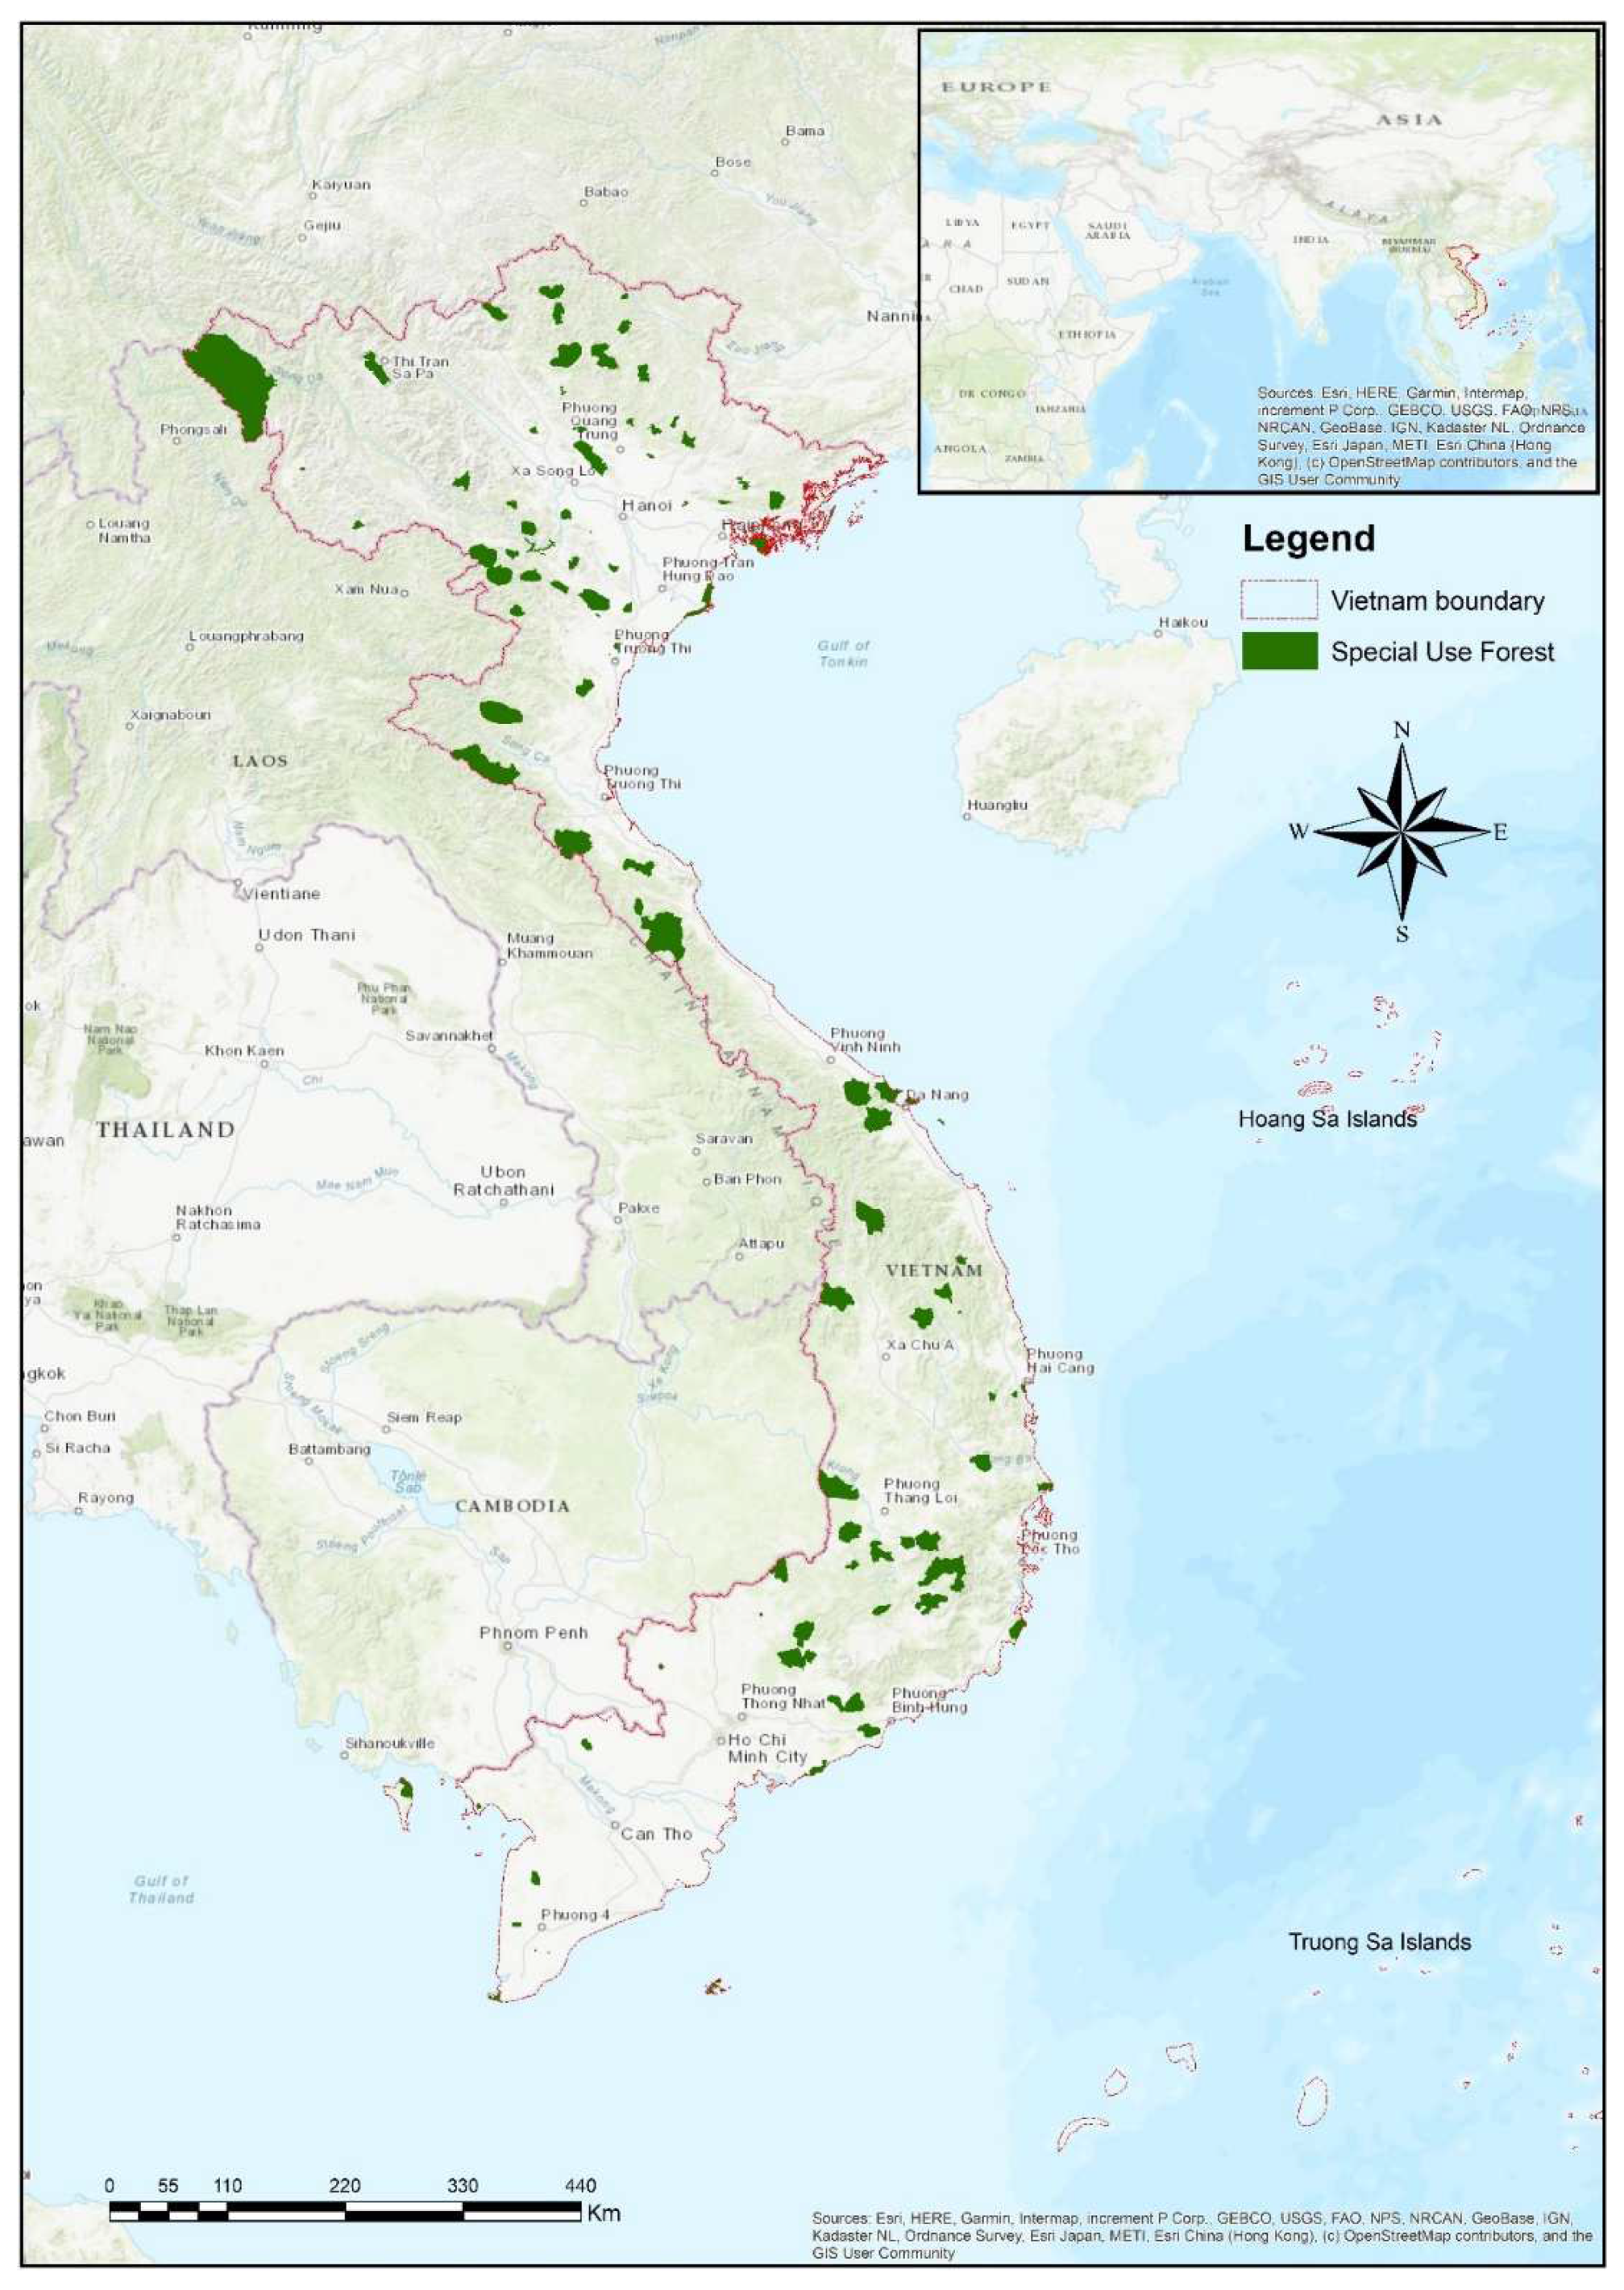
3.2. Research Context: Vietnam

The S-shaped country of Vietnam ranges along the latitude from the 23° to 8°30′ N and includes much hilly and mountainous terrain [67]. The country occupies an area of around 329,500 km2 and is bordered by China, Laos, and Cambodia on the north, northwest, and southwest, respectively. The rest of the country borders the East Vietnam Sea and is 3260 km long (Figure 2). The country comprises eight different eco-regions, including Northwest, Northeast, Red River Delta, North Central Coast, South Central Coast, Central Highlands, Southeast, and Mekong River Delta. The estimated population was 95.5 million people in 2017, with 85.8% belonging to the majority Kinh group, and the rest belonging to many different ethnic minorities such as Hmong, Dao, Tay, Muong, Thai, and Nung.
A long coastline and a wide-ranging latitude and altitude with a variety of hydrological conditions, climatic, soil, and terrain are the main characteristics that have created a high diversity of genes, species, and ecosystems in Vietnam [68,69]. Vietnam is one of the 16 countries with the highest biodiversity in the world and is one of the priority countries for global conservation, with about 10% of species worldwide in only 1% of the world’s land area [70]. Vietnam is home to 59 Important Bird Areas [71], and 110 Key Biodiversity Areas [19]. The natural protected areas system comprises 167 protected areas with 34 national parks, 56 nature reserves, 14 species and habitat conservation areas, 54 landscape protection areas, and nine areas of empirical scientific research [72,73]. It is estimated that there are more than 20,000 plant species, 5500 insects, 3000 fishes, more than 1000 birds, and more than 300 mammals found throughout Vietnam [74]. Thus, PAs protection and management are of vital significance for biodiversity conservation in Vietnam [75]. The increase of forest cover has been seen from 28% in 1990 to about 41% in 2015. However, new plantations were established (account for 2.1 million hectares), covering most of the increase, while more than 60% of natural forests are assessed as poor or regenerating [76]. Forest degradation and deforestation in Vietnam continues in the top countries of tree cover loss [76,77]. This led to 13 million ha or 40% of the country’s land area being classified as unproductive or barren land. The loss of biodiversity in Vietnam has been very critical, with many species on the brink of extinction because the natural resources have been exploited by humans [69,78]. This alarming degradation of biodiversity has occurred throughout the country [16,22] in all three types of biodiversity: species, ecosystems, and genetic [74]. About 10% of plant species are listed as endemic; separately, orchid endemism is 19.2% [74].
According to Global Biodiversity, the direct key causes of biodiversity loss in Vietnam include land conversion, infrastructure development, invasive species, overexploitation, pollution, climate change, natural disaster, extreme weather, population growth, forest fire, deterioration of natural ecosystem, replacement of exotic crop plants and domestic animals [69,74]. These direct causes are fueled by socio-economic factors at various scales, such as population growth and poverty [67,74,79]. Human activities are considered the main cause of deforestation and biodiversity loss [22,67,74,80,81,82,83,84]. Previous studies have shown that drivers of deforestation and degradation in Vietnam are highly complex and can form the networks of economic and political interests [85]. There are four main direct causes of deforestation in Vietnam including conversion to agriculture; infrastructure development; unsustainable logging (notably illegal logging); and forest fires [86,87]. The studies have indicated that biodiversity conservation in a protected area is influenced by various factors related to the establishment and management of the protected areas, local communities living next to the protected areas, and policy on protected areas’ national management and financial facilities. These factors are socioeconomic and cultural factors, and are related to the management of local communities that neighbor protected areas, which are as important as resources within the protected areas [88]. This means that any conservation efforts need to be combined with economic development plans to provide livelihood opportunities for local communities to reduce the pressure on biodiversity. Many efforts have been made to protect the remaining biodiversity and halt the loss of species in Vietnam [23]. Current conservation legislation in Vietnam is focused on biodiversity, with limited consideration of socio-economic issues [89].
Vietnam is located in the Indo-Burma region, ranked as one of the top 10 biodiversity hotspots and as the top five for being threatened in the world [90]. The protected areas have played an essential role in remaining, preserving flora and fauna diversity [91,92,93,94,95]. Recognizing the value and significance of protected areas for biodiversity, Vietnam is on the way to achieving the National Biodiversity Strategy to 2020 and the vision for 2030 to cover 9% of the country’s territory as protected areas [96]. This shows a need to define the priority areas for conservation (Nhan et al., 2015) and the establishment of new protected areas [95].
Boundary marking has been shown as one of the most substantial factors relating to the establishment and administrative effectiveness of protected areas [93]. Most protected areas in Vietnam were formulated with restricted borders that often stay inside the administrative boundaries of provinces [97]. While many specific landscapes, habitats, and ecosystems are the targets of conservation [92], they have existed outside the protected areas [98]. It is necessary to re-assess the value of biodiversity within the protected areas of Vietnam to identify the functional zones for the efficiency of governance, propose the establishment of new protected areas or dissolve the low-value ones [97].

4. Data and Methods

4.1. Data Collection

This study is based on a national survey and expert interviews. We conducted a national survey in Vietnam from March to July 2017 using a questionnaire for both direct (face to face) and indirect (via emails and phone calls) interviews (Appendix S1). We used the stratified sampling method to select the respondents. First, we collected the list of employees who worked in the fields of forest protection and biodiversity conservation. The employees were classified into the following three groups: Governmental Administration and Organizations, Universities and Research Institutions, and Protected Areas. We then collected a random sample of respondents from each group. The stratified sampling reduces errors relative to simple random sampling and ensures that observations and interviews from all relevant groups are included in the sample [99]. We had intended to conduct face-to-face interviews with all. However, some respondents were not available for face-to-face interviews, and thus the questionnaire was sent to them via email. In total, we interviewed 185 respondents from all groups (Appendix S2), including 128 face-to-face interviews and 57 email interviews. The survey questions focused on the criteria, indicators, and their importance levels that belong to the three factors of the PSR model: Pressure, State, and Response. The face-to-face interviews lasted between 1 and 2 h and were conducted in Vietnamese. The research results were based on the first author’s PhD dissertation, which was accepted by an ethnic committee from the Technical University Dresden, Germany.

4.2. Data Analysis

All data from the survey were cross-checked following the triangulation method [100] to identify reliable information. Three processes were performed to identify the final criteria system, including: (1) synthesizing from the relating studies, (2) interviewing and consulting experts of conservation and biodiversity, and (3) organizing an academic seminar to identify a final criteria system. Then, we analyzed the collected data to identify and categorize the criteria and sub-criteria according to the environmental PSR model. In addition, the statistics of pairwise comparison and Analytic Hierarchy Process (AHP) were used to measure and compare the influence levels of criteria and sub-criteria in defining priority areas for biodiversity conservation.

4.2.1. Statistics of Pairwise Comparison

Since the 1950s, numerous methodologies of psychology called multidimensional scaling (MDS) have been studied and applied in analyzing the similarity and preferential choice data. Nevertheless, the solution has not yet been found to deal with the problem of gaining the perfect voting in multidimensionality [101]. The majority rule, called the Condorcet Winner, chooses the winner, which is preferred in every one-to-one comparison with the other choices [102].
As shown in the heading of the questionnaire, the data of the pairwise comparison was not gathered directly. The pairwise value was calculated by comparing two criteria in one pairwise of each respondent and synthesizing as in Appendix S3. To examine their importance, the scale of integers ranging from 1 to 9 was applied [44,103]. For example, A and B are two criteria in one pairwise comparison. These are three possible situations: A greater than B (A > B), A equal to B (A = B), and A less than B (A < B). The intensity of importance is 1 represented for the second case (A = B). Consequently, each pairwise can be presented by 8 cases of A > B, one case of A = B, and 8 cases of A < B.
The total of assessments was synthesized for each pairwise from all the respondents (183 people after removing 2 cases of outliers). Twenty-eight pairwise comparisons and 17 instances of them are described entirely in Appendix S3. According to the majority rule (Condorcet Winner), the total of respondents selecting the same situation of A > B, A = B, and A < B for each pairwise comparison was calculated for comparison.
The acceptable risk was demonstrated in the formula of error estimation from Cochran [104]. The chance is commonly called the margin of error, which has been used by researchers as the limit for the willingness to accept [104]. The acceptable margin of error is 5% and 3% for categorical data and continuous data, respectively [105]. The appropriate precision for prevalence is 5% by experience [106,107,108]. Therefore, in this study, a percentage of difference was used to show the reliability of comparison among the number of respondents who chose A > B, A = B, or A < B. The rule was used to identify the appropriate level of one pairwise comparison as follows:
-
Five percent of the difference was used to select the majority to belong to A > B, A = B, or A < B.
-
If the number of A > B and A < B is similar or higher than under 5% out of total respondents, the situation of A = B is the priority option.
-
If the highest number of three situations (A > B, A = B, and A < B) are higher than others above 5% out of total respondents, this situation is the opinion of the majority.
-
If A > B or A < B accounts for the majority, the case of the statistical model is used in this situation.
-
If the number of A > B is similar to the number of A < B, and they are more significant than the A = B, the situation of A = B is the collective opinion of all respondents. As such, A and B have equal importance.
-
If once the number of either A > B or A < B is less than the number of A = B, and the other is similar to the number of A = B, the trend of majority opinions inclines to the number identical to the A = B.
There are 27 pairwise comparisons for 3 factors, 7 criteria and 17 sub-criteria (Appendix S3) that were used to identify the level of importance of each criterion in the pairwise comparisons. A and B refers to two criteria in each pairwise comparison. Three situations of A > B, A = B, and A < B were calculated regarding the total number of respondents. Various pairwise comparisons were significantly different among of three situations such as Nature–Human, Location–Hydrology, Location–Forest Type, Topography–Forest Type, Hydrology–Forest Type, Climate Change–Nature Disaster, Distribution–Livelihood, Density–Population, Density–Livelihood, and Forest Management Types–Size of Forest Area. The rest of the gained quantities are similar in three situations, hence the percentage of difference value was used to judge which one is greater or whether they are equal together.
The critical levels of two criteria are alike for seven pairwise comparisons, and they are; State–Response, Species–Ecosystem, Conservation–Law, Education–Law, Hydrology–Climate, Distribution–Density, and Density–Population. Most respondents chose the case of A = B in comparison to A > B or A < B. It also points out a unique case of pairwise comparisons that obtained a similar number of respondents that chose the situations of A = B and A < B. It is the pairwise comparison of distribution and quantity with the same amount of responses accounting for 37% of the situations and 26% of the rest (A > B). It can be seen that the trend of the majority is tilted towards the status of A < B.

4.2.2. Analytic Hierarchy Process (AHP)

The Analytic Hierarchy Process (AHP) is a multi-criteria decision-making approach firstly developed by Saaty [46]. The AHP is attractive to many researchers due to the effective mathematical properties of the method [109]. Another advantage of the AHP method is that it enables users to determine the weights of the parameters in the solution of a multi-criteria problem [62]. Solving a problem using AHP is conducted using the weights or priorities of the criteria subjected to pairwise comparison. Weights or priorities are determined by normalizing the pairwise comparison matrix [62].
While performing pairwise comparisons of criteria in the AHP method, a certain level of inconsistency can occur [62]. Thus, the logical consistency of pairwise comparisons must be checked [110]. To measure the consistency of pairwise comparison judgments, the consistency ratio proposed by Saaty [44] is used. A consistency ratio is calculated for the pairwise comparison matrix. In our study, the AHP-based weights of criteria are used to synthesize the mapping data of the criteria to identify and to consider when making a spatial decision, which will be calculated through the overlay equation integrated into MCDA and GIS [31,47,62]. Equation (1) (below) was used to synthesize biodiversity conservation value for study areas.
C k = i = 1 I W i X i k
where Ck is the biodiversity conservation value at the kth intersection region; X i k is the score contained within GIS layer of ith at the kth intersection region; Wi is the weight of ith indicator, which can be changed based on the critical level of each indicator.
The steps of estimating a biodiversity conservation index was implemented as follows:
(a)
Criteria and their factors of biodiversity conservation were chosen from the literature review and the interviews.
(b)
The grade of each factor was transformed from the measured data through the fuzzy set.
(c)
The weights of each factor were assigned by the AHP method based on Saaty’s scale and the pair-wise comparison matrix (Table 1).
(d)
Biodiversity conservation index was then calculated by a simple linear priority function as in Equation (1).
In order to use the results calculated by the AHP method, a critical aspect of the AHP is to check the consistency [44,111,112]. Saaty [44] proposed the consistency ratio (CR) to identify the consistencies of the pairwise comparison matrices. The test of consistency must be done when the number of criteria used in a pairwise comparison matrix is higher than 2. When the number increases, the pairwise comparisons climb significantly. This makes inconsistencies arise, and it becomes complicated to check the consistencies.
A pairwise comparison matrix considered as consistent or inconsistent depends on the test of the Consistency Ratio (3). The test can pass when the Consistency Ratio is less than 0.1.
C I = λ n n 1
C R = C I R I
where CR is the Consistency Ratio as in Equation (3); CI is the Consistency Index as in Equation (2); RI is the average Random Index based on the Matrix Size (Table 2), n is the number of criteria used in a pairwise comparison matrix (n ≤ 10), and λ is the average of the elements of consistency vector.
The procedure for checking the consistency includes the four following steps:
-
Step 1: Identify the λ of the pairwise comparison matrix.
-
Step 2: Apply Equation (2) to calculate the Consistency Index (CI)
-
Step 3: Apply Equation (3) to estimate the Consistency Ratio (CR).
-
Step 4: The judgment of the consistency of the pairwise comparison matrix is performed through the comparison between the CR value and the consistency threshold (0.1). The pairwise comparison matrix is identified to be acceptable when CR < 0.1.

5. Results

5.1. Criteria and Indicators for Defining Priority Areas

In many previous studies, the indicators for setting priorities for conservation focus on plant and animal species such as species richness, rarity, endemism, representativeness, and complementarity to drive the conservation effort [15,16,17]. Some studies emphasize the importance of human population pressure [113,114,115] or human efforts to protect habitat [115,116], where deforestation and forest degradation have happened [117]. In our study, we integrate conservation and social aspects in the criteria for setting priorities for biodiversity conservation.
Table 3 presents the criteria set to define priority areas for biodiversity conservation in Vietnam. Based on three factors of the PSR model, seven criteria and 17 indicators were identified to support prioritizing areas for conservation in the context of Vietnam.
a. Pressure
The current literature has demonstrated that analyzing the pressure on biodiversity, its trends, and origins have become even more urgent since the loss of biodiversity is at such an alarming rate in many countries [118]. In the study, pressures include natural and human-induced factors that cause environmental change. Natural pressures are derived from unexpected natural changes such as climate change and natural disasters. Usually, these changes are unwanted and seen as negative (damage, degradation). Therefore, two main indicators of natural pressure were used, including climate change and natural disasters (flooding, drought, or earthquake). Natural pressures are unpredictable, and so human society is struggling to find solutions to minimize the impact of natural pressures. Human-induced pressures are consequences of human activities (land-use change, logging, hunting, extraction, and use of resources) that have the potential to cause or contribute to adverse effects [74,119,120]. Previous studies have indicated that 6 million square kilometers (32.8%) of protected land in the world is under intense human pressure.
Our study suggests four indicators of human-induced pressure, namely population numbers, distribution of population, the density of population, and the livelihood of locals. Each of these pressures can have different effects, some of which emerge in the short-term (e.g., land use, deforestation), while others are long-term (e.g., climate change) [74,119].
b. State
The State of biodiversity is represented by the number of biological features (measured within species, between species and ecosystems), of physical and chemical features of ecosystems, and/or of environmental functions, vulnerable to pressures in a certain area [119]. Many studies have shown that habitats or environmental conditions are considered as indicators of the existence of species [121,122,123]. Prediction of species distribution based on the existence of their habitat is used to identify the priority areas for conservation as well as for field surveys [122]. Therefore, one of the most important methods to conserve species is the protection of their habitats [22]. It has shown that the occurrence of rare and sensitive species is determined within their range of appropriate habitats [30].
In our study, the State refers to the number of species, the status of the forest ecosystem and wildlife resources. Due to the pressure on the environment, the State of the environment changes. These changes then have impacts on the functions of the environment, such as human and ecosystem health, resource availability, losses of manufactured capital, and biodiversity [26]. Previous studies have shown that the State may refer either to natural systems alone [124,125] or to both natural and socio-economic systems [126]. Depending on the systems chosen for description, indicators of State can be very different from one study to another [119]. For species, we focused on two main indicators: richness and rarity. The state of the ecosystem consists of five indicators: location, topography, hydrology, climate, and forest type.
Many studies have shown that the increase of species richness in one region depends on the stability level of the forest area at that time [67,127,128,129,130,131,132,133,134,135,136,137,138,139]. Forest is considered a significant factor in biodiversity conservation since it provides appropriate habits for many species. It means that the level of species richness is higher in the area covered by forest for a longer period. The diversity of the plant life significantly depends on the disturbance in the past [123]. Therefore, the priority levels of richness for biodiversity conservation are determined by monitoring the forest cover.
c. Responses
Responses may seek to control Pressures (prevention, mitigation), to maintain or restore the State of the environment, to help to accommodate impacts (adaptation) or even deliberate “do nothing” strategies [26,119,140]. For applications regarding biodiversity, Responses are the measures taken to address drivers, pressures, state, or impacts. They include measures to protect and conserve biodiversity (in situ and ex situ), and include, for example, measures to promote the equitable sharing of the monetary or non-monetary gains arising from the utilization of genetic resources.
Most of the indicators developed for Responses concern political actions of protection, mitigation, conservation, or promotion [26,37]. Other indicators refer to Responses as being a mixed result of both effective top-down political action and bottom-up social awareness [119]. Some societal responses may be considered as negative driving forces because they aim at redirecting prevailing trends in consumption and production patterns. Other responses aim at raising the efficiency of products and processes [26].
In this study, we focused on responses related to conservation efforts, education, and law. Conservation efforts are measured by forest management types and the size of forest areas. In addition, conservation activities delivered through strengthening education and enforcing the law are also evaluated as responses to reduce the pressure on biodiversity.

5.2. Weights of Criteria Based on All Respondents

The weights of the factors, criteria and indicators for identifying the priority areas of biodiversity conservation in Vietnam were calculated using the data from all respondents. The values of the Consistency Ratio (CR) in Table 4 of the pairwise comparison matrices were lower than the Consistency Ranking (10%). Thus, the matrices were consistent, and the calculated weights were appropriate to use. The assignment of percentage values of factors, criteria, and indicators are computed and are shown in Table 4.
The first level is the ultimate purpose (100%) of assessing the influences of the criteria on biodiversity conservation in Vietnam. The second level comprises the three factors used in the environmental model to measure biodiversity conservation. The factors account for 26%, 41%, and 33% of “Condition”, “Pressure”, and “Response”, respectively. The third level witnesses a huge difference among seven criteria, with 31% of “Human”, then it is 17% of “Ecosystem”, the rest is distributed evenly. With the exception of 24% for “Education” and “Law”, the fourth level illustrates 17 indicators of five criteria. The “Livelihood” factor is highest with 13.12%. The mediate group consists of “Types of forest management”, “Rarity”, “Forest type”, “Climate change”, “Density”, and “Quantity”, fluctuating from 5.8% to 7. 71%. Finally, the remaining eight of the seventeen indicators account for just 23.84%.

5.3. Weights of Criteria Based on the Groups

5.3.1. The Protected Areas Group

The respondents working at Protected Areas (PAs) are the key participants of the survey. Their attitudes and experiences help to assess precisely the role of the criteria in biodiversity conservation. The respondents of PAs, located mostly in the North of Vietnam, account for 34.59% of all respondents, of which 51 people (26.27%) were interviewed in person.
The data of the respondents at PAs are filtered separately to calculate the weights of the entire presented criteria in the questionnaire. The consistent tests were applied to all pairwise comparison matrices. Their consistency ratio was all within the consistency threshold (Table 4). The weights were synthesized and described in detail in Table 4. It can be seen that the distribution of weights in PAs is relatively similar to the distribution calculated by total respondents. Exceptionally, the “Richness” and “Rarity” indicators obtained the same percentage (50%) for each instead of 33% and 67% in synthesizing all respondents, respectively. It expresses the required functions and characteristics in establishing protected areas in Vietnam that they are places not only to preserve rare species, but also to remain and enhance the diversity of species.

5.3.2. The Government Administration and Organizations Group

Government administration and organizations represent the communities and the state to implement the law and the policy of the country. Although the group only accounts for 10.26% of all respondents, they are as a group representing the opinion of the Vietnamese government. The data of responses of the organizations were synthesized and calculated separately to gain the weights of all criteria (Table 4).
The pairwise comparison matrices are considered consistent as they passed the consistency test with the Consistency Ratio (CR) lower than 10% (Table 4). The results of the group are pretty similar to the group of Protected Areas and all respondents within the second level. The criteria in the third level assessed are reasonably different. The distribution of weight among “Education”, “Law”, and “Conservation” changed. The biodiversity conservation by “Law” is the most crucial, accounting for nearly 50% of weight, while the results of other groups, as well as all respondents, show that almost all of their consideration focused on “Education” criterion. It shows that “Law” has been the most interested of the Government Organizations in responding to reduce the loss of biodiversity, which is to be expected when considering the functions and characteristics of Government Organizations.

5.3.3. Universities and Research Institutes Group

The group with the highest number of respondents is the Universities and Research Institutes group with 50.41%. It includes six universities and nine research institutes.
The pairwise comparison matrices were established using the data of 92 respondents (49.86%) from the Universities and Research Institutes group. The weight set calculated by the respondents of universities and research institutes is presented in Table 4.
There is a significant change in the assignment of the weights when it is compared with the case of all respondents. In the second level, the “Response” factor with 41% of weight replaced the top position of “Pressure” and pushed it to bottom with 26% of the weight. The third level witnesses the adjustment of the ratio between “Species” and “Ecosystem” when they are equal in terms of their importance. Instead, the “Ecosystem” criterion is assessed as more important than “Species” by all respondents. The ratio of the indicators in the fourth level is more or less unchanged. Remarkably, the “Climate” indicator climbed to the peak, accounting for 28% impact on the “Ecosystem” criterion, while the “Forest type” indicator fell from 34% to 22% in the importance scale in the assessment of the Universities and Research Institutes group.
The Universities and Research Institutes group represents the people who are working on the training and research field of forestry, biodiversity, and conservation in Vietnam. The assessment results in defining priority areas for biodiversity conservation reveal that the highest interest focuses on disseminating information and education to prevent and reduce the pressure on biodiversity.

5.3.4. Comparison between Weights of the Groups

The survey received the opinions of respondents regarding the importance levels of the established criteria. To use the AHP theory for identifying the weights, the value of each pairwise comparison was the difference in importance level calculated between two criteria in one pairwise. The relationships among the criteria formulated twenty-seven pairwise comparisons.
They were grouped into three different levels, including the factors of the second level, the criteria of the third, and the indicators of the fourth. These were nine pairwise comparison matrixes with one matrix for the second level, three matrices for the third, and five matrices for the fourth. The Consistency Ratio (CR) was used to identify the consistencies of the pairwise comparison matrices (Table 4).
The statistics of weight set in the groups of respondents helped in the analysis and assessment of each factor, criterion, and indicator. Although the different values of weight appeared in a few sectors of each group, those values were not the opinion of the majority. The synthesis of the weights for each group in Table 4 illustrates a part of the common trend of the different fields, such as research, training, planning, policy, decision-making, and implementation. The Protected Areas group assessed the importance level of the factors in the environmental model in a similar way to that of the result based on the assessment of all respondents. The results from the Universities and Research Institutes group showed the most important factor, which was the “Response” factor with 41%. In contrast, the weight of the “Pressure” factor accounted for the most significant percentage at 41% and was calculated based on the data selected from the Protected Areas group, Government Organizations group, and all respondents.

6. Discussion

Prioritization exercises are valuable tools to structure a balance between conservation measures and sustainable land use management. In the last decades, many efforts have been made to develop science-based methodologies to select priority areas for biodiversity conservation [141,142,143]. Previous studies have documented a range of priority-setting approaches covering a broad spectrum from mathematical to intuitive [142,144,145]. Much of the conservation priority-setting literature concerns the establishment of criteria to identify priority areas for biodiversity conservation [7,13,14,146]. Some studies to formalize the process of setting conservation priorities have focused on ecological and biological criteria to aid systematic selection of areas for biodiversity conservation [7,12,13,14,146]. According to Asaad, Lundquist, Erdmann and Costello [146], eight ecological and biological criteria were developed to identify suitable locations for biodiversity conservation. Among these, four habitat-based criteria are captured, including uniqueness and rarity of habitats, fragility and susceptibility of habitats, importance for ecological integrity, and representativeness of all habitats [146].
Previous studies have shown that the selection of most priority area networks focuses primarily on species richness, especially that of rare or endangered species [16] and occurrence locations [147,148]. Studies have used either species or ecosystems as biodiversity surrogates to identify priority areas for biodiversity conservation that ensure both species and ecosystems conservation [141,149,150]. Asaad et al. [151] have developed an alternative approach to delineate areas of importance for biodiversity conservation that uses a range of ecological criteria, multiple sources of data, and wide-ranging species taxonomic groups. The study suggested five different criteria to assess the value of critical habitat, species diversity, and charismatic threatened and endemic species.
Despite the range of conservation priority-setting studies investigated, there remain significant challenges in implementing biodiversity conservation that reconcile criteria for identifying priority areas and representative networks for biodiversity protection [146]. The identification of priority areas demands the integration of biophysical data on ecosystems together with social data on human pressures and planning opportunities [11]. However, previous studies have tended to focus on ecological and biological criteria, with little effort to understand the social, economic, and political dimensions within which the protected areas are placed [11]. Our contribution to the conservation priority-setting literature is to apply a multiple criteria analysis based on the PSR model for the establishment of seven criteria and 17 indicators that integrates both biological and socio-economic aspects to set priorities for biodiversity conservation in Vietnam.
One value addition of the research includes the application of the analytical hierarchy process (AHP) to determine the weight of each criterion from a multi-stakeholder perspective that helps to measure its importance level in defining priority areas for biodiversity conservation. In addition, a comprehensive assessment of respondents’ opinions provides an insight into different preferences within three main groups including governmental, conservational, research-specific, with regard to weighting the influence of factors and criteria for defining high-priority areas for biodiversity conservation. Our study also reveals that the groups of Governmental Administration and Protected Areas put a focus on the “Pressure” factor while the group of Research Institutions emphasized the importance of “Response” factor in the evaluation process. These findings allow for a better understanding of different approaches to managing and developing protected areas and designate new priority areas based on respective multi-criteria decision-making (prioritization) in Vietnam.

7. Conclusions

Identification of priority areas is an important step in conservation planning to maximize the benefits of conservation strategies. However, the formulation of a criteria system that integrates both biological and socio-economic aspects is still a challenging task for conservationists and practitioners. In this study, we used the Pressure–State–Response model to develop criteria and indicators for defining priority areas for biodiversity conservation. We use empirical data from 185 respondents categorized into three groups: Governmental Administration and Organizations, Universities and Research Institutions, and Protected Areas, collected in a 2017 survey in Vietnam. We apply Analytic Hierarchy Process (AHP) theory to calculate the weight of the criteria and indicators based on information from all respondents and the groups of respondents.
Our results have suggested seven criteria and 17 indicators that integrate biological and socio-economic factors to set priorities for biodiversity conservation in Vietnam. The results have slao shown that the priority levels for biodiversity conservation could be identified by three main factors: Pressure, State, and Response, with the value of the weight of 41%, 26%, and 33%, respectively. In addition, our study revealed that the groups of Governmental Administration and Protected Areas put a focus on the “Pressure” factor while the group of Research Institutions emphasized the importance of the “Response” factor in the evaluation process.
Based on these findings, we emphasize the importance of setting priorities for biodiversity conservation through criteria and indicators. A criteria system integrating biological and social aspects could provide a useful tool to define priority areas for biodiversity conservation. However, further research is needed to apply these suggested criteria and indicators to identify priority areas for biodiversity conservation in practice and to examine the reliability of these criteria and indicators.

Supplementary Materials

The following supporting information can be downloaded at: https://www.mdpi.com/article/10.3390/f13091341/s1, Appendix S1: Questionnaire; Appendix S2: List of interviewees; Appendix S3: Synthesizing the numbers of respondents in pairwise.

Author Contributions

Conceptualization, X.D.V.; methodology, X.D.V.; software, X.D.V.; validation, X.D.V., E.C., T.T.N. and C.M.; formal analysis, X.D.V.; investigation, X.D.V.; resources, X.D.V.; data curation, X.D.V.; writing—original draft preparation, X.D.V.; writing—review and editing, E.C., T.T.N. and C.M.; visualization, X.D.V.; supervision, E.C., T.T.N. and C.M.; project administration, X.D.V. All authors have read and agreed to the published version of the manuscript.

Funding

This research was funded by the Vietnamese Government Scholarship (3979/QĐ-BGDĐT). The publication of this article was funded by the Open Access Fund of the Leibniz University Hannover.

Data Availability Statement

Not applicable.

Acknowledgments

This research was supported by the Chair Group of Remote Sensing of the Institute of Photogrammetry and Remote Sensing, Technical University of Dresden, Dresden, Germany, and the Vietnam National University of Forestry. We would like to express our gratitude to the experts, researchers, and officials involved in the study, particularly those from the protected areas in Vietnam, IUCN Vietnam, Biodiversity Conservation Agency (MONRE), Department of Nature Conservation (MARD), Forest Protection Department (MARD), and the Vietnam National University of Forestry for providing valuable data. My special thanks to forest rangers and communities at Cuc Phuong National Park, Pu Luong Nature Reserve, and Ngoc Son Ngo Luong Nature Reserve.

Conflicts of Interest

The authors declare no conflict of interest.

References

  1. Mittermeier, R.A.; Turner, W.R.; Larsen, F.W.; Brooks, T.M.; Gascon, C. Global biodiversity conservation: The critical role of hotspots. In Biodiversity Hotspots; Springer: Berlin/Heidelberg, Germany, 2011; pp. 3–22. [Google Scholar]
  2. De Groot, R.; Brander, L.; Van Der Ploeg, S.; Costanza, R.; Bernard, F.; Braat, L.; Christie, M.; Crossman, N.; Ghermandi, A.; Hein, L. Global estimates of the value of ecosystems and their services in monetary units. Ecosyst. Serv. 2012, 1, 50–61. [Google Scholar] [CrossRef]
  3. Christie, M.; Fazey, I.; Cooper, R.; Hyde, T.; Kenter, J.O. An evaluation of monetary and non-monetary techniques for assessing the importance of biodiversity and ecosystem services to people in countries with developing economies. Ecol. Econ. 2012, 83, 67–78. [Google Scholar] [CrossRef]
  4. Costanza, R.; De Groot, R.; Sutton, P.; Van der Ploeg, S.; Anderson, S.J.; Kubiszewski, I.; Farber, S.; Turner, R.K. Changes in the global value of ecosystem services. Glob. Environ. Change 2014, 26, 152–158. [Google Scholar] [CrossRef]
  5. Chapin, F.S., III; Zavaleta, E.S.; Eviner, V.T.; Naylor, R.L.; Vitousek, P.M.; Reynolds, H.L.; Hooper, D.U.; Lavorel, S.; Sala, O.E.; Hobbie, S.E.; et al. Consequences of changing biodiversity. Nature 2000, 405, 234. [Google Scholar] [CrossRef]
  6. Pimm, S.L.; Russell, G.J.; Gittleman, J.L.; Brooks, T.M. The future of biodiversity. Science 1995, 269, 347–350. [Google Scholar] [CrossRef] [PubMed] [Green Version]
  7. Wilson, K.A.; Carwardine, J.; Possingham, H.P. Setting conservation priorities. Ann. N. Y. Acad. Sci. 2009, 1162, 237–264. [Google Scholar] [CrossRef]
  8. Margules, C.R.; Pressey, R.L.; Williams, P.H. Representing biodiversity: Data and procedures for identifying priority areas for conservation. J. Biosci. 2002, 27, 309–326. [Google Scholar] [CrossRef]
  9. Mehri, A.; Salmanmahiny, A.; Mirkarimi, S.H.; Rezaei, H.R. Use of optimization algorithms to prioritize protected areas in Mazandaran Province of Iran. J. Nat. Conserv. 2014, 22, 462–470. [Google Scholar] [CrossRef]
  10. Lu, Z.; Xu, W.-H.; Ouyang, Z.-Y.; Zhu, C.-Q. Determination of priority nature conservation areas and human disturbances in the Yangtze River Basin, China. J. Nat. Conserv. 2014, 22, 326–336. [Google Scholar] [CrossRef]
  11. Balram, S.; Dragićević, S.; Meredith, T. A collaborative GIS method for integrating local and technical knowledge in establishing biodiversity conservation priorities. Biodivers. Conserv. 2004, 13, 1195–1208. [Google Scholar] [CrossRef]
  12. Day, J.C.; Roff, J. Planning for Representative Marine Protected Areas: A Framework for Canada’s Oceans; World Wildlife Fund: Toronto, Canada, 2000. [Google Scholar]
  13. Roberts, C.M.; Andelman, S.; Branch, G.; Bustamante, R.H.; Carlos Castilla, J.; Dugan, J.; Halpern, B.S.; Lafferty, K.D.; Leslie, H.; Lubchenco, J. Ecological criteria for evaluating candidate sites for marine reserves. Ecol. Appl. 2003, 13, 199–214. [Google Scholar] [CrossRef] [Green Version]
  14. Gilman, E.; Dunn, D.; Read, A.; Hyrenbach, K.D.; Warner, R. Designing criteria suites to identify discrete and networked sites of high value across manifestations of biodiversity. Biodivers. Conserv. 2011, 20, 3363–3383. [Google Scholar] [CrossRef] [Green Version]
  15. Kier, G.; Barthlott, W. Measuring and mapping endemism and species richness: A new methodological approach and its application on the flora of Africa. Biodivers. Conserv. 2001, 10, 1513–1529. [Google Scholar] [CrossRef]
  16. Myers, N.; Mittermeier, R.A.; Mittermeier, C.G.; da Fonseca, G.A.B.; Kent, J. Biodiversity hotspots for conservation priorities. Nature 2000, 403, 853–858. [Google Scholar] [CrossRef]
  17. Woodhouse, S.; Lovett, A.; Dolman, P.; Fuller, R. Using a GIS to select priority areas for conservation. Comput. Environ. Urban Syst. 2000, 24, 79–93. [Google Scholar] [CrossRef]
  18. Marchese, C. Biodiversity hotspots: A shortcut for a more complicated concept. Glob. Ecol. Conserv. 2015, 3, 297–309. [Google Scholar] [CrossRef] [Green Version]
  19. Mittermeier, R.A.; Gil, P.R.; Hoffmann, M.; Pilgrim, J.; Brooks, T.; Mittermeier, C.G.; Lamoreux, J.; Fonseca, G.A. Earth’s Biologically Richest and Most Endangered Terrestrial Ecoregions; Conservation International: Arlington, VA, USA, 2004. [Google Scholar]
  20. Tran, H.T.; Tinh, B.D. Asian Cities Climate Resilience Working Paper Series 4: Cost-Benefit Analysis of Mangrove Restoration in Thi Nai Lagoon, Quy Nhon City, Vietnam; International Institute for Environment and Development (IIED): Quy Nhon, Vietnam, 2013. [Google Scholar]
  21. Dang, L.H.; Tyl, N. Willingness to Pay for the Preservation of Lo Go-Xa Mat National Park in Vietnam; Economy and Environment Program for Southeast Asia (EEPSEA): Tay Ninh, Vietnam, 2009. [Google Scholar]
  22. Gordon, E.A.; Franco, O.E.; Tyrrell, M.L. Protecting Biodiversity: A Guide to Criteria Used by Global Conservation Organizations; Yale School of Forestry & Environmental Studies: New Haven, CT, USA, 2005. [Google Scholar]
  23. MARD. Report on Planning for Special Use Forest to 2020; Vietnam Ministry of Agriculture and Rural Development: HaNoi, Vietnam, 2014. [Google Scholar]
  24. OECD. Core Set of Indicators for Environmental Performance Reviews: A Synthesis Report by the Group on the State of the Environment; Organisation for Economic Co-operation and Development: Paris, France, 1993; pp. 1–39. [Google Scholar]
  25. Martins, J.H.; Camanho, A.S.; Gaspar, M.B. A review of the application of driving forces–Pressure–State–Impact–Response framework to fisheries management. Ocean. Coast. Manag. 2012, 69, 273–281. [Google Scholar] [CrossRef]
  26. Gabrielsen, P.; Bosch, P. Environmental Indicators: Typology and Use in Reporting; European Environment Agency: Copenhagen, Denmark, 2003. [Google Scholar]
  27. Dumanski, J.; Pieri, C. Application of the Pressure-State-Response Framework for the Land Quality Indicators (LQI) Programme; FAO: Rome, Italy, 1996. [Google Scholar]
  28. Levrel, H.; Kerbiriou, C.; Couvet, D.; Weber, J. OECD pressure–state–response indicators for managing biodiversity: A realistic perspective for a French biosphere reserve. Biodivers. Conserv. 2009, 18, 1719. [Google Scholar] [CrossRef] [Green Version]
  29. Saunders, D.; Margules, C.; Hill, B. Environmental Indicators for National State of the Environment Reporting: Biodiversity; CSIRO Wildlife Ecology: Canberra, Australia, 1998. [Google Scholar]
  30. Miller, R.I. Mapping the Diversity of Nature; Springer Science + Business Media: Berlin/Heidelberg, Germany, 1994. [Google Scholar]
  31. Phua, M.-H.; Minowa, M. A GIS-based multi-criteria decision making approach to forest conservation planning at a landscape scale: A case study in the Kinabalu Area, Sabah, Malaysia. Landsc. Urban Plan. 2005, 71, 207–222. [Google Scholar] [CrossRef]
  32. Smith, P.G.R.; Theberge, J.B. A review of criteria for evaluating natural areas. Environ. Manag. 1986, 10, 715–734. [Google Scholar] [CrossRef]
  33. Boteva, D.; Griffiths, G.; Dimopoulos, P. Evaluation and mapping of the conservation significance of habitats using GIS: An example from Crete, Greece. J. Nat. Conserv. 2004, 12, 237–250. [Google Scholar] [CrossRef]
  34. de Oliveira AvernaValente, R.; Vettorazzi, C.A. Definition of priority areas for forest conservation through the ordered weighted averaging method. For. Ecol. Manag. 2008, 256, 1408–1417. [Google Scholar] [CrossRef]
  35. Lee, W.; McGlone, M.; Wright, E. Biodiversity inventory and monitoring: A review of national and international systems and a proposed framework for future biodiversity monitoring by the Department of Conservation. In Landcare Research Contract Report; LC0405/122; New Zealand, 2005; (unpublished). [Google Scholar]
  36. Long, T.T.; Dang, N.X.; Rastall, R. Giám sát Đa dạng Sinh học có sự Tham gia: Hướng dẫn phương pháp; Netherlands Development Organisation (SNV): Hanoi, Vietnam, 2016. [Google Scholar]
  37. OECD. Environmental Indicators–Development, Measurement and Use; OECD Environment Directorate: Paris, France, 2003. [Google Scholar]
  38. Kangas, J. Multiple-use planning of forest resources by using the analytic hierarchy process. Scand. J. For. Res. 1992, 7, 259–268. [Google Scholar] [CrossRef]
  39. Kangas, J.; Kuusipalo, J. Integrating biodiversity into forest management planning and decision-making. For. Ecol. Manag. 1993, 61, 1–15. [Google Scholar] [CrossRef]
  40. Mendoza, G.A.; Sprouse, W. Forest planning and decision making under fuzzy environments: An overview and illustration. For. Sci. 1989, 35, 481–502. [Google Scholar]
  41. Anselin, A.; Meire, P.M.; Anselin, L. Multicriteria techniques in ecological evaluation: An example using the analytical hierarchy process. Biol. Conserv. 1989, 49, 215–229. [Google Scholar] [CrossRef]
  42. Saaty, T.L.; Gholamnezhad, H. High-Level Nuclear Waste Management: Analysis of Options; SAGE Publications: New York, NY, USA, 1982; Volume 9, pp. 181–196. [Google Scholar]
  43. Varis, O. The Analysis of Preferences in Complex Environmental. J. Environ. Manag. 1989, 28, 283–294. [Google Scholar]
  44. Saaty, T.L. The Analytic Hierarchy Process; McGraw-Hill: New York, NY, USA, 1980; p. 324. [Google Scholar]
  45. Malczewski, J. GIS-based land-use suitability analysis: A critical overview. Prog. Plan. 2004, 62, 3–65. [Google Scholar] [CrossRef]
  46. Saaty, T.L. A scaling method for priorities in hierarchical structures. J. Math. Psychol. 1977, 15, 234–281. [Google Scholar] [CrossRef]
  47. Jiuquan, Z.; Su, Y.; Wu, J.; Liang, H. GIS based land suitability assessment for tobacco production using AHP and fuzzy set in Shandong province of China. Comput. Electron. Agric. 2015, 114, 202–211. [Google Scholar] [CrossRef]
  48. Schmoldt, D.L.; Kangas, J.; Mendoza, G.A.; Pesonen, M. The Analytic Hierarchy Process in Natural Resource and Environmental Decision Making; Springer Science & Business Media: Berlin/Heidelberg, Germany, 2001; Volume 3. [Google Scholar]
  49. Pukkala, T. Multi-Objective Forest Planning. Manag. For. Ecosyst. 2003, 6, 216. [Google Scholar] [CrossRef]
  50. Pukkala, T.; Kangas, J. A method for integrating risk and attitude toward risk into forest planning. For. Sci. 1996, 42, 198–205. [Google Scholar]
  51. Jung, J.; Kim, C.; Jayakumar, S.; Kim, S.; Han, S.; Kim, D.H.; Heo, J. Forest fire risk mapping of Kolli Hills, India, considering subjectivity and inconsistency issues. Nat. Hazards 2013, 65, 2129–2146. [Google Scholar] [CrossRef]
  52. Mahdavi, A.; Shamsi, S.R.F.; Nazari, R. Forests and rangelands’ wildfire risk zoning using GIS and AHP techniques. Casp. J. Environ. Sci. 2012, 10, 43–52. [Google Scholar]
  53. Reynolds, K.M.; Holsten, E.H. Relative importance of risk factors for spruce beetle outbreaks. Can. J. For. Res. 1994, 24, 2089–2095. [Google Scholar] [CrossRef]
  54. Vadrevu, K.P.; Eaturu, A.; Badarinath, K.V.S. Fire risk evaluation using multicriteria analysis—A case study. Environ. Monit. Assess. 2010, 166, 223–239. [Google Scholar] [CrossRef]
  55. Jalilova, G.; Khadka, C.; Vacik, H. Developing criteria and indicators for evaluating sustainable forest management: A case study in Kyrgyzstan. For. Policy Econ. 2012, 21, 32–43. [Google Scholar] [CrossRef]
  56. Kaya, T.; Kahraman, C. Fuzzy multiple criteria forestry decision making based on an integrated VIKOR and AHP approach. Expert Syst. Appl. 2011, 38, 7326–7333. [Google Scholar] [CrossRef]
  57. Mendoza, G.A.; Prabhu, R. Multiple criteria decision making approaches to assessing forest sustainability using criteria and indicators: A case study. For. Ecol. Manag. 2000, 131, 107–126. [Google Scholar] [CrossRef]
  58. Peterson, D.L.; Silsbee, D.G.; Schmoldt, D.L. A case study of resources management planning with multiple objectives and projects. Environ. Manag. 1994, 18, 729–742. [Google Scholar] [CrossRef]
  59. Schmoldt, D.L.; Peterson, D.L. Analytical Group Decision Making in Natural Resources: Methodology and Application. For. Sci. 2000, 46, 62–75. [Google Scholar]
  60. Segura, M.; Ray, D.; Maroto, C. Decision support systems for forest management: A comparative analysis and assessment. Comput. Electron. Agric. 2014, 101, 55–67. [Google Scholar] [CrossRef]
  61. Schmoldt, D.L.; Peterson, D.L.; Silsbee, D.G. Developing inventory and monitoring programs based on multiple objectives. Environ. Manag. 1994, 18, 707–727. [Google Scholar] [CrossRef]
  62. Akıncı, H.; Özalp, A.Y.; Turgut, B. Agricultural land use suitability analysis using GIS and AHP technique. Comput. Electron. Agric. 2013, 97, 71–82. [Google Scholar] [CrossRef]
  63. Banai-Kashani, R. A new method for site suitability analysis: The analytic hierarchy process. Environ. Manag. 1989, 13, 685–693. [Google Scholar] [CrossRef]
  64. Hutchinson, C.F.; Toledano, J. Guidelines for demonstrating geographical information systems based on participatory development. Int. J. Geogr. Inf. Syst. 1993, 7, 453–461. [Google Scholar] [CrossRef]
  65. Pourebrahim, S.; Hadipour, M.; Mokhtar, M.B. Integration of spatial suitability analysis for land use planning in coastal areas; case of Kuala Langat District, Selangor, Malaysia. Landsc. Urban Plan. 2011, 101, 84–97. [Google Scholar] [CrossRef]
  66. Xiang, W.-N.; Whitley, D.L. Weighting Land Suitability Factors by the PLUS Method. Environ. Plan. B Plan. Des. 1994, 21, 273–304. [Google Scholar] [CrossRef]
  67. Sterling, E.J.; Hurley, M.M. Conserving Biodiversity in Vietnam: Applying Biogeography to Conservation Research. Proc. Calif. Acad. Sci. 2005, 56, 98–118. [Google Scholar]
  68. Thao, L.B.; Phuong, N.Đ. Vietnam: The Country and Its Geographical Regions; The Gioi: Hanoi, Vietnam, 1997. [Google Scholar]
  69. MONRE. The Third National Communication of Vietnam to the United Nations Framework Convention on Climate Change; Vietnam Publishing House of Natural Resources; Environment and Cartography: Hanoi, Vietnam, 2019; Volume 3, p. 125. [Google Scholar]
  70. PARC. Policy Summary: Building Protected Area System in Vietnam; Project, P., Ed.; United Nations Development Programme: Hanoi, Vietnam, 2010; pp. 1–20. [Google Scholar]
  71. BirdLife. Vietnam IBA Status. Available online: http://www.birdlife.org/datazone/country/vietnam/ibas (accessed on 1 June 2013).
  72. MARD. Decree 1588 on National Forest Status in 2020; MARD: Hanoi, Vietnam, 2020. [Google Scholar]
  73. VNFOREST. Special-Use Forests in Vietnam; Forestry, V.A.O., Ed.; NXB Nông nghiệp: Hanoi, Vietnam, 2021; p. 294. [Google Scholar]
  74. Loc, P.; Yen, M.; Averyanov, L. Biodiversity in Vietnam. In Global Biodiversity; Apple Academic Press: Palm Bay, FL, USA, 2018; pp. 473–502. [Google Scholar]
  75. Bruner, A.G.; Gullison, R.E.; Rice, R.E.; da Fonseca, G.A. Effectiveness of parks in protecting tropical biodiversity. Science 2001, 291, 125–128. [Google Scholar] [CrossRef] [Green Version]
  76. MARD. Vietnam’s Modified Submission on Refreence Levels for REDD+ Results Based Payments under UNFCCC; MARD: Hanoi, Vietnam, 2016; p. 85. [Google Scholar]
  77. Hansen, M.C.; Potapov, P.V.; Moore, R.; Hancher, M.; Turubanova, S.A.; Tyukavina, A.; Thau, D.; Stehman, S.V.; Goetz, S.J.; Loveland, T.R. High-resolution global maps of 21st-century forest cover change. Science 2013, 342, 850–853. [Google Scholar] [CrossRef] [Green Version]
  78. Ghehi, N.K.; MalekMohammadi, B.; Jafari, H. Integrating habitat risk assessment and connectivity analysis in ranking habitat patches for conservation in protected areas. J. Nat. Conserv. 2020, 56, 125867. [Google Scholar] [CrossRef]
  79. Nguyen, T.T.; Nghiem, N. Optimal forest rotation for carbon sequestration and biodiversity conservation by farm income levels. For. Policy Econ. 2016, 73, 185–194. [Google Scholar] [CrossRef]
  80. Dudley, N.; Parrish, J. Closing the Gap: Creating Ecologically Representative Protected Area Systems; Secretariat of the Convention on Biological Diversity: Montreal, Canada, 2006. [Google Scholar]
  81. Joppa, L.N. Population change in and around Protected Areas. J. Ecol. Anthropol. 2012, 15, 58–64. [Google Scholar] [CrossRef] [Green Version]
  82. Joppa, L.N.; Loarie, S.R.; Pimm, S.L. On population growth near protected areas. PLoS ONE 2009, 4, e4279. [Google Scholar] [CrossRef] [PubMed]
  83. Luck, G.W. A review of the relationships between human population density and biodiversity. Biol. Rev. 2007, 82, 607–645. [Google Scholar] [CrossRef] [PubMed]
  84. Naughton-Treves, L.; Holland, M.B.; Brandon, K. The Role of Protected Areas in Conserving Biodiversity and Sustaining Local Livelihoods. Annu. Rev. Environ. Resour. 2005, 30, 219–252. [Google Scholar] [CrossRef] [Green Version]
  85. Thuy, P.T.; Moeliono, M.; Hien, N.T.; Tho, N.H.; Hien, V.T. The Context of REDD+ in Vietnam: Drivers, Agents and Institutions; CIFOR: Bogor Regency, Indonesia, 2012; Volume 75. [Google Scholar]
  86. Vu, T.D.; Takeuchi, W.; Van, N.A. Carbon stock calculating and forest change assessment toward REDD+ activities for the mangrove forest in Vietnam. Trans. Jpn. Soc. Aeronaut. Space Sci. Aerosp. Technol. Jpn. 2014, 12, Pn_23–Pn_31. [Google Scholar] [CrossRef]
  87. Yang, A.; Nguyen, D.T.; Vu, T.P.; Le Quang, T.; Pham, T.T.; Larson, A.M.; Ashwin, R. Analyzing Multilevel Governance in Vietnam: Lessons for REDD+ from the Study of Land-Use Change and Benefit Sharing in Nghe An and Dien Bien Provinces; JSTOR: New York, NY, USA, 2016. [Google Scholar]
  88. Sam, H.V.; Tung, D.Q.; Ngoc, D.T.B. Current Status Assessment of Vietnamese Protected Areas in International Context to Support Vietnam’s National Forest Plan 2021–2030; WWF: Hanoi, Vietnam, 2021; p. 63. [Google Scholar]
  89. MONRE. Biology Diversity and Conservation; Vietnam Ministry of Natural Resources and Environment: Hanoi, Vietnam, 2004. [Google Scholar]
  90. CEPF. Indo-Burma Biodiversity Hotspot; Critical Ecosystem Partnership Fund: Arlington, VA, USA, 2012; p. 360. [Google Scholar]
  91. Csaplovics, E.; Wagenknecht, S.; Seiler, U. Spatial Information Systems for Transnational Environmental Management of Protected Areas and Regions in the Central European Space Selected Results and Outputs of the Interreg IIIB Project SISTEMaPARC; Rhombos-Verlag: Berlin, Germany, 2008. [Google Scholar]
  92. Dudley, N. Guidelines for Applying Protected Area Management Categories; International Union for Conservation of Nature and Natural Resources (IUCN): Gland, Switzerland, 2008. [Google Scholar]
  93. Leverington, F.; Lemos, K.; Pavese, H.; Lisle, A.; Hockings, M. A Global Analysis of Protected Area Management Effectiveness. Environ. Manag. 2010, 56, 685–698. [Google Scholar] [CrossRef]
  94. Nhan, H.T.T.; Tinh, T.K.; Hung, P.V. Thực Trạng Quản lý Khu Bảo tồn Thiên Nhiên tại Việt Nam; Vietnam National University: Hanoi, Vietnam, 2015. [Google Scholar]
  95. Watson, J.E.M.; Dudley, N.; Segan, D.B.; Hockings, M. The performance and potential of protected areas. Nature 2014, 515, 67–73. [Google Scholar] [CrossRef]
  96. MONRE. Vietnam National Biodiversity Strategy to 2020, Vision to 2030; Vietnam Ministry of Natural Resources and Environment: Hanoi, Vietnam, 2015; p. 176.
  97. Quang, H.D. Những vấn đề quản lý Rừng đặc dụng ở Việt Nam; Bidoup Nui Ba National Park: Lâm Đồng, Vietnam, 2011. [Google Scholar]
  98. Rodrigues, A.S.L.; Andelman, S.J.; Bakarr, M.I.; Boitani, L.; Brooks, T.; Cowling, R.M.; Fishpool, L.D.C.; Da Fonseca, G.A.B.; Gaston, K.J.; Hoffmann, M.; et al. Effectiveness of the global protected area network in representing species diversity. Nature 2004, 428, 9–12. [Google Scholar] [CrossRef] [PubMed]
  99. Salkind, N.J. Encyclopedia of Research Design; Sage: Newcastle upon Tyne, UK, 2010; Volume 1. [Google Scholar]
  100. Hussein, A. The use of triangulation in social sciences research: Can qualitative and quantitative methods be combined. J. Comp. Soc. Work. 2009, 1, 1–12. [Google Scholar] [CrossRef]
  101. Poole, K.T. Spatial Models of Parliamentary Voting; Cambridge University Press: Cambridge, UK, 2005; p. 252. [Google Scholar]
  102. Poole, K.T.; Iii, S.M.; Grofman, B. A Unified Theory of Voting: Directional and Proximity Spatial Models. Am. Political Sci. Rev. 2000, 94, 953. [Google Scholar] [CrossRef]
  103. Saaty, T.L.; Vargas, L.G. The Logic of Priorities: Applications of the Analytic Hierarchy Process in Business, Energy, Health and Transportation; RWS Publications: Pittsburgh, PA, USA, 1991; Volume 3. [Google Scholar]
  104. Cochran, W.G. Sampling Techniques, 5th ed.; John Wiley & Sons: New York, NY, USA, 1977. [Google Scholar]
  105. Krejcie, R.V.; Morgan, D.W. Determining Sample Size for Research Activities. Educ. Psychol. Meas. 1970, 3, 607–610. [Google Scholar] [CrossRef]
  106. Bartlett, J.E.; Kotrlik, J.W.; Higgins, C.C. Organizational research: Determining appropriate sample size in survey research. Inf. Technol. Learn. Perform. J. 2001, 19, 43–50. [Google Scholar] [CrossRef]
  107. Mandallaz, D. Sampling Techniques for Forest Inventories; CRC Press: Boca Raton, FL, USA, 2007; p. 256. [Google Scholar]
  108. Naing, L.; Winn, T.; Rusli, B.N. Practical Issues in Calculating the Sample Size for Prevalence Studies. Arch. Orofac. Sci. 2006, 1, 9–14. [Google Scholar] [CrossRef] [Green Version]
  109. Triantaphyllou, E.; Mann, S.H. Using the analytic hierarchy process for decision making in engineering applications: Some challenges. Int. J. Ind. Eng. Appl. Pract. 1995, 2, 35–44. [Google Scholar]
  110. Öztürk, D.; Batuk, F. Analytic Hierarchy Process for Spatial Decision Making. Sigma 2010, 28, 124–137. [Google Scholar]
  111. Kou, G.; Ergu, D.; Peng, Y.; Shi, Y. Data Processing for the AHP/ANP; Springer Science & Business Media: Berlin/Heidelberg, Germany, 2012; Volume 1. [Google Scholar]
  112. Saaty, T.L. Some Mathematical Concepts of the Analytic Hierarchy Process. Behaviormetrika 1991, 18, 1–9. [Google Scholar] [CrossRef]
  113. Cincotta, R.P.; Wisnewski, J.; Engelman, R. Human population in the biodiversity hotspots. Nature 2000, 404, 990–992. [Google Scholar] [CrossRef]
  114. Sanderson, E.W.; Jaiteh, M.; Levy, M.A.; Redford, K.H.; Wannebo, A.V.; Woolmer, G. The human footprint and the last of the wild: The human footprint is a global map of human influence on the land surface, which suggests that human beings are stewards of nature, whether we like it or not. BioScience 2002, 52, 891–904. [Google Scholar] [CrossRef]
  115. Shi, H.; Singh, A.; Kant, S.; Zhu, Z.; Waller, E. Integrating habitat status, human population pressure, and protection status into biodiversity conservation priority setting. Conserv. Biol. 2005, 19, 1273–1285. [Google Scholar] [CrossRef]
  116. Kareiva, P.; Marvier, M. Conserving biodiversity coldspots: Recent calls to direct conservation funding to the world’s biodiversity hotspots may be bad investment advice. Am. Sci. 2003, 91, 344–351. [Google Scholar] [CrossRef]
  117. Van Khuc, Q.; Tran, B.Q.; Meyfroidt, P.; Paschke, M.W. Drivers of deforestation and forest degradation in Vietnam: An exploratory analysis at the national level. For. Policy Econ. 2018, 90, 128–141. [Google Scholar] [CrossRef]
  118. Johnson, C.N.; Balmford, A.; Brook, B.W.; Buettel, J.C.; Galetti, M.; Guangchun, L.; Wilmshurst, J.M. Biodiversity losses and conservation responses in the Anthropocene. Science 2017, 356, 270–275. [Google Scholar] [CrossRef]
  119. Maxim, L.; Spangenberg, J.H.; O’Connor, M. An analysis of risks for biodiversity under the DPSIR framework. Ecol. Econ. 2009, 69, 12–23. [Google Scholar] [CrossRef]
  120. VNFOREST. Special-Use and Protection Forest in Vietnam 2017–2018; VNFOREST: Hanoi, Vietnam, 2019; p. 80. [Google Scholar]
  121. Feddes, R.A.; Dam, J.C.V. Unsaturated-Zone Modeling: Progress, Challenges and Applications; Springer Science & Business Media: Berlin/Heidelberg, Germany, 2004; p. 364. [Google Scholar]
  122. Franklin, S.E. Remote Sensing for Biodiversity and Wildlife Management; McGraw-Hill Education: New York, NY, USA, 2010. [Google Scholar]
  123. Moore, P.D. Tropical Forests; Infobase Publishing: New York, NY, USA, 2008; p. 267. [Google Scholar]
  124. Bowen, R.E.; Riley, C. Socio-economic indicators and integrated coastal management. Ocean. Coast. Manag. 2003, 46, 299–312. [Google Scholar] [CrossRef]
  125. Giupponi, C.; Vladimirova, I. Ag-PIE: A GIS-based screening model for assessing agricultural pressures and impacts on water quality on a European scale. Sci. Total Environ. 2006, 359, 57–75. [Google Scholar] [CrossRef]
  126. Rogers, S.I.; Greenaway, B. A UK perspective on the development of marine ecosystem indicators. Mar. Pollut. Bull. 2005, 50, 9–19. [Google Scholar] [CrossRef]
  127. Fargione, J.; Tilman, D.; Dybzinski, R.; Lambers, J.H.R.; Clark, C.; Harpole, W.S.; Knops, J.M.H.; Reich, P.B.; Loreau, M. From selection to complementarity: Shifts in the causes of biodiversity–productivity relationships in a long-term biodiversity experiment. Proc. R. Soc. Lond. B Biol. Sci. 2007, 274, 871–876. [Google Scholar] [CrossRef]
  128. Gould, W. Remote sensing of vegetation, plant species richness, and regional biodiversity hotspots. Ecol. Appl. 2000, 10, 1861–1870. [Google Scholar] [CrossRef]
  129. Griffiths, G.H.; Lee, J.; Eversham, B.C. Landscape pattern and species richness: Regional scale analysis from remote sensing. Int. J. Remote Sens. 2000, 21, 2685–2704. [Google Scholar] [CrossRef]
  130. Kerr, J.T.; Southwood, T.R.E.; Cihlar, J. Remotely sensed habitat diversity predicts butterfly species richness and community similarity in Canada. Proc. Natl. Acad. Sci. USA 2001, 98, 11365–11370. [Google Scholar] [CrossRef] [PubMed] [Green Version]
  131. Kuusipalo, J. Diversity pattern of the forest understorey vegetation in relation to some site characteristics. Silva Fenn 1984. [Google Scholar] [CrossRef]
  132. Myers, N. Threatened biotas: “Hot spots” in tropical forests. Environmentalist 1988, 8, 187–208. [Google Scholar] [CrossRef]
  133. Oindo, B.O.; Skidmore, A.K. Interannual variability of NDVI and species richness in Kenya. Int. J. Remote Sens. 2002, 23, 285–298. [Google Scholar] [CrossRef] [Green Version]
  134. Phillips, L.B.; Hansen, A.J.; Flather, C.H. Evaluating the species energy relationship with the newest measures of ecosystem energy: NDVI versus MODIS primary production. Remote Sens. Environ. 2008, 112, 4381–4392. [Google Scholar] [CrossRef]
  135. Reich, P.B.; Tilman, D.; Isbell, F.; Mueller, K.; Hobbie, S.E.; Flynn, D.F.B.; Eisenhauer, N. Impacts of biodiversity loss escalate through time as redundancy fades. Science 2012, 336, 589–592. [Google Scholar] [CrossRef] [Green Version]
  136. Rocchini, D.; Perry, G.L.W.; Salerno, M.; Maccherini, S.; Chiarucci, A. Landscape change and the dynamics of open formations in a natural reserve. Landsc. Urban Plan. 2006, 77, 167–177. [Google Scholar] [CrossRef]
  137. Tilman, D. Resource Competition and Community Structure; Princeton University Press: Princeton, NJ, USA, 1982. [Google Scholar]
  138. Wang, R.; Gamon, J.A.; Montgomery, R.A.; Townsend, P.A.; Zygielbaum, A.I.; Bitan, K.; Tilman, D.; Cavender-Bares, J. Seasonal variation in the NDVI-species richness relationship in a prairie grassland experiment (cedar creek). Remote Sens. 2016, 8, 128. [Google Scholar] [CrossRef] [Green Version]
  139. Wickham, J.D.; Wu, J.; Bradford, D.F. A conceptual framework for selecting and analyzing stressor data to study species richness at large spatial scales. Environ. Manag. 1997, 21, 247–257. [Google Scholar] [CrossRef] [PubMed]
  140. Smeets, E.; Weterings, R. Environmental Indicators: Typology and Overview; European Environment Agency: Copenhagen, Denmark, 1999; Volume 19. [Google Scholar]
  141. Cuesta, F.; Peralvo, M.; Merino-Viteri, A.; Bustamante, M.; Baquero, F.; Freile, J.F.; Muriel, P.; Torres-Carvajal, O. Priority areas for biodiversity conservation in mainland Ecuador. Neotrop. Biodivers. 2017, 3, 93–106. [Google Scholar] [CrossRef]
  142. Sarkar, S.; Pressey, R.L.; Faith, D.P.; Margules, C.R.; Fuller, T.; Stoms, D.M.; Moffett, A.; Wilson, K.A.; Williams, K.J.; Williams, P.H. Biodiversity conservation planning tools: Present status and challenges for the future. Annu. Rev. Environ. Resour. 2006, 31, 123–159. [Google Scholar] [CrossRef]
  143. Moilanen, A.; Wilson, K.; Possingham, H. Spatial Conservation Prioritization: Quantitative Methods and Computational Tools; Oxford University Press: Oxford, UK, 2009. [Google Scholar]
  144. Brooks, T.M.; Mittermeier, R.A.; Da Fonseca, G.A.; Gerlach, J.; Hoffmann, M.; Lamoreux, J.F.; Mittermeier, C.G.; Pilgrim, J.D.; Rodrigues, A.S. Global biodiversity conservation priorities. Science 2006, 313, 58–61. [Google Scholar] [CrossRef] [Green Version]
  145. Costello, C.; Polasky, S. Dynamic reserve site selection. Resour. Energy Econ. 2004, 26, 157–174. [Google Scholar] [CrossRef] [Green Version]
  146. Asaad, I.; Lundquist, C.J.; Erdmann, M.V.; Costello, M.J. Ecological criteria to identify areas for biodiversity conservation. Biol. Conserv. 2017, 213, 309–316. [Google Scholar] [CrossRef]
  147. Bonn, A.; Gaston, K.J. Capturing biodiversity: Selecting priority areas for conservation using different criteria. Biodivers. Conserv. 2005, 14, 1083–1100. [Google Scholar] [CrossRef] [Green Version]
  148. Cabeza, M.; Moilanen, A. Design of reserve networks and the persistence of biodiversity. Trends Ecol. Evol. 2001, 16, 242–248. [Google Scholar] [CrossRef]
  149. Lessmann, J.; Munoz, J.; Bonaccorso, E. Maximizing species conservation in continental E cuador: A case of systematic conservation planning for biodiverse regions. Ecol. Evol. 2014, 4, 2410–2422. [Google Scholar] [CrossRef]
  150. Sierra, R.; Campos, F.; Chamberlin, J. Assessing biodiversity conservation priorities: Ecosystem risk and representativeness in continental Ecuador. Landsc. Urban Plan. 2002, 59, 95–110. [Google Scholar] [CrossRef]
  151. Asaad, I.; Lundquist, C.J.; Erdmann, M.V.; Costello, M.J. Delineating priority areas for marine biodiversity conservation in the Coral Triangle. Biol. Conserv. 2018, 222, 198–211. [Google Scholar] [CrossRef] [Green Version]
Figure 1. Adapted PSR model for evaluating biodiversity conservation.
Forests 13 01341 g001
Figure 2. Map of Vietnam and the distribution of special-use forests for biodiversity conservation (Source: Modified from MARS and ESRI).
Forests 13 01341 g002
Table 1. Scale for pair-wise AHP comparisons.
Intensity of ImportanceDescription
1Equal importance
2
3Moderate importance
4
5Strong or essential importance
6
7Very strong or demonstrated importance
8
9Extreme importance
Source: [103,111].
Table 2. The average values of the Random Index.
n12345678910
RI000.520.891.111.251.351.41.451.49
Source: [111].
Table 3. Criteria and indicators for defining priority area for biodiversity conservation.
Factors of PSR ModelCriteriaIndicator
PressureHuman-induced PressureDistribution of population
Density of population
Population
Livelihood of locals
Natural PressureClimate change
Natural disaster
StateState of SpeciesRichness
Rarity
State of EcosystemLocation
Topography
Hydrology
Climate
Forest type
ResponseConservation effortsForest management types
Size of forest area
EducationConservation through strengthening education
LawConservation through exerting law
Table 4. Weights of criteria based on all respondents and groups for identifying the priority areas of biodiversity conservation in Vietnam.
FactorsCriteriaSub-CriteriaAll (%)PAs (%)URIs (%)GOs (%)
PressureNatureClimate change7.76.25.87.7
Natural disaster2.62.12.92.6
Sum10.38.28.710.3
HumanDistribution4.67.12.94.3
Density6.05.53.47.2
Population7.16.24.17.2
Livelihood 13.114.06.912.1
SumCR = 1.7%30.8CR = 4.5%32.8CR = 2.3%17.3CR = 2.3%30.8
Total 41.041.026.041.1
StateSpeciesRichness2.94.45.54.3
Rarity5.84.410.94.3
Sum8.78.816.48.6
EcosystemLocation2.52.72.42.6
Topography3.64.34.02.6
Hydrology1.71.61.81.4
Climate3.62.64.75.7
Forest type6.16.23.55.1
SumCR = 2.0%17.5CR = 6.7%17.4CR = 2.6%16.4CR = 5.8%17.4
Total 26.226.232.826.0
ResponseConservationForest management types6.46.47.27.7
Size of forest area2.12.13.62.6
Sum8.68.610.810.2
Education 13.513.516.96.5
Law 10.610.713.516.2
Total CR = 5.2%32.7CR = 5.2%32.8CR = 5.2%41.2CR = 5.2%32.9
Total CR = 5.2%100.0CR = 5.2%100.0CR = 5.2%100.0CR = 5.2%100.0
All—All respondents; PAs—Protected Areas group; URIs—Universities and Research Institutes Group; GOs—Government Organizations Group.
Publisher’s Note: MDPI stays neutral with regard to jurisdictional claims in published maps and institutional affiliations.

