Article

AFLP-Based Genetic Structure of Lithuanian Populations of Small Balsam (Impatiens parviflora DC.) in Relation to Habitat Characteristics

by
Lina Jocienė
1,
Kristė Stravinskaitė
1,
Edvina Krokaitė
1,*,
Rasa Janulionienė
1,
Tomas Rekašius
2,3,
Algimantas Paulauskas
1,
Vitas Marozas
4 and
Eugenija Kupčinskienė
1
1
Department of Biology, Faculty of Natural Sciences, Vytautas Magnus University, K. Donelaičio str. 58, 44248 Kaunas, Lithuania
2
Department of Mathematics and Statistics, Faculty of Informatics, Vytautas Magnus University, K. Donelaičio str. 58, 44248 Kaunas, Lithuania
3
Department of Mathematical Statistics, Faculty of Fundamental Sciences, Vilnius Gediminas Technical University, Saulėtekio ave. 11, 10223 Vilnius, Lithuania
4
Department of Environment and Ecology, Faculty of Forest Sciences and Ecology, Vytautas Magnus University, K. Donelaičio str. 58, 44248 Kaunas, Lithuania
*
Author to whom correspondence should be addressed.
Forests 2022, 13(8), 1228; https://doi.org/10.3390/f13081228
Submission received: 4 June 2022 / Revised: 18 July 2022 / Accepted: 27 July 2022 / Published: 3 August 2022
(This article belongs to the Special Issue Ecology of Alien Species in Forests)

Abstract

:
Currently, there is an increasing focus on understanding the interactions between genetic features of the invader and environmental factors that ensure the success of invasion. The objective of our study was to evaluate the genetic diversity of Lithuanian populations of highly invasive small balsam (Impatiens parviflora) by amplified fragment length polymorphism (AFLP) markers and to relate molecular data to biotope features defined by employing neighboring species of herbaceous plants. Low polymorphism of I. parviflora populations was observed at AFLP loci. Hierarchical analysis of molecular variance did not reveal differentiation of populations depending on biotope, geography, or road types. Bayesian analyses of AFLP data demonstrated many genetic clusters. Our results suggest multiple introductions of I. parviflora into Lithuania. The polymorphism of AFLP loci of populations significantly correlated with the total coverage by herbaceous plants in the sites. Defined by principal component analysis, the variability of study sites was most related to the coverage of herbaceous plants and least related to the molecular features of I. parviflora populations. The sites with I. parviflora were classified into agricultural scrubland, riparian forest, and urban forest biotopes. Of them, urban forest was distinguished by the highest coverage of I. parviflora and the lowest Ellenberg indicatory values for light, soil acidity, and richness in nutrients.

1. Introduction

Large areas of forests have been destroyed in favor of highways, urban territories, and agricultural areas. This has provided an increased commodities, food, and goods but has caused an irreversible loss of native habitats and decrease in species number [1]. In many cases, human interventions into forests have been accompanied by species invasions, which certainly hamper the effort to protect and restore nature [2]. Alien plant invasion affects the diversity and stability of the local community, and as a result, the functions of ecosystems and the services they provide are changing [3]. In Europe, 5789 alien plant taxa have been reported [4]. The rate of release of invasive alien species has increased in recent years. The European Union (EU) Biodiversity Strategy for 2030 [5] has set the challenge of preventing the introduction of new alien species into the EU territory and of controlling invasive aliens that have already become widespread. Similar guidelines have been provided by the EU Forest Strategy for 2030 [6], which emphasize the challenge of applying species-friendly forest management practices to enable forests to play a multifunctional role. Forests in EU countries differ significantly in edaphic, climate, and other habitat features, as well as management histories. Therefore, the history of arrival and behavior of invasive alien species is distinct and cannot be predicted without regional assessments. The most common alien plant species in European forests are Acer negundo L., Prunus serotina Ehrh., Robinia pseudoacacia L., Bidens frondosa L., Erigeron annuus (L.) Pers., Solidago gigantea Aiton, Impatiens glandulifera Royle, and Impatiens parviflora DC. [4]. These invasive species are of major concern in Lithuania [7].
Studies of Lithuanian alien woody species have mostly addressed the phytocoenology of Acer negundo L. and Robinia pseudoacacia L. [8,9], and the toxicity and decomposition of leaves of Acer negundo [10,11,12].
Among European forest invaders special attention is due to annual Impatiens parviflora (Balsaminaceae) which is one of the best shade-adapted herbaceous species [13,14] growing in temperate climate conditions [15]. European areas invaded by that species have been extending [16,17]. Most of studies of I. parviflora are concentrated to central and western Europe [18,19,20,21,22], while data about Baltic region was much scarcer in terms of research scope and time scales. Such delay of assessments of I. parviflora manifestations in Lithuania is perfectly seen from historical point of view.
Impatiens parviflora arrived in Europe in early 1800s [18]. Within the few decades after the first documentations of introduction, I. parviflora was recorded in Königsberg, Tartu [20]. Later, the facts of species detection in the countries adjacent to Lithuania continued: it was found in Poland in 1884, and in Latvia after introduction of I. parviflora in 1895, naturalization of the species was recorded in 1898 [23,24]. At the beginning of the last century, this species was not on the list of Lithuania plants [25]. The first records of the presence for this species in that country were found three decades later [26,27,28]. Based on the data from neighboring countries, it is realistic that spread of I. parviflora in Lithuania had started earlier than the invasion was recorded. Unimpressive appearance of the small flowers might have predisposed a long period of the existence of this understory species before documentation. Since the second half of the last century, I. parviflora has been included in the list of adventive species in Lithuania [29]. The Vilnius site and eastern location Svencionys were the first documented regions of I. parviflora naturalization [30].
Similar to the situation of this species in Poland [31,32] and Latvia [24,33], today, I. parviflora is one of the most widespread invasive plants in Lithuania [4,34,35,36]. It grows most densely in urbanized south-eastern Lithuania, invading parks, groves, and forests in the areas of intensive tourism and other human activities [35].
Following molecular methods applied for invasive species research within last decades [37], Lithuanian populations of I. parviflora were examined by randomly amplified polymorphic DNA (RAPD) [35] and inter-simple sequence repeats (ISSR) [38]. Hierarchical analyses of molecular variance at ISSR and RAPD loci revealed significant low-level differentiation of Lithuanian populations of I. parviflora depending on geography and other variables of environment. The polymorphism extent at ISSR loci was positively correlated with the total coverage of herbaceous plant species in the sites. Additionally, the principal component analysis outlined the coverage by I. parviflora as the most important variable of populations compared to molecular data or parameters of abiotic environment [38].
After gel-assisted molecular methods, the next advanced step in genetic marker research was the establishment of amplified fragment length polymorphism (AFLP) markers [39] as a more sensitive tool compared to ISSR or RAPD markers [40]. Amplified fragment length polymorphism is a reproducible multi-locus genomic fingerprinting technique that can be applied relatively easily without a priori knowledge of the study organism’s genome [41] and provides a large number of informative loci. Applications of AFLPs in molecular ecology encompass determining levels of genetic diversity and population structure, detecting loci related to phenotype and progenies [42,43].
The amplified fragment length polymorphism method has been employed in an assessment of broad range of invasive taxa, including Rubus alceifolius [44], Heracleum sosnowskyi [45], Lythrum salicaria [46,47], Phalaris arundinacea [48], Veronica hederifolia [49], Reynoutria japonica [50], Mikania micrantha [51], and Solidago canadensis [52]. These markers have been applied for some ornamental Impatiens species [53,54], including also examination of natural populations of I. noli-tangere [55] and I. capensis [56] and natural and exotic populations of I. capensis [57]. To the best of our knowledge, genetic diversity of I. parviflora, has been only evaluated by AFLP markers in one study of two Polish populations [58].
Numerous studies have focused on I. parviflora interactions with neighboring herbaceous species [15,16,19,21,22,31,59,60,61]. Phytocenological data were mostly associated with either environmental (edaphic and climatic) properties of the sites with I. parviflora or with geographical, morphological, and physiological properties of I. parviflora populations, but the relationship with molecular features has been poorly investigated. As an extension of our pilot assessment of RAPD and ISSR loci-based diversity of I. parviflora populations [35,38], there was need to confirm and extend our findings by more advanced and precise method. Hereby, the present study is aimed at evaluation of Lithuanian populations of I. parviflora using AFLP markers and linking molecular parameters to the features of the biotic and abiotic environment.

2. Materials and Methods
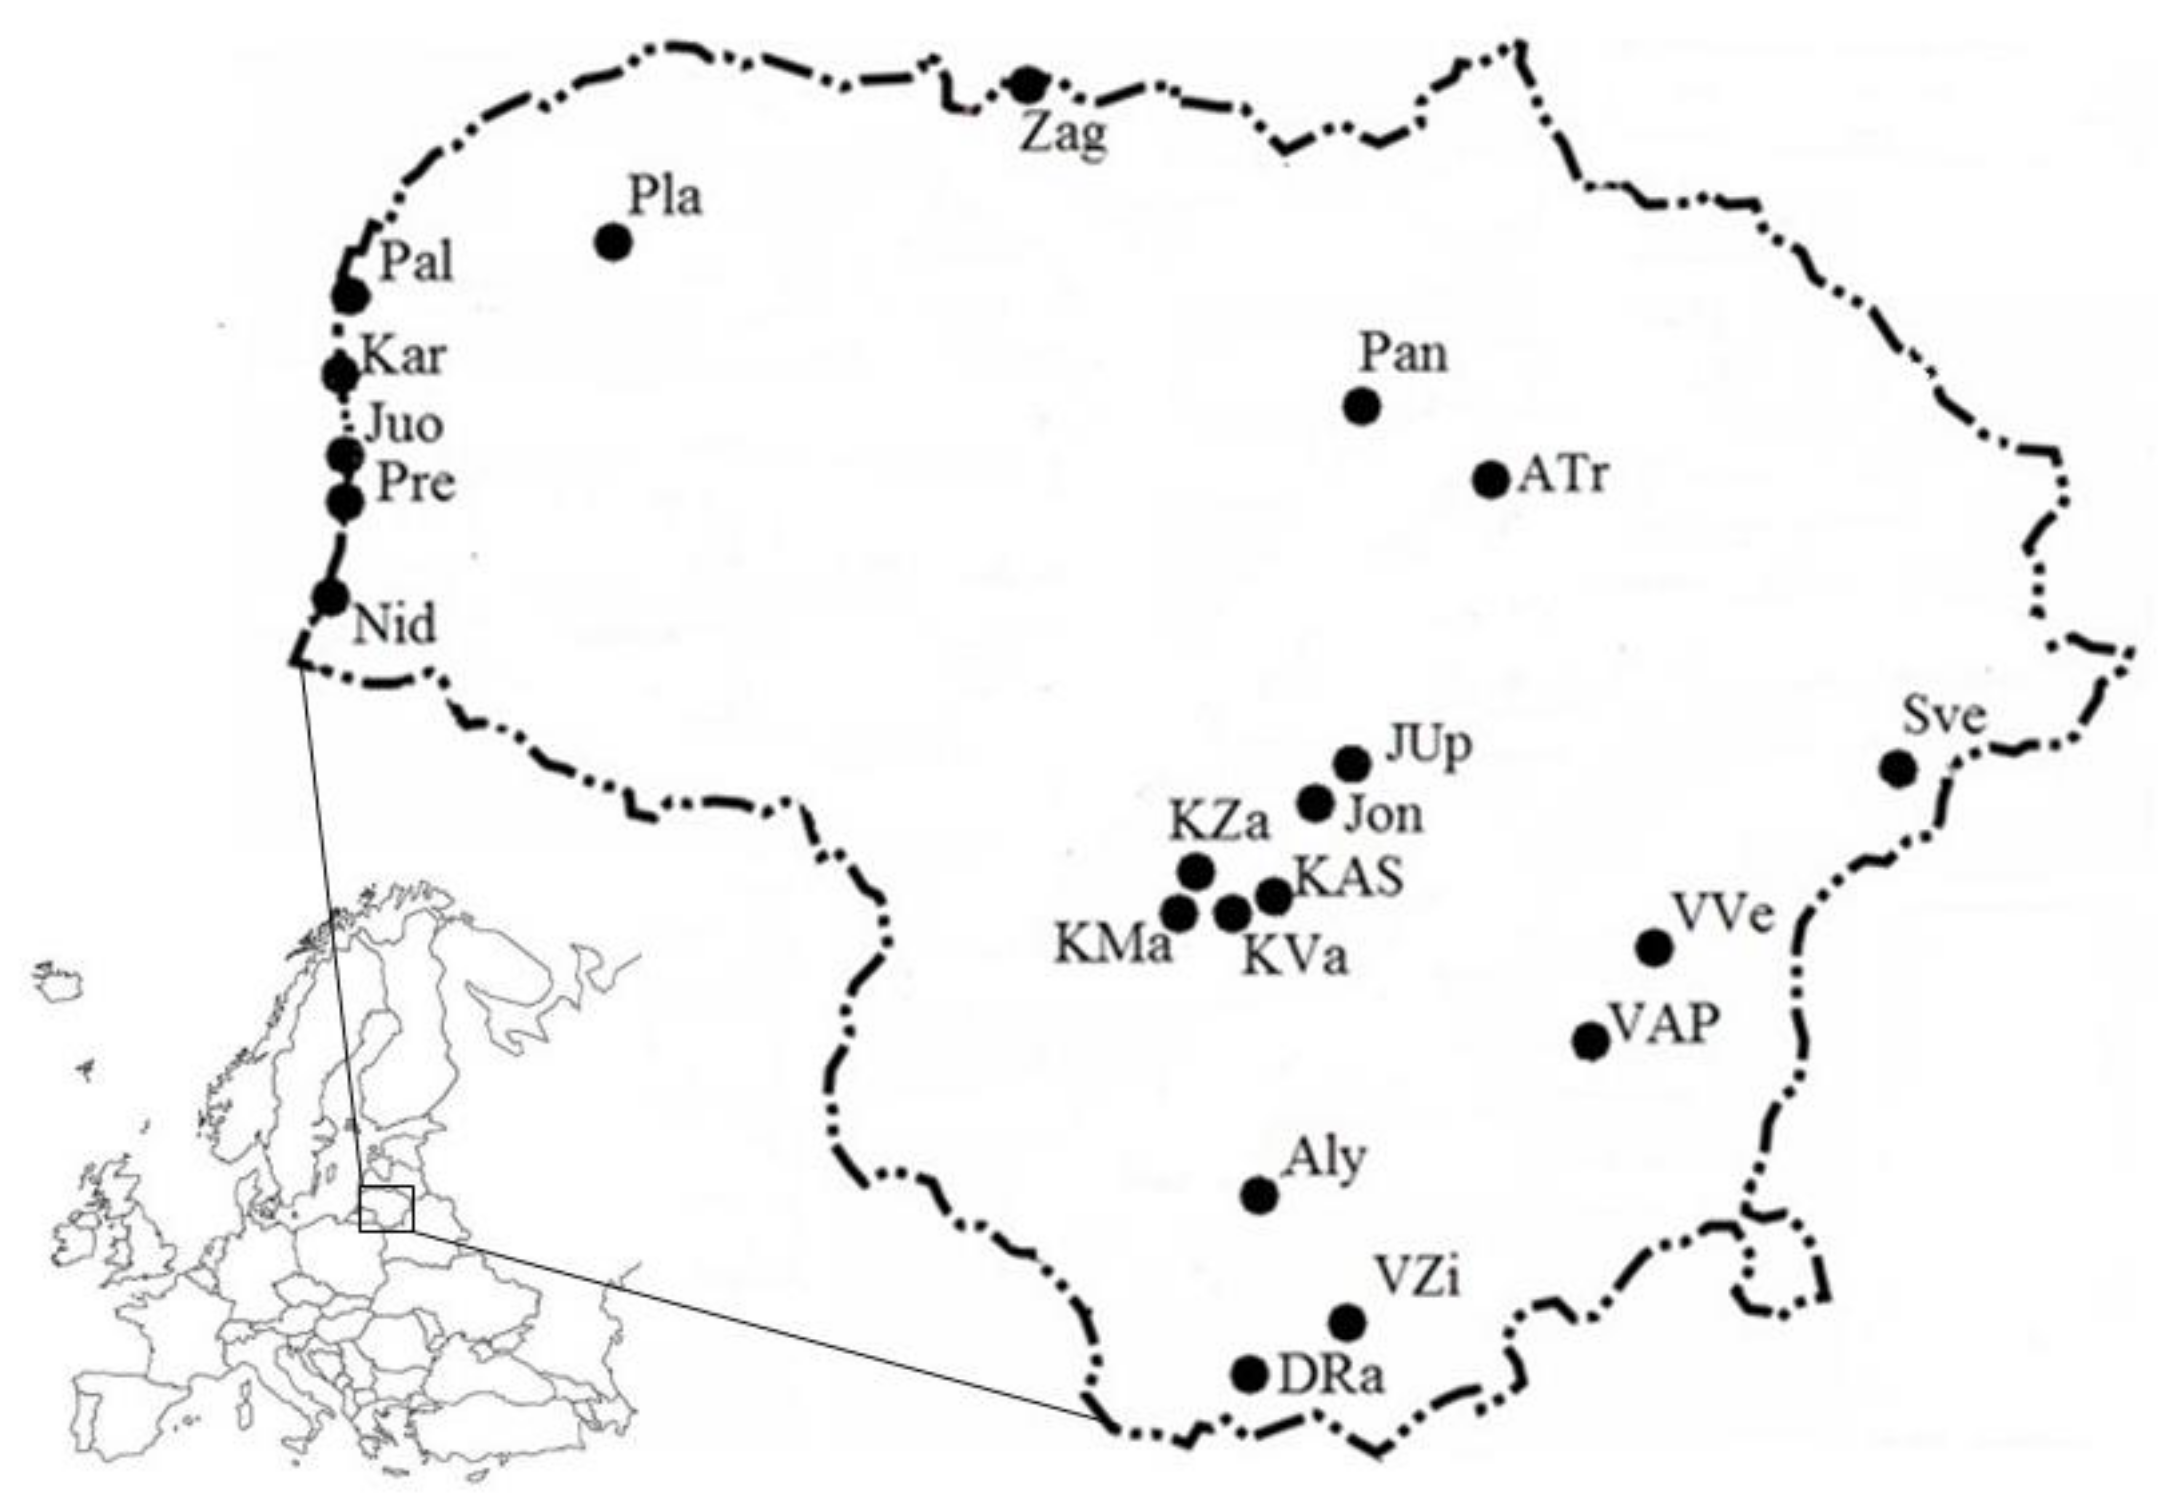
2.1. Study Area

Small balsam (Impatiens parviflora DC.) individuals were sampled from 21 Lithuanian populations in south-eastern, central, and north-western regions (Figure 1).
Populations were named according to the geographical names of the localities and abbreviated with the first three letters of the names: Vilnius-Verkiai (VVe), Vilnius-A.Paneriai (VAP), Svencionys (Sve), Varena-Ziurai (VZi), Druskininkai-Ratnycia (DRa), Alytus (Aly), Kaunas-Vaisvydava (KVa), Kaunas-A.Sanciai (KAS), Kaunas-Zaliakalnis (KZa), Kaunas-Marvele (KMa), Panevezys (Pan), Anyksciai-Traupis (ATr), Jonava-Upninkai (JUp), Jonava (Jon), Juodkrante (Juo), Preila (Pre), Nida (Nid), Karkle (Kar), Palanga (Pal), Plateliai (Pla), and Zagare (Zag). Information about the geography and climate of the sampling sites was provided in the previous study [35] and the other biotope features were thoroughly described previously as well [38]. In total, over 100 individuals of I. parviflora were sampled at the sites.

2.2. Molecular Analysis

Plant leaf DNA was isolated from 105 individuals (5 individuals in each of 21 populations) by DNA purification kit #KO512 (Thermo Fisher Scientific, Vilnius, Lithuania), as documented earlier [62].
For AFLP analyses of 105 individuals, 8 primer pairs (Table 1) were selected. Polymerase chain reactions (PCRs) were performed as described by Kloss et al. [63] with some modifications [47].
Restriction and ligation was performed for 2 h at 37 °C. The total restriction/ligation reaction had a final volume of 11 μL and contained 6 μL DNA extract, 0.55 μL BSA (1 mg/mL), 1.1 μL 10× T4 DNA ligase buffer, 1.1 μL NaCl solution (0.5 M), 0.1 μL each of the enzymes EcoR I (100,000 u/mL) and Mse I (10,000 u/mL), 0.05 μ L T4 DNA ligase (2,000,000 u/mL), 1 μL each of Mse I adapter (50 pmol/μL), and EcoR I adapter (5 pmol/μL) (Thermo Fisher Scientific, Vilnius, Lithuania). Polymerase chain reaction I (preselective amplification) was performed by using 4 μL restriction/ligation dilution product (1:1 dilution), 0.5 μL each of EcoR I primer (30 ng/μL) and Mse I primer (30 ng/μL), 2 μL 10× dNTPs (2 mM), 2 μL 10× Dream Taq buffer, 0.16 μL DreamTaq polymerase (5 u/μL) (Thermo Fisher Scientific, Vilnius, Lithuania) and 10.84 μL H2O. Preselective amplification reaction was performed in Mastercycler® EP Gradient S (Eppendorf, Hamburg, Germany), PCR consisted of 2 min at 72 °C, 20 cycles of (20 s 94 °C, 30 s 56 °C, 2 min 72 °C), and a final step of 30 min at 60 °C.
Polymerase chain reaction II (selective amplification) was done by using 0.35 μL 10× Green PCR buffer, 0.105 μL MgCl2 (50 mM), 0.07 μL 10× dNTPs (10 mM), 0.105 μL KB Extender, 0.014 μL Platinum Taq DNA Polymerase, and 0.6 μL each of forward and reverse primers (Thermo Fisher Scientific, Vilnius, Lithuania). The following PCR program was used for selective amplification: 15 min at 95 °C, 10 cycles of (20 s at 94 °C, 30 s at 66 °C (decrease 1 °C per cycle), 2 min at 72 °C), 20 cycles of (20 s 94 °C, 30 s 56 °C, 2 min at 72 °C), and finally 30 min at 60 °C.
Fragment analysis was performed on an ABI Prism 3130xl Genetic Sequencer (Applied Biosystems, Foster, CA, USA) using GeneScan 500 LIZ size standard. Manual binning and automatic scoring were performed in the range of 50–500 bp using GeneMapper version 3.7 (Applied Biosystems, Foster, CA, USA). Ten replicate samples were used for analysis and only highly reproducible loci were kept.

2.3. Abiotic and Biotic Features of the Sites

To link molecular and environmental data of populations, several features of the sampling sites were recorded. Sampling sites were attributed to three types of biotopes: agrarian scrubland, urban forest, and riparian forest [38]. Due to climatic differences, sampling sites were subdivided into three parts: south-eastern, central, and north-western Lithuania. In addition, traffic intensity/road vicinity was considered, distinguishing location along a blacktop road with intensive traffic, along a blacktop road of the city with low intensity traffic, and along a road without blacktop in forest [38]. Respectively, for hierarchical analyses of molecular variance (AMOVA), populations were grouped according to each parameter (biotope, geography, and road) into three clusters.
At each site, herbaceous plant species growing along with I. parviflora populations were assessed in 100 m2 plots. Species names were given according to World Flora Online. Evaluations were done using two sets of the species number at sites: one set (named as NSp-138) included all herbaceous species (in total, 138 species were registered), the second set (named as NSp-76) excluded species that were found at single sites only (76 species). The coverage of each species at sites was calculated using Braun Blanquet methodology [64]. Total coverage by herbaceous plant species (covT-138 and covT-76), coverage by herbaceous plant species without I. parviflora (covHerb-138 and covHerb-76), and coverage by I. parviflora (covIP) were estimated. For each site, abiotic characteristics (light, temperature, climate continentality (hereinafter referred to as continentality), soil moisture, soil pH, and soil nutrients) were quantified by Ellenberg indicatory plant values (EIV) [13] averaged in proportions to each species coverage (weighted average method—WEIV) [8,65] or averaged without coverage data (unweighted average method—UEIV) [15].

2.4. Data Analysis

Standard parameters of genetic diversity, principal coordinate analyses (PCoA) for populations and individuals, and hierarchical AMOVA were obtained using GenAlEx v. 6.5. The unweighted pair group method with arithmetic mean (UPGMA)-based dendrogram was prepared by PopGene v. 1.32, similarly to that done for the data obtained by the other dominant multi-locus markers [35,62].
For identification of genetic clustering of I. parviflora populations, Bayesian analysis was performed with Structure v.2.3.1 [66], for significance of clustering patterns using Evanno et al. [67] methodology. The a priori number of clusters selected was set to K = 1–21, the maximum expected number of clusters corresponded to the number of analyzed populations. A total of 20 runs were carried out for each K and the rate of change in the log probability of the data between successive likelihood values (Δ K) was estimated using a 105 steps burn-in period followed by 106 iterations of Markov chain Monte Carlo.
Site abiotic characteristics were quantified by EIV of herbaceous species, using program STATISTICA v. 7.0. Plant species variation and the number of species at sites were evaluated by two-way cluster analysis, program PC-ORD v. 6.0 [68].

3. Results

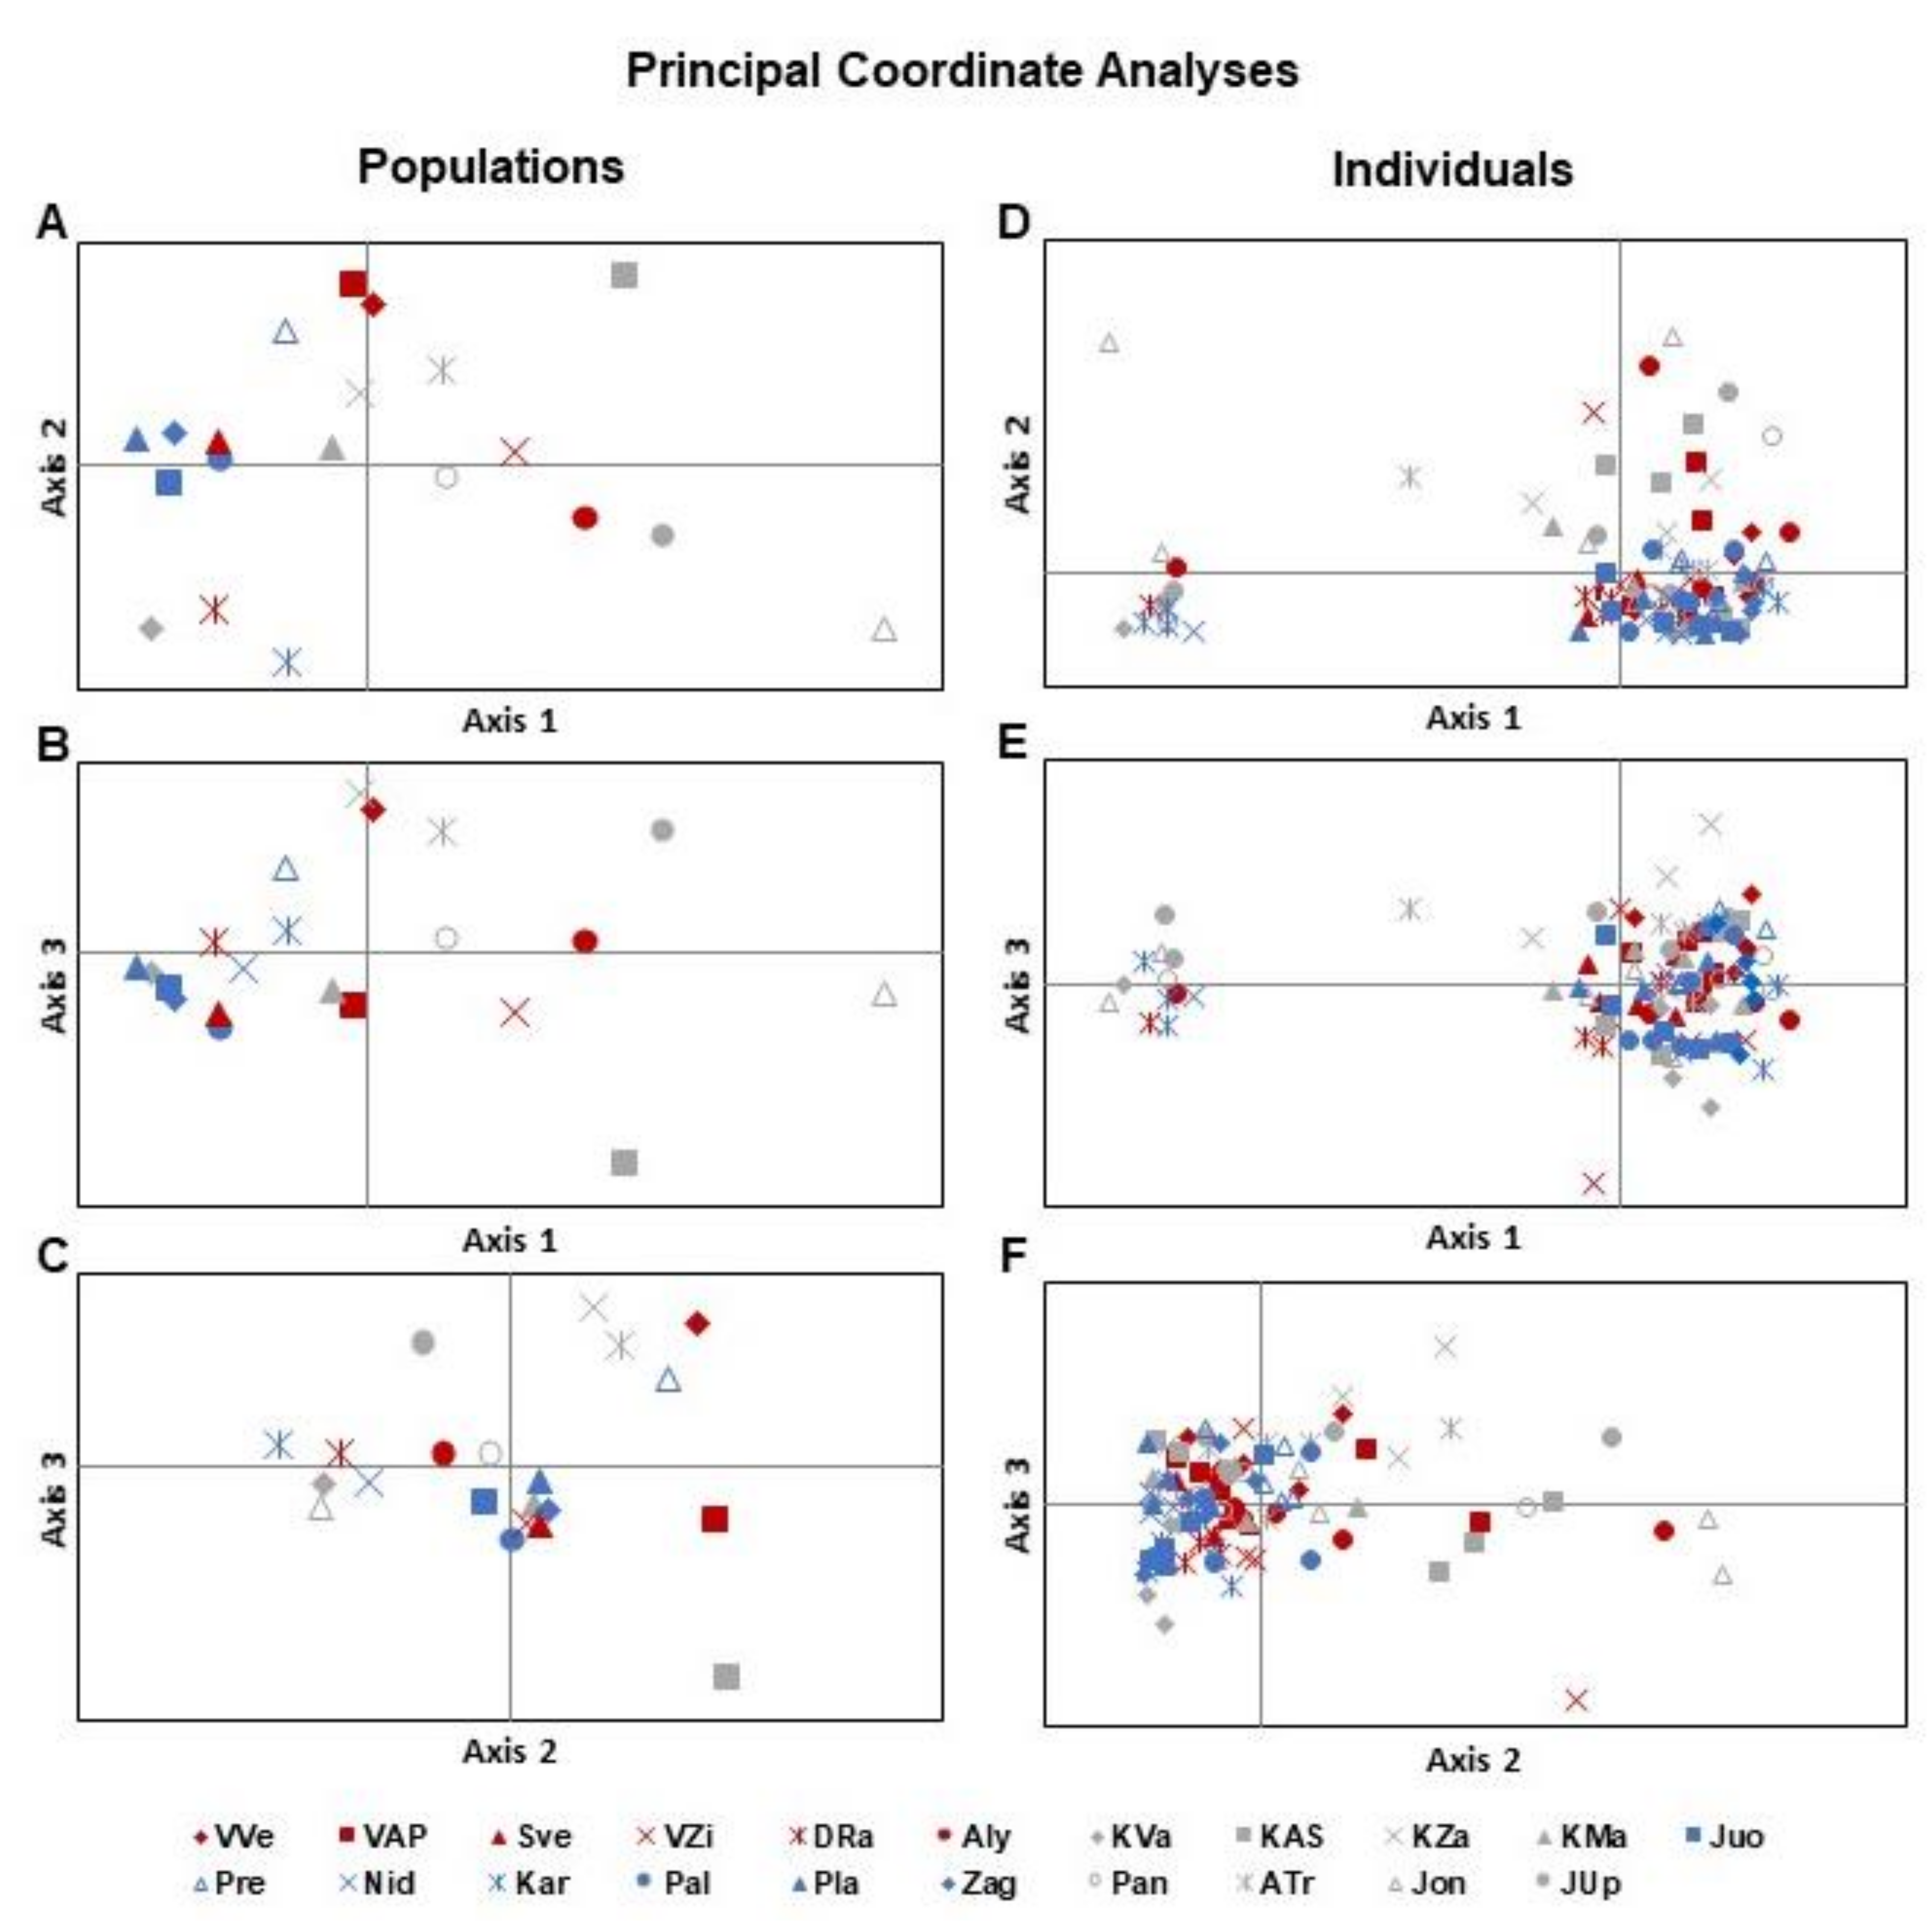
3.1. Analysis of Genetic Diversity

DNA fragments generated by AFLP primers ranged from 51 to 496 bp (Table 1). The lowest number of AFLP fragments (13) was generated by using EcoRI-AGG-PET/MseI-CAC primer pairs and the highest number (40)—by EcoRI-AAC-FAM/MseI-CTG, the mean value per marker being 28. A total of 223 fragments of DNA were registered using 8 AFLP primer pairs, 167 of them were polymorphic (74.9%). Percentage of polymorphic loci (PLP) per population ranged from 11.2 to 34.1 (mean value, 20.1), with the lowest values for the population Sve in the south-eastern region and the highest values for the population KAS in the central region (Table 2). The highest percentage of polymorphic loci was characteristic to I. parviflora growing in the central part of Lithuania (24.0%), slightly lower polymorphism was observed in south-eastern populations (21.1%), and the lowest polymorphism was observed in north-western populations (14.9%). The mean values of Nei’s gene diversity and Shannon‘s index per populations were 0.092 and 0.130, respectively. Minimum and maximum values of these parameters were characteristic for the same populations as in the case of PLP. Among the populations, Nei’s gene diversity ranged from 0.051 to 0.162 and Shannon’s index ranged from 0.072 to 0.227, the most extreme values of these parameters differed 3.2 times.
Nei’s [69] genetic distances (GD) at AFLP loci ranged from 0.021 to 0.124 (data are not provided in the tables). The most genetically distant pairs of the populations were in geographically neighboring areas Pre and Jon (GD = 0.124), Pla and Jon (GD = 0.122), or Vve and Jon (GD = 0.121). The shortest genetic distances were between the populations from neighboring geographic areas: Nid and KVa (GD = 0.021), DRa and KVa (GD = 0.031), Juo and Kva (0.033).
Using UPGMA for clustering of populations according to Nei’s distances [69] at AFLP loci, 11 descending order clades were revealed (Figure 2). The genetically closest clades contained populations of distinct geographical region: Pal, Zag (north-western), Sve (south-eastern), and KMa (central), another example was populations DRa (south-eastern), KVa (central), and Nid (west). Hereby, a stronger link between genetic and geographic distances between populations was not revealed.
According to the PCoA of AFLP data, coordinate 1 accounted for 14.5%, coordinate 2 for 11.8%, and coordinate 3 for 9.2% of the total genetic variance of populations (Figure 3). Correspondingly, the importance of the first two coordinates accounted for 26.3% and the importance of all three coordinates for 35.5% of the total genetic variance of I. parviflora populations (Figure 3A–C). Relations among populations from distinct geographical regions were very close. None of the populations of some geographical part of Lithuania (north-western, central, or south-eastern) formed a separate genetic cluster. In the PCoA plot, the north-western and south-eastern populations overlapped the most (Figure 3C), while the north-western and central populations overlapped the least. The most genetically related populations were in north-western Lithuania and the most scattered populations were in the central Lithuania.
The findings for population PCoA were also true for individual PCoA. Individuals from the north-western and south-eastern populations overlapped the most (Figure 3E,F), and individuals from the north-western and central part were genetically less similar (Figure 3D).
The two-level AMOVA (i.e., within and among populations) partitioned 91% of the molecular variance within populations and 9% (ΦPT = 0.087; p = 0.001) among populations (Table 3A). Analysis of AFLP loci by three-level AMOVA did not reveal significant differences among population groups based on biotope (Table 3B), geographical zones (Table 3C), or neighboring road type (Table 3D). Molecular variance among populations within groups ranged from 8% to 9%, and molecular variance among individuals within populations was 91% in all cases (Table 3B–D).
Amplified fragment length polymorphism marker-based Bayesian analysis revealed that the highest ΔK indicates K = 17, and the second and third highest ΔK suggest 20 and 14 clusters, respectively (Figure 4).

3.2. Herbaceous Species Composition

A very scattered view was obtained classifying all herbaceous plant species (138) according to their presence or absence at sites (Figure S1). Two-way cluster analysis grouped the species into a dendrogram consisting of clades of 20 order (Figure S1, right side cladogram) and sites with I. parviflora were grouped into a dendrogram consisting of clades of 14 order (Figure S1, top cladogram). We identified 62 species growing in single sites only. The Zag site contained the largest number of unique species (14), seven unique species were growing at VZi, Nid, and ATr sites each. At some sites, for example, Sve, Dra, KAS, and KZa, no unique species were found.
In some other studies, environmental conditions were assessed by excluding low-frequency species [15]. After we eliminated species that grew at single sites only, the initial number of 138 herbs decreased to 76 (Figure S1 and Figure 5). The initial number of herbaceous species at one site ranged from 13 to 32 [38], and excluding unique species, the range narrowed to 10–25. Only a few of the removed species were aliens. Removal of unique species did not cause more significant changes neither in total coverage of herbaceous plant species per site (from 31.6–97% to 27.1–96.5%), nor in coverage of herbaceous plant species without the input of I. parviflora (from 12.2–81.9% to 10.8–79.3%, Figure S1.
A total of 76 herbaceous plant species growing along with I. parviflora were grouped by two-way cluster analysis into species dendrogram encompassing clades of 17 order (Figure 5, right side cladogram) and into site dendrogram encompassing clades of 10 order (Figure 5, top cladogram).
Urtica dioica was found at all sites. The most frequently co-occurring species (Aegopodium podagraria, Alliaria petiolata, Anthriscus sylvestris, Chelidonium majus, Galium aparine, Geranium robertianum, Geum urbanum, Glechoma hederacea, Stellaria media, Rubus caesius, Veronica chamaedrys) were registered at 10 to 16 sites. Frequency of occurrence for the remaining herbaceous plant species was lower (2 to 9 sites). The most contrasting assemblages of herbaceous plant species were found between KZa, VVE, and Zag sites, and the most similar assemblages were at JUp, Pre, and KAS sites (Figure 5, top cladogram). For the most distinct assemblages of herbaceous plants (Zag, Nid; Figure 5, top cladogram), coverage by I. parviflora was very low (5–8%) and the most similar assemblages were characteristic for sites with abundant I. parviflora (mean coverage of 25% for Sve and Pan, 32% for Jon, and 53% for Jup, Pre, KAS). Populations with the highest numbers (NSp-76) of neighboring herbaceous species (22–25) had an intermediate or low polymorphic loci percentage based on AFLP (Dra—17.9%, ATr—18.4%, and Pla—12.1%) (Figure 5; Table 2).
Shift from NSp-138 to NSp-76 did not cause significant differences in coverage by all herbaceous plant species (covT-138 and covT-76) or in coverage by all herbaceous species but I. parviflora (covHerb-138 and covHerb-76) (Figure 6). Coverage of I. parviflora ranged from 5% at Zag site to 70% at KAS and Juo sites.
Median values of WEIV and UEIV for light were 5.390 and 5.833, for temperature—5.650 and 5.556, for continentality—4.080 and 3.824, for soil moisture—5.470 and 5.444, for soil pH—6.620 and 6.375, and for soil nutrients—6.760 and 6.733, respectively (Figure 7).
There was a significant difference (p < 0.01) between mean values for light (L-WEIV, 5.44 and L-UEIV, 5.79). For all remaining parameters of environment, there were no significant differences between UEIW and WEIV.
Eleven sites (VVe, VAP, KVa, KAS, KZa, KMa, Juo, Pre, Nid, Pla, and Pal) were attributed to biotope of urban forest, four sites (VZi, DRa, JUp, and Kar) to biotope of riparian forest, and six sites (Sve, Aly, Zag, Pan, ATr, and Jon) to biotope of agrarian scrubland [38].
Mean EIV values per population groups for each biotope (Table 4) showed that covIP for urban forest was 42.4%, for riparian forest 33.8%, and for agrarian scrubland—21.3%. Corresponding values for light (L-WEIV) were 5.239, 5.688, and 5.640.
Values for soil acidity (R-WEIV) were 6.326, 6.658, and 6.620, values for soil nutrients (N-WEIV) were 6.559, 6.805, and 6.837, respectively.

3.3. Relations between Molecular and Environmental Variables

To evaluate the links between molecular and ecological features of sites with I. parviflora, Spearman rank correlation analysis was applied (Figure 8). No correlations were found between polymorphism of AFLP and ISSR or RAPD loci.
Coverage by I. parviflora correlated negatively with (1) the coverage of the other herbaceous species (r = −0.531, p = 0.013 for covHerb-138 and r = −0.444, p = 0.044 for covHerb-76), (2) the number of the herbaceous plant species (r = −0.444, p = 0.044 for NSp-138), and 3) the light (r = −0.695, p = 0.0005 for L-WEIV), and correlated positively with covT (r = 0.460, p = 0.036 for covT-138, and r = 0.544, p = 0.011 for covT-76). Significant correlations were found comparing different number sets of herbaceous plant species (covHerb-76 and covHerb-138, r = 0.949, p = 0.000; covT-76 and covT-138, r = 0.953, p = 0.000; NSp-76 and NSp-138, r = 0.826, p = 0.000). Unweighted and weighted EIV correlations were highly significant (L-WEIV and L-UEIV, r = 0.778, p = 0.000; T-WEIV and T-UEIV, r = 0.877, p = 0.000; K-WEIV and K-UEIV, r = 0.702, p = 0.000; F-WEIV and F-UEIV, r = 0.857, p = 0.000; R-WEIV and R-UEIV, r = 0.861, p = 0.000; N-WEIV and N-UEIV, r = 0.671, p = 0.001). Only one indicator showed a significant correlation between the genetic characteristics of I. parviflora and its environmental features: polymorphism extent at AFLP loci of I. parviflora populations positively correlated with the total coverage of all herbaceous plant species at sites, either NSp-138 (PLP-AFLP and covT-138, r = 0.448, p = 0.041) or NSp-76 (PLP-AFLP and covT-76, r = 0.465, p = 0.034).
To explain the most important parameters for the variability of sites with I. parviflora, principal component (PC) analysis was performed (Figure 9) on three molecular variables (PLP-AFLP, PLP-ISSR, and PLP-RAPD), I. parviflora coverage (covIP), four biotic variables (covT-138, covT-76, and NSp-138, NSp-76), and 12 abiotic variables (L-WEIV, T-WEIV, K-WEIV, F-WEIV, R-WEIV, N-WEIV, L-UEIV, T-UEIV, K-UEIV, F-UEIV, R-UEIV, and N-UEIV). The first four principal components PC1, PC2, PC3, and PC4 (and corresponding eigenvalues) explained 25.54% (5.88), 22.27% (5.12), 13.55% (3.12), and 10.20% (2.35) of the total variability of sites with I. parviflora, respectively. The first two components accounted for 47.81%, the first three components—61.36%, and the first four components—71.56% of the total variability.
According to the importance of the absolute values of variables for PC1, there was the following descending order: covHerb-138 > covHerb-76 > F-WEIV > K-WEIV > F-UEIV > NSp-138 > L-WEIV > covIP > NSp-76 > K-UEIV > L-UEIV > T-WEIV > NSp-uni > N-UEIV > N-WEIV > covT-138 > PLP-ISSR > T-UEIV > R-UEIV > covT-76 > PLP-AFLP > R-WEIV > PLP-RAPD.
According to the importance of the absolute values of variables for PC2, there was the following descending order: covT-76 > covT-138 > T-UEIV > R-UEIV > T-WEIV > R-WEIV > L-WEIV > covIP > NSp-uni > L-UEIV > covHerb-76 > N-UEIV > PLP-AFLP > PLP-ISSR > K-UEIV > F-WEIV > F-UEIV > covHerb-138 > K-WEIV > NSp-138 > PLP-RAPD > N-WEIV > NSp-76. The most extreme locations in the PC biplot were characteristic for KZa, Pre, Nid, and Zag sites.

4. Discussion

4.1. Molecular Features of Impatiens parviflora

Molecular diversity is a substantial part of species diversity which is assumed as opportunity of organisms to survive over fluctuating environmental conditions over a long historical span. Genetic polymorphism of a population is often discussed in relation to invader success [70]. Polymorphism of populations within invasive and native areas has been compared for many alien species [37,44,52,71], including I. glandulifera which is congeneric to the species assessed in the present study [72,73]. It would be valuable to note that to date, any studies of I. parviflora have been performed within invasive areas only [4,15,16,17,18,19,20,21,22,23]. Furthermore, until now, information about the molecular polymorphism of I. parviflora populations has been limited to Poland [58] and our studies in Lithuania [35,38], despite the importance of this invasive species in forests and other biotopes at the European level. We found very low (mean value, 20.1%) polymorphism of 21 Lithuanian populations at 8 AFLP loci (Table 2). These results are similar to the findings of our previous studies which employed other DNA markers such as ISSR and RAPD and reported very low polymorphism values (16.5% and 21.0%, respectively). Comparison of population groups attributed to various biotopes revealed that the least polymorphic populations were not the same for different marker systems (urban forest at AFLP and ISSR loci, riparian forest at RAPD loci with the mean polymorphisms of 18.9%, 15.6%, and 17.1%, respectively), although the differences for means per population group were not significant. Hereby, the use of 3 different DNA marker systems (presumably related to different DNA sequences) resulted in the same low genetic diversity of I. parviflora populations in Lithuania. Our findings are similar to a Polish study which demonstrated exceptionally low polymorphism (6%) at four AFLP loci (two times less than in our study) for two populations [58]. Examination of a similar number (20 versus 21) of Lithuanian I. glandulifera populations at RAPD and SSR loci [62,74] showed much higher polymorphism compared to I. parviflora. Genetically, less polymorphic populations of I. parviflora were/are more successful invaders in Lithuania than I. glandulifera [4]. This means that Baltic territory invaders of Balsaminaceae family are in agreement with the assumption of the genetic paradox of invasive species [70,72].
Comparison of agricultural crop genotypes using both dominant and co-dominant marker systems showed that AFLP markers are less polymorphic than microsatellites [75,76,77]. Despite big attention being paid to I. parviflora, until now, microsatellite markers specific for that species have not been created. Our attempts to use the microsatellites of congeneric species I. glandulifera [78,79] for Lithuanian populations of I. parviflora were not successful [38]. In addition, not all known cases of using microsatellite markers were more helpful compared to AFLP. Microsatellite and AFLP loci analyses of populations of three Draba species revealed the AFLPs as more phylogeographic structuring than the microsatellites [80].
Geographic factors may have been important in determining the small extent of variability explained by PCoA in our study of I. parviflora (20.9%; Figure 3). In the former evaluation of I. parviflora from Lithuania and Czech Republic the first three principal coordinates explained 71.5% and 84.3% of population variance at RAPD and ISSR loci, respectively [81]. The most distinct populations in PCoA plots at AFLP, ISSR, and RAPD loci were located in different geographic zones of Lithuania (Jon, Dra, and Pre, respectively), indirectly indicating that different marker systems are related to distinct sequences and there were no special natural barriers for gene flow. Some anthropogenic factors such as manor activities might have importance for the time and source of the seeds for arrival of the foreign propagules. In addition, the extent of genetic variability might be species-/genera-specific. Higher explanation of variability by PCoA (44.8% for the first two axis) was demonstrated by a similar scope Lithuanian study of populations of Bunias orientalis at ISSR loci [82]. Similar to our results of I. parviflora, the genetic diversity at microsatellite loci in invasive populations of I. glandulifera was unusually low compared to the other invasive species [72]. In contrast, the application of four AFLP primer pairs populations of I. capensis Meerb in southern New England revealed significant differentiation (ΦPT = 0.32) between the five regions in the hierarchical model and the Mantel test showed significant correlation between geographic and genetic distances [57]. Molecular parameters of populations may differ between invasive and natural areas of distribution as it was documented for microsatellite loci of I. glandulifera: genetic diversity within invasive range was lower [72].
Principal coordinate analysis together with the dendrogram of population relationships based on the Nei’s [69] genetic distances (Figure 2) did not reveal a stronger link between genetic and geographic distances of populations. In support of this, PCoA-AFLP data showed overlapping of south-eastern and north-western populations (Figure 3). These facts could not be explained either by natural distribution within secondary distribution range of the species, or the intense transportation of the unimpressive plant. Furthermore, according to the size of the seeds, I. parviflora fits very well for transportation by vehicle tires [20]. Thus, our data provide evidence of unintentional human-mediated spread as a prevailing type of dissemination within the Lithuanian territory.
Partitioning of AFLP diversity showed that only 9% of variability was explained by differences among populations (Table 3). Our data are in agreement with the hypothesis of the genetic drift role in differentiation of I. glandulifera Royle populations in Europe [72]. Evaluation of native Lithuanian populations of Lythrum salicaria L. [47], Nuphar lutea Smith [83], and Juniperus communis L. [84] also revealed higher diversity within populations compared to interpopulation variability. Data about genetic variation of Impatiens noli-tangere between regions in the UK was very contradictive [55]. No AFLP-based evidence for geographical structuring within region or continent was found among 53 populations of annual Arabidopsis thaliana (L.) Heynh. sampled in North America [85].
Despite the relatively small Lithuanian territory, south-eastern, central, and north-western regions are distinct in terms of meteorological variables (Lithuanian Hydrometeorological Service under the Ministry of Environment) [86]. Molecular investigations revealed geography-related significant differentiation of Lythrum salicaria L. [47], Phalaris arundinacea L. [87], and Juniperus communis L. [84] populations in Lithuania. Our assessment of I. parviflora in different geographic regions of the country did not show significant differentiation at AFLP loci.
Levels of invasion of aliens increase with increasing proximity to roads [88]. We sampled I. parviflora populations close to roads or footpaths. Pedestrians, bicycles, and cars may be unequally important in transporting seeds [20].
The importance of roads for unintentional human-mediated dispersion of I. parviflora seed was also discussed in many other studies [15,22,88]. We used hierarchical AMOVA to find out whether different types of roads were of distinct importance for the genetic differences between populations; however, our results did not show road type-related differentiation of populations. Due to the unintentional transfer of seeds by various means of transport (trucks, cars, bicycles, and travelers’ shoes), new populations may emerge either close or far from initial locations.
In the present study, Bayesian analysis revealed the existence of 17 genetic clusters at AFLP loci in I. parviflora populations (Figure 4) and the second suggestion for the number of clusters (20) was close to the total number of populations. It corresponded to the results of AMOVA analysis (Table 3), which indicated very high variability between individuals inside populations (91%). Very similar data were obtained in the previous assessments of the same populations by other molecular markers: the presence of 11 genetic clusters at ISSR loci and 13 genetic clusters at RAPD loci [38]. Even larger number of genetic clusters were reported for Mikania micrantha, i.e., 28 genetic clusters for 28 populations across its introduced range [51].
Lithuania is surrounded by several countries with historically different socio-economic background and cultural traditions. Therefore, it is possible that I. parviflora might have crossed Lithuanian borders at several different places at different times and through distinct pathways. Based on AFLP data, we came to the same conclusion about possible multiple introductions of I. parviflora into the territory of Lithuania as in our previous study based on other dominant markers [38]. This also supports the fact about multiple introductions of many other alien species within the invasive range of distribution [37,72]. Widespread invasive species such as I. parviflora [4] may have remained low variable also after repeated introductions as has been suggested for congeneric species I. glandulifera [72].

4.2. Peculiarities of Herbaceous Plant Assemblages

Three biotopes of Lithuanian I. parviflora (i.e., agricultural scrubland, riparian forest, and urban forest) corresponded to the habitats of I. parviflora analyzed in more southern Europe such as Austria’s unmanaged riparian forests [89], parks and urban forests [90], areas of anthropogenic ruderals, and garden allotments in Poland [22]. In our study, I. parviflora coverage varied considerably among the sites, i.e., it ranged from 5 to 70%. When compared to agricultural scrubland or riparian forest biotopes, the urban forest was distinguished by the highest coverage of I. parviflora (Table 4).
In the former study, we analyzed all herbaceous plant species in the sites with I. parviflora; in addition, species lists of each site have not been analyzed and EIV data were calculated using all recorded species (138). Until now, there were some methodical uncertainties left concerning the number of species required for the assessment. In the study of I. parviflora in Slovakian forests, low-frequency herbaceous plant species were removed from the list [15]. Following the same approach, we tested two sets of species: with and without unique (growing in single sites only) herbaceous species and all data provided in the current assessment concerns evaluations of reduced number of the species (76) in comparison to the earlier assessed number (138) (Figure 5, Figure 6 and Figure 7). A diminished number of the species (Figure S1, Figure 5 and Figure 6) appeared to be very convenient evaluating species relatedness to sites. In phytocoenological studies, connections between the species composition and soil properties have been evaluated [15,16,17,18,19,20,21,22]. According to our study, I. parviflora populations did not show the greatest genetic similarity in the areas where the species composition was the most similar (Pal, Zag, Sve, and KMa, or DRa, KVa and Nid) (Figure 2 and Figure 5).
The most frequent neighbors of I. parviflora were native perennials (mainly hemicryptophytes) and biennial Alliaria petiolata. Our results suggested that annual I. parviflora may survive using temporal and spatial gaps of local perennials. This assumption is supported by data showing that I. parviflora suppressed small early flowering heliophilous species in the beginning of the season due to competition for light [61]. Another opportunity for the alien annual to survive among local perennials might be good chemical compatibility. Essential oils of I. parviflora did not suppress root elongation, but they were toxic for some plant species at the germination stage [91]. In our study, the most frequent co-occurring species (found at more than 40% of sites with I. parviflora) were Aegopodium podagraria, Alliaria petiolata, Anthriscus sylvestris, Chelidonium majus, Galium aparine, Geranium robertianum, Geum urbanum, Glechoma hederacea, Stellaria media, Rubus caesius, Urtica dioica, and Veronica chamaedrys (Figure 5).
Some of these species were also found in southern European forests: temperate forests in Slovakia (Aegopodium podagraria, Alliaria petiolata, Galium aparine, Geranium robertianum, Geum urbanum, and Urtica dioica) [15], nature reserves in Poland (Aegopodium podagraria, Alliaria petiolata, Anthriscus sylvestris, Geranium robertianum, Geum urbanum, Glechoma hederacea, Rubus caesius, Urtica dioica, and Veronica chamaedrys) [22,59], peri-urban forest in Belgium (Geum urbanum, Glechoma hederacea, Urtica dioica) [60], and riparian and ruderalized Pruhonice forests in Czech Republic (Geranium robertianum, Geum urbanum, Urtica dioica) [21].
Impatiens parviflora is an invasive species whose environment has been extensively assessed using EIV [38]. Our analysis of EIVs revealed a wide range of ecological tolerance of Lithuanian I. parviflora with respect to nutrients, soil reaction, light availability, and moisture within biotopes; this is in agreement with the findings in regions of more southern Europe latitudes [15,16,22].
There are different opinions concerning the use of EIV to characterize site conditions in the absence of direct chemical and physical measurements: some authors used WEIV [8,16,65], while others employed UEIV [15,92]. In the former study, we used WEIV only and the present assessment analysis two cases: WEIV and UEIV. We used both approaches and did not reveal significant differences between all EIV parameters but light (light availability was significantly higher using UEIV compared to WEIV) (Figure 7). Correlations between respective UEIV and WEIV were significant and very high (Figure 8). All herbaceous plant (except Anthriscus sylvestris) species growing frequently (> 40% cases) next to I. parviflora had EIV values for light ≤ 6 which met the criteria for the forest plants [93]. EIVs of the recorded species also indicated high levels of soil nutrients (7–9) at sites. Investigations of nitrogen concentrations among populations of riparian herbaceous species of Lithuania revealed the highest leaf nitrogen concentrations (determined chemically) for another annual invader Echinocystis lobata (Michx.) Torr. & A. Gray [94]. In our study, median WEIV and UEIV values for temperature were 5.65 and 5.60, respectively, and corresponded with the data on I. parviflora along oak forests at southern latitudes (Austria, Germany, Poland, Czech Republic, and Slovakia) [16]. Since the time when EIVs were defined [13], climate change has significantly shifted the timing of major phenological events, such as spring advancement and autumn postponement [95], and might have caused changes in northern latitude species composition towards plants with higher optimum temperature for growth.
When compared to agricultural scrubland or riparian forest biotopes, the urban forest in our study was distinguished by lowest EIVs for light, soil acidity, and richness in soil nutrients (Table 4).

4.3. Importance of Genetical and Ecological Variables at Sites with Impatiens parviflora

Success of invasion of alien species depends on complex admixture of both plant and environment traits. However, before our former and present studies, the relations between genetic data and assemblages of herbaceous species in sites with I. parviflora had never been traced for the species. When compared to ISSRs or RAPDs [38], the AFLP marker system appeared to be the most important searching for relationships between genetic diversity of I. parviflora and biotic and abiotic features of environment. The present study revealed that AFLP polymorphism of I. parviflora populations correlated significantly with the total coverage of herbaceous plant species (Figure 8), and in the former assessment of the same sites, it was documented that I. parviflora coverage data significantly correlated with the extent of ISSR-based polymorphism [38]; however, principal component analysis (Figure 9) revealed lower importance of DNA marker systems for variability of sites with I. parviflora when compared to phytocoenological and indicatory data of herbaceous plant species. In accordance with the first two principal components, the highest variability of Lithuanian sites with I. parviflora was caused by coverage of herbaceous plant species excluding coverage by I. parviflora. In many studies of alien species, coverage by an invader has been interpreted as a measure of successful invasion [15,16,22].
In most studies of invasive populations, molecular data have been linked to geography [37,72]. Only a few investigations aimed to relate genetic features to biotic and abiotic environment [88,96]. Relationships between genetic differentiation and various environmental variables such as temperature, humidity, and nitrogen were documented for Phalaris arundinacea within invasive distribution range [96]. Our studies of I. parviflora represent the first attempts to relate genetic features of populations to the biotic features of their environment.
Combining data from several DNA marker systems might assist in better detection of differences between populations. However, the lack of differentiation effects in the present study could be due to noncoding regions to which molecular markers are mainly related and may not correlate with adaptive characters [37,97], which are well-expressed for I. parviflora, known as species of wide ecological amplitude [15,16,17,19,21,22].
Our methodical assessments concerning the comparisons of number of herbaceous plant species at sites and EIV application approaches might be the source of information for the development of cost-effective methods in future research. Impatiens parviflora is one of the invasive species for which management priority should be set at both European and national levels. The results of this study might be useful for forest owners implementing programs for development of a sustainable forest.
Other methods of molecular research should be used for the future assessments of I. parviflora. The further molecular investigations of I. parviflora populations should extend longitudinal and latitudinal areas, additionally encompassing the native range of distribution of the species.

Supplementary Materials

The following supporting information can be downloaded at: https://www.mdpi.com/article/10.3390/f13081228/s1, Figure S1: Clustering of sites with small balsam (Impatiens parviflora) (top cladogram) and herbaceous plant species in sites (right side cladogram). The number of herbaceous plant species—138 (NSp-138).

Author Contributions

Conceptualization, E.K. (Eugenija Kupčinskienė) and V.M.; data curation, K.S., E.K. (Edvina Krokaitė), R.J., L.J. and E.K. (Eugenija Kupčinskienė); software, T.R., L.J. and V.M.; funding acquisition, E.K. (Eugenija Kupčinskienė); investigation, K.S., L.J. and R.J.; methodology, K.S., V.M. and E.K. (Edvina Krokaitė); project administration, L.J.; visualization, L.J., E.K. (Edvina Krokaitė), T.R. and V.M.; writing—original draft, E.K. (Eugenija Kupčinskienė); writing—review and editing, E.K. (Eugenija Kupčinskienė), L.J., K.S., E.K. (Edvina Krokaitė), V.M., A.P., T.R. and R.J. All authors have read and agreed to the published version of the manuscript.

Funding

This study was funded by the Research Council of Lithuania, Grant No. LEK-07/2012.

Acknowledgments

Jūratė Šikšnianienė for technical assistance in capillary electrophoresis.

Conflicts of Interest

The authors declare no conflict of interest.

References

  1. Siegert, M.J. Environmental Sciences in the Twenty-First Century. Front. Environ. Sci. 2016, 4, 16. [Google Scholar] [CrossRef]
  2. Langmaier, M.; Lapin, K. A Systematic review of the impact of invasive alien plants on forest regeneration in European temperate forests. Front. Plant Sci. 2020, 11, 524969. [Google Scholar] [CrossRef]
  3. Xie, P.; Liu, T.; Chen, H.; Su, Z. Community structure and soil mineral concentration in relation to plant invasion in a subtropical urban and rural ecotone. Forests 2021, 12, 185. [Google Scholar] [CrossRef]
  4. Wagner, V.; Chytrý, M.; Jiménez-Alfaro, B.; Pergl, J.; Hennekens, S.; Biurrun, I.; Knollová, I.; Berg, C.; Vassilev, K.; Rodwell, J.S.; et al. Alien plant invasions in European woodlands. Divers. Distrib. 2017, 23, 969–981. [Google Scholar] [CrossRef]
  5. Biodiversity Strategy for 2030. European Commission, Brussels. 2020. Available online: https://ec.europa.eu/environment/strategy/biodiversity-strategy-2030_en (accessed on 31 January 2022).
  6. New EU Forest Strategy for 2030. European Commission, Brussels. 2021. Available online: https://ec.europa.eu/environment/strategy/forest-strategy_en (accessed on 31 January 2022).
  7. The Ministry of Environment of the Republic of Lithuania. List of Invasive Species in Lithuania, Approved by the Minister of Environment of the Republic of Lithuania, Order No. D1-433 of 27 August 2004. Register Of Legal Acts, 20 July 2015, No. 11487. 2015. Available online: https://www.e-tar.lt/portal/lt/legalAct/TAR.7B6390A69C91/asr (accessed on 28 December 2021).
  8. Marozas, V.; Cekstere, G.; Laivins, M.; Straigyte, L. Comparison of neophyte communities of Robinia pseudoacacia L. and Acer negundo L. in the eastern Baltic Sea region cities of Riga and Kaunas. Urban For. Urban Green. 2015, 14, 826–834. [Google Scholar] [CrossRef]
  9. Straigyte, L.; Cekstere, G.; Laivins, M.; Marozas, V. The spread, intensity and invasiveness of the Acer negundo in Riga and Kaunas. Dendrobiology 2015, 74, 157–168. [Google Scholar] [CrossRef]
  10. Krevš, A.; Darginavičienė, J.; Gylytė, B.; Grigutytė, R.; Jurkonienė, S.; Karitonas, R.; Kučinskienė, A.; Pakalnis, R.; Sadauskas, K.; Vitkus, R.; et al. Ecotoxicological effects evoked in hydrophytes by leachates of invasive Acer negundo and autochthonous Alnus glutinosa fallen off leaves during their microbial decomposition. Environ. Pollut. 2013, 173, 75–84. [Google Scholar] [CrossRef]
  11. Manusadžianas, L.; Darginavičienė, J.; Gylytė, B.; Jurkonienė, S.; Krevš, A.; Kučinskienė, A.; Mačkinaitė, V.; Pakalnis, R.; Sadauskas, K.; Sendžikaitė, J.; et al. Ecotoxicity effects triggered in aquatic organisms by invasive Acer negundo and native Alnus glutinosa leaf leachates obtained in the process of aerobic decomposition. Sci. Total Environ. 2014, 496, 35–44. [Google Scholar] [CrossRef]
  12. Krevš, A.; Kučinskienė, A.; Mačkinaitė, R.; Manusadžianas, L. Microbial colonization and decomposition of invasive and native leaf litter in the littoral zone of lakes of different trophic state. Limnologica 2017, 67, 54–63. [Google Scholar] [CrossRef]
  13. Ellenberg, H.; Weber, H.E.; Wirth, V.; Werner, W.; Paulien, D. Zeigerwerte von Pflanzen in Mitteleuropa. Scr. Geobot. 1992, 18, 1–258. [Google Scholar]
  14. Tanner, R. Datasheets: Impatiens parviflora (small balsam). CAB Europe—UK, Bakeham Lane, Egham, Surrey TW20 9TY, UK. 2008. Available online: http://www.cabi.org/isc/datasheet/28768 (accessed on 28 January 2022).
  15. Jarčuška, B.; Slezák, M.; Hrivnák, R.; Senko, D. Invasibility of alien Impatiens parviflora in temperate forest understories. Flora 2016, 224, 14–23. [Google Scholar] [CrossRef]
  16. Reczyńska, K.; Świerkosz, K.; Dajdok, Z. The spread of Impatiens parviflora DC. in Central European oak forests—Another stage of invasion? Acta Soc. Bot. Pol. Pol. 2015, 84, 401–411. [Google Scholar] [CrossRef]
  17. Maslo, S.; Šarić, Š. Small Balsam, Impatiens parviflora (Balsaminaceae): A new alien species to the flora of Bosnia and Herzegovina. Phytol. Balc. 2019, 25, 69–73. [Google Scholar]
  18. Coombe, D.E. Biological flora of the British Isles, Impatiens parviflora DC. J. Ecol. 1956, 44, 701–713. [Google Scholar] [CrossRef]
  19. Elias, P. Biological and ecological causes of invasion of Impatiens parviflora DC. into forest communities in Central Europe. AHR 1999, 1, 1–3. [Google Scholar]
  20. Trepl, L. Uber Impatiens parviflora DC. als Agriophyt in Mitteleuropa. In Dissertationes Botaniceae; Gantner, A.R., Ed.; Kommanditgesellschaft: Vaduz, Germany, 1984. (In German) [Google Scholar]
  21. Hejda, M. What is the impact of Impatiens parviflora on diversity and composition of herbal layer communities of temperate forests? PLoS ONE 2012, 7, e39571. [Google Scholar] [CrossRef]
  22. Chmura, D. Biology and Ecology of an Invasion of Impatiens parviflora DC. In Natural and Semi-Natural Habitats; Akademia Techniczno-Humanistyczna w Bielsku-Bialej: Bialsko-Biela, Poland, 2014; 216p. [Google Scholar]
  23. Kamieński, F. Nowy nabytek flory krajowej. Wszechświat 1884, 3, 517–518. (In Polish) [Google Scholar]
  24. Priede, A. Invasive Neophytes in the Flora of Latvia: Distribution and Dynamics. Ph.D. Thesis, University of Latvia, Riga, Latvia, 2009; p. 26. [Google Scholar]
  25. Matulionis, P. Latin-Lithuanian-Russian-Polish Dictionary of Lithuania Plants; M. Kuktos Print: Vilnius, Lithuania, 1907; 112p. [Google Scholar]
  26. Wisnewski, P. Nienotowane stanowiska kilku rzadszych krajowych i zawleczonych roslin w Wilensczyznie. Acta Soc. Bot. Pol. 1934, 11, 207–209. (In Polish) [Google Scholar]
  27. Dagys, J.; Kuprevičius, J.; Minkevičius, A. Impatiens parviflora. In Manual for Indentification of Lithuanian Plants (Vadovas Lietuvos augalams pažinti); Kuprevičius, J., Ed.; Spindulys: Kaunas, Lithuania, 1934; 358p. (In Lithuanian) [Google Scholar]
  28. Vailionis, L.; Dagys, J. Lithuanian Dictionary of Botany (Lietuviškas Botanikos Žodynas); Varpas: Kaunas, Lithuania, 1938; Volume 1, 598p. (in Lithuanian) [Google Scholar]
  29. Natkevicaite-Ivanauskiene, M. Adventive flora of Lithuanian Soviet Republic. Proc. Inst. Biol. 1951, 1, 77–124. (In Lithuanian) [Google Scholar]
  30. Snarskis, P. A Guide of Identification of Lithuania Plants; Mintis: Vilnius, Lithuania, 1954; 530p. (In Lithuanian) [Google Scholar]
  31. Obidziński, T.; Symonides, E. The influence of the groundlayer structure on the invasion of small balsam (Impatiens parviflora DC.) to natural and degraded forests. Acta Soc. Bot. Pol. Pol. 2000, 69, 311–318. [Google Scholar] [CrossRef]
  32. Klimko, M.; Piskorz, R. The usefulness of retrospective research along the road-forest border zone for reconstruction of invasion of oak-hombeam forest communities by Impatiens parviflora DC. Ecological Questions. Int. J. Controv. Probl. Ecol. 2003, 3, 63–69. [Google Scholar]
  33. Priede, A. Distribution of some invasive alien plant species in riparian habitats in Latvia. Bot. Lith. 2009, 14, 137–150. [Google Scholar]
  34. Dobravolskaitė, R. Alien species Impatiens parviflora invasion into forest communities of Lithuania. Bot. Lith. 2012, 18, 3–12. [Google Scholar] [CrossRef]
  35. Kupcinskiene, E.; Zybartaite, L.; Janulioniene, R.; Zukauskiene, J.; Paulauskas, A. Molecular diversity of small balsam populations in relation to site characteristics. Cent. Eur. J. Biol. 2013, 8, 1048–1061. [Google Scholar] [CrossRef]
  36. Marozas, V.; Preikša, Ž.; Koike, T.; Watanabe, T. Impact of nitrogen pollution disturbances on forest vegetation and fungi near a fertilizer factory. Eur. J. For. Res. 2022, 22, 52–58. [Google Scholar]
  37. Dormontt, E.E.; Lowe, A.J.; Prentis, P.J. Is rapid adaptive evolution important in successful invasions? In Fifty Years of Invasion Ecology: The Legacy of Charles Elton; Richardson, D.M., Ed.; Wiley-Blackwell: Oxford, UK, 2011; pp. 175–193. [Google Scholar]
  38. Krokaitė, E.; Janulionienė, R.; Jocienė, L.; Rekašius, T.; Rajackaitė, G.; Paulauskas, A.; Marozas, V.; Kupcinskiene, E. Relating invasibility and invasiveness: Case study of Impatiens parviflora. Front. Ecol. Evol. 2022, 10, 1–17. [Google Scholar] [CrossRef]
  39. Vos, P.; Hogers, R.; Bleeker, M.; Reijans, M.; Vandelee, T.; Hornes, M.; Frijters, A.; Pot, J.; Peleman, J.; Kuiper, M.; et al. AFLP—a new technique for DNA-fingerprinting. Nucleic Acids Res. 1995, 23, 4407–4414. [Google Scholar] [CrossRef]
  40. Powell, W.; Machray, G.C.; Provan, J. Polymorphism revealed by simple sequence repeats. Trends Plant Sci. 1996, 1, 215–222. [Google Scholar] [CrossRef]
  41. Crawford, L.A.; Koscinski, D.; Keyghobadi, N. A call for more transparent reporting of error rates: The quality of AFLP data in ecological and evolutionary research. Mol. Ecol. 2012, 21, 5911–5917. [Google Scholar] [CrossRef]
  42. Bensch, S.; Akesson, M. Ten years of AFLP in ecology and evolution: Why so few animals? Mol. Ecol. 2005, 14, 2899–2914. [Google Scholar] [CrossRef] [PubMed]
  43. Poczai, P.; Varga, I.; Laos, M.; Cseh, A.; Bell, N.; Valkonen, J.; Hyvönen, J. Advances in plant gene-targeted and functional markers: A review. Plant Methods 2013, 9, 6. [Google Scholar] [CrossRef] [PubMed]
  44. Amsellem, L.; Noyer, J.L.; Le Bourgeois, T.; Hossaert-Mckey, M. Comparison of genetic diversity of the invasive weed Rubus alceifolius Poir. (Rosaceae) in its native range and in areas of introduction, using amplified fragment length polymorphism (AFLP) markers. Mol. Ecol. 2000, 9, 443–455. [Google Scholar] [CrossRef] [PubMed]
  45. Jahodová, Š.; Trybush, S.; Pyšek, P.; Wade, M.; Karp, A. Invasive species of Heracleum in Europe: An insight into genetic relationships and invasion history. Divers. Distrib. 2007, 13, 99–114. [Google Scholar] [CrossRef]
  46. Chun, Y.J.; Nason, J.D.; Moloney, K.A. Comparison of quantitative and molecular genetic variation of native vs. invasive populations of purple loosestrife (Lythrum salicaria L., Lythraceae). Mol. Ecol. 2009, 18, 3020–3035. [Google Scholar] [CrossRef] [PubMed]
  47. Jocienė, L.; Krokaitė, E.; Shakeneva, D.; Rekašius, T.; Stanys, V.; Šikšnianienė, J.B.; Žvingila, D.; Paulauskas, A.; Kupčinskienė, E. Relationship between genetic and environmental characteristics of Lithuanian populations of purple loosestrife (Lythrum salicaria). J. Environ. Eng. Landsc. Manag. 2022, 30, 81–93. [Google Scholar] [CrossRef]
  48. Casler, M.D.; Phillips, M.M.; Krohn, A.L. DNA polymorphisms reveal geographic races of reed canarygrass. Crop Sci. 2009, 49, 2139–2148. [Google Scholar] [CrossRef]
  49. Wu, H.; Qiang, S.; Peng, G. Genetic diversity in Veronica hederifolia (Plantaginaceae), an invasive weed in China, assessed using AFLP markers. In Annales Botanici Fennici; Finnish Zoological and Botanical Publishing Board: Helsinki, Finland, 2010; Volume 47, pp. 190–198. [Google Scholar]
  50. Bzdęga, K.; Janiak, A.; Tarłowska, S.; Kurowska, M.; Tokarska-Guzik, B.; Szarejko, I. Unexpected genetic diversity of Fallopia japonica from Central Europe revealed after AFLP analysis. Flora: Morphol. Distrib. Funct. Ecol. Plants 2012, 207, 636–645. [Google Scholar] [CrossRef]
  51. Wang, T.; Chen, G.; Zan, Q.; Wang, C.; Su, Y.J. AFLP genome scan to detect genetic structure and candidate loci under selection for local adaptation of the invasive weed Mikania micrantha. PLoS ONE 2012, 7, e41310. [Google Scholar] [CrossRef]
  52. Zhao, S.Y.; Sun, S.G.; Dai, C.; Gituru, R.W.; Chen, J.M.; Wang, Q.F. Genetic variation and structure in native and invasive Solidago canadensis populations. Weed Res. 2015, 55, 163–172. [Google Scholar] [CrossRef]
  53. Carr, J.; Korban, S.S. Evaluating genetic relationships in seed impatiens, Impatiens walleriana, using AFLP profiling. Plant Breed. 2004, 123, 577–581. [Google Scholar] [CrossRef]
  54. Carr, J.; Xu, M.; Dudley, J.W.; Korban, S.S. AFLP analysis of genetic variability in New Guinea impatiens. Theor. Appl. Genet. 2003, 106, 1509–1516. [Google Scholar] [CrossRef] [PubMed]
  55. Hatcher, P.E.; Wilkinson, M.J.; Albani, M.C.; Hebbern, C.A. Conserving marginal populations of the food plant (Impatiens noli-tangere) of an endangered moth (Eustroma reticulatum) in a changing climate. Biol. Conserv. 2004, 116, 305–317. [Google Scholar] [CrossRef]
  56. Von Wettberg, E.J. Do founder effects impact invasions? Genetic variation in North American Impatiens naturalized in England. In Proceedings of the ESA/SER Joint Meeting, Invasion: Genetics and Evolutionary Processes, San Jose, CA, USA, 5–10 August 2007. COS 51-5. [Google Scholar]
  57. Von Wettberg, E.J.; Remington, D.L.; Schmitt, J. Partitioning adaptive differentiation across a patchy landscape: Shade avoidance traits in Impatiens capensis. Evolution 2008, 62, 654–667. [Google Scholar] [CrossRef]
  58. Komosińska, E.; Wòdkiewicz, M.; Jarzyna, I.; Jarochowska, E.; Milanowski, R.; Chwedorzewska, K.; Wyszomirski, T. Some attempts to detect genetic differences between populations of small balsam (Impatiens parviflora DC.). Biodivers. Res. Conserv. 2006, 3–4, 245–247. [Google Scholar]
  59. Chmura, D.; Sierka, E. Relationships between invasive plant Impatiens parviflora and species richness of forest floor vegetation. Pol. J. Ecol. 2006, 54, 417–428. [Google Scholar]
  60. Vervoort, A.; Jacquemart, A.L. Habitat overlap of the invasive Impatiens parviflora DC. with its native congener I. noli-tangere L. Phytocoenologia 2012, 42, 249–257. [Google Scholar] [CrossRef]
  61. Florianova, A.; Münzbergová, Z. Invasive Impatiens parviflora has negative impact on native vegetation in oak-hornbeam forests. Flora 2017, 226, 10–16. [Google Scholar] [CrossRef]
  62. Zybartaite, L.; Zukauskiene, J.; Jodinskiene, M.; Janssens, S.B.; Paulauskas, A.; Kupcinskiene, E. RAPD analysis of genetic diversity among Lithuanian populations of Impatiens glandulifera. Zemdirb.-Agric. 2011, 98, 391–398. [Google Scholar]
  63. Kloss, L.; Fischer, M.; Durka, W. Land-use effects on genetic structure of a common grassland herb: A matter of scale. Basic Appl. Ecol. 2011, 12, 440–448. [Google Scholar] [CrossRef]
  64. Braun-Blanquet, J. Pflanzensoziologie, Grundzüge der Vegetationskunde, 3rd ed.; Springer: Vienna, Austria, 1964; p. 613. [Google Scholar]
  65. Marozas, V. Effect of the coniferous forest-grassland edge on ground vegetation in the mixed European forest zone, Lithuania. Dendrobiology 2014, 71, 15–22. [Google Scholar] [CrossRef]
  66. Pritchard, J.K.; Stephens, M.; Donnelly, P. Inference of population structure using multilocus genotype data. Genetics 2000, 155, 945–959. [Google Scholar] [CrossRef] [PubMed]
  67. Evanno, G.; Regnaut, S.; Goudet, J. Detecting the number of clusters of individuals using the software Structure: A simulation study. Mol. Ecol. 2005, 14, 2611–2620. [Google Scholar] [CrossRef] [PubMed]
  68. McCune, B.; Mefford, M.J. PC-ORD. Multivariate Analysis of Ecological Data, Version 6.0 MjM Software; MjM Software Design: Gleneden Beach, OR, USA, 2011; 28p. [Google Scholar]
  69. Nei, M. Estimation of average heterozygosity and genetic distance from a small number of individuals. Genetics 1978, 89, 583–590. [Google Scholar] [CrossRef] [PubMed]
  70. Frankham, R. Resolving the genetic paradox in invasive species. Heredity 2005, 94, 385. [Google Scholar] [CrossRef] [PubMed]
  71. Cross, H.B.; Lowe, A.J.; Gurgel, C.F.D. DNA barcoding of invasive species. In Fifty Years of Invasion Ecology: The Legacy of Charles Elton; Richardson, D.M., Ed.; Wiley-Blackwell: Oxford, UK, 2011; pp. 289–300. [Google Scholar]
  72. Hagenblad, J.; Hülskötter, J.; Acharya, K.P.; Brunet, J.; Chabrerie, O.; Cousins, S.A.O.; Dar, P.A.; Diekmann, M.; De Frenne, P.; Hermy, M.; et al. Low genetic diversity despite multiple introductions of the invasive plant species Impatiens glandulifera in Europe. BMC Genet. 2015, 16, 103. [Google Scholar] [CrossRef] [PubMed]
  73. Korpelainen, H.; Elshibli, S. Assessment of genetic relationships among native and introduced Himalayan balsam (Impatiens glandulifera) plants based on genome profiling. Ecol. Evol. 2021, 11, 13295–13304. [Google Scholar] [CrossRef]
  74. Jocienė, L. Genetic Diversity of Invasive Populations of Himalayan Balsam (Impatiens glandulifera Royle). Ph.D. Thesis, Vytautas Magnus University, Kaunas, Lithuania, 2015. [Google Scholar]
  75. Jakše, J.; Kindlhofer, K.; Javornik, B. Assessment of genetic variation and differentiation of hop genotypes by microsatellite and AFLP markers. Genome 2001, 44, 773–782. [Google Scholar] [CrossRef]
  76. Bandelj, D.; Jakse, J.; Javornik, B. Amplification of fluorescent-labelled microsatellite markers in olives by a novel, economic method. Acta Agric. Slov. 2004, 83, 323–329. [Google Scholar]
  77. Li, L.; Wanapu, C.; Huang, X.; Huang, T.; Li, Q.; Peng, Y.; Huang, G. Comparison of AFLP and SSR for genetic diversity analysis of Brassica napus hybrids. J. Agric. Sci. 2011, 3, 101–110. [Google Scholar] [CrossRef]
  78. Provan, J.; Love, H.M.; Maggs, C.A. Development of microsatellites for the invasive riparian plant Impatiens glandulifera (Himalayan balsam) using inter simple sequence repeat cloning. Mol. Ecol. Notes 2007, 7, 451–453. [Google Scholar] [CrossRef]
  79. Walker, N.F.; Hulme, P.E.; Hoelzel, A.R. Population genetics of an invasive riparian species, Impatiens glandulifera. Plant Ecol. 2009, 203, 243–252. [Google Scholar] [CrossRef]
  80. Skrede, I.; Borgen, L.; Brochmann, C. Genetic structuring in three closely related circumpolar plant species: AFLP versus microsatellite markers and high-arctic versus arctic–alpine distributions. Heredity 2009, 102, 293–302. [Google Scholar] [CrossRef]
  81. Kupcinskiene, E.; Zybartaite, L.; Paulauskas, A. Comparison of genetic diversity of three Impatiens species from Central Europe and Baltic region. Zemdirb.-Agric 2015, 102, 87–94. [Google Scholar] [CrossRef]
  82. Patamsytė, J.; Čėsnienė, T.; Naugžemys, D.; Kleizaitė, V.; Tunaitienė, V.; Rančelis, V.; Žvingila, D. Different habitats show similar genetic structure of Bunias orientalis L. (Brassicaceae) in Lithuania. Not. Bot. Horti Agrobot. Cluj Napoca 2013, 41, 396–403. [Google Scholar] [CrossRef]
  83. Vyšniauskienė, R.; Naugžemys, D.; Rudaitytė-Lukošienė, E.; Patamsytė, J.; Butkauskas, D.; Kupčinskienė, E.; Žvingila, D. Genetic diversity of Nuphar lutea in Lithuanian river populations. Aquat. Bot. 2020, 161, 103173. [Google Scholar] [CrossRef]
  84. Vilcinskas, R.; Jociene, L.; Rekasius, T.; Marozas, V.; Paulauskas, A.; Kupcinskiene, E. Genetic diversity of Lithuanian populations of Juniperus communis L. in relation to abiotic and biotic factors. Dendrobiology 2016, 76, 61–71. [Google Scholar] [CrossRef]
  85. Jørgensen, S.; Mauricio, R. Neutral genetic variation among wild North American populations of the weedy plant Arabidopsis thaliana is not geographically structured. Mol. Ecol. 2004, 13, 3403–3413. [Google Scholar] [CrossRef] [PubMed]
  86. Lithuanian Hydrometeorological Service under the Ministry of Environment. Available online: http://www.meteo.lt/en/web/guest/climate-regions-of-lithuania (accessed on 28 January 2022).
  87. Anderson, N.O.; Jocienė, L.; Krokaitė, E.; Rekašius, T.; Paulauskas, A.; Kupčinskienė, E. Genetic diversity of Phalaris arundinacea populations in relation to river regulation in the Merkys basin, Lithuania. River Res. Appl. 2018, 34, 300–309. [Google Scholar] [CrossRef]
  88. Wagner, V.; Vecera, M.; Jiménez-Alfaro, B.; Pergl, J.; Lenoir, J.; Svenning, J.C.; Pyšek, P.; Agrillo, E.; Biurrun, I.; Campos, J.A.; et al. Alien plant invasion hotspots and invasion debt in European woodlands. J. Veg. Sci. 2021, 32, e13014. [Google Scholar] [CrossRef]
  89. Lapin, K.; Oettel, J.; Steiner, H.; Langmaier, M.; Sustic, D.; Starlinger, F.; Kindermann, G.; Frank, G. Invasive alien plant species in unmanaged forest reserves, Austria. NeoBiota 2019, 48, 71–96. [Google Scholar] [CrossRef]
  90. Vojík, M.; Sádlo, J.; Petřík, P.; Pyšek, P.; Man, M.; Pergl, J. Two faces of parks: Sources of invasion and habitat for threatened native plants. Preslia 2020, 92, 353–373. [Google Scholar] [CrossRef]
  91. Jurová, J.; Matoušková, M.; Wajs-Bonikowska, A.; Kalemba, D.; Renčo, M.; Sedlák, V.; Gogalóvá, Z.; Poráčová, J.; Šalamún, P.; Grulóvá, D. Potential phytotoxic effect of essential oil of non-native species Impatiens parviflora DC. Plants 2019, 8, 241. [Google Scholar] [CrossRef] [PubMed]
  92. Käfer, J.; Witte, J.P.M. Cover-weighted averaging of indicator values in vegetation analyses. J. Veg. Sci. 2004, 15, 647–652. [Google Scholar] [CrossRef]
  93. Heinken, T.; Diekmann, M.; Liira, J.; Orczewska, A.; Schmidt, M.; Brunet, J.; Chytrý, M.; Chabrerie, O.; Decocq, G.; De Frenne, P.; et al. The European Forest Plant Species List (EuForPlant): Concept and applications. J. Veg. Sci. 2022, 33, e13132. [Google Scholar] [CrossRef]
  94. Krokaitė, E.; Shakeneva, D.; Juškaitytė, E.; Tomas, R.; Nemaniūtė-Gužienė, J.; Butkuvienė, J.; Patamsytė, J.; Rančelienė, V.; Vyšniauskienė, R.; Duchovskienė, L.; et al. Nitrogen concentration of the aquatic plant species in relation to land cover type and other variables of the environment. Zemdirb.-Agric. 2019, 106, 203–212. [Google Scholar] [CrossRef]
  95. Piao, S.; Liu, Q.; Chen, A.; Janssens, I.A.; Fu, Y.; Dai, J.; Lingli, L.; Xu, L.; Miaogen, S.; Zhu, X. Plant phenology and global climate change: Current progresses and challenges. Glob. Change Biol. 2019, 25, 1922–1940. [Google Scholar] [CrossRef]
  96. Kettenring, K.M.; Menuz, D.R.; Mock, K.E. The nativity and distribution of the cryptic invader Phalaris arundinacea (reed canarygrass) in riparian areas of the Columbia and Missouri River Basins. Wetlands 2019, 39, 55–66. [Google Scholar] [CrossRef]
  97. Bublyk, O.; Andreev, I.; Kalendar, R.; Spiridonova, K.; Kunakh, V. Efficiency of different PCR-based marker systems for assessment of Iris pumila genetic diversity. Biologia 2013, 68, 613–620. [Google Scholar] [CrossRef]
Figure 1. Location of selected sites with small balsam (Impatiens parviflora) in Lithuania. The names of populations consist of three letters, which are acronyms of geographical location.
Forests 13 01228 g001
Figure 2. Dendrogram of AFLP loci relationships among 21 Lithuanian populations of small balsam (Impatiens parviflora) obtained using Nei’s (1978) genetic distances and UPGMA algorithm. Populations are named by three letter acronyms (see Figure 1 for details of geographical location of populations).
Forests 13 01228 g002
Figure 3. Two dimensional PCoA plots of small balsam (I. parviflora) populations (AC) and individuals (DF). Different colors of the labels indicate geographical location of populations: blue—north-western, gray—central, and red—south-eastern part of Lithuania. The site codes correspond to the data presented in Figure 1. Principal coordinate analysis of AFLP data for individuals showed that coordinate 1 accounted for 8.5%, coordinate 2 for 7.5%, and coordinate 3 for 5.0% of the total variation. The importance of the first two coordinates comprised 16.0% and importance of the first three coordinates comprised 20.9% of the total genetic variance of I. parviflora individuals (Figure 3D–F).
Forests 13 01228 g003
Figure 4. ΔK statistics for AFLP data-based Bayesian analysis of 21 Lithuanian populations of small balsam (I. parviflora). ΔK values for K ranging between 1 and 21 markers for 21 populations of Impatiens parviflora.
Forests 13 01228 g004
Figure 5. Clustering of the sites with small balsam (Impatiens parviflora) (top cladogram) and herbaceous plant species in sites (right side cladogram). The number of herbaceous plant species—76 (NSp-76). In the right side cladogram: Urt dio—Urtica dioica L., Imp par—Impatiens parviflora DC., Ant syl—Anthriscus sylvestris (L.) Hoffm., Geu urb—Geum urbanum L., Ver cha—Veronica chamaedrys L., Aeg pod—Aegopodium podagraria L., Gle hed—Glechoma hederacea L., Ste med—Stellaria media (L.) Vill., Che maj—Chelidonium majus L., All pet—Alliaria petiolata (M.Bieb.) Cavara & Grande, Gal apa—Galium aparine L., Dac glo—Dactylis glomerata L., Her sib—Heracleum sphondylium subsp. sibiricum (L.) Simonk., Ran rep—Ranunculus repens L., Rub cae—Rubus caesius L., Vio rei—Viola reichenbachiana Jord. ex Boreau, Ger rob—Geranium robertianum L., Pla maj—Plantago major L., Lam alb—Lamium album L., Oen bie—Oenothera biennis L., Tar off—Taraxacum campylodes G. E. Haglund, Arc tom—Arctium tomentosum Mill., Ang syl—Angelica sylvestris L., Imp gla—Impatiens glandulifera Royle, Rub ida—Rubus idaeus L., Mer per—Mercurialis perennis L., Car imp—Cardamine impatiens L., Pla lan—Plantago lanceolata L., Mai bif—Maianthemum bifolium (L.) F.W.Schmidt, Myo aqu—Stellaria aquatica (L.) Scop., Fra ves—Fragaria vesca L., Tor jap—Torilis japonica DC., Pil cae—Pilosella caespitosa (Dumort.) P. D. Sell & C.West, Pol mac—Persicaria maculosa Gray, Imp nol—Impatiens noli-tangere L., Ste nem—Stellaria nemorum L., Ran fic—Ficaria verna Huds, Hum lup—Humulus lupulus L., Lyc eur—Lycopus europaeus L., Lys vul—Lysimachia vulgaris L., Alc xan—Alchemilla xanthochlora Rothm., Lys num—Lysimachia nummularia L., Cir arv—Cirsium arvense (L.) Scop., Son arv—Sonchus arvensis L., Con maj—Convallaria majalis L., Rub sax—Rubus saxatilis L., Oxa str—Oxalis stricta L., Fes gig—Festuca gigantea (L.) Vill., Poa pal—Poa pratensis L., Dry dil—Dryopteris dilatata (Hoffm.) A. Gray, Ste gra—Stellaria graminea L., Tus far—Tussilago farfara L., Dry car—Dryopteris carthusiana (Vill.) H.P. Fuchs, Epi mon—Epilobium montanum L., Ath fil—Athyrium filix-femina (L.) Roth, Rum obt—Rumex obtusifolius L., Con sep—Convolvulus sepium (L.) R.Br., Epi hir—Epilobium hirsutum L., Des ces—Deschampsia cespitosa (L.) P.Beauv., Eup can—Calystegia sepium (L.) R. Br., Myc mur—Lactuca muralis (L.) Gaertn., Cir ole—Cirsium oleraceum (L.) Scop., Ach mil—Achillea millefolium L., Car hir—Carex hirta L., Art vul—Artemisia vulgaris L., Atr hor—Atriplex hortensis L., Agr eup—Agrimonia eupatoria L., Scr nod—Scrophularia nodosa L., Ely rep—Elymus repens (L.) Gould, Lap com—Lapsana communis L., Epi ang—Epilobium angustifolium (L.) Scop., Poa tri—Poa trivialis L., Vac myr—Vaccinium myrtillus L. In the top cladogram, 3 letters denote sites (location of sites is provided in Figure 1).
Forests 13 01228 g005
Figure 6. Total coverage (covT) by herbaceous plants including small balsam (Impatiens parviflora) and coverage by herbaceous plants (covHerb) without I. parviflora. Coverage data are provided for two cases: the total number of species (1) 138 (NSp-138); (2) 76 (NSp-76). Value for each population is indicated by dot.
Forests 13 01228 g006
Figure 7. The medians of weighted (WEIV) and unweighted Ellenberg indicatory values (UEIV) for sites with small balsam (Impatiens parviflora) (L-WEIV, L-UEIV—light, T-WEIV, T-UEIV—temperature, K-WEIV, K-UEIV—continentality, F-WEIV, F-UEIV—soil moisture, R-WEIV, R-UEIV—soil pH, N-WEIV, N-UEIV—soil nutrients). NSp-76. Value for each population is indicated by dot.
Forests 13 01228 g007
Figure 8. Spearman correlation coefficients (Rs) interrelating molecular, biotic, and abiotic variables of sites with small balsam (Impatiens parviflora). Color of the round figures reflects direction of correlation, numbers inside figures are values of significance, PLPs—are polymorphisms at AFLP (amplified fragment length polymorphism), ISSR (inter simple sequence repeats), and RAPD (randomly amplified polymorphic DNA) loci, covT— coverage by all herbaceous plant species, covHerb—by all herbaceous plant species but I. parviflora), covIP — coverage by I. parviflora), NSp — number herbaceous plant species with and without unique species in sites, 138 or 76, respectively, weighted or unweighted (WEIV or UWEIV) values for light (L), temperature (T), continentally (K), soil moisture (F), soil reaction (R), and soil nutrients (N).
Forests 13 01228 g008
Figure 9. The analysis for the 1st two principal components (PC1 and PC2) of variation of small balsam (Impatiens parviflora) depending on genetic markers (PLP at AFLP loci, PLP at ISSR loci and PLP at RAPD loci), number and coverage by herbaceous plant species (NSp-138, NSp-76, cov-IP, covT-138, covT-76, covHerb-138, covHerb-76), and abiotic parameters (L, T, K, F, R, N) defined by EIVs (WEIVs and UEIVs). Three black letters denote populations and red arrows with letters denote variables.
Forests 13 01228 g009
Table 1. Characteristics of AFLP primers, size and number of DNA fragments generated at AFLP loci of populations of small balsam (Impatiens parviflora).
Name of
the Primer Pair
Sequence of the Primer
5′→3′
Annealing
T (°C)
Size of DNA
Fragments (bp)
Total Number
of DNA Fragments
Fragment Numbers
Per Population
Mean Number of the Fragments Per Population
EcoRI-AAC-FAM
MseI-CTG
GACTGCGTACCAATTCAAC
GATGAGTCCTGAGTAACTC
6651–4804038–4039.3 ± 0.3 *
EcoRI-ACG-VIC
MseI-CAC
GACTGCGTACCAATTCACG
GATGAGTCCTGAGTAACAC
6655–496353535.0
EcoRI-ACC-NED
MseI-CAC
GACTGCGTACCAATTCACC
GATGAGTCCTGAGTAACAC
6650–490262626.0
EcoRI-AGG-PET
MseI-CAC
GACTGCGTACCAATTCAGG
GATGAGTCCTGAGTAACAC
6680–4961312–1313.0 ± 0.2
EcoRI-AAC-FAM
MseI-CTG
GACTGCGTACCAATTCACC
GATGAGTCCTGAGTAACTG
6659–486272727.0
EcoRI-ACG-VIC
MseI-CAT
GACTGCGTACCAATTCACG
GATGAGTCCTGAGTAACAT
6656–4353128–3130.8 ± 0.7
EcoRI-AAG-NED
MseI-CAG
GACTGCGTACCAATTCAAG
GATGAGTCCTGAGTAACAG
6651–490212121.0
EcoRI-AGC-PET
MseI-CAC
GACTGCGTACCAATTCAGC
GATGAGTCCTGAGTAACAC
6654–483303030.0
Note: * CI—confidence interval; n = 21; p ≤ 0.05.
Table 2. The indices of genetic diversity for small balsam (Impatiens parviflora) populations using AFLP markers.
PopulationPLPhI
Mean ± CI *Mean ± CI *
VVe17.00.078 ± 0.0120.111 ± 0.017
VAP25.60.118 ± 0.0140.167 ± 0.019
Sve11.20.051 ± 0.0100.072 ± 0.014
VZi25.60.118 ± 0.0140.167 ± 0.019
DRa17.90.079 ± 0.0120.113 ± 0.016
Aly29.20.137 ± 0.0140.193 ± 0.020
KVa16.10.073 ± 0.0110.103 ± 0.016
KAS34.10.162 ± 0.0150.227 ± 0.021
KZa25.10.117 ± 0.0140.164 ± 0.019
KMa16.60.077 ± 0.0120.109 ± 0.016
Juo14.40.063 ± 0.0110.090 ± 0.015
Pre17.90.080 ± 0.0120.114 ± 0.017
Nid11.70.052 ± 0.0100.074 ± 0.014
Kar18.40.077 ± 0.0110.111 ± 0.016
Pal17.50.079 ± 0.0120.113 ± 0.017
Pla12.10.053 ± 0.0100.076 ± 0.014
Zag12.10.056 ± 0.0100.079 ± 0.014
Pan24.70.118 ± 0.0140.166 ± 0.020
ATr18.40.083 ± 0.0120.118 ± 0.017
JUp24.70.115 ± 0.0140.162 ± 0.019
Jon32.30.143 ± 0.0140.204 ± 0.020
Note: * CI—interval of confidence; n = 21; p ≤ 0.05; PLP—percentage of polymorphic loci, h—Nei’s gene diversity (Nei, 1978), I—Shannon’s information index.
Table 3. Analysis of AFLP loci variance for small balsam (Impatiens parviflora) populations. A. Two-level analysis. BD. Three-level analyses, differentiation of populations in relation to biotope (B), geographical zone (C), and road type (D).
SourcedfSSMSEst. Var.%Φp
A.
Among populations20305.51150.999ΦPT = 0.0870.001
Within populations84869.601010.3591
Total1041175.11 11.34100
B.
Among population groups of different biotopes234.18170.061ΦPT = 0.0090.132
Among populations within groups18271.33150.948ΦPR = 0.0840.001
Within populations84869.601010.3591ΦRT = 0.0890.001
Total1041175.11 11.36100
C.
Among population groups of different geographical zones233.66170.050ΦPT = 0.0040.142
Among populations within groups18271.84150.958ΦPR = 0.0840.001
Within populations84869.601010.3591ΦRT = 0.0880.001
Total1041175.11 11.35100
D.
Among of population groups besides different road type228.96140.000ΦPT = −0.0020.679
Among populations within groups18276.55151.009ΦPR = 0.0880.001
Within populations84869.601010.3591ΦRT = 0.0860.001
Total1041175.11 11.36100
Notes: df—degree of freedom, SS—sum of squares, MS—mean squares, Est. Var—estimated variability, %—percentage of variation, Φ—genetic differentiation. B. Biotopes: 1—urban forest, 2—riparian forest, 3—agrarian shrubland. C. Geographic parts: 1—north-western Lithuania, 2—central Lithuania, 3—south-eastern Lithuania. C. Roads: 1—unpaved road, 2—low traffic road, 3—intensive traffic road; p—significance of differences.
Table 4. Mean values with the interval of confidence (CI) for coverage by I. parviflora (covIP) and of weighted (WEIV) and unweighted Ellenberg indicatory values (EIV) for light (L-WEIV, U-EIV), soil acidity (R-WEIV, U-EIV), and soil nutrients (N-WEIV, N-EIV) per populations group for each biotope (urban forest, riparian forest, and agrarian scrubland).
covIPL-WEIVR-WEIVN-WEIVL-EIVR-EIVN-EIV
Urban forest
Mean42.45.2396.3266.5595.6526.0716.528
CI12.00.1990.3460.2030.1800.4650.325
Riparian forest
Mean33.85.6886.6586.8056.0686.5136.655
CI18.50.2190.3080.2410.2250.4390.394
Agrarian scrubland
Mean21.35.6406.6206.8375.8446.5906.895
CI12.10.3110.2540.2840.2120.3480.255
Publisher’s Note: MDPI stays neutral with regard to jurisdictional claims in published maps and institutional affiliations.

