Abstract
Due to the fragility of the habitats in mountain nature reserves, the vegetation is extremely sensitive to climate change, and its phenological changes are more specific. Therefore, it is of great significance to study the effects of topography and climate on the vegetation phenology in mountain nature reserves. Based on the vegetation phenology data retrieved from MODIS EVI2 during 2000 to 2017, combined with temperature data, spatial trend analysis and correlation analysis methods were used to study the effects of topographic and climatic factors on vegetation phenology in the Niubeiliang Nature Reserve of the Qinling Mountains. The results showed that the GSS (growing season start) was advanced with a rate of 4.24 days/10a, and the rates in the northern and southern slopes were almost the same; the GSE (growing season end) was delayed with a rate of 3.29 days/10a, and the rate in the northern slope was faster; and the GSL (growing season length) was prolonged. There were seasonal differences and north–south differences in the effects of topography on the phenophase. The phenophase changed regularly with the increase in altitude. The higher the altitude, the more significant the effect. The steeper the slope, the later the GSS, the earlier the GSE, and the more significant its effect on the GSE. The aspect had little effect on GSS but a more significant effect on GSE, which was the latest on the sunny slope and the earliest on the zero slope. Temperature affected both the GSS advance and the GSE delay, and both had a time-lag effect of approximately 2–3 months. Its effect was more significant in the GSE, in the southern slopes, and in the high-altitude areas.
1. Introduction
For the past hundred years, the global climate has been undergoing a significant change characterized by warming [1]. Climate change exhibits significant regional differences, and ecologically sensitive areas, especially the geographical transition zones and mountains at mid- and high-latitudes, are considered to be amplifiers of global warming signals [2,3,4,5,6]. Vegetation phenology is considered to be the most objective and sensitive biological indicator reflecting environmental conditions and climate change [7], and is regarded as the “language” of nature [8] and the “fingerprint” for diagnosing global change [9,10]. The vegetation phenology in many regions of the world has been significantly affected by climate change [11], and regions such as Europe [12,13], Asia [14,15], Australia [16], and North America [17,18] all have the phenomenon of a GSS (growing season start) in advance and a GSL (growing season length) in prolongation. However, due to the limitation of natural environment conditions such as terrain and traffic, phenological observation data in mountainous areas are extremely scarce.
The development of remote-sensing technology provides a new method for vegetation phenology monitoring, and has become an important means of phenological monitoring at present. Compared with traditional plant phenology observation technology, remote-sensing phenology has the advantages of a multi-temporal phase, wide spatial coverage, strong temporal continuity, etc. It can realize the expansion of the research scale from individual vegetation to a community or ecosystem, and from point to surface, which is convenient for carrying out research on phenological changes at the regional and global scales [19]. Scholars have used the vegetation index monitored by remote sensing in the tropical rain forests [20] and the transitional zone of desert-steppe in the northern hemisphere [21], as well as in China, the Qinghai-Tibet Plateau [22,23,24,25,26], the Loess Plateau [27,28,29], the Inner Mongolia [30,31], the Qaidam Basin [32], the southern subtropical monsoon region [33], the southwest karst rift basin [34], and other ecologically sensitive areas, where extensive research on vegetation phenology has been carried out. At the same time, remote-sensing technology also has unique advantages in monitoring mountain phenology. At present, it has been applied to mountain vegetation phenology research [35,36]. Vegetation phenology in the Qinling Mountains is also a hotspot area of concern to scholars [7,37,38,39,40,41,42,43,44].
Some scholars have pointed out that 15% of the earth’s terrestrial carbon sinks (about 312 Gt) are stored in reserves around the world. Nature reserves are also natural buffers for climate change impacts and other disasters, which have an important value in responding to climate change adaptation and mitigation, and are known as effective solutions to the climate change crisis [45]. Niubeiliang National Nature Reserve is typical and representative of the Qinling Mountains; it is considered as the epitome of the Qinling Mountains [46]. Its ecological status is extremely important and it is the core area of the Qinling ecological space, but the ecological environment is extremely fragile. In addition, the geomorphic type of the Qinling Mountains is the most special in the Niubeiliang Reserve. Its terrain of “gentle in the northern slope and steep in the southern slope” forms a clear contrast with the “gentle in the southern slope and steep in the northern slope” in the central and western sections of the Qinling Mountains. Therefore, it is of great significance to study the effects of topographic and climatic factors on vegetation phenology in the Niubeiliang Nature Reserve. However, the current research on vegetation phenology in mountain nature reserves is relatively weak, and research on the vegetation phenology in the Niubeiliang reserve has not been reported in detail. Therefore, MODIS EVI2 time-series images from 2000 to 2017 were reconstructed by the double logistic curve fitting algorithm to extract the phenological parameters, and combined with the spatial temperature data interpolated by ANUSPLIN; we studied the temporal and spatial change laws of the vegetation phenology in the Niubeiliang Nature Reserve over the past 18 years, and explored the effects of topographic differentiation and climate change on the vegetation phenology. The purpose of this study was to reveal the laws of vegetation phenology change and its influence in mountain nature reserves in the context of climate change, to provide decision support for the adaptive management and protection of the vegetation ecosystems in mountain nature reserves against climate change, and also to provide a scientific reference for improving the carbon sink function of forests in mountain nature reserves.
2. Materials and Methods
2.1. Study Area
The Niubeiliang National Nature Reserve is an important part of the “Qinling nature reserve group” and is known as “the epitome of the Qinling Mountains”. It was identified as 1 of the 40 top-priority biodiversity conservation areas in the “China biological diversity protection action plan”, and is also listed as an A-level protected area with global significance, mainly to protect the national I-level protected animal takin and its habitat.
Its geographical range is 33°44′–33°47′ N and 108°45′–109°03′ E, which spans the north–south slope and the main ridge of the Qinling Mountains, with a long narrow distribution in the east–west orientation, about 28 km long from east to west and 15 km wide from north to south, with a total area of 164.18 km2. The Niubeiliang is the main peak with an altitude of 2802 m, which is the highest peak in the eastern Qinling Mountains. The reserve is located in the relatively intact natural forest region in the eastern Qinling Mountains, and the forest coverage rate is more than 96% [47]; it is known as the “green pearl”. The reserve belongs to the mountain forest system of a coniferous and broad-leaved mixed type in the warm temperate zone, showing obvious vertical structure characteristics. From the bottom to the top of the reserve, there are the mixed coniferous and broad-leaved forest zone with the deciduous broad-leaved forest and the pine-oak forest, the mixed coniferous and broad-leaved forest zone with the mid-alpine pine-birch forest, and the subalpine coniferous forest zone. The vertical vegetation zones of the reserve are obviously different between the northern and the southern slope, there is the Quercus acuteserrata forest on the bottom of the northern slope, while there is the Quercus variabilis forest on the bottom of the southern slope. In addition, there is a Picea asperata forest in the northern slope but not in the southern slope. The geographical location of the reserve and the spatial distribution of the vertical vegetation zones are shown in Figure 1.
Figure 1.
Geographical location of the study area and spatial distribution of its vertical vegetation zone.
The reserve is located at the meeting place of the northern and southern climates in China. It belongs to the warm temperate semi-humid monsoon climate, which is cool and humid in the summer then cold and dry in the winter. The annual average temperature is 2–10 °C, the annual precipitation is 850–950 mm, and the frost-free period is approximately 130 days. It has the characteristics of a mountain climate with obvious vertical differences. From the top to the bottom of the reserve, there are five different climatic zones including the alpine frigid zone, cold temperate zone, temperate zone, warm temperate zone, and north subtropical zone.
2.2. Data Source and Preprocessing
2.2.1. Data Sources
The phenological data derived from the established vegetation remote-sensing phenology dataset of the Qinling Mountains [37] and the vegetation phenology data of the research area from 2000 to 2017 were extracted according to the boundary range of the Niubeiliang Nature Reserve. The data were derived from the MOD09Q1 surface reflectance dataset in the MODIS data products provided by the NASA (https://ladsweb.nascom.nasa.gov) (accessed on 1 November 2018), which retrieved the MODIS EVI2 vegetation index from 2000 to 2017 as a data source for monitoring remote-sensing phenological changes, with a temporal resolution of 8 days and a spatial resolution of 250 m × 250 m.
The meteorological data were derived from the established temperature raster dataset of the Qinling Mountains [48]. The data were obtained by the spatial interpolation of the monthly temperature data of 32 meteorological stations in the Qinling area from 2000 to 2017. The data came from the Shaanxi Provincial Meteorological Information Center.
The DEM data came from the Shaanxi Provincial Bureau of Surveying and Mapping Geographic Information, with a resolution of 25 m × 25 m.
2.2.2. Data Processing
- (1)
- Pre-Processing of Remote-Sensing Data
Firstly, the maximum value composite (MVC) method was used to process the data, and the enhanced vegetation index 2 (EVI2) in the region was calculated by the band calculation tool of the ENVI software. The formula is detailed in [37]. Secondly, the harmonic analysis of time series (HANTS) method was used to further denoise and smooth the filtering of the EVI2 time-series data to remove residual clouds and long-time hazes or other negative effects in the sub-pixels. Then, the three parameters of the GSS, GSE (growing season end), and GSL were used as the identification indexes of the vegetation phenology in the study area, and the day of year (DOY), which is the actual number of days since 1 January of the same year, was used to represent the time when the phenophase appeared. The parameters GSS and GSE for the identification of plant phenophase were both determined according to their multi-year time evolution laws, and were extracted by a combination of the threshold method and the maximum ratio method in the software TIMESAT. Afterwards, a 1% confidence interval was set to eliminate outliers of the GSS and GSE. Finally, the annual GSL was calculated (the difference between GSS minus GSE). The detailed mechanism of data processing can be found in [37].
- (2)
- Processing of Topographic Data
In order to perform overlay analysis with the vegetation phenology data, the DEM data were resampled to 250 m × 250 m, and the slope and aspect of the study area were extracted from the DEM using ArcGIS software. According to the gradient classification standard in the “Main Technical Provisions of Forest Resources Planning and Design Survey”, the slope was divided into the flat slope (below < 5°), gentle slope (5°–15°), sloping slope (15°–25°), steep slope (25°–35°), and sharp slope (>35°); the aspect was divided into the zero slope (0°), shady slope (0°–45° and 315°–360°), semi-shade slope (45°–135°), sunny slope (135°–225°), and semi-sunny slope (225°–315°). The grades of the slope and aspect in the study area are shown in Figure 2.
Figure 2.
Spatial distribution of the slope and aspect classification in the study area. (a) Slope; (b) aspect.
- (3)
- Processing of Temperature Data
The spatial interpolation of temperature data adopted the latest international professional meteorological data interpolation software ANUSPLIN. Some scholars have found through comparison that the ANUSPLIN is more suitable for the spatial interpolation of climatic elements in complex mountain environments [49]. At the same time, the DEM was used as a covariate in the interpolation process, so the raster data of the monthly average temperature with topographic features in the Qinling Mountains in the past 18 years (spatial resolution 250 m × 250 m, projection WGS–1984–UTM–Zone–48) were obtained.
2.3. Research Methods
2.3.1. Spatial Unary Linear Regression Trend Analysis and Its Significance Test
This method used the least squares method to fit the slope of the vegetation phenology parameters, which can simulate the change trends of the vegetation phenology parameters in each grid, and comprehensively reflect the evolution process of the temporal and spatial pattern of the vegetation phenology in the region. The calculation formula is:
In the formula: the slope represents the inter-annual change rate, n is the annual sequence, and xi represents the vegetation phenology parameters of the ith year. When the slope > 0, it indicates that x is advancing or shortening, and when the slope < 0, it indicates that x is delaying or prolonging. The t-test is used to reflect the significance of the change trend, and the results are divided into extremely significant changes (p ≤ 0.01), significant changes (0.01 < p ≤ 0.05), weakly significant changes (0.05 < p ≤ 0.1), and insignificant changes (p > 0.1).
2.3.2. Spatial Correlation Analysis and Its Significance Test
In order to investigate the effect of temperature on vegetation phenology, the Pearson correlation coefficient at the pixel scale was used to calculate the correlation between the GSS and the monthly average temperature of the same period (April, April and May, May) and previous period (January, January and February, February, February and March, March, March and April), as well as the correlation between the GSE and the monthly average temperature of the same period (September, September and October, October) and previous period (June, June and July, July, July and August, August, August and September), which analyzed the spatial correlation between the vegetation phenophase and the temperature. At the same time, the significance of the correlation coefficient was tested, and the results were divided into highly significant correlations (p ≤ 0.01), significant correlations (0.01 < p ≤ 0.05), weakly significant correlations (0.05 < p ≤ 0.1) and insignificant correlations (p > 0.1).
3. Results
3.1. Temporal and Spatial Variation Characteristics of Vegetation Phenology
3.1.1. Spatial Distribution of Vegetation Phenology
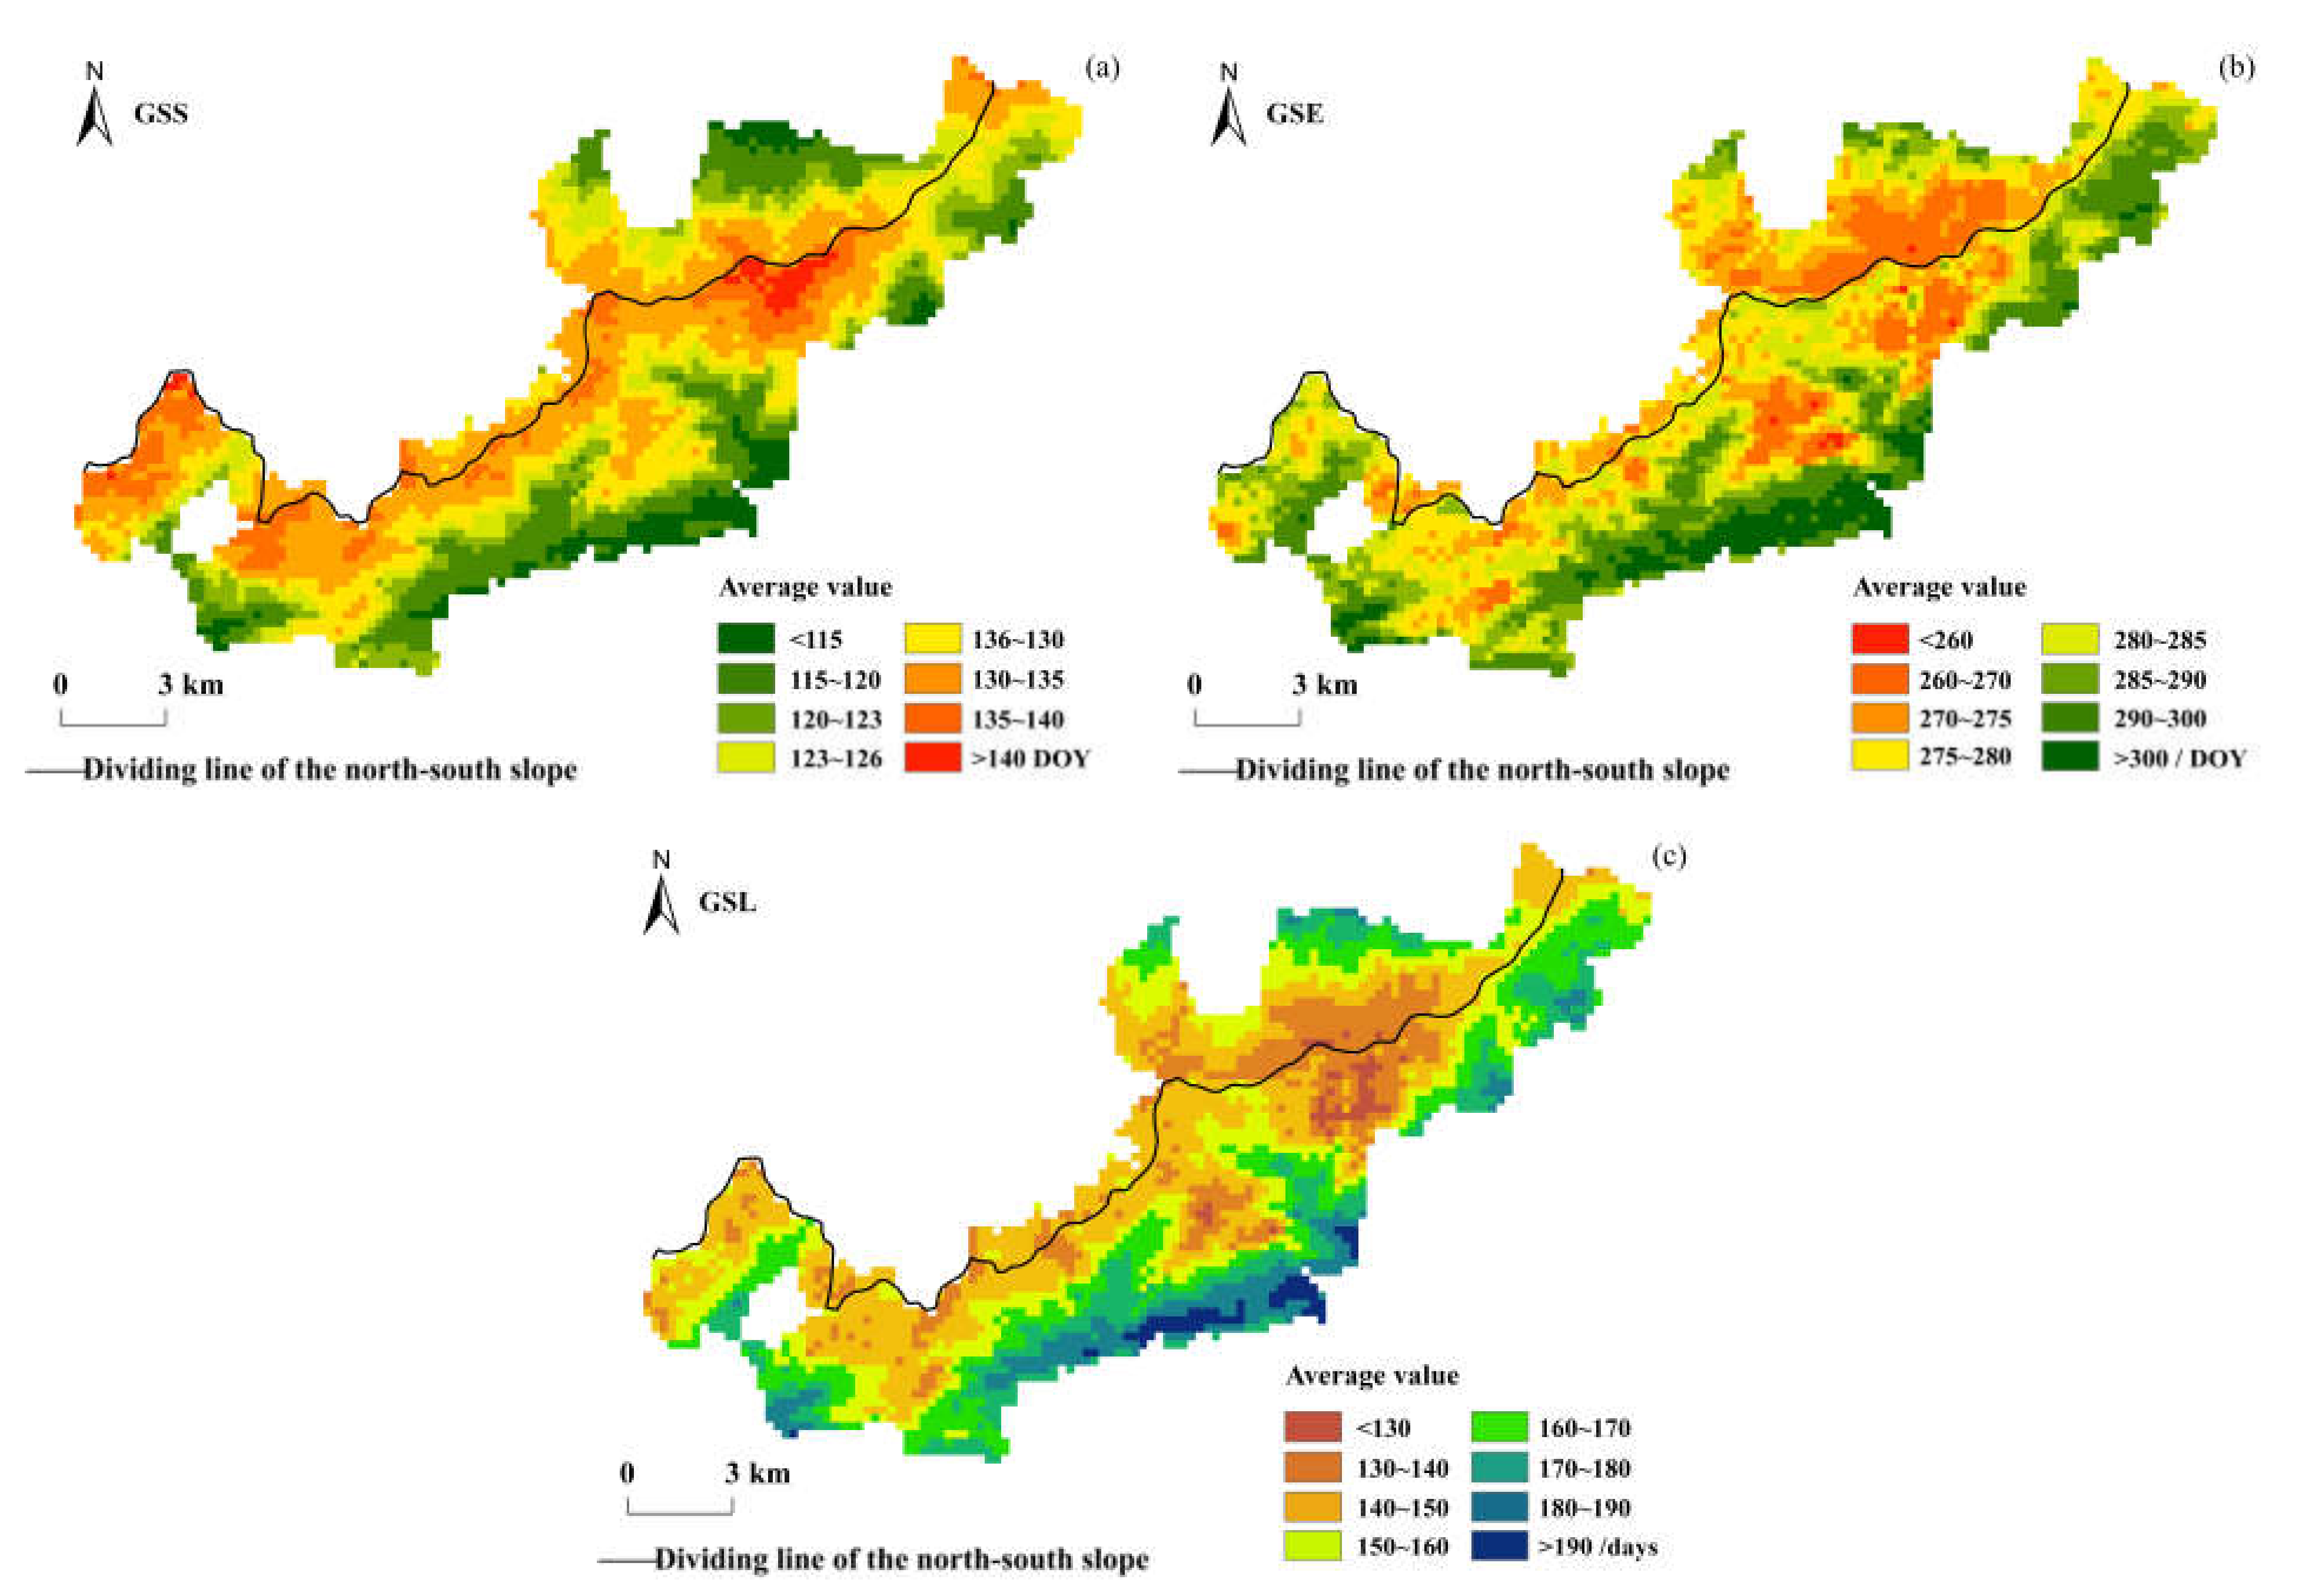
Figure 3 shows the spatial distribution of the multi-year mean values of the vegetation phenology parameters in the Niubeiliang reserve from 2000 to 2017. It can be seen from Figure 3 that the vegetation phenology changes in the reserve exhibited obvious topographic differentiation in the past 18 years, especially in the GSS. The GSS in the reserve mainly occurred at 115–140 DOY (92.68%), that is, from late April to mid-May, with an average of 126.54 DOY. The GSSs in the northern and southern slopes were not much different, with an average of 126.77 DOY in the northern slope and 126.46 DOY in the southern slope. Spatially, the GSS was earlier in the low-altitude regions in the northern and southern slopes, while it was relatively later in the high-altitude regions on both sides of the ridge. The GSE in the reserve mainly occurred at 260–300 DOY (93.65%), that is, from late September to late October, with an average of 282.18 DOY. The average GSE was 275.44 DOY in the northern slope and 284.48 DOY in the southern slope, and the GSE in the southern slope was approximately 9.04 days later than that in the northern slope. Spatially, the GSE ended earlier in the northern slope, especially in the high-altitude areas in the east of the ridge, while it was relatively later in the low-altitude areas in the southern slope. The GSL in the reserve was mainly concentrated in 130–190 days (96.64%), that is, approximately 4–6 months, with an average of 155.64 days. The average GSL was 148.66 days in the northern slope and 158.03 days in the southern slope, and the GSL in the southern slope was approximately 9.36 days longer than that in the northern slope.

Figure 3.
Spatial distribution of the multi-year average of vegetation phenological parameters in Niubeiliang Nature Reserve from 2000 to 2017. (a) GSS; (b) GSE; (c) GSL.
3.1.2. Inter-Annual Variability of Vegetation Phenology
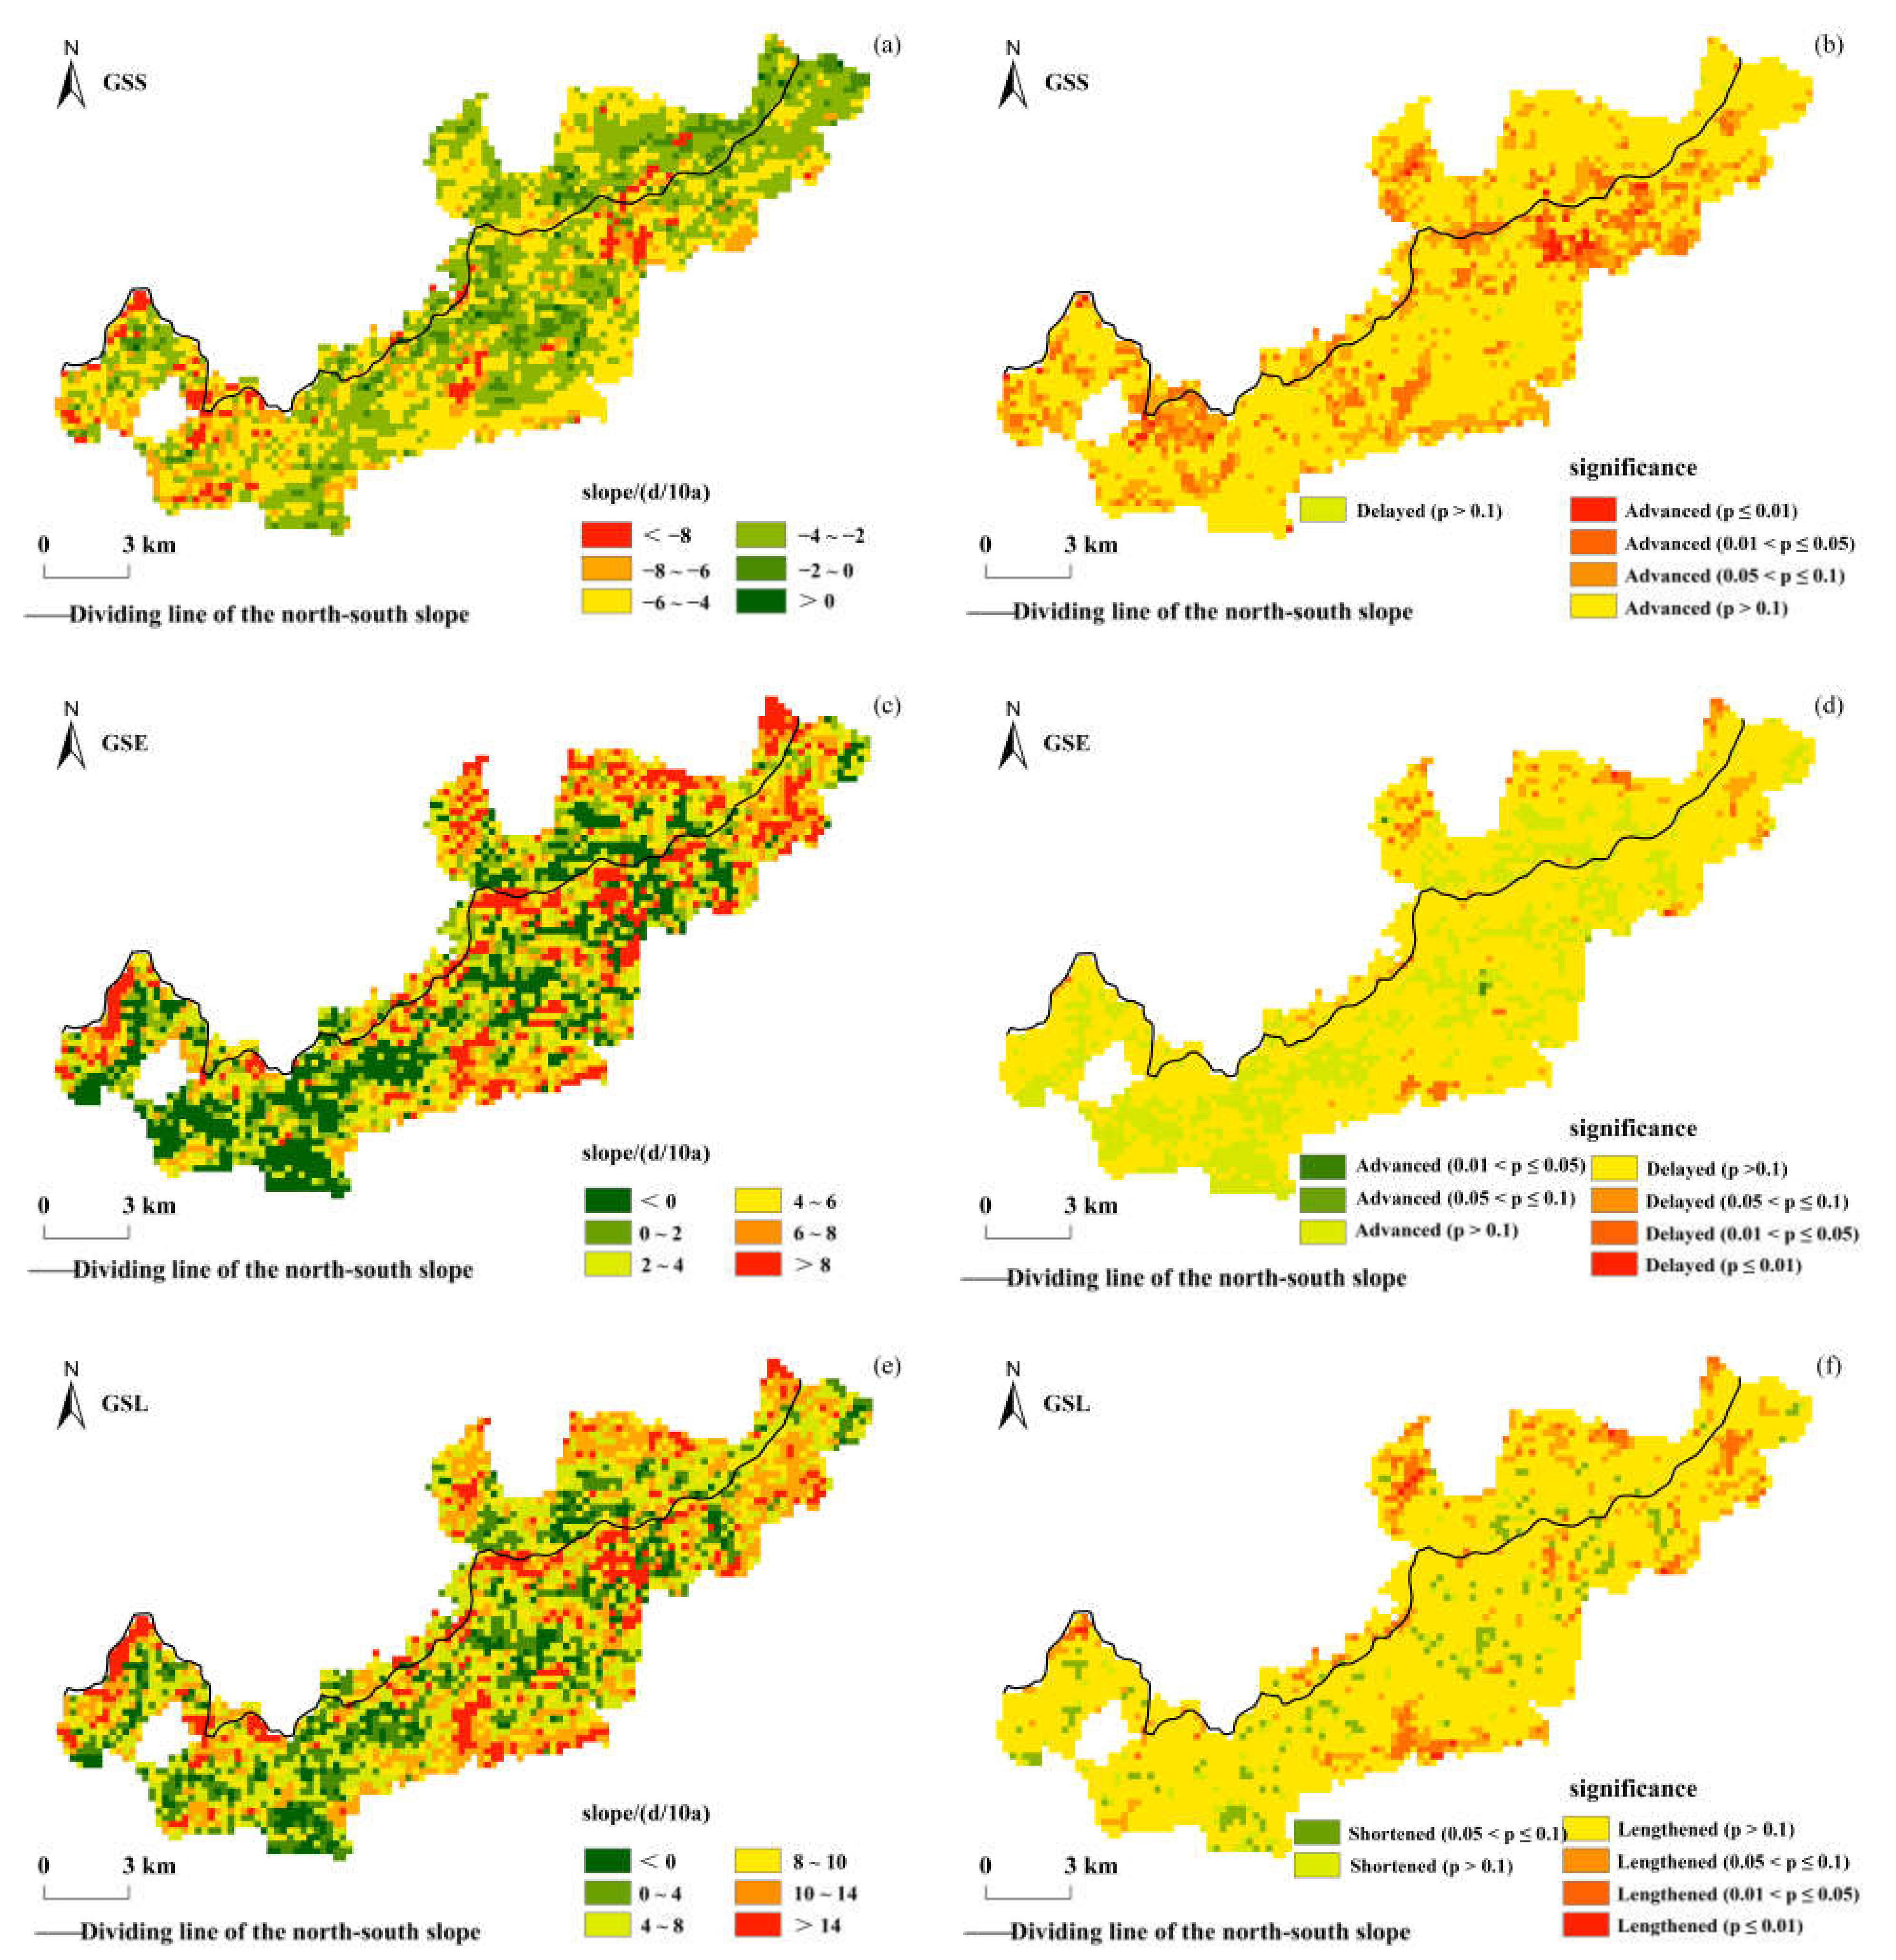
Figure 4 shows the interannual change trends of the vegetation phenological parameters and their significances in the Niubeiliang Nature Reserve from 2000 to 2017. It can be seen from Figure 4 that there were obvious spatial differences in the interannual changes of the vegetation phenology in the reserve in the past 18 years. The GSS was dominated by an advancing trend, and 99.53% of the whole area showed an advanced trend. The average rate in the whole area was −4.24 days/10a, which was mainly 2–4 days/10a in advance (39.77%), followed by 4–6 days/10a (36.82%), while 6–8 days/10a was relatively less common (9.93%). The change rates in the northern and southern slopes were relatively consistent, with an average of −4.41 days/10a in the northern slope and −4.40 days/10a in the southern slope. The t-test results showed that only 11.53% of the whole area displayed a significant advancing trend (p ≤ 0.05, the same below) in the GSS, and these areas were mainly located in the high-altitude areas of the reserve. The areas where the advance trend reached a significant level were 8.02% and 12.74% in the northern and southern slopes, respectively.
Figure 4.
Spatial distribution of interannual change trends of the vegetation phenological parameters in Niubeiliang Reserve from 2000 to 2017 and their significances. (a) Slope of the GSS; (b) significance of the GSS; (c) slope of the GSE; (d) significance of the GSE; (e) slope of the GSL; (f) significance of the GSL.
The GSE was mainly delayed, and 75.62% of the whole area showed a delayed trend. The average rate in the whole area was 3.29 days/10a, which was mainly delayed by 4–6 days/10a (16.46%), followed by 2–4 days/10a (16.31%), 6–8 days/10a (15.24%), and then >8 days/10a (15.05%). This showed that the distribution of the change rate at all levels was relatively balanced, and the differences in regional proportion were small. The change rate in the northern slope was faster than that in the southern slope, with an average of 4.12 days/10a in the northern slope and 3.01 days/10a in the southern slope. The t-test results showed that only 1.63% of the whole area displayed a significant delay trend in the GSE, and these areas were mainly located in the low-altitude areas of the northern slope. The areas where the delay trend reached a significant level were 3.58% and 0.97% in the northern and southern slopes, respectively.
The GSL was mainly prolonged, and 91.64% of the whole area showed a prolonged trend. The average rate in the whole area was 7.54 days/10a, which was mainly prolonged by 4–8 days/10a (26.70%), followed by 10–14 days/10a (22.97%), while 0–4 days/10a was relatively less common (16.93%). The change rates were not much different between the northern and southern slopes, with an average of 7.91 days/10a in the northern slope and 7.42 days/10a in the southern slope. The results of the t-test showed that only 4.78% of the whole area displayed a significant prolonged trend in the GSL, which were 8.15% and 3.62% in the northern and southern slopes, respectively.
3.2. Effect of Topography on Vegetation Phenology
3.2.1. Effects of Altitude
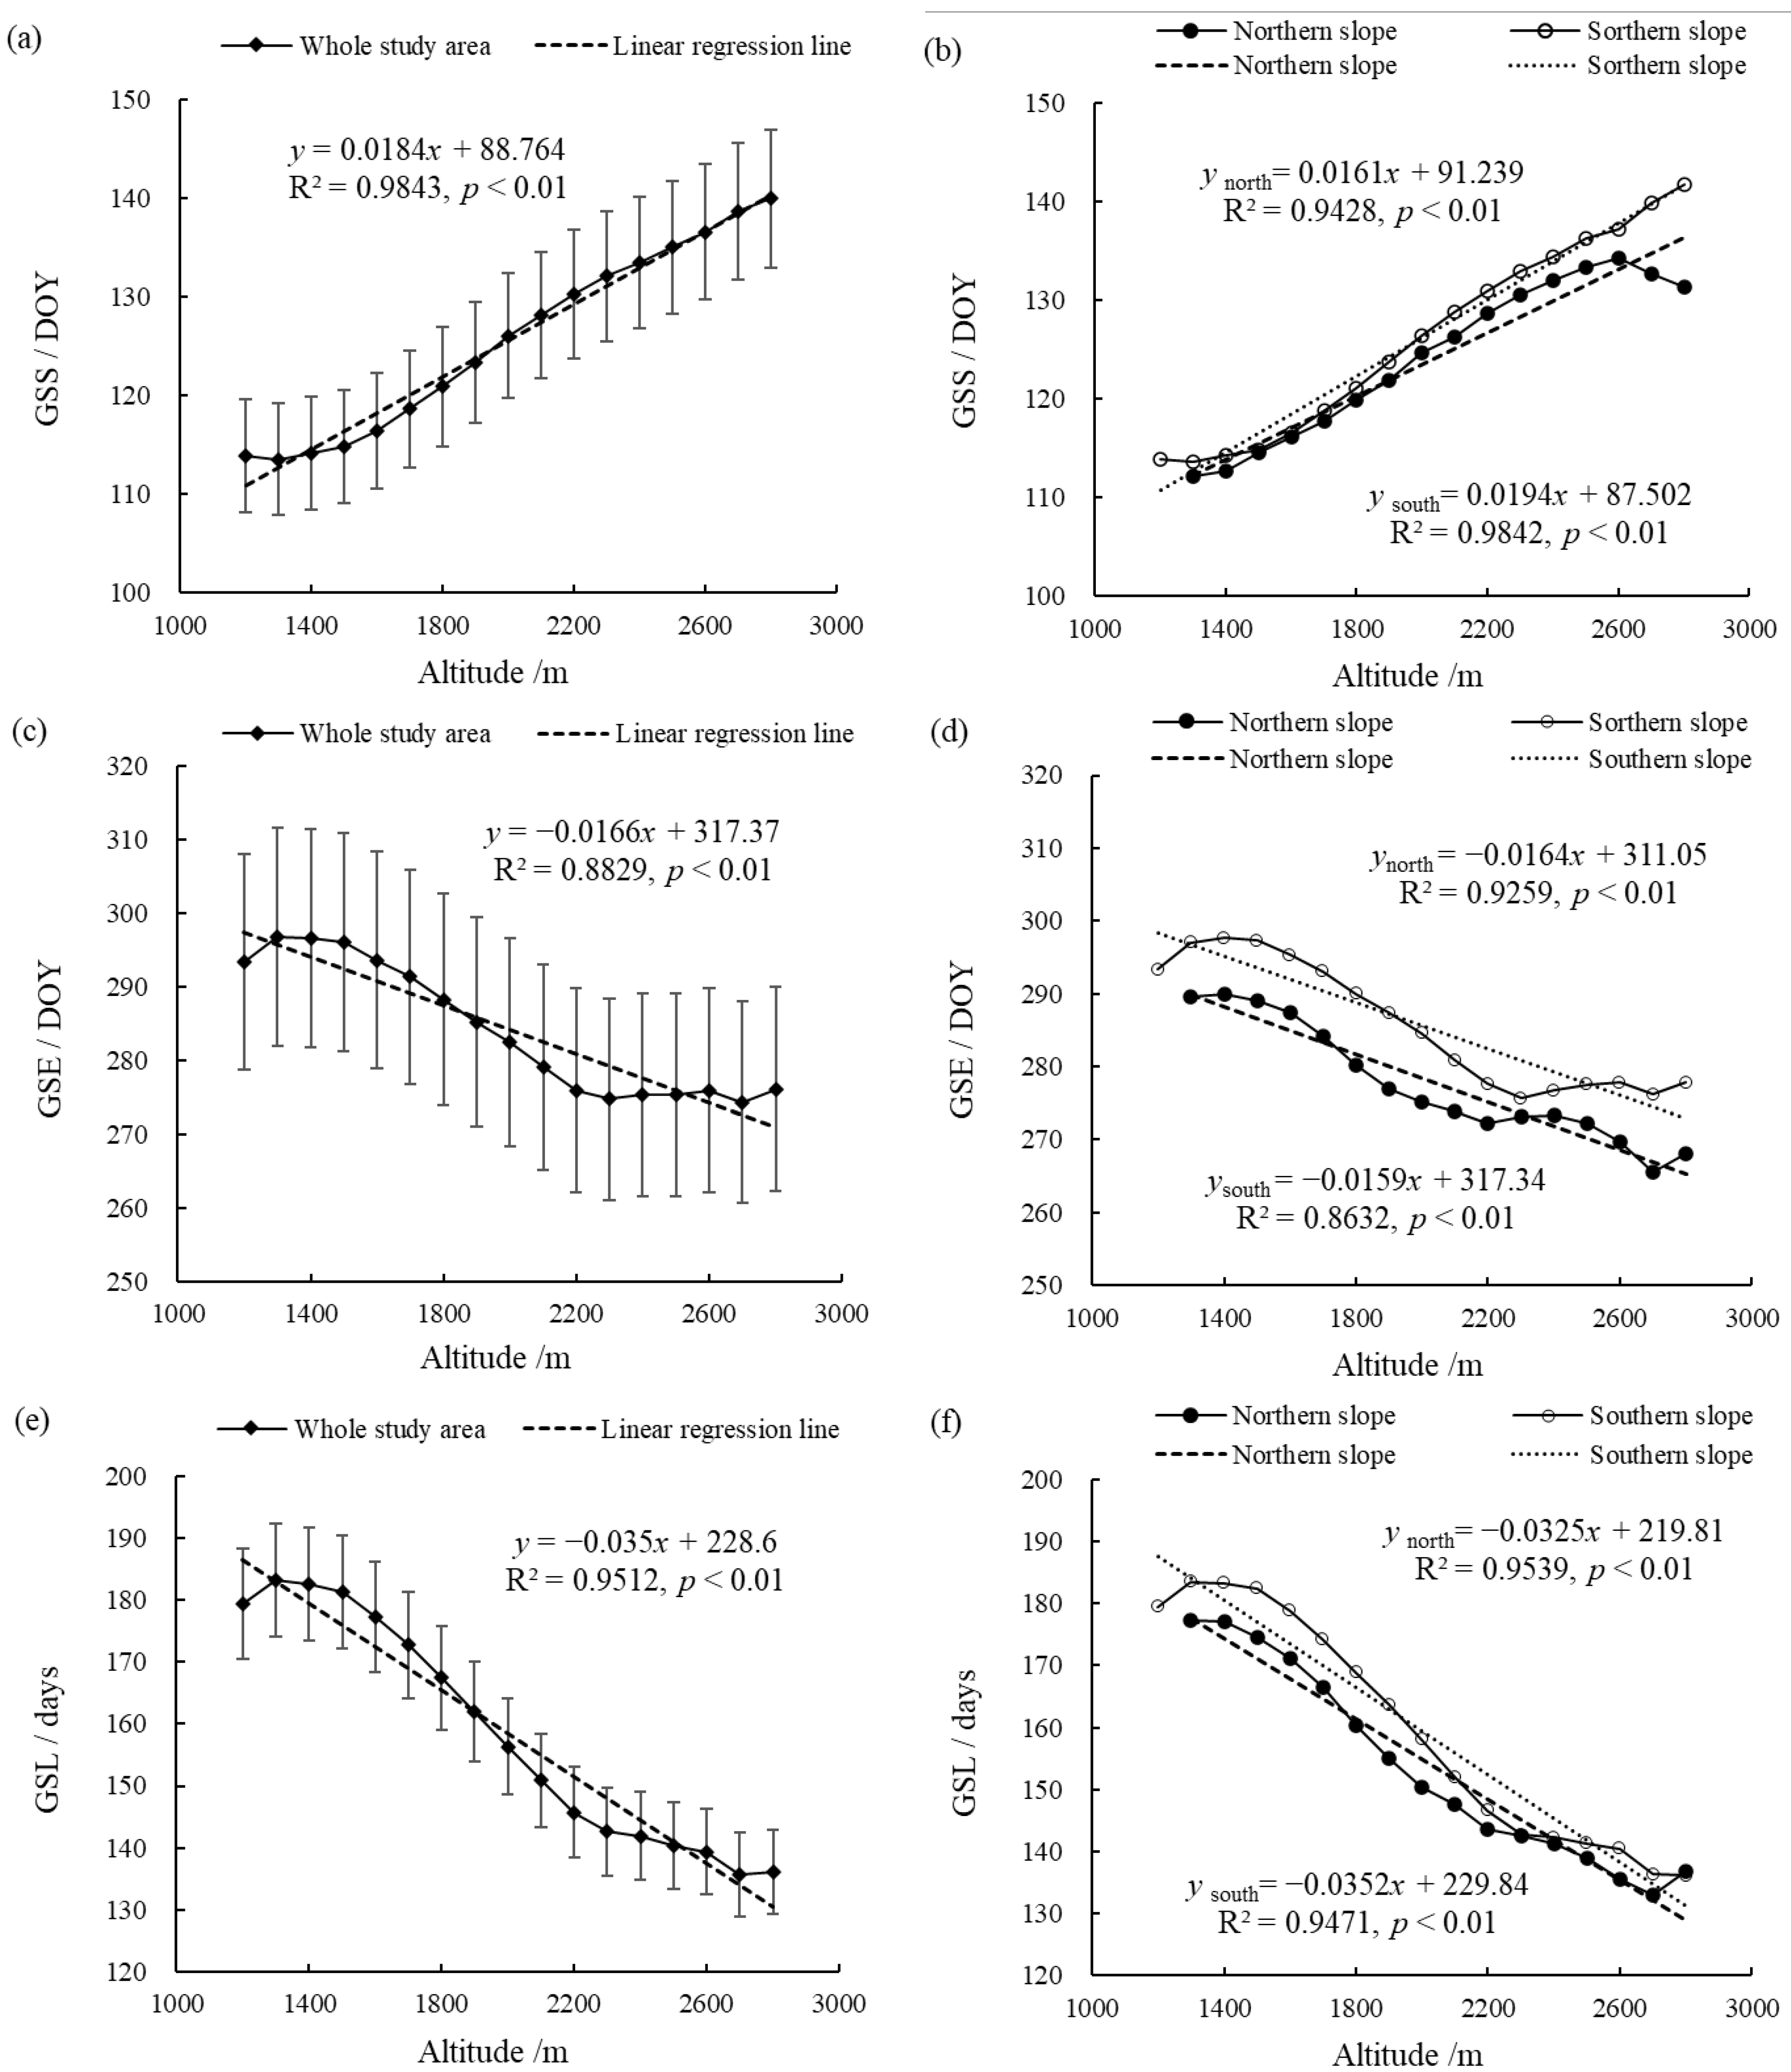
Figure 5 shows the changes of the vegetation phenology parameters at different altitudes in the entire Niubeiliang Nature Reserve and its northern and southern slopes from 2000 to 2017. It can be seen from Figure 5 that the vegetation phenological changes in the Niubeiliang Reserve had a significant altitude sensitivity. With the increase in altitude, the GSS in the whole area showed a significant delay trend, with a rate of 1.84 days/100 m, and the delay rate in the southern slope was faster than that of the northern slope. The difference in the GSS between the northern and southern slopes gradually increased with the increase in altitude, and the difference was the largest in the summit area, approximately 8.51 days. The GSE presented a significant advance trend, with a rate of 1.66 days/100 m, and the change rates in the southern slope and the northern slope were not much different. At the same altitude, the GSE was later in the southern slope than the northern slope, and the difference between the southern slope and the northern slope was the largest at 2700 m, approximately 10.55 days. It can be seen that the north–south difference in the GSE with the change in altitude was more obvious than that of the GSS. The GSL exhibited a significant shortening trend, with a rate of 3.50 days/100 m, and the change rates in the northern slope and the southern slope were also not much different. The difference in the GSL between the northern and southern slopes gradually narrowed with the increase in altitude, and the difference was the smallest in the area of ≥2300 m.
Figure 5.
Changes of vegetation phenological parameters at the different altitudes in Niubeiliang Reserve from 2000 to 2017. (a) GSS of the whole area with the altitude; (b) GSS of the northern and southern slopes with the altitude; (c) GSE of the whole area with the altitude; (d) GSE of the northern and southern slopes with the altitude; (e) GSL of the whole area with the altitude; (f) GSL of the northern and southern slopes with the altitude.
Based on the distribution of the vertical vegetation zones in the Niubeiliang Reserve [47], the multi-year mean changes of the phenological parameters in the vegetation zones in the northern and southern slopes from 2000 to 2017 were analyzed, as shown in Table 1. The GSS in the northern slope was the earliest in the Quercus acuteserrata forest zone and the latest in the Abies fargesii forest zone, with a difference of approximately 15.37 days, while in the southern slope, it was the earliest in the Quercus variabilis forest zone and the latest in the Abies fargesii forest zone, with a difference of approximately 26.25 days. In the same type of vegetation zone, the GSS occurred earlier in the northern slope than in the southern slope, with a difference of approximately 8.55 days for the Birch forest zone, approximately 7.47 days for the Abies fargesii forest zone, and approximately 4.54 days for the Quercus acuteserrata forest zone.

Table 1.
Multi-year mean of vegetation phenological parameters on the different vegetation vertical zones in Niubeiliang Reserve from 2000 to 2017.
The GSE in the northern slope was the latest in the Quercus acuteserrata forest zone and the earliest in the Abies fargesii forest zone, with a difference of approximately 12.13 days, while in the southern slope, it was the latest in the Quercus variabilis forest zone and the earliest in the Abies fargesii forest zone, with a difference of approximately 20.53 days. In the same type of vegetation zone, the GSE occurred later in the southern slope than in the northern slope, with a difference of approximately 4.76 days for the Quercus acuteserrata forest zone, approximately 4.16 days for the Abies fargesii forest zone, and approximately 2.22 days for the Birch forest zone.
The GSL in the northern slope was the longest in the Quercus acuteserrata forest zone and the shortest in the Abies fargesii forest zone, with a difference of approximately 27.55 days, while in the southern slope, it was the longest in the Quercus variabilis forest zone and the shortest in the Abies fargesii forest zone, with a difference of approximately 46.72 days. In the same type of vegetation zone, except that the GSL of the Quercus acuteserrata zone was basically the same in the northern and southern slopes, the other vegetation zones were longer in the northern slope than in the southern slope. The difference was approximately 6.33 days in the Birch forest zone and 3.26 days in the Abies fargesii forest zone.
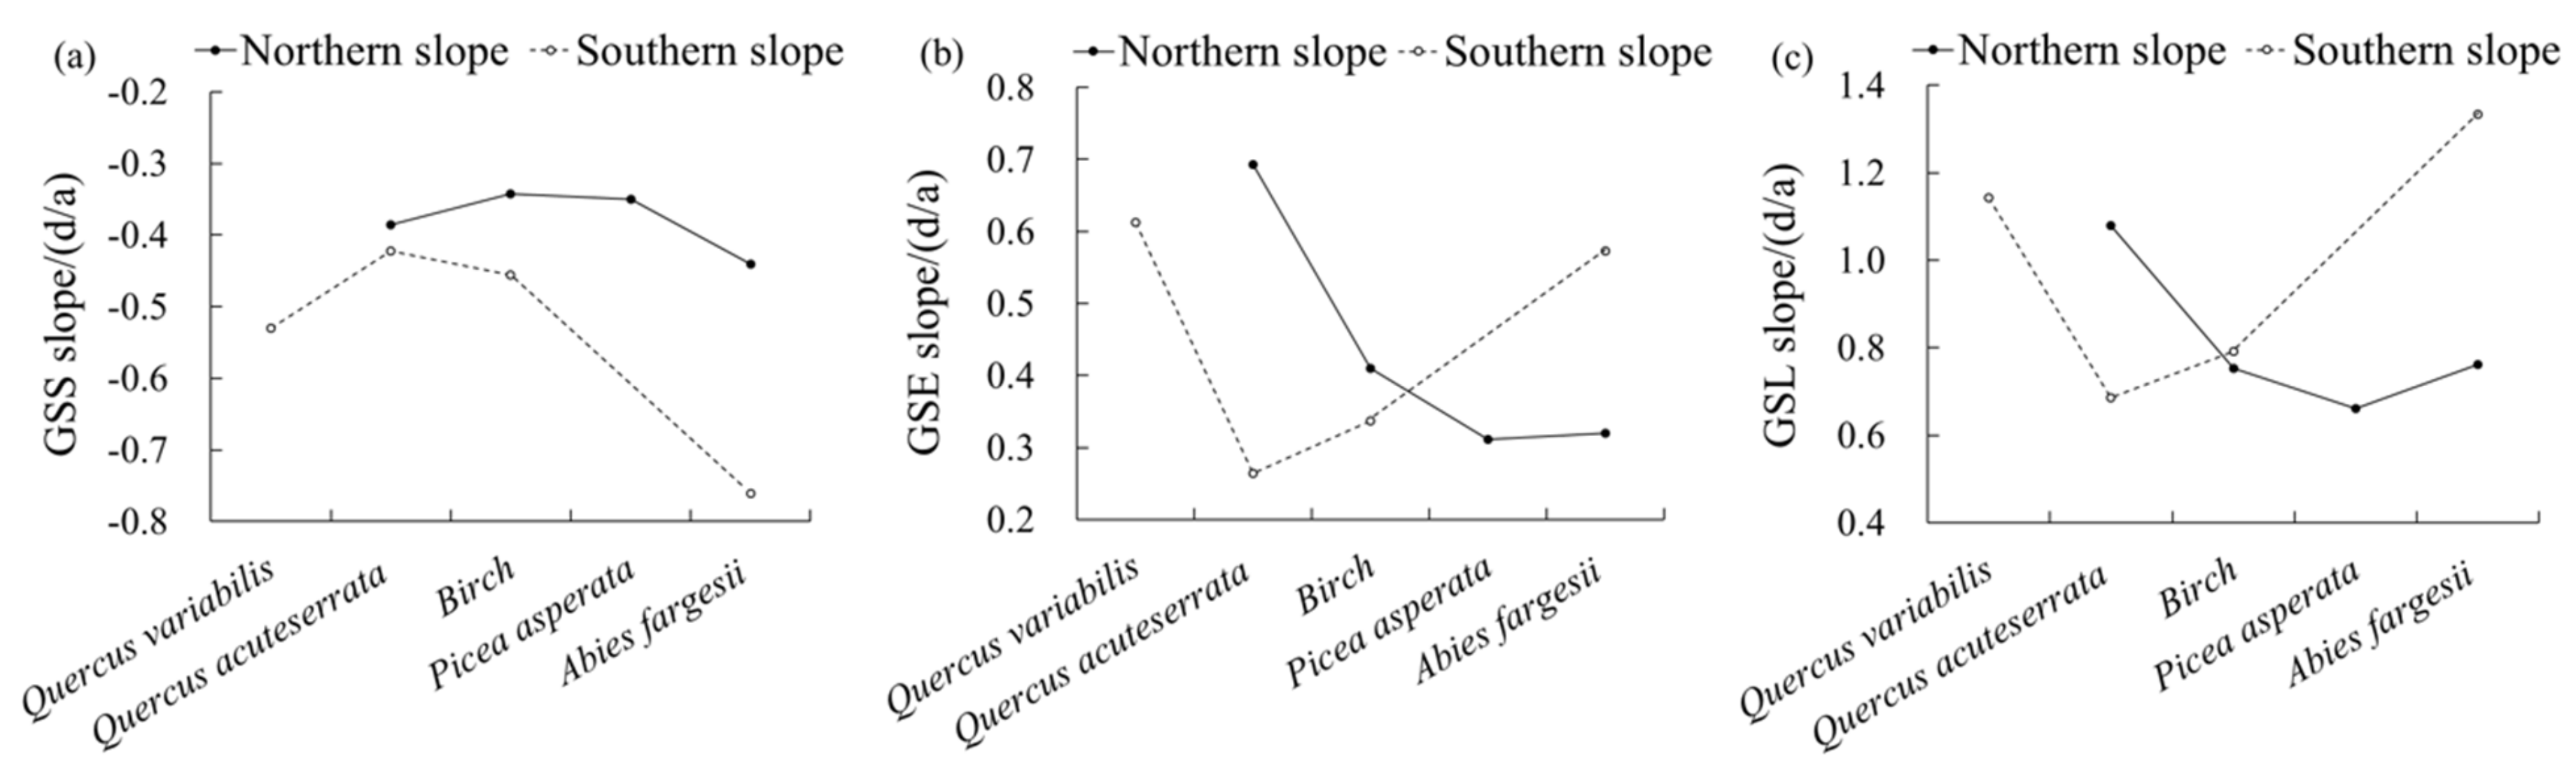
Figure 6 shows the change trends of the phenology in the vertical vegetation zones in the Niubeiliang Reserve from 2000 to 2017. It can be seen from Figure 6 that the advance rate of the GSS in the vertical vegetation zone was relatively the largest in the Abies fargesii forest zone in the northern slope, and it was relatively small and not much different in other zones. In the southern slope, all vegetation zones except the Quercus variabilis forest zone tended to increase with the increase in altitude. For the same type of the vertical vegetation zone, the advance rate of the GSS was faster in the southern slope than in the northern slope, and the difference between the northern and the southern slopes gradually increased with the increase in altitude. Among them, the change rate of the Abies fargesii forest zone was the largest difference between the northern and the southern slopes (3.20 days/10a). In the whole area, the advance rate of the GSS was the largest in the Abies fargesii forest zone in the southern slope, followed by Quercus variabilis forest zone in the southern slope.
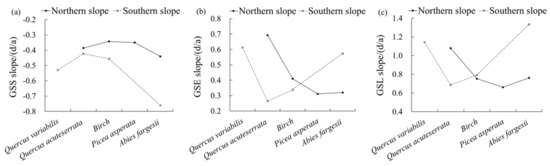
Figure 6.
Change trends of vegetation phenological parameters on the different vegetation vertical zones in Niubeiliang Reserve from 2000 to 2017. (a) GSS slope of vegetation vertical zones; (b) GSE slope of vegetation vertical zones; (c) GSL slope of vegetation vertical zones.
The delay rate of the GSE in the vertical vegetation zone showed a decreasing trend with the increase in altitude in the northern slope, and the rates in the Picea asperata forest zone and the Abies fargesii forest zone in the high-altitude area were the smallest and showed little difference. In the southern slope, all vegetation zones except the Quercus variabilis forest zone showed an increasing trend with the increase in altitude. For the same type of the vertical vegetation zone, the delay rates of the GSE in the Quercus acuteserrata forest zone and the Birch forest zone were faster in the northern slope than in the southern slope, while that in the Abies fargesii forest zone was faster in the southern slope than in the northern slope. Among them, the change rate of the Quercus acuteserrata forest zone was the largest difference between the northern and the southern slopes (4.29 days/10a), followed by the Quercus variabilis forest (2.52 days/10a). In the whole area, the delay rate of the GSE was the largest in the Quercus acuteserrata forest zone in the northern slope, followed by the Quercus variabilis forest zone in the southern slope.
The prolongation rate of the GSL in the vertical vegetation zone also presented a decreasing trend with the increase in altitude in the northern slope, and the rate of the Abies fargesii forest zone was second only to that of the Quercus acuteserrata forest zone. In the southern slope, all vegetation zones except the Quercus variabilis forest zone showed an increasing trend with the increase in altitude. For the same type of the vertical vegetation zone, the prolongation rate of the GSL in the Quercus acuteserrata forest zone was faster in the northern slope than in the southern slope, while that in the Birch forest zone and in the Abies fargesii forest zone were faster in the southern slope than in the northern slope. Among them, the change rate of the Abies fargesii forest zone was the largest difference between the northern and the southern slopes (5.73 days/10a), followed by the Quercus variabilis forest zone (2.52 days/10a). In the whole area, the prolongation rate of the GSL was the largest in the Abies fargesii forest zone in the southern slope, followed by the Quercus variabilis forest zone in the southern slope.
3.2.2. Effects of Slope
Figure 7 shows the changes of the vegetation phenological parameters on the different slopes in the entire Niubeiliang Reserve and its northern and southern slopes from 2000 to 2017. It can be seen from Figure 7a,b that the GSS displayed a significantly delayed trend with the increase in the slope, which was the earliest on the flat slope and the latest on the sharp slope, with a difference of approximately 3.19 days. In the northern slope, the GSS change fluctuated greatly with the increase in the slope, and the delay trend was not significant. The various slopes were in the order of the flat slope < steep slope < sloping slope < sharp slope < gentle slope; that is, the GSS was the earliest on the flat slope and the latest on the gentle slope, with a difference of approximately 7.09 days. In the southern slope, the GSS gradually delayed with the increase in the slope, showing a significant delaying trend. The various slopes were in the order of the flat slope < gentle slope < sloping slope < steep slope < sharp slope; that is, the GSS was the earliest on the flat slope and the latest on the sharp slope, with a difference of approximately 2.53 days. For the same type of slope, the GSSs on the flat slope and the steep slope were earlier in the northern slope than the southern slope, while the GSSs on the other slopes were earlier in the southern slope than the northern slope, but the difference between the northern and the southern was not large. The difference was the largest on the flat slope, but it was only approximately 2.83 days.
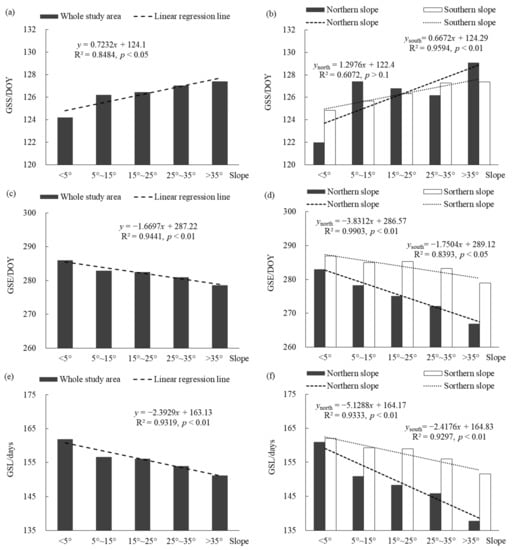
Figure 7.
Changes of vegetation phenological parameters on the different slopes in Niubeiliang Reserve from 2000 to 2017. The horizontal coordinate was specifically the flat slope (below < 5°), gentle slope (5°–15°), sloping slope (15°–25°), steep slope (25°–35°), and sharp slope (>35°). (a) GSS of the whole area with the slope; (b) GSS of the northern and southern slopes with the slope; (c) GSE of the whole area with the slope; (d) GSE of the northern and southern slopes with the slope; (e) GSL of the whole area with the slope; (f) GSL of the northern and southern slopes with the slope.
It can be seen from Figure 7c,d that the GSE displayed an extremely significant advance trend with the increase in the slope, which was the latest on the flat slope and the earliest on the sharp slope, with a difference of approximately 7.42 days. In the northern and southern slopes, the GSE showed a significant advance trend with the increase in the slope, and it was more significant in the northern slope than the southern slope. The various slopes were in the order of the flat slope > gentle slope > sloping slope > steep slope > sharp slope; that is, the GSE was the latest on the flat slope and the earliest on the sharp slope. The difference between the two was approximately 16.07 days in the northern slope, and approximately 7.90 days in the southern slope. For the same type of slope, the GSEs on the various slopes were all later in the southern slope than in the northern slope, and the difference between the northern and the southern slopes increased with the increase in the slope. The difference between the sharp slopes was the largest, approximately 12.05 days.
It can be seen from Figure 7e,f that the GSL displayed an extremely significant shortening trend with the increase in the slope, which was the longest on the flat slope and the shortest on the sharp slope, with a difference of approximately 10.61 days. In the northern and southern slopes, the GSL showed a significant shortening trend with the increase in the slope, and it was more significant in the northern slope than the southern slope. The various slopes were in the order of the flat slope > gentle slope > sloping slope > steep slope > sharp slope; that is, the GSL was the longest on the flat slope and the shortest on the sharp slope. The difference between the two was approximately 23.16 days in the northern slope, and approximately 10.43 days in the southern slope. For the same type of slope, the GSLs on the various slopes were all longer in the southern slope than in the northern slope, and the difference between the northern and the southern slopes increased with the increase in the slope. The difference between the sharp slopes was the largest, approximately 13.78 days.
3.2.3. Effects of Aspect
Figure 8 shows the changes of the vegetation phenological parameters on different aspects in the entire Niubeiliang Reserve and its northern and southern slopes from 2000 to 2017. It can be seen from Figure 8a,b that the GSS was the earliest on the shady slope and the latest on the zero slope, with a difference of approximately 3.14 days. The various aspects in the northern slope were in the order of the zero slope < shady slope < semi-shady slope < semi-sunny < sunny slope; that is, the GSS was the earliest on the zero slope and the latest on the sunny slope, with a difference of approximately 5.06 days, while the various aspects in the southern slope were in the order of the shady slope < zero slope < semi-sunny slope < sunny slope < semi-shady slope; that is, the GSS was the earliest on the shady slope and the latest on the semi-shady slope, with a difference of approximately 5.38 days. It follows that the GSS in the northern slope was the earliest on the zero slope, while in the southern slope it was the earliest on the shady slope, which was attributed to the fact that the aspect not only caused the temperature difference between the different slopes, but also affected the difference in the water evaporation, revealing that water was also an important factor affecting the advancement of the beginning of the phenophase. For the same type of aspect, the GSS in the southern slope was later than the northern slope on all other aspects except the semi-shady slope, and the difference between the sunny slope was the largest at approximately 3.81 days, which indicated that the effect of the aspect on the GSS was relatively small, and there was little difference between the northern and southern slopes.
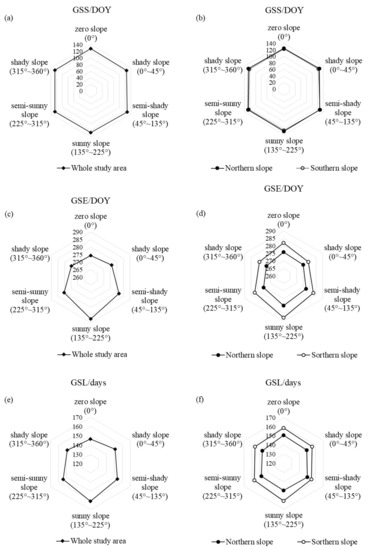
Figure 8.
Changes of vegetation phenological parameters on the different aspects in Niubeiliang Reserve from 2000 to 2017. (a) GSS of the whole area with the aspect; (b) GSS of the northern and southern slopes with the aspect; (c) GSE of the whole area with the aspect; (d) GSE of the northern and southern slopes with the aspect; (e) GSL of the whole area with the aspect; (f) GSL of the northern and southern slopes with the aspect.
It can be seen from Figure 8c,d that the GSE was the latest on the sunny slope and the earliest on the zero slope, with a difference of approximately 13.03 days. The various aspects in the northern and southern slopes were in the order of the sunny slope > semi-shady slope > zero slope > semi-sunny slope > shady slope; that is, the GSE was the latest on the sunny slope and the earliest on the shady slope, with a difference of approximately 6.57 days in the northern slope and 9.03 days in the southern slope. It follows that the GSE in both the northern and southern slopes was the latest on the sunny slopes, indicating that the sunny slope was beneficial to the delay of the ending of the phenophase, especially the sunny slope in the southern slope. For the same type of aspect, the GSEs on all aspects were later in the northern slope than the southern slope, the difference between the northern and southern slopes was relatively large at all levels except the shady slope (0–45°) (3.73 days), and the difference between the sunny slopes was relatively large, with a difference of approximately 7.89 days. The results revealed that the aspect had a great influence on the GSE, and there was a great difference between the northern and southern slopes.
It can be seen from Figure 8e,f that the GSL was the longest on the sunny slope and the shortest on the zero slope, with a difference of approximately 14.56 days. The various aspects in the northern slope were in the order of the zero slope > semi-shady slope > sunny slope > shady slope (0–45°) > semi-sunny slope > shady slope (135–225°); that is, the GSL was the longest on the zero slope and the shortest on the shady slope (135–225°), with a difference of approximately 3.47 days, while the various aspects in the southern slope were in the order of the sunny slope > zero slope > semi-sunny slope > shady slope > semi-shady slope; that is, the GSL was the longest on the sunny slope and the shortest on the semi-shady slope, with a difference of approximately 6.19 days. For the same type of aspect, the GSLs on all aspects were longer in the southern slope than the northern slope, and the difference between the sunny slopes was relatively large, with a difference of approximately 11.69 days.
3.3. Effect of Temperature on Vegetation Phenology
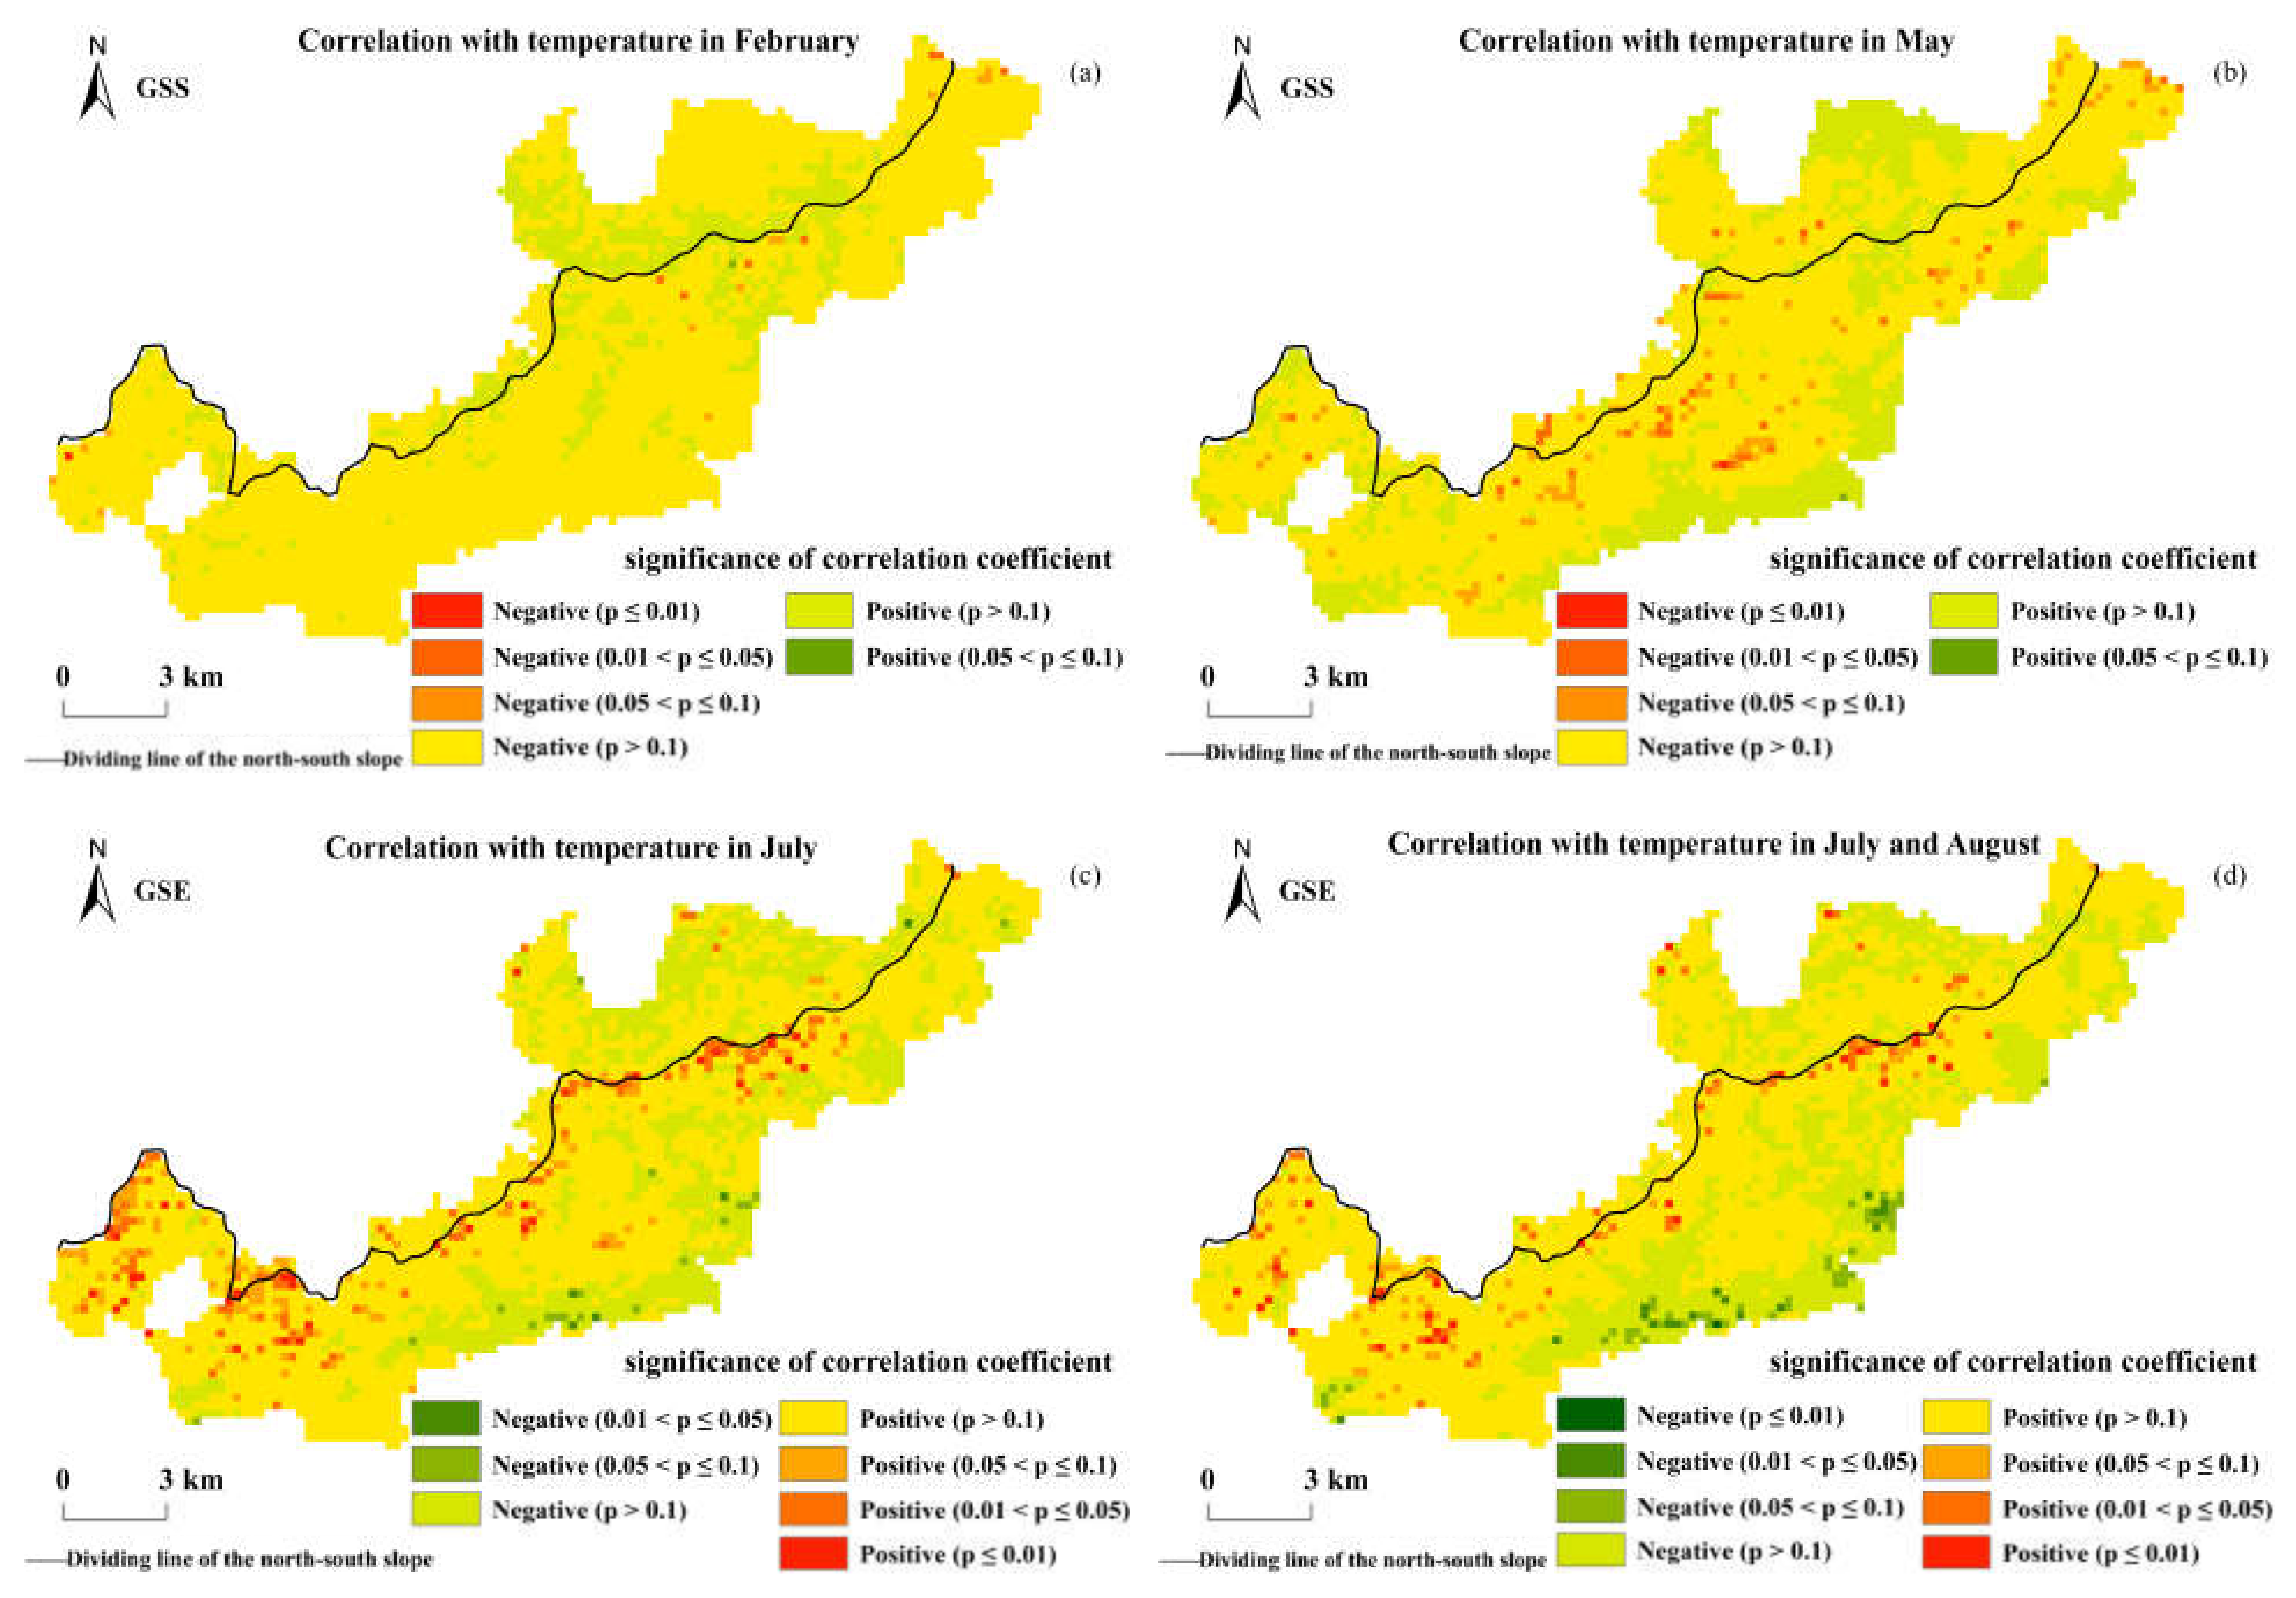
Figure 9 shows the correlation analysis results of the GSS, GSE, and the monthly average temperature in the Niubeiliang Reserve. It can be seen from Figure 9 that the correlation coefficients between the GSS and the temperature were mainly negative, that is, as the temperature rose, the beginning of the phenophase was advanced. The areas with a negative correlation between the GSS and the average temperature in February were the most common (84.39%), and the areas with a negative correlation reaching a significant level were the average temperature in May, but only represented 1.23% of the whole area (p < 0.05). The correlation coefficients between the GSE and the temperature were mainly positive, that is, as the temperature rose, the ending of the phenophase was delayed. The areas with a positive correlation between the GSE and the average temperature in July were the most represented (74.70%), and the areas that reached the significant level were 4.17% of the whole area (p < 0.05). The areas with a positive correlation between the GSE and the average temperature from July to August were the second most common (70.65%), and the areas that reached the significant level were 2.68% of the whole area (p < 0.05), indicating that the temperature had an effect on both the advance of the beginning of the phenophase and the delay of the ending of the phenophase, and the effect on the ending of the phenophase was more significant than on the beginning of the phenophase.
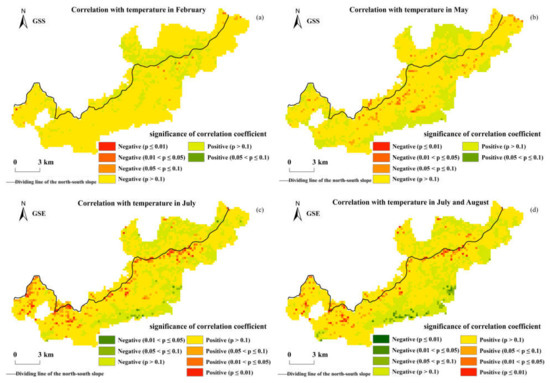
Figure 9.
Spatial correlations between the GSS/GSE and temperature in Niubeiliang Reserve from 2000 to 2017. (a) Correlation between the GSS and temperature in February; (b) correlation between the GSS and temperature in May; (c) correlation between the GSE and temperature in July; (d) correlation between the GSE and temperature in July and August.
The effect of the temperature on the GSS and the GSE exhibited obvious time-lag effects, in which the time-lag effect on the GSS was approximately 2–3 months, and the lag time effect on the GSE was also approximately 2–3 months. Spatially, there were significant north–south differences and altitude differences in the effects of temperature on the GSS and the GSE, which presented that the effect in the southern slope was more significant than that in the northern slope. The effects of the temperature on the GSS and the GSE in high-altitude areas were more significant than that in low-altitude areas, indicating that the effect of the temperature change on the vegetation phenology in high-altitude areas was more significant.
4. Discussion
4.1. Influence of Altitude, Slope, and Aspect on Phenology
In mountainous terrain, there are complex spatial changes in vegetation phenology due to the effects of topography on microclimate, soil moisture, and community composition [50]. Altitude, aspect, and slope are the three main topographic factors that indirectly affect the vegetation patterns of mountains [51]. The research results of the influence of the three topographic factors on the change in vegetation phenology in the Niubeiliang Reserve showed that the vegetation phenology changed regularly with the increase in altitude; the beginning of phenophase was significantly delayed, with an average rate of 1.84 days/100 m; the end of phenophase was significantly advanced, with an average rate of 1.66 days/100 m; and the length of growing season was significantly shortened, with an average rate of 3.50 days/100 m. The higher the altitude, the more significant its impact on the phenological changes, which are closely related to the mountain climate, especially the temperature change decreases with the increase in altitude. The effects of the slope and the aspect on the end of phenophase were more significant than at the beginning of phenophase. With the increase in the slope, the beginning of phenophase was significantly delayed, it was earliest on flat slopes and latest on sharp slopes; the end of phenophase was significantly advanced, it was the latest on the flat slope and the earliest on the sharp slope; and the length of growing season was significantly shortened, it was the longest on the flat slope and the shortest on the sharp slope. The steeper the slope, the earlier the end of phenophase, which may be related to the amount of the solar radiation received. The steeper the slope, the lower the amount of solar radiation received at the end of phenophase, leading to the advance of the end of phenophase. The aspect had a more significant effect on the end of phenophase, it was the latest on the sunny slope and the earliest on the zero slope, which may be related to the accepted sunshine duration. The sunny slope had a long sunshine duration, which was conducive to the delay of the phenological end. The influence of the topographic factors on the phenophy not only displayed seasonal differences, but also north–south differences. The effect of altitude on the beginning of phenophase was smaller in the northern slope than in the southern slope, while the effect on the end of phenophase was greater in the northern slope than in the southern slope. The effects of slope on the beginning and end of phenology were greater in the northern slope than the southern slope, and the effect of aspect on the beginning of phenology had little difference between the northern and the southern slopes, while its effect on the end of phenology was greater in the southern slope than in the northern slope, which was attributed to the difference in the impact of the terrain on climate factors in the reserve. Topography is an important influencing factor for the existence of spatial differences in phenology, and the altitude is the most important factor among the three factors, because it can be served as a proxy for temperature and precipitation [52]. The results of a phenological study on the humid temperate forests in the southern Appalachian Mountains of the USA showed that there was a strong linear relationship between altitude and the beginning of phenophase, and altitude factor had the strongest explanatory power for all phenological parameters, followed by temperature lapse rate [50]. The spatial distributions of forest community types in the region were closely related to elevation, aspect, and moisture gradient. In the forest-steppe of Mongolia, as a result of topographically induced differences of solar radiation and evapotranspiration, the landscape difference of “grass on the southern slope and trees on the northern slope” was formed [53]. Such a landscape pattern also exists on both sides of the ridge of the Qinling Mountains. Phenological studies in Mongolia have shown that there are obvious differences in the response of vegetation phenology to altitude. The beginning of phenophase was hardly affected by the altitude changes, while the end of phenophase and the length of the growing season changed greatly with the increase in altitude [54], which were obviously different from the research conclusion of the Niubeiliang Reserve. With regard to the effect of slope on vegetation phenology in the Qinghai-Tibet Plateau, the beginning of phenophase in the meadow area was significantly delayed but the end of phenophase significantly advanced with the increase in slope on both northern and southern slopes [55], which were also significantly different from the research conclusions of the Niubeiliang Reserve. In addition, the influence pattern of slope on vegetation phenology was the opposite in the steppe zone and in the meadow zone of the Qinghai-Tibet Plateau [55]. With regards to the effect of aspect on vegetation phenology, the beginning of phenophase was later but the end of phenophase was earlier on shaded slopes than on sunlit slopes in the meadow area, and the beginning of phenophase did not significantly depend on aspect in the steppe area, while the end of phenophase indicated a similar response to aspect in the steppe area to that in the meadow area [55]. In conclusion, the influence mechanism of topography on vegetation phenology is complex and needs to be further explored.
4.2. Influence of Temperature on Phenology
The vegetation phenology in the mid- and high-latitudes region is primarily controlled by temperature and photoperiod, while in tropical and semi-arid regions it is mainly controlled by seasonal rainfall [55]. The related research results of the topographic effects on vegetation phenological changes in the Qinghai-Tibet Plateau showed that temperature and moisture combinations were the main controlling factors [56]. The spatio-temporal variations of the beginning of phenophase in the mountains of northwest Mongolia were mainly influenced by both spring temperature and winter precipitation, with increasing precipitation in winter tending to delay the beginning of phenophase, while increasing temperature in spring tended to advance the beginning of phenophase [57]. The extension of the growing season in the steppes, shrubs, and savannahs of Australia, Africa, and southern South America is entirely dependent on changes in precipitation conditions [58]. Numerous studies have also shown that precipitation strongly affects spring phenology [59,60]. However, due to the high altitude of the reserve, there was a lack of meteorological observation data. The temperature data can be easily retrieved, while other meteorological data such as precipitation and sunshine were more easily affected by factors such as terrain and microhabitat, making them difficult to obtain. Therefore, the study only analyzed the relationship between the temperature in the meteorological factors and the phenological changes in the reserve. Temperature has been regarded as a driving factor for the change in beginning of phenophase in most high-latitude and high-altitude ecosystems [61]. The results in Niubeiliang Reserve displayed that the temperature had an effect on both the advance of the beginning of phenology and delay of the end of phenology, but the areas where the effect reached a significant level were relatively small, which indicated that the temperature was only one of the main factors affecting the phenological changes in the reserves. However, a single climate factor is not always sufficient to explain vegetation phenology at a given location. Rather, multiple factors act on phenology simultaneously or at different phases of vegetation development [62,63]. Especially in mountainous areas, the phenological changes of vegetation are more complex, which is the result of the comprehensive effect of multiple factors. In addition, the beginning of phenophase has different sensitivities to the temperature change compared to the end of phenophase, and the response to the temperature change in the beginning of phenophase is greater than that in the end of phenophase [64]. Our research found that the advance rate in the beginning of phenology was faster than the delay rate in the end of phenology, but the effect of temperature in the end of phenology was more significant than that in the beginning of phenology, and the effect was more significant in the high-altitude area than that in the low-altitude area, and the relevant influence mechanisms still need to be further considered—more factors, especially climate factors, need to be further studied.
4.3. Significance of the Results in the Context of Climate Change
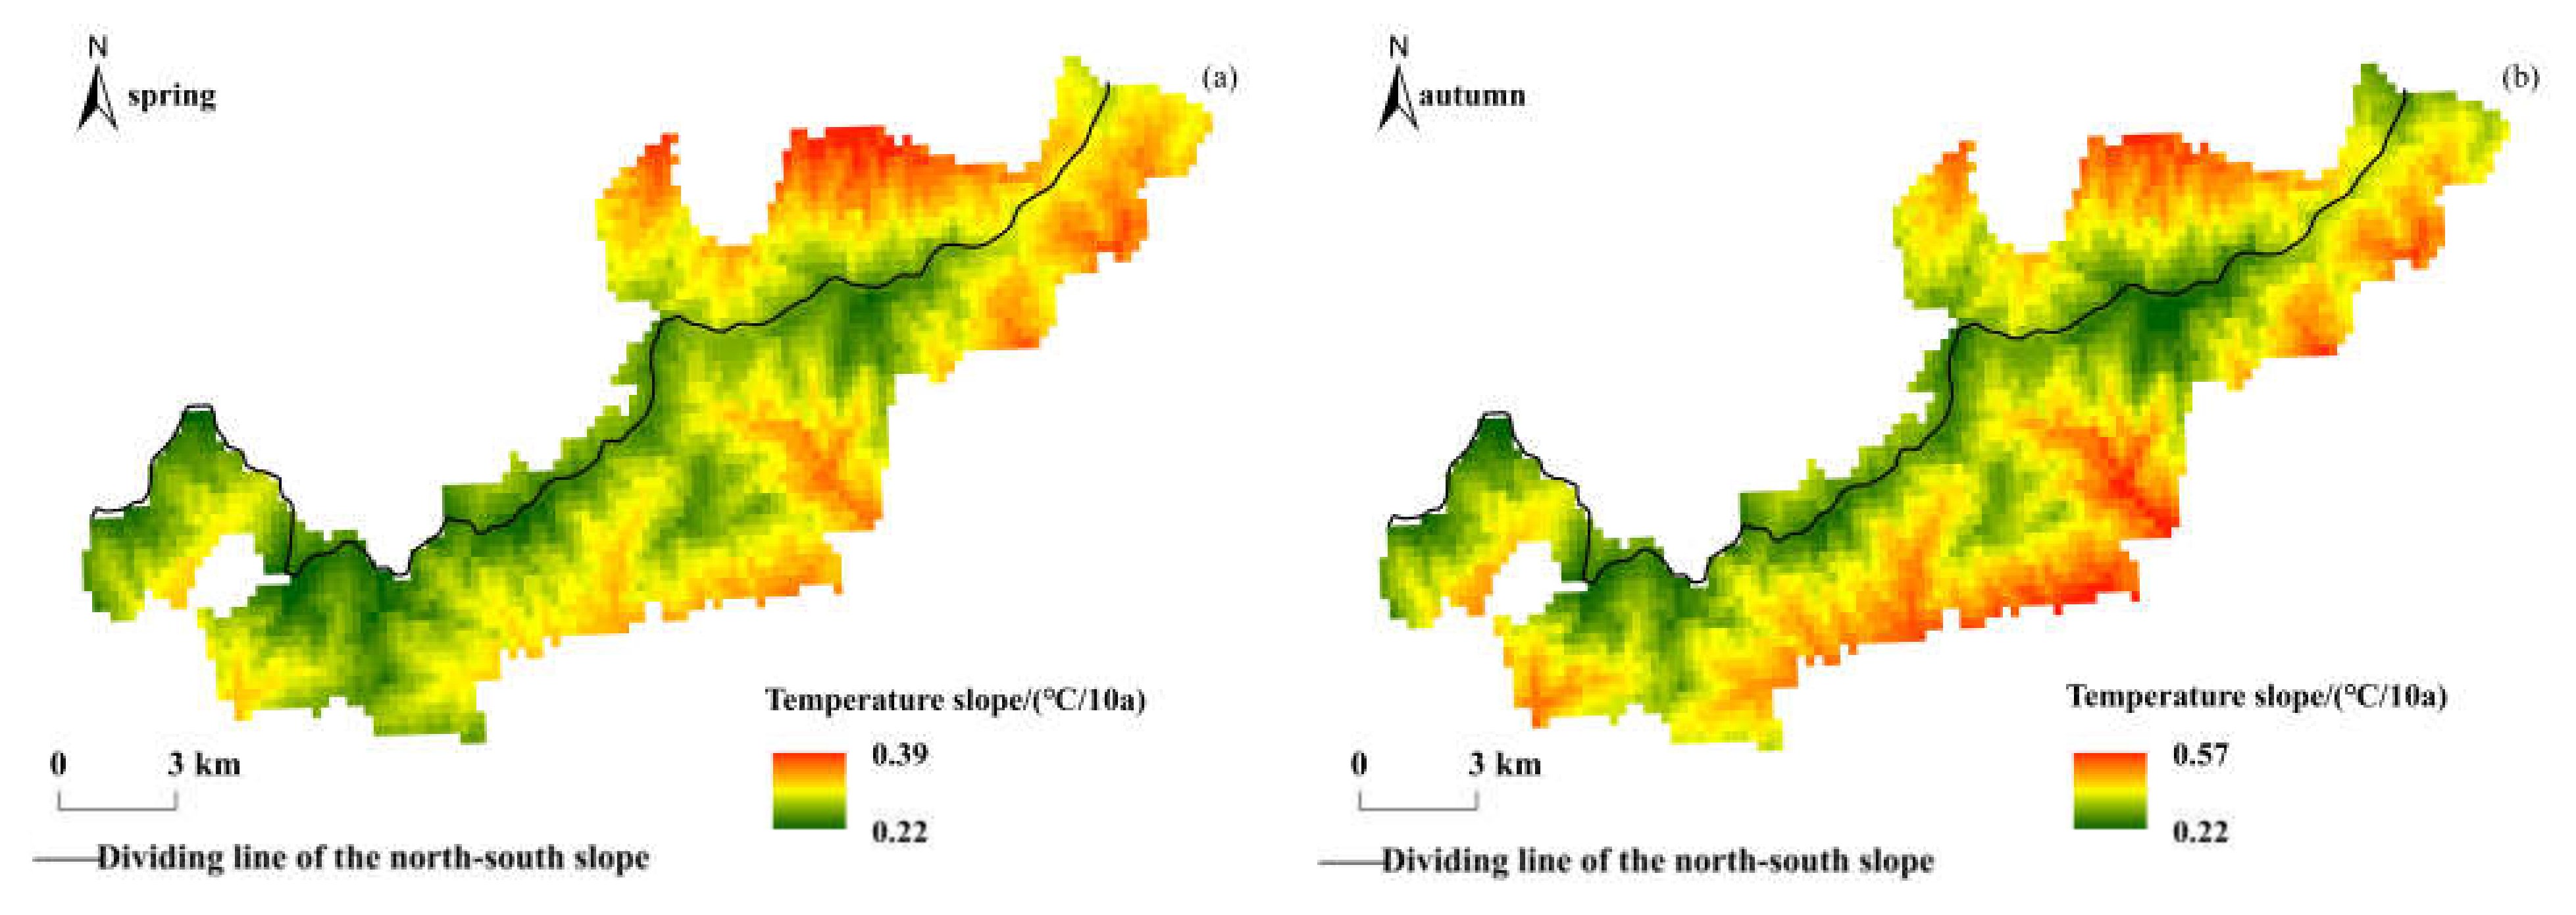
In high-altitude areas, the vulnerability of vegetation ecosystems and hydrological systems leads to their phenology being more sensitive and their response to climate change more intense [65]. The Qinling Mountains are the boundary of physical geography and climate between the north and south of China, and the Niubeiliang Nature Reserve belongs to the mid-mountain or sub-alpine mountain in the Qinling Mountains, with a great height difference, all-over canyons, and a special geomorphic type. In the past 18 years, the beginning of phenophase in the reserve has advanced, the end of phenophase has been delayed, and the growing season has been prolonged. This research conclusion is consistent with the change trends of phenophase in the Qinling Mountains [37], but the change rates of phenophase were significantly faster than those in the Qinling Mountains, indicating that the climate changes in the high-altitude areas of the mountains were more severe and had a greater impact on the vegetation phenology. In the Qinling Mountains, the average annual temperature has increased by about 0.2 °C per decade in the past 50 years, and the rate of change in the northern slope was faster than that in the southern slope [48]. The temperature in the Qinling Mountains has increased significantly since 1985. The spatial distributions of the temperature change rate in spring and autumn in Niubeiliang Reserve from 1985 to 2017 are shown in Figure 10. In the Mongolian Plateau, the average annual temperature has increased by about 0.36 °C per decade in the past 50 years, and has risen rapidly since 1985, reaching 0.51 °C per decade [66]. In the Qinghai-Tibet Plateau, the average annual temperature has increased by about 0.4 °C per decade in the past 50 years [67], which is more than twice the rate of global temperature rise [68]. The temperature increases have displayed spatiotemporal heterogeneity, being greater in the winter and autumn than in spring and summer, at nighttime than in daytime, and in the western parts than in the eastern parts [69,70]. In short, high-altitude areas are sensitive areas for climate change, and the temperature in these areas increases significantly and at an extremely fast rate, with significant differences in different regions due to latitude and topography. The related impact mechanism is still a hot topic of research by scholars. In the context of climate change, warming has promoted longer plant growing seasons, which may contribute to an increase in the vegetation net primary productivity and cause negative feedback on the current global warming caused by elevated atmospheric CO2 concentrations [71]. Vegetation phenology changes affect the carbon budget of terrestrial ecosystems, and the carbon budget of forest ecosystems determines the intensity of the increase in atmospheric CO2 concentration, so it also affects the process of global warming [72].

Figure 10.
Spatial distribution of interannual change trends of temperature in Niubeiliang Reserve from 1985 to 2017. (a) Slope of temperature in spring. (b) Slope of temperature in autumn.
5. Conclusions
The GSS of the reserve mainly occurred from late April to mid-May, showing an early trend, and the change rates in the northern and southern slopes were basically the same. The GSE mainly occurred from late September to late October, showing a delaying trend, and the rate in the northern slope was slightly faster than that in the southern slope. The GSL was approximately 4 to 6 months, showing a prolonged trend, and the change rates in the northern and southern slopes were not much different.
With the increase in altitude, the phenophase showed regular changes. The higher the altitude, the more significant its effect on the phenological changes. The effect of altitude on the GSS was smaller in the northern slope than that in the southern slope, while its effect on the GSE was larger in the northern slope than that in the southern slope. With the increase in the slope, the GSS was significantly delayed; the GSE was significantly advanced; and the GSL was significantly shortened. The influence of slope on the GSE was more significant than that of the GSS, and its influences on the GSS and the GSE were greater in the northern slope than in the southern slope. The aspect had little effect on the GSS, while it had a more significant effect on the GSE, its effect on the GSS exhibited less difference between the northern and southern slopes, while the effect on the GSE was greater in the southern slope than in the northern slope.
The GSS was mainly negatively correlated with the temperature, while the GSE was mainly positively correlated with the temperature. The effects of temperature on the GSS and the GSE had a lag of approximately 2 to 3 months; its effect on the GSE was more significant than that on the GSS, its effect in the southern slope was more significant than that in the northern slope, and its effect in the high-altitude area was more significant than in the lower-altitude area.
Author Contributions
Methodology and software C.D. and M.X.; formal analysis, C.D. and X.M.; writing—original draft preparation, C.D.; writing—review and editing, H.B., X.M. and C.D. All authors have read and agreed to the published version of the manuscript.
Funding
This research was funded by the Special Scientific Research Program from the Education Department of China’s Shaanxi Provincial Government (Grant number 19JK0930), as well as the China Postdoctoral Science Foundation (Grant number 2019M663922XB).
Conflicts of Interest
The authors declare no conflict of interest.
References
- Qin, D.H.; Ding, Y.H.; Su, J.L.; Ren, J.W.; Wang, S.W.; Wu, R.S.; Yang, X.Q.; Wang, S.M.; Liu, S.Y.; Dong, G.R.; et al. Assessment of climate and environment changes in China: Climate and environment changes in China and their projection. Adv. Clim. Chang. Res. 2005, 1, 4–9. [Google Scholar]
- Xia, J.Y.; Chen, J.Q.; Piao, S.L.; Ciais, P.; Luo, Y.Q.; Wan, S.Q. Terrestrial carbon cycle affected by non-uniform climate warming. Nat. Geosci. 2014, 7, 173–180. [Google Scholar] [CrossRef]
- King, D.A. Climate change science: Adapt, mitigate, or ignore? Science 2004, 303, 176–177. [Google Scholar] [CrossRef] [PubMed] [Green Version]
- Zhu, Z.C.; Piao, S.L.; Myneni, R.B.; Huang, M.T.; Zeng, Z.Z.; Canadell, J.G.; Ciais, P.; Sitch, S.; Pierre, F.; Arneth, A.; et al. Greening of the Earth and its drivers. Nat. Clim. Chang. 2016, 6, 791–795. [Google Scholar] [CrossRef]
- Wang, G.X.; Deng, W.; Yang, Y.; Cheng, G.W. The advances, priority and developing trend of alpine ecology. J. Mt. Sci.-Engl. 2011, 29, 129–140. [Google Scholar]
- Zhang, B.P.; Yao, Y.H. Implications of mass elevation effect for the altitudinal patterns of global ecology. J. Geogr. Sci. 2016, 26, 871–877. [Google Scholar] [CrossRef] [Green Version]
- Li, D.K.; Wang, Z. Spatiotemporal variation of vegetation phenology and its response to climate in Qinling Mountains Based on MCD12Q2. Ecol. Environ. Sci. 2020, 29, 11–22. [Google Scholar]
- Zhu, K.Z.; Wan, M.W. Phenology, 1st ed.; Science Press: Beijing, China, 1973; pp. 1–5. [Google Scholar]
- Root, T.L.; Price, J.T.; Hall, K.R.; Schneider, S.H.; Rosenzweig, C.; Pounds, J.A. Fingerprints of global warming on wild animals and plants. Nature 2003, 421, 57–60. [Google Scholar] [CrossRef]
- Schwartz, M.D. Monitoring global change with phenology: The case of the spring green wave. Int. J. Biometeorol. 1994, 38, 18–22. [Google Scholar] [CrossRef]
- Julien, Y.; Sobrino, J.A. Global Land surface phenology trends from GIMMS database. Int. J. Remote Sens. 2009, 30, 3495–3513. [Google Scholar] [CrossRef] [Green Version]
- Menzel, A.; Fabian, P. Growing season extended in Europe. Nature 1999, 397, 659. [Google Scholar] [CrossRef]
- Menzel, A. Trends in phenological phases in Europe between 1951 and 1996. Int. J. Biometeorol. 2000, 44, 76–81. [Google Scholar] [CrossRef]
- Schwartz, M.D.; Chen, X. Examination of the onset of spring in China. Clim. Res. 2002, 21, 157–164. [Google Scholar] [CrossRef] [Green Version]
- Lu, P.L.; Yu, Q.; Liu, J.D.; He, Q.T. Effects of changes in spring temperature on flowering date of woody plants across China. Bot. Stud. 2006, 47, 153–161. [Google Scholar]
- Mearns, L.O.; Rosenzweig, C.; Goldberg, R. Mean and variance change in climate scenarios: Methods, agricultural applications, and measures of uncertainty. Clim. Chang. 1997, 35, 367–396. [Google Scholar] [CrossRef]
- Bradley, N.L.; Leopold, A.C.; Ross, J.; Huffaker, W. Phenological changes reflect climate change in Wisconsin. Proc. Natl. Acad. Sci. USA 1999, 96, 9701–9704. [Google Scholar] [CrossRef] [Green Version]
- Beaubien, E.G.; Freeland, H.J. Spring phenology trends in Alberta, Canada: Links to ocean temperature. Int. J. Biometeorol. 2000, 44, 53–59. [Google Scholar] [CrossRef]
- Fan, D.Q.; Zhao, X.S.; Zhu, W.Q.; Zheng, Z.T. Review of influencing factors of accuracy of plant phenology monitoring based on remote sensing data. Adv. Geogr. Sci. 2016, 35, 304–319. [Google Scholar]
- Huete, A.R.; Saleska, S.R. Remote sensing of tropical forest phenology: Issues and controversies international archives of the photogrammetry. Remote Sens. Spat. Inf. Sci. 2010, 38, 539–541. [Google Scholar]
- Hou, J.; Du, L.T.; Liu, K.; Zhu, Y.G.; Hu, Y.; Yang, X.G.; Zhang, X.J. Characteristics of phenology changes and its relationship with climatic factors in desert/grassland biome transition zone of northern hemisphere during 1982–2012. Clim. Chang. Res. 2017, 13, 473–482. [Google Scholar]
- Kong, D.D.; Zhang, Q.; Huang, W.L.; Gu, X.H. Vegetation phenology change in Tibetan Plateau from 1982 to 2013 and its related meteorological factors. Acta Geogr. Sin. 2017, 72, 39–52. [Google Scholar]
- An, C.C. Monitoring of Vegetation Phenology Based on MODIS Data and Its Response to Climate Change in Tibetan Plateau, China. Ph.D. Thesis, Universty of Chinese Academy of Sciences (Institute of Mountain Hazards and Environment, CAS), Chengdu, China, 2019. [Google Scholar]
- Ding, M.J.; Zhang, Y.L.; Sun, X.M.; Liu, L.S.; Wang, Z.F. Spatio-temporal variation in alpine grassland phenology in the Qinghai-Tibetan Plateau from 1999 to 2010. Chin. Sci. Bull. 2012, 57, 3185–3194. [Google Scholar]
- Ma, X.F.; Chen, S.Y.; Deng, J.; Feng, Q.S.; Huang, X.D. Vegetation phenology dynamics and its response to climate change on the Tibetan Plateau. Acta Prataculturae Sin. 2016, 25, 13–21. [Google Scholar]
- Song, C.Q.; You, C.C.; Ke, L.H.; Liu, G.H.; Zhong, X.K. Phenological variation of typical vegetation types in northern Tibet and its response to climate changes. Acta Ecol. Sin. 2012, 32, 1045–1055. [Google Scholar] [CrossRef] [Green Version]
- Li, Q.; Zhang, C.; Ren, Z.Y. Analysis of temporal and spatial variation of vegetation phenology in the Loess Plateau. Sci. Agric. Sin. 2016, 49, 4352–4365. [Google Scholar]
- Wei, Z.F.; Ren, Z.Y.; Zhang, C.; Li, X.Y.; Zhang, J.Q. Impact of climate on vegetation phenology on Loess Plateau in Shaanxi-Gansu-Ningxia region during 1999–2010. Bull. Soil Water Conserv. 2014, 34, 232–236. [Google Scholar]
- Xie, B.N.; Qin, Z.F.; Wang, Y.; Chang, Q.R. Monitoring vegetation phenology and their response to climate change on Chinese Loess Plateau based on remote sensing. Trans. Chin. Soc. Agric. Eng. 2015, 31, 153–160. [Google Scholar]
- Hong, Y. Effects of Extreme Climate Change on Vegetation Phenology of Inner Mongolia. Ph.D. Thesis, Northeast Normal University, Jilin, China, 2020. [Google Scholar]
- Dong, X.Y.; Yao, H.R.; Dai, J.H.; Zhu, M.Y. Phenological changes of desert steppe vegetation and its effect on net primary productivity in Inner Mongolia from 2000 to 2017. Prog. Geogr. 2020, 39, 24–35. [Google Scholar] [CrossRef]
- Zeng, B.; Yang, T.B. Natural vegetation responses to warming climates in Qaidam Basin 1982–2003. Int. J. Remote Sens. 2009, 30, 5685–5701. [Google Scholar] [CrossRef]
- Zuo, B.J. Response of Vegetation EVI and Remote Sensing Phenology to Climate Change in the Southern Subtropical Monsoon Region. Master’s Thesis, Beijing Forestry University, Beijing, China, 2019. [Google Scholar]
- Li, D.; Wu, X.Q.; Zhang, J.Z.; Yu, Y. Vegetation phenology change and response to climate change in the Karst faulted basin of southwest China. Res. Soil Water Conserv. 2020, 27, 168–173. [Google Scholar]
- Wang, R.; Wang, Y.Q.; Yan, H.W. Phenology zonal variation of vegetation and its response to climate change in Liupan Mountains. Geogr. Geo-Inf. Sci. 2021, 37, 90–98. [Google Scholar]
- Jia, W.X.; Zhao, Z.; Zu, J.X.; Chen, J.H.; Wang, J.; Ding, D. Phenological variation in different vegetation types and their response to climate change in the Qilian Mountains, China, 1982–2014. Acta Ecol. Sin. 2016, 36, 7826–7840. [Google Scholar]
- Deng, C.H.; Bai, H.Y.; Ma, X.P.; Huang, X.Y.; Zhao, T. Variation characteristics and its north-south differences of the vegetation phenology by remote sensing monitoring in the Qinling Mountains during 2000–2017. Acta Ecol. Sin. 2021, 41, 1068–1080. [Google Scholar]
- Wang, Z.; Peng, Y.; Quan, W.T.; He, H.J.; Li, D.K. Characteristics of plant phenology and its response to the hydrothermal conditions over Qinling Mountains. Arid Land Geogr. 2019, 42, 1048–1058. [Google Scholar]
- Xia, H.M.; Qin, Y.C.; Feng, G.; Meng, Q.M.; Cui, Y.P.; Song, H.Q.; Ouyang, Y.; Liu, G.J. Forest phenology dynamics to climate change and topography in a geographic and climate transition zone: The Qinling Mountains in central China. Forests 2019, 10, 1007. [Google Scholar] [CrossRef] [Green Version]
- Xia, H.M.; Li, A.N.; Zhao, W.; Bian, J.H.; Lei, G.B. Spatiotemporal variations of forest phenology in the Qinling zone based on remote sensing montoring, 2001–2010. Prog. Geogr. 2015, 34, 1297–1305. [Google Scholar]
- Liu, Y.N. Remote Sensing Monitoring of Vegetation Phenology in Qinling Mountains Based on MODIS Data and Analysis of Temporal and Spatial Changes. Master’s Thesis, University of Chinese Academy of Sciences, Beijing, China, 2015. [Google Scholar]
- Ma, X.P.; Bai, H.Y.; He, Y.N.; Qin, J. The vegetation remote sensing phenology of Qinling Mountains based on NDVI and Its response to temperature: Taking within the territory of Shaanxi as an example. Sci. Geogr. Sin. 2015, 35, 1616–1621. [Google Scholar]
- Zhang, X.D.; Zhu, W.B.; Zhang, J.J.; Zhu, L.Q.; Zhao, F.; Cui, Y.P. Phenology of forest vegetation and its response to climate change in the Funiu Mountains. Acta Geogr. Sin. 2018, 73, 41–53. [Google Scholar]
- Shao, Z.L.; Zhou, W.Z.; Li, F.; Zhou, X.Y.; Yang, F. Spatiotemporal variation of vegetation phenophase and its response to climate change in Micang Mountains from 2003 to 2018. Acta Ecol. Sin. 2021, 41, 1–12. [Google Scholar]
- Zong, W. Nature reserves are an effective solution to the climate change crisis. Earth 2010, 2, 30. [Google Scholar]
- Ma, Y. Niubeiliang: A miniature of the Qinling Mountains. For. Hum. 2016, 10, 76–77. [Google Scholar]
- Liu, Z.F.; Zhang, J.W.; Zhu, S.Q.; Lu, Y.X.; Zhang, Z.F.; Luo, L.H. Investigation of ecotourism resources in Niubeiliang of Qinling Mountains, Zhashui County, Shaanxi Province, China. Shaanxi For. Sci. Technol. 2004, 4, 29–33. [Google Scholar]
- Bai, H.Y.; Liu, K.; Wang, J.; Li, S.H. Response and Adaptation of Vegetation in Qinling Mountains under the Background of Climate Change, 1st ed.; Science Press: Beijing, China, 2019; pp. 34–56. [Google Scholar]
- Xu, X.; Xu, Y.; Sun, Q.Q. Change in growing season over China: 1961–2000. J. Cent. China Norm. Univ. 2018, 52, 122–129. [Google Scholar]
- Hwang, T.; Song, C.; Vose, J.M.; Band, L.E. Topography-mediated controls on local vegetation phenology estimated from MODIS vegetation index. Landscape Ecol. 2011, 26, 541–556. [Google Scholar] [CrossRef]
- Huang, K.Y. Evaluation of the topographic sheltering effects on the spatial pattern of Taiwan fir using aerial photography and GIS. Int. J. Remote Sens. 2002, 23, 2051–2069. [Google Scholar] [CrossRef]
- Jin, X.; Wan, L.; Zhang, Y.K.; Hu, G.; Schaepman, M.E.; Clevers, J.G.P.W.; Su, Z.B. Quantification of spatial distribution of vegetation in the Qilian Mountain area with MODIS NDVI. Int. J. Remote Sens. 2009, 30, 5751–5766. [Google Scholar] [CrossRef]
- Schlütz, F.; Dulamsuren, C.; Wieckowska, M.; Mühlenberg, M.; Hauck, M. Late Holocene vegetation history suggests natural origin of steppes in the northern Mongolian mountain taiga. Palaeogeogr. Palaeocl. 2008, 261, 203–217. [Google Scholar] [CrossRef]
- Shao, Y.; Wang, J.; Yan, X. The phenological characteristics of Mongolian vegetation and its response to geographical elements. Geogr. Res. 2021, 40, 3029–3045. [Google Scholar]
- Jolly, W.M.; Nemani, R.; Running, S.W. A generalized, bioclimatic index to predict foliar phenology in response to climate. Glob. Chang. Biol. 2005, 11, 619–632. [Google Scholar] [CrossRef]
- An, S.; Zhang, X.; Chen, X.; Yan, D.; Henebry, G.M. An Exploration of Terrain Effects on Land Surface Phenology across the Qinghai–Tibet Plateau Using Landsat ETM+ and OLI Data. Remote Sens. 2018, 10, 1069. [Google Scholar] [CrossRef] [Green Version]
- Mei, L.; Bao, G.; Tong, S.Q.; Yin, S.; Bao, Y.H.; Jiang, K.; Honge, Y.; Tuya, A.; Huang, X.J. Elevation-dependent response of spring phenology to climate and its legacy effect on vegetation growth in the mountains of northwest Mongolia. Ecol. Indic. 2021, 126, 107640. [Google Scholar] [CrossRef]
- Tateishi, R.; Ebata, M. Analysis of phenological change patterns using 1982–2000 Advanced Very High Resolution Radiometer (AVHRR) data. Int. J. Remote Sens. 2004, 25, 2287–2300. [Google Scholar] [CrossRef]
- Cong, N.; Wang, T.; Nan, H.; Ma, Y.; Wang, X.; Myneni, R.B.; Piao, S. Changes in satellite-derived spring vegetation green-up date and its linkage to climate in China from 1982 to 2010: A multimethod analysis. Glob. Chang. Biol. 2013, 19, 881–891. [Google Scholar] [CrossRef]
- Shen, M.; Piao, S.; Cong, N.; Zhang, G.; Jassens, I.A. Precipitation impacts on vegetation spring phenology on the Tibetan plateau. Glob. Chang Biol. 2015, 21, 3647–3656. [Google Scholar] [CrossRef] [Green Version]
- Piao, S.; Cui, M.; Chen, A.; Wang, X.; Ciais, P.; Liu, J.; Tang, Y. Altitude and temperature dependence of change in the spring vegetation green-up date from 1982 to 2006 in the Qinghai-Xizang Plateau. Agric. For. Meteorol. 2011, 151, 1599–1608. [Google Scholar] [CrossRef]
- White, M.A.; Thornton, P.E.; Running, S.W. A continental phenology model for monitoring vegetation responses to interannual climatic variability. Glob. Biogeochem. Cycles 1997, 11, 217–234. [Google Scholar] [CrossRef]
- Partanen, J.; Koski, V.; Hanninen, H. Effects of photoperiod and temperature on the timing of bud burst in Norway spruce (Picea abies). Tree Physiol. 1998, 18, 811–816. [Google Scholar] [CrossRef]
- Fu, Y.H.; Piao, S.; Delpierre, N.; Hao, F.; Hänninen, H.; Liu, Y.; Sun, W.; Janssens, I.A.; Campioli, M. Larger temperature response of autumn leaf senescence than spring leaf-out phenology. Glob. Chang. Biol. 2018, 24, 2159–2168. [Google Scholar] [CrossRef]
- Tang, H.; Li, Z.W.; Zhu, Z.L.; Chen, B.R.; Zhang, B.H.; Xin, X.P. Vegetation Phenology in the Qilian Mountains and Its Response to Temperature from 1982 to 2014. Remote Sens. 2015, 7, 11914–11932. [Google Scholar] [CrossRef] [Green Version]
- Miao, L.J.; Jiang, C.; He, B.; Liu, Q.; Zhu, F.; Cui, X.F. Response of vegetation coverage to climate change in Mongolian Plateau during recent 10 years. Acta. Ecol. Sin. 2014, 34, 1295–1301. [Google Scholar]
- Dong, M.; Jiang, Y.; Zheng, C.; Zhang, D. Trends in the thermal growing season throughout the Tibetan Plateau during 1960–2009. Agric. For. Meteorol. 2012, 166–167, 201–206. [Google Scholar] [CrossRef]
- Hansen, J.; Ruedy, R.; Sato, M.; Lo, K. Global surface temperature change. Rev. Geophys. 2010, 48, RG4004. [Google Scholar] [CrossRef] [Green Version]
- Chen, H.; Zhu, Q.A.; Peng, C.H.; Wu, N.; Wang, Y.F.; Fang, X.Q.; Gao, Y.H.; Zhu, D.; Yang, G.; Tian, J.Q.; et al. The impacts of climate change and human activities on biogeochemical cycles on the Qinghai-Tibetan Plateau. Glob. Chang. Biol. 2013, 19, 2940–2955. [Google Scholar] [CrossRef] [PubMed]
- Liu, X.; Yin, Z.; Shao, X.; Qin, N. Temporal trends and variability of daily maximum and minimum, extreme temperature events, and growing season length over the eastern and central Tibetan Plateau during 1961–2003. J. Geophys. Res. Atmos. 2006, 111, 1–19. [Google Scholar] [CrossRef] [Green Version]
- Xu, Z.F.; Hu, T.X.; Zhang, Y.B.; Wang, K.Y.; Xian, J.R. Review on Responses of Plant Phenology to Simulated Elevated CO2 Concentration and Temperature. Chin. J. Appl. Environ. Biol. 2008, 14, 716–720. [Google Scholar]
- Fang, J.Y.; Zhu, J.X.; Li, P.; Ji, C.J.; Zhu, J.L.; Jiang, L.; Chen, G.P.; Cai, Q.; Su, H.J.; Feng, Y.H.; et al. Carbon Budgets of Forest Ecosystems in China, 1st ed.; Science Press: Beijing, China, 2021; pp. 1–15. [Google Scholar]


Publisher’s Note: MDPI stays neutral with regard to jurisdictional claims in published maps and institutional affiliations. |
© 2022 by the authors. Licensee MDPI, Basel, Switzerland. This article is an open access article distributed under the terms and conditions of the Creative Commons Attribution (CC BY) license (https://creativecommons.org/licenses/by/4.0/).