Article

Responses of Early Distribution and Developmental Traits of Male and Female Trees to Stand Density in Fraxinus mandshurica Rupr. Plantation

1
Key Laboratory of Sustainable Forest Ecosystem Management, Ministry of Education, Harbin 150000, China
2
School of Forestry, Northeast Forestry University, Harbin 150000, China
*
Author to whom correspondence should be addressed.
Forests 2022, 13(3), 472; https://doi.org/10.3390/f13030472
Submission received: 25 January 2022 / Revised: 24 February 2022 / Accepted: 15 March 2022 / Published: 18 March 2022
(This article belongs to the Section Forest Ecology and Management)

Abstract

:
Density plays an important role in tree growth and development. Exploring the growth of males and females in the early stage of gender differentiation and the distribution pattern in different densities are beneficial to assess the influence earlier caused by density of the productivity and reproductive potential of dioecious plantations. We observed the numbers, distribution pattern and phenotypic traits of the males and females of Fraxinus mandshurica Rupr. in four initial densities (D1: 1.5 × 3 m; D2: 2 × 2 m; D3: 1.5 × 1.5 m; D4: 1 × 1 m). The results showed that the number of males and females gradually decreased with the increase in stand density, and they were randomly distributed in each density. With the increase in density, the total volume of males and females increased first and then decreased, and the highest value appeared in the D2 (2 × 2 m) density. The phenotypic traits of males and females had no significant difference within the same density. With increasing density, the crown width and the diameter of males and females all gradually decreased. There was a larger leaf area, larger specific leaf weight, and less leaf index for males, but for females, there was a relatively stable leaf area, larger leaf biomass, and less living under branch height. In the current stage, the D2 (2 × 2 m) planting density has advantages in the number and quality of males and females. Our results emphasize that suitable stand density can promote the volume of timber accumulation and reproduction of males and females in plantations with dioecious trees.

1. Introduction

Density has a pivotal impact on the growth of trees [1,2]. It regulates the quantity and quality of plantation and affects the horizontal structure and development space in forests [3,4]. Due to the development of trees, their demand for aboveground growth space gradually increases and leads to more competition intensity [5,6]. The phenotypic traits of forest trees are obviously influenced by stand density, and their developmental forms are the direct reflection of individual growth status. In order to complete the life history of trees, their phenotypic traits need to adaptively respond on density [7]. For example, the higher stand density can cause a decrease in diameter at breast height and crown width [8,9,10] and can further influence wood quality [10,11,12]. Thus, the phenotypic traits of trees are crucial for assessing the suitable density.
There are inherent phenotypic differences between males and females of dioecious trees [13]. Dioecy is an evolutionary strategy to avoid self-pollination and maintain genetic diversity [14]. There are significant differences in phenotype characteristics between males and females at different stages of development, including flowering, DBH (diameter at breast height), branching structure, growth rate, and leaf biomass, named gender dimorphism [15,16,17]. They account for 5~6% of flowering plants, and this is a higher rate among the trees [18]. Commercial and economic forests, which are mainly planted with dioecious trees, account for a large proportion of forests in China, comprising 17 families and 25 genera. The females of dioecious plants are often mainly used for reproduction of species, and are less used for timber than males; thus, suitable sex individuals are often cultivated according to afforestation needs. In addition, the spatial distribution pattern of males and females has an important effect on pollination [19].
Worldwide, dioecious trees are widely distributed, and many species are used in plantations, such as Fraxinus mandshurica Rupr., Ginkgo biloba, Pistacia vera, Castanea mollissima, Juglans regia, Populus, Salix, etc. The Fraxinus contains trees and shrubs that are monoecious or dioecious, many of which have fine textural properties. They can be used as wood, landscaping, and ornamental purposed. The radial growth [20], physiology [21], and reproduction [22] of female and male plants are various in response to the environment and competition. F. mandshurica is an extremely important commercial timber forest in Northeast China due to its excellent material quality. However, large areas of natural forest have been nearly depleted due to overharvesting over the last century. Therefore, cultivating large-diameter ash plantations has become the main task at this stage. In natural forests, there are more males in the range of large DBH (>40 cm) [23]. In addition, the sex ratio and distribution pattern of males and females are also widely concerned due to intraspecific or interspecific interactions. In secondary forests, F. mandshurica shows that the sex ratio does not deviate from 1:1, and the aggregated distribution is of a small scale [23,24]. Such an aggregation distribution of females and males is beneficial to seed continuation. However, the change of stand density changes the growth space of individual trees [25], which will further influence the process of sex differentiation. The plantation has standard spacing configurations, and different densities can lead to a difference in individual living space. Therefore, we assumed that stand density may be an important factor affecting the development and distribution patterns of males and females in dioecious trees. The initial development effects of stand density on the male and female individual can help us to realize which density is the most appropriate.
In this study, the effect of density of an F. mandshurica pure plantation at the initial stage of gender development was analyzed. Our aims were: (i) to determine the response of the phenotypic traits between males and females along the change of density and (ii) to explore a suitable density at the initial stage of gender development.

2. Materials and Methods

2.1. Site and Experimental Design

The study site was subject to the Maoer Mountain experimental forest farm of Northeast Forestry University, Harbin, China (127°29′–127°33′ E, 45°19′–45°24′ N). The type of landform is low mountains and hills, and the soil consists of dark brown soil. The climate type is continental monsoon, with an average annual temperature of 2.75° and an average annual rainfall of 649 mm [26].
The research object is a pure plantation forest that was afforested, using 2-year-old F. mandshurica seedlings in a clear-cut secondary forest in 1998. Four initial stand densities (0.3 ha per density) were used in the plantation, with a slope of less than 15°, flat slopes, and similar site conditions. This forest stand has no silvicultural treatments (Table 1, Supplementary Figure S1). Each density was randomly selected to form three standard plots that were 30 m long and 20 m wide. The separation between plots was set at 15 m. During the breeding season of F. mandshurica in 2018, we used binoculars to observe the reproductive organs to determine the sex of the plants. The trees in the plots that had no sexual development were labeled as unknown sex.

2.2. Distribution Pattern of Females and Males

The center point of each plot was used as the origin of the coordinates, and the X-Y coordinate system was established to determine the location of each tree. The distribution patterns of females and males were analyzed in different sampling scales (6 × 6 m, 6 × 12 m, 12 × 12 m, and 12 × 24 m). The distribution pattern adopted the t test of deviation index (C) [27].
C = V / m
Equation (1): V is the variance of the population, and m is the mean of the population. When C = 1, the population was random; when C > 1, the population was a clustered distribution, and when C < 1, the population was uniformly distributed. To test the significance of the deviation from C from the distribution of F. mandshurica, a t test was required.
t =   C 1 / 2 / n 1
Equation (2): “n” is the number of sample squares, and when t = t0.05 (Query T—test threshold distribution table, the same as below), the populations were in a uniform distribution. When t > t0.05, the populations were in a cluster distribution. When t < t0.05, the populations were in a Poisson distribution (random).

2.3. Phenotype Traits Measurements

An ultrasonic altimeter (Vertex IX, Sweden) was used to measure the TH and LUH. The TH and LUH were used to obtain the LCH and LCR, LCH = TH − LUH, LCR = LUH/TH. The DBH was selected at the position of the breast height (1.3 m above the ground) and was measured by an electronic digital Vernier caliper (QST-0–300 mm, China). The projection method combined with an infrared laser rangefinder (VCHON-H-40S) was used to measure the width of tree crown in the east–west and north–south directions, and these two parameters were averaged as CW. The numbers of live and dead branches for females and males were observed with binoculars on 1 June 2019. The LMD was measured with a vernier caliper, and ALT was measured with a protractor.
On 15 July 2019, five females and five males with DBH between 13–15 cm were selected in four-stand density. The functional leaves on the lateral branches in the middle of the southward crown were selected for each tree, with a total of thirty trees. After the leaves were selected, they were placed in sealed bags, loaded into a sampling box and taken back to the laboratory to determine the other leaf traits. The LVL and LHL was measured with a ruler, and the data were accurate to 0.1 cm. LI = LHL/LVL. To estimate LB, the leaves were washed with water, and filter paper was used to absorb the water attached to the surface. The leaves were dried to a constant weight in a 105 °C oven and measured with an AL type 1/10,000 electronic balance after cooling. The leaf area was determined from LI-300A measurements and was accurate to 0.01 cm2. SLW = LB/LA.
The per timber volume was calculated for each genus in the four densities according to the volume model of F. mandshurica, with the total volume resulting from adding the volume of both genera and the unknowns.
Y = 0.000048 × D 2.01077 × H 0.870343
Equation (3): “Y” is the per timber volume; D is the diameter at breast height for the tree; H is tree height.
There were three technical replicates and three experimental replicates for all of the indices.

2.4. Data Analysis

Microsoft Excel 2019 (Redmond, WA, USA) was used to organize the data. The SPSS 19.0 software (SPSS Inc., Armonk, NY, USA) was used to determine one-way analysis of variance (ANOVA), two-way ANOVA, multiple comparisons and the t test. The figures were drawn using Sigma Plot 13.0 (SYSTAT, San Jose, CA USA).

3. Results

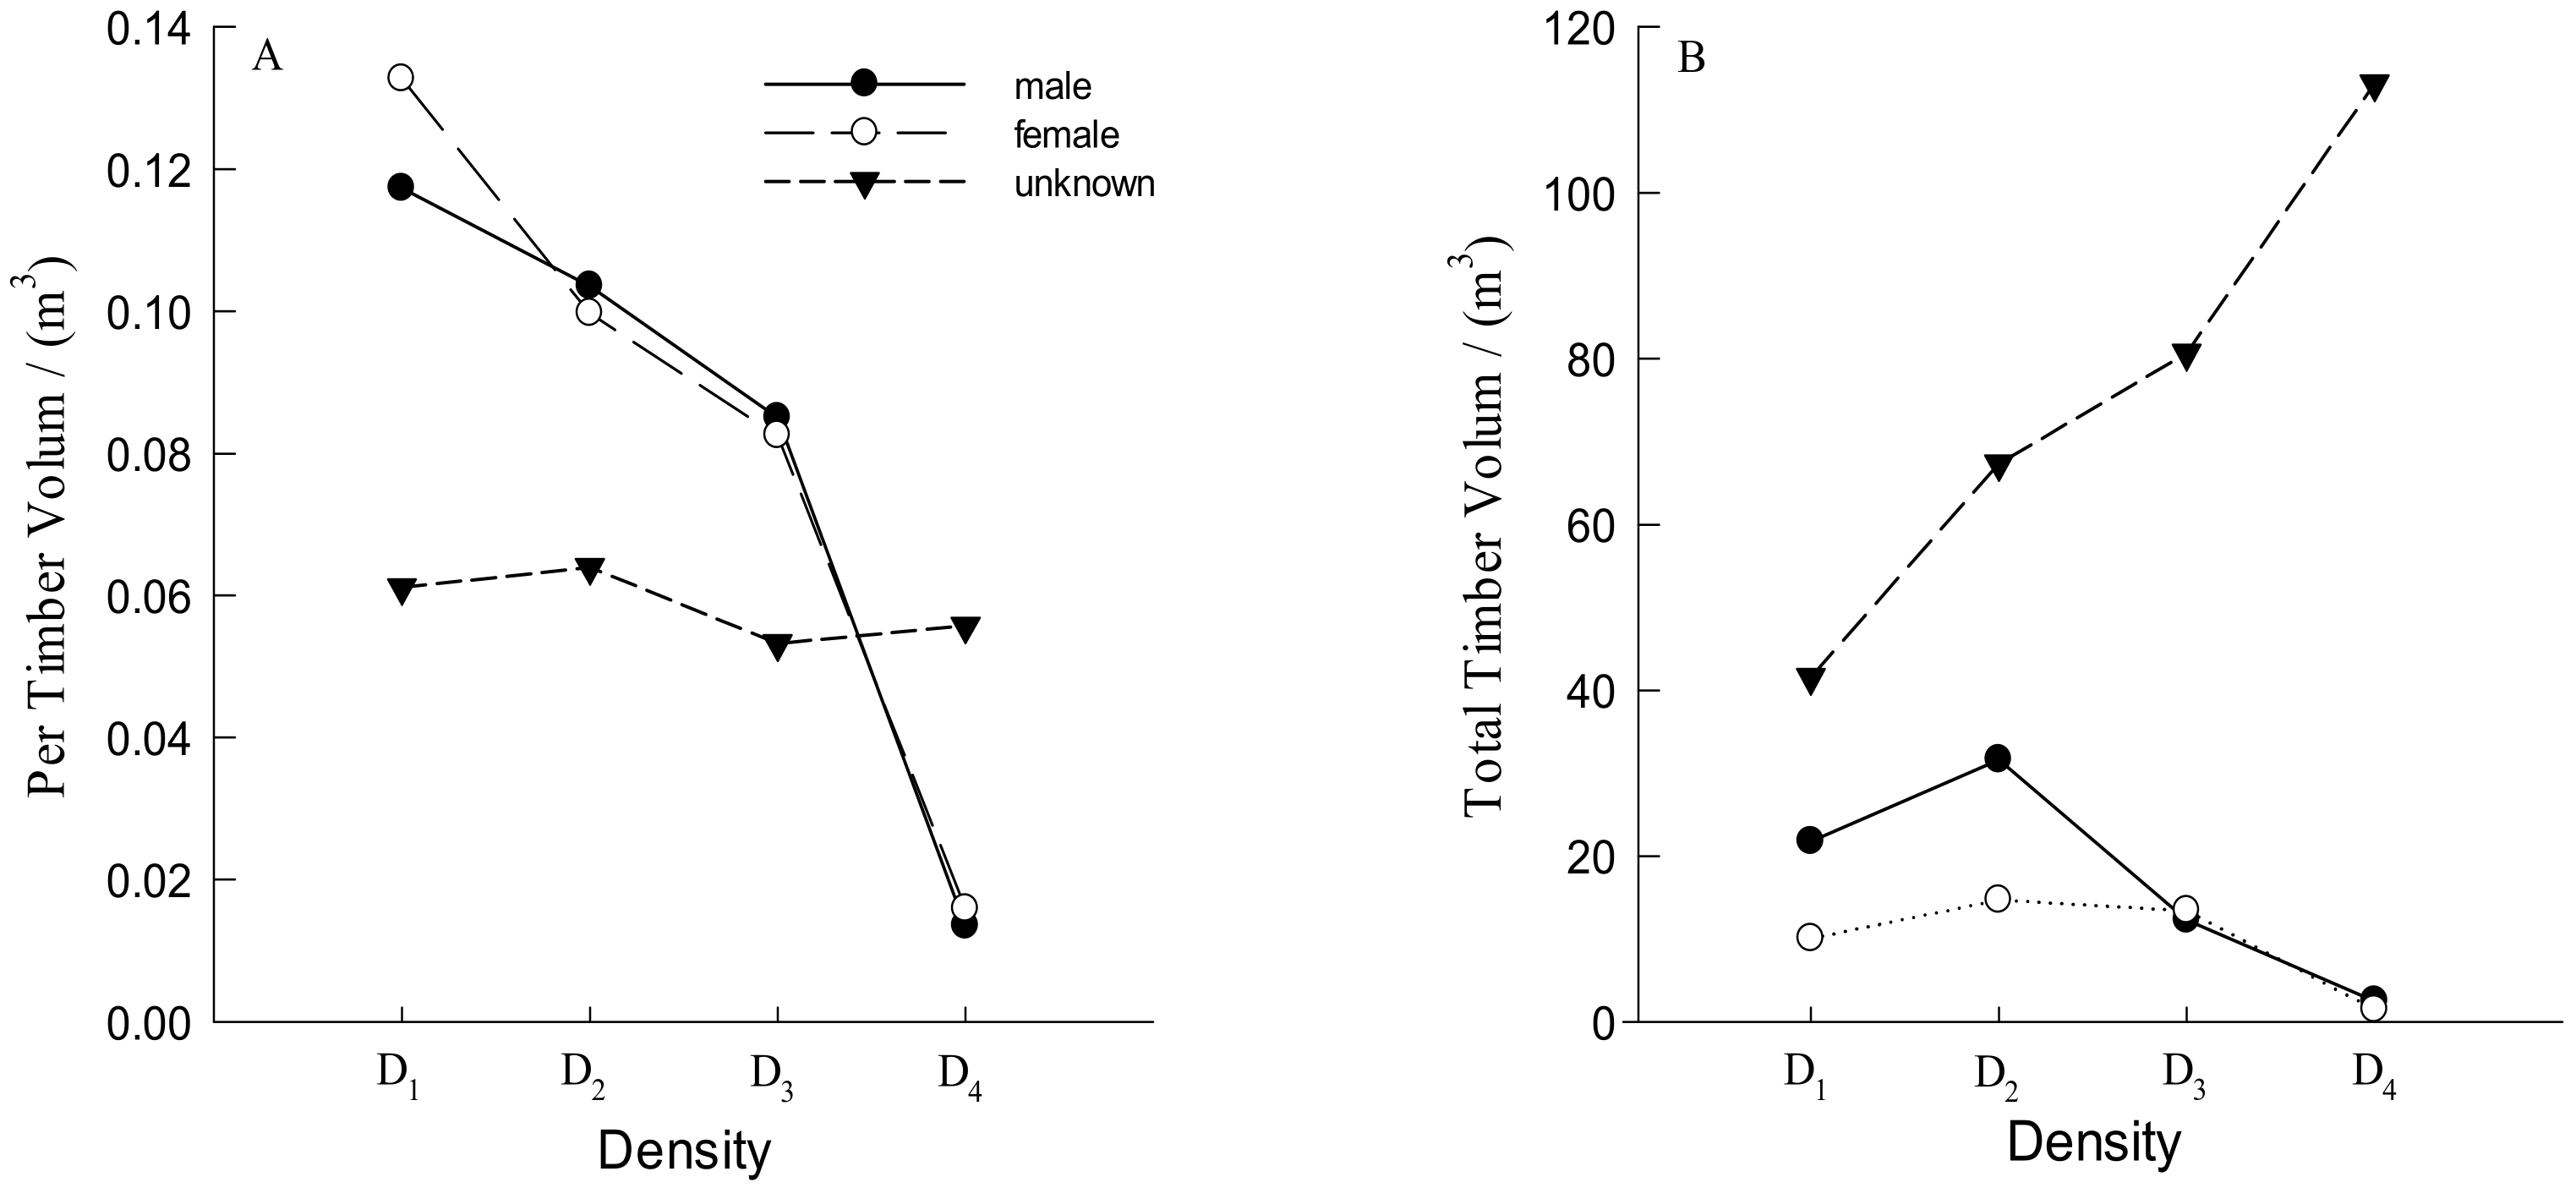
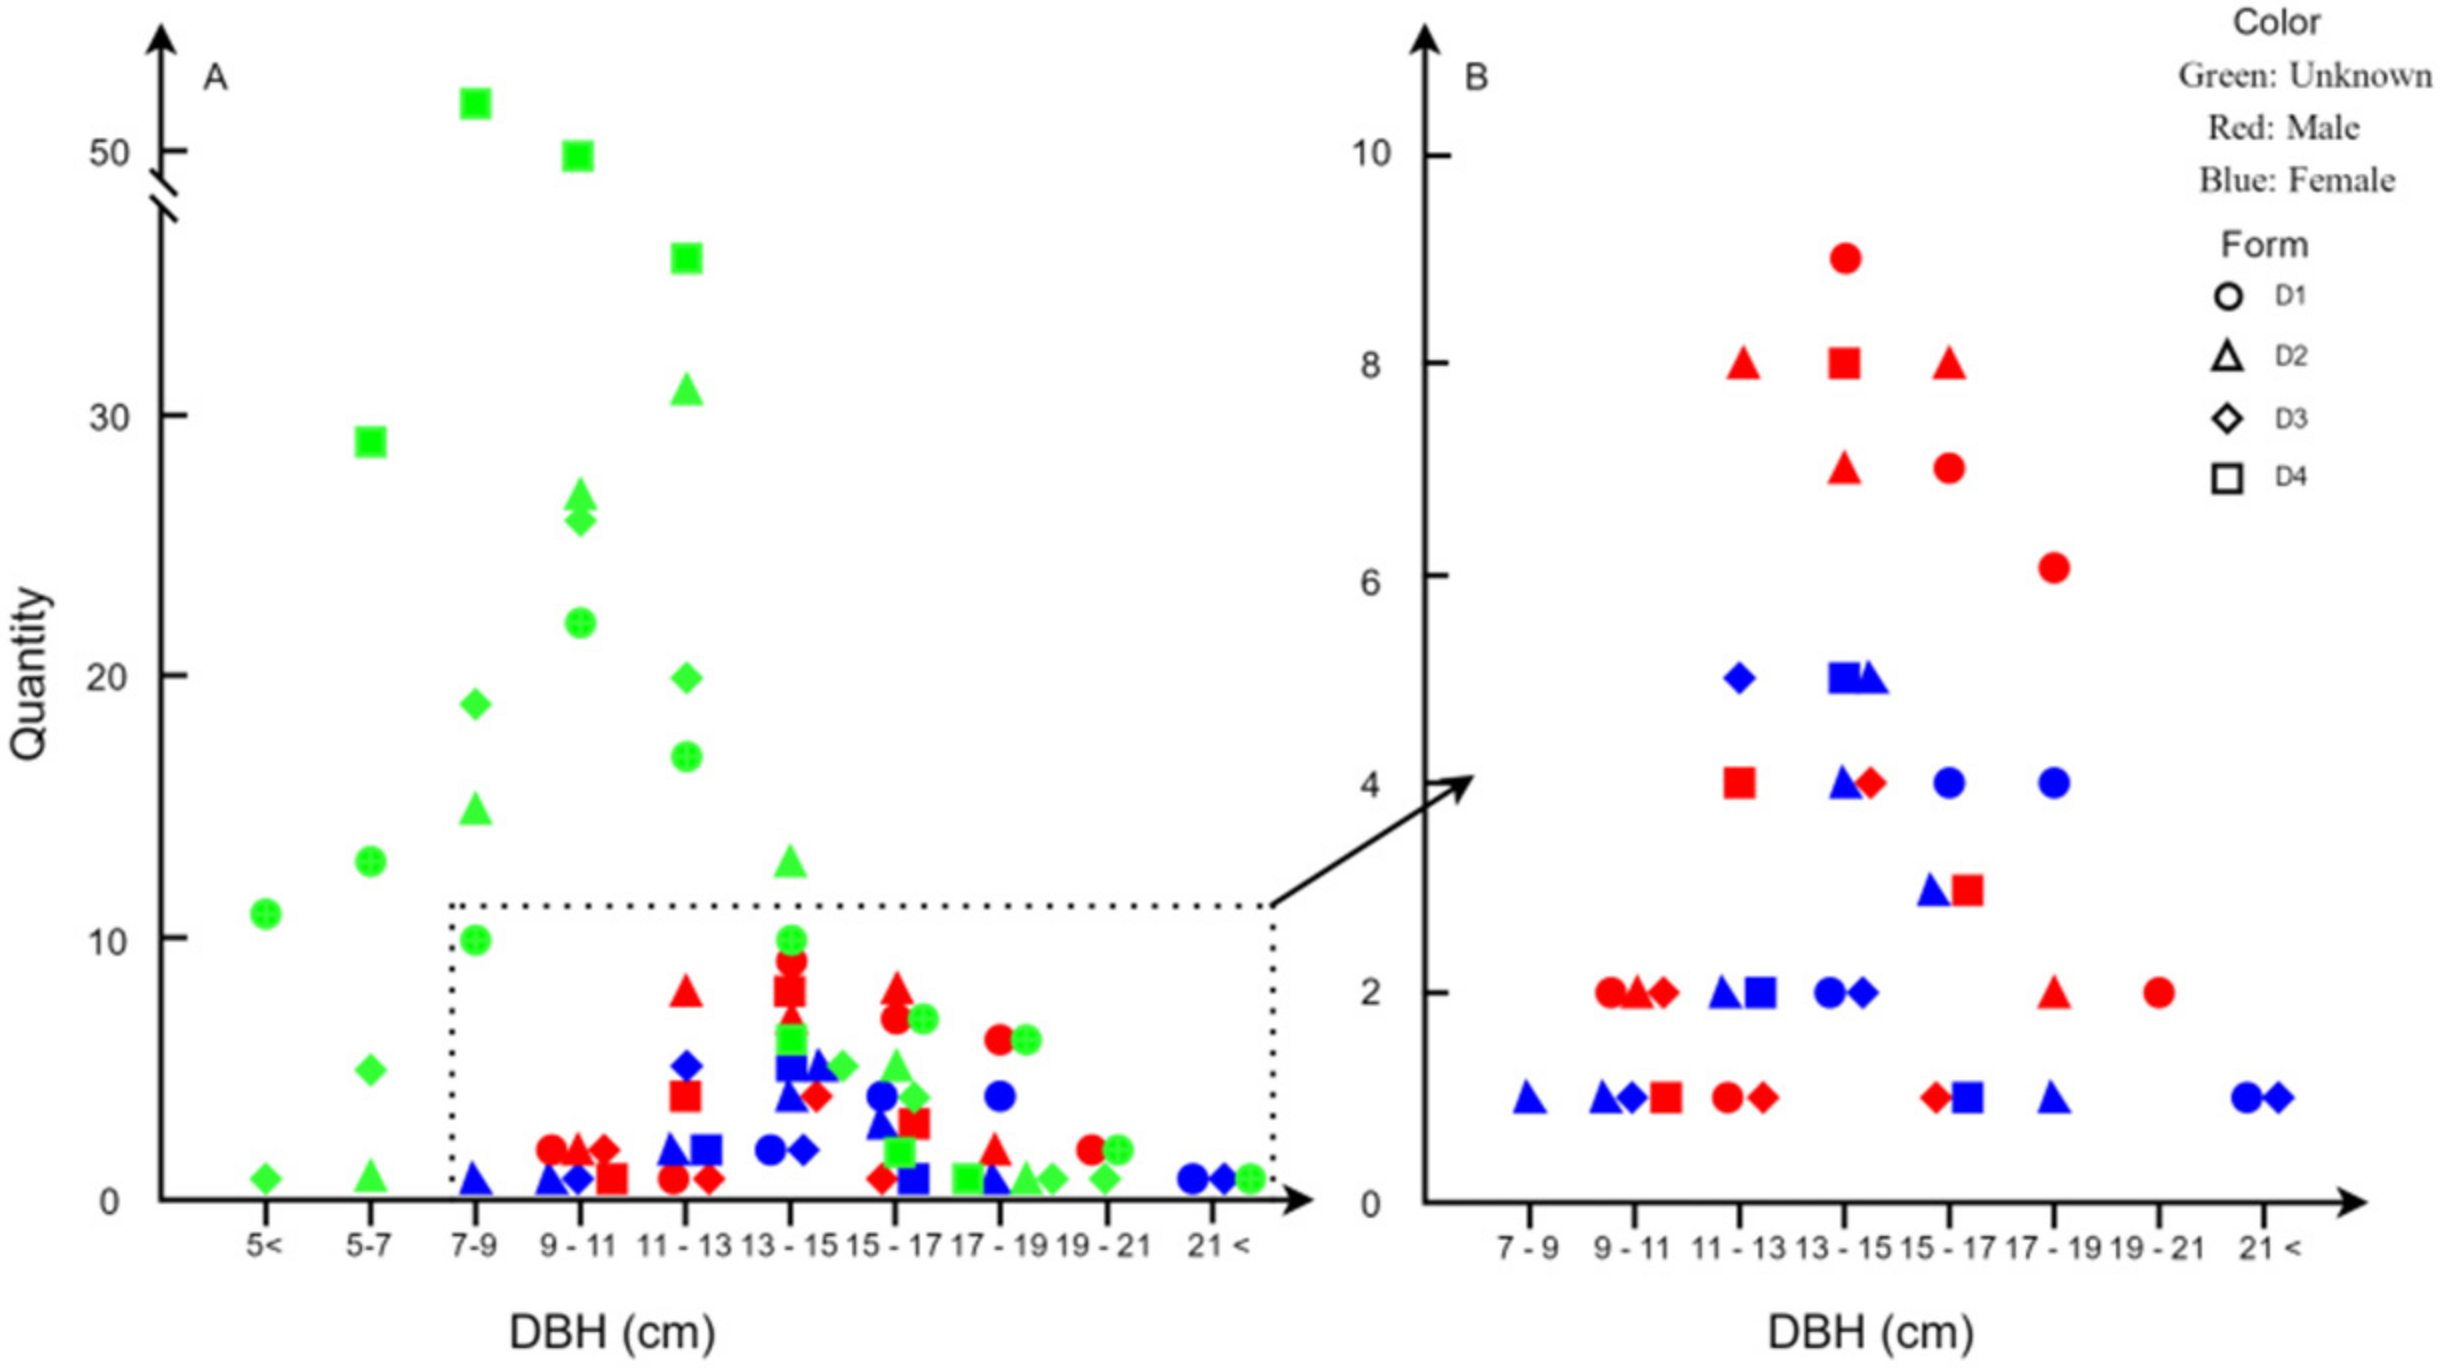
3.1. Number and Distribution of Males and Females Trees

In the early stage of gender development, the total number of males was higher than of the females, and the number of males and females gradually decreased with the increase in stand density. In addition, because the stand was in the early stage of gender development, there was a certain number of unknown individuals in each density. Low stand densities (D1, D2) had more sexually mature individuals, and the number of males was higher than females, except for in D3 (Table 2).
With the increase in density, the individual volumes of females and males gradually decreased, and the female volume was higher than the male volume in D1. The volumes per plant of females and males in D1 density were 8.69 and 8.35 times that of D4 density, respectively (Figure 1A). The timber volume of unknown individuals was lower than those with sexual organs in the D1, D2 and D3 treatments, except for in D4. The stand total volume was the concentrated expression of productivity. With the increase in density, the total volume of females and males increased first and then decreased, and the highest value was in the D2 density. The number of unknown individuals increasing led to the total timber volume increasing (Figure 1A).
The C values of males in the D1, D2 and D3 densities at all sampling scales were less than 1. They were greater than 1 under each sampling scale in the high density (D4). The C value of females in the D4 density was less than 1, and in the other densities, it was greater than 0.7. The t test showed that all the t values were less than t0.05, and it was comprehensively judged that the male plants were randomly distributed among each density. The females at different densities and sampling scales by the t test showed that the distribution was the same as that of the male plants, and it was also randomly distributed. However, in the low density stands (D1, D2), with the scale increasing, the C value gradually increased and was greater than 1 for the females. At D2, the value of C decreased as the scale increased, indicating that the females had a trend from uniform distribution to aggregation distribution (Table 3).

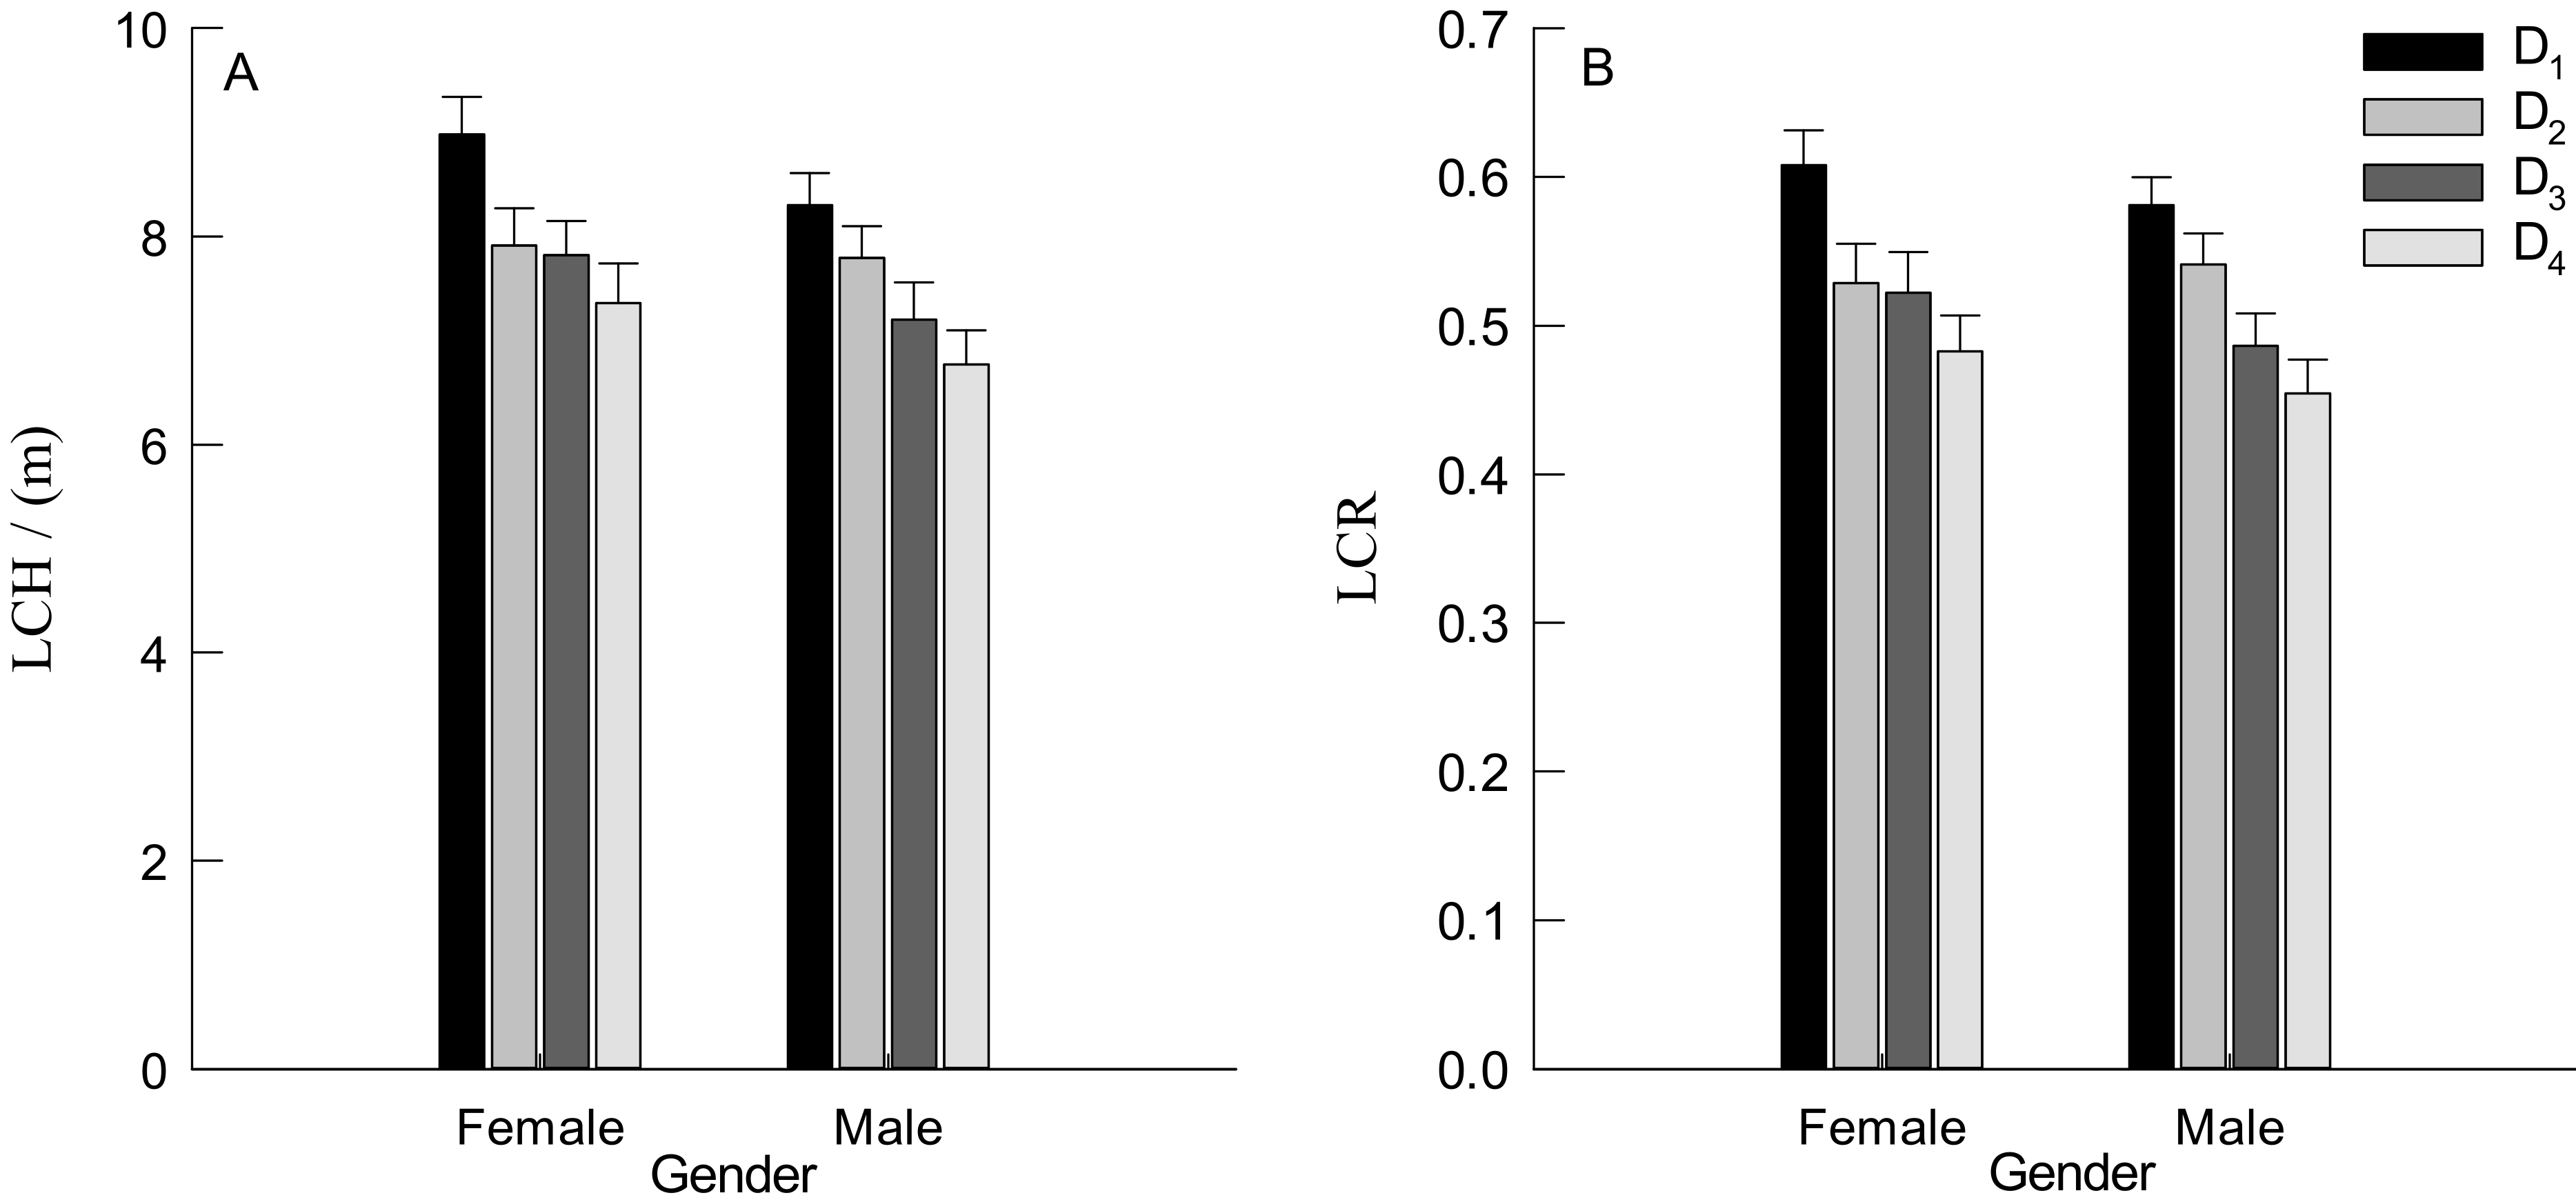
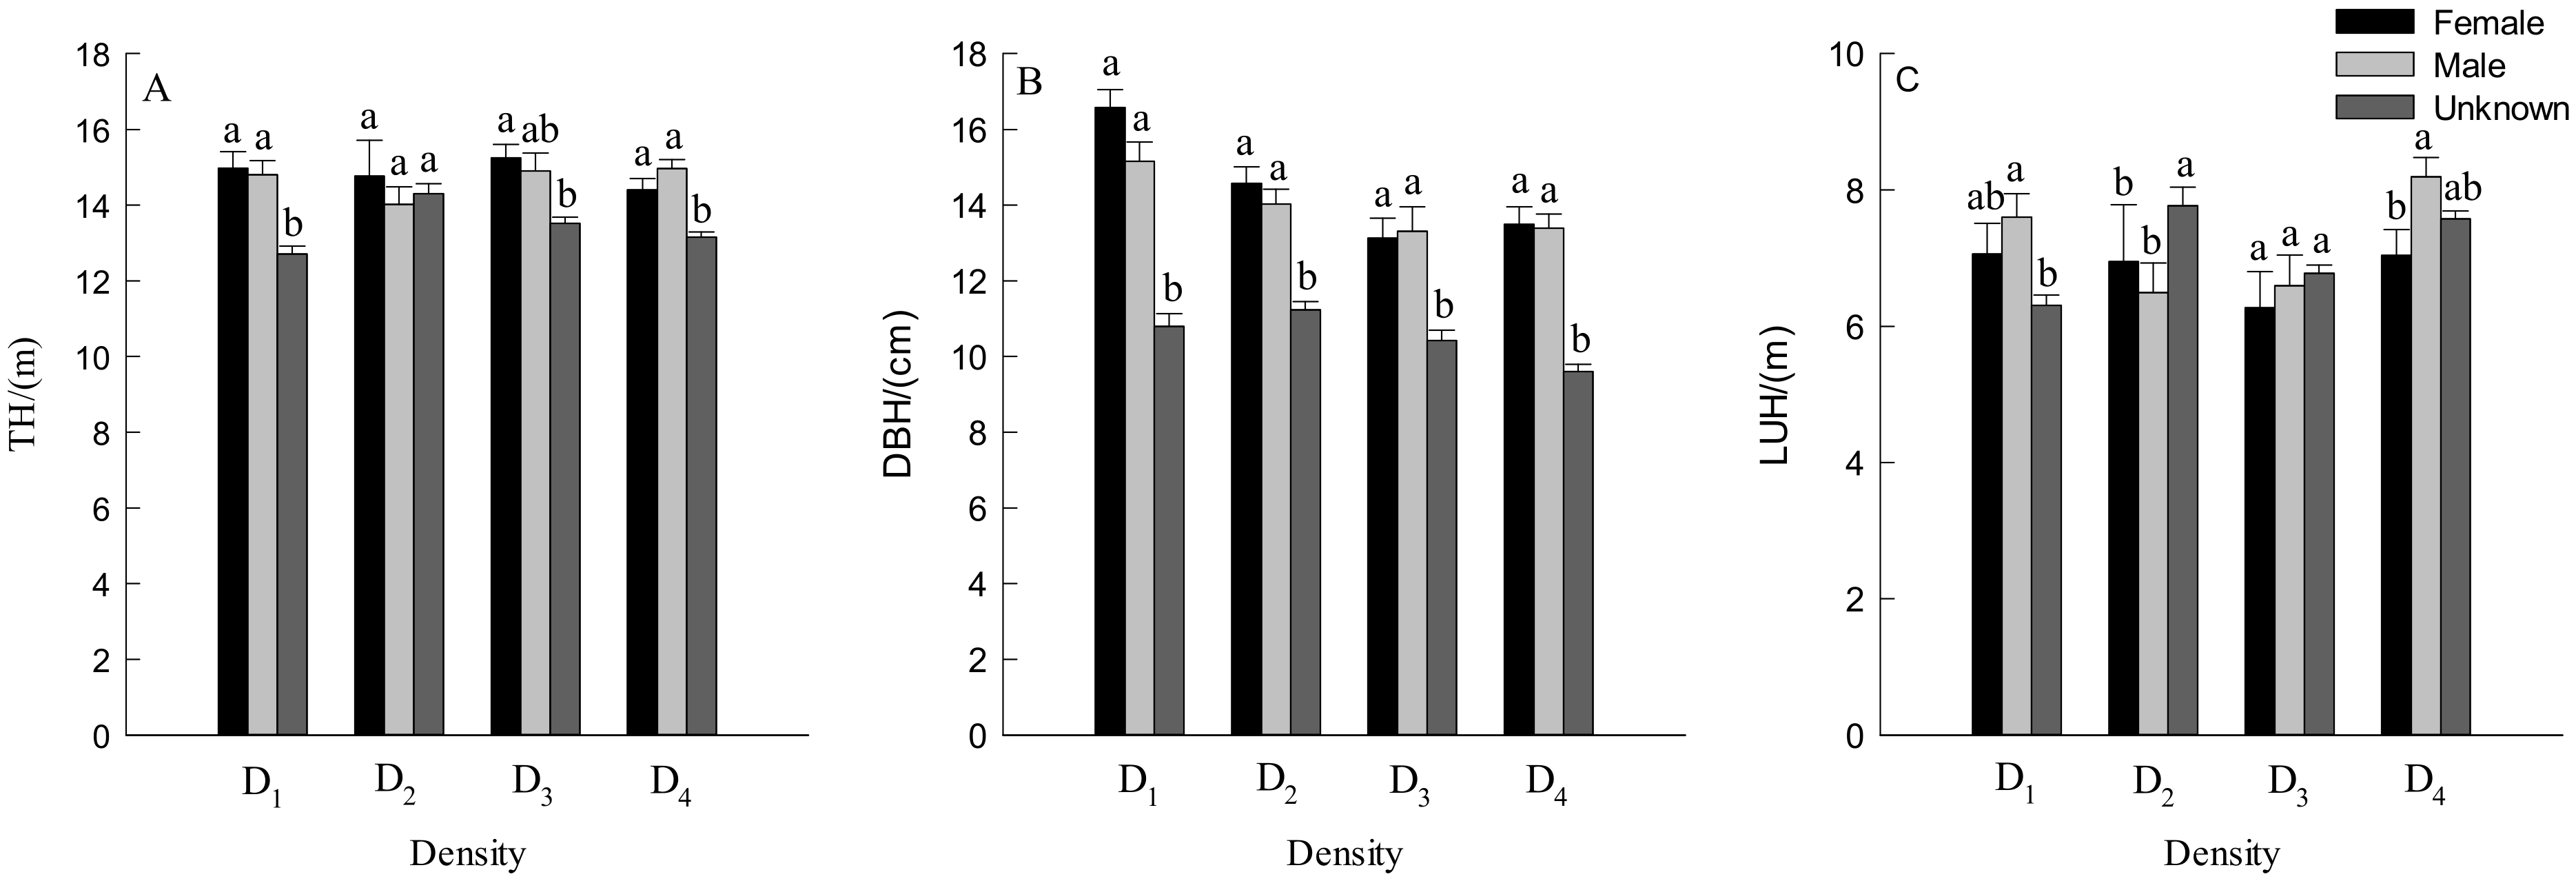
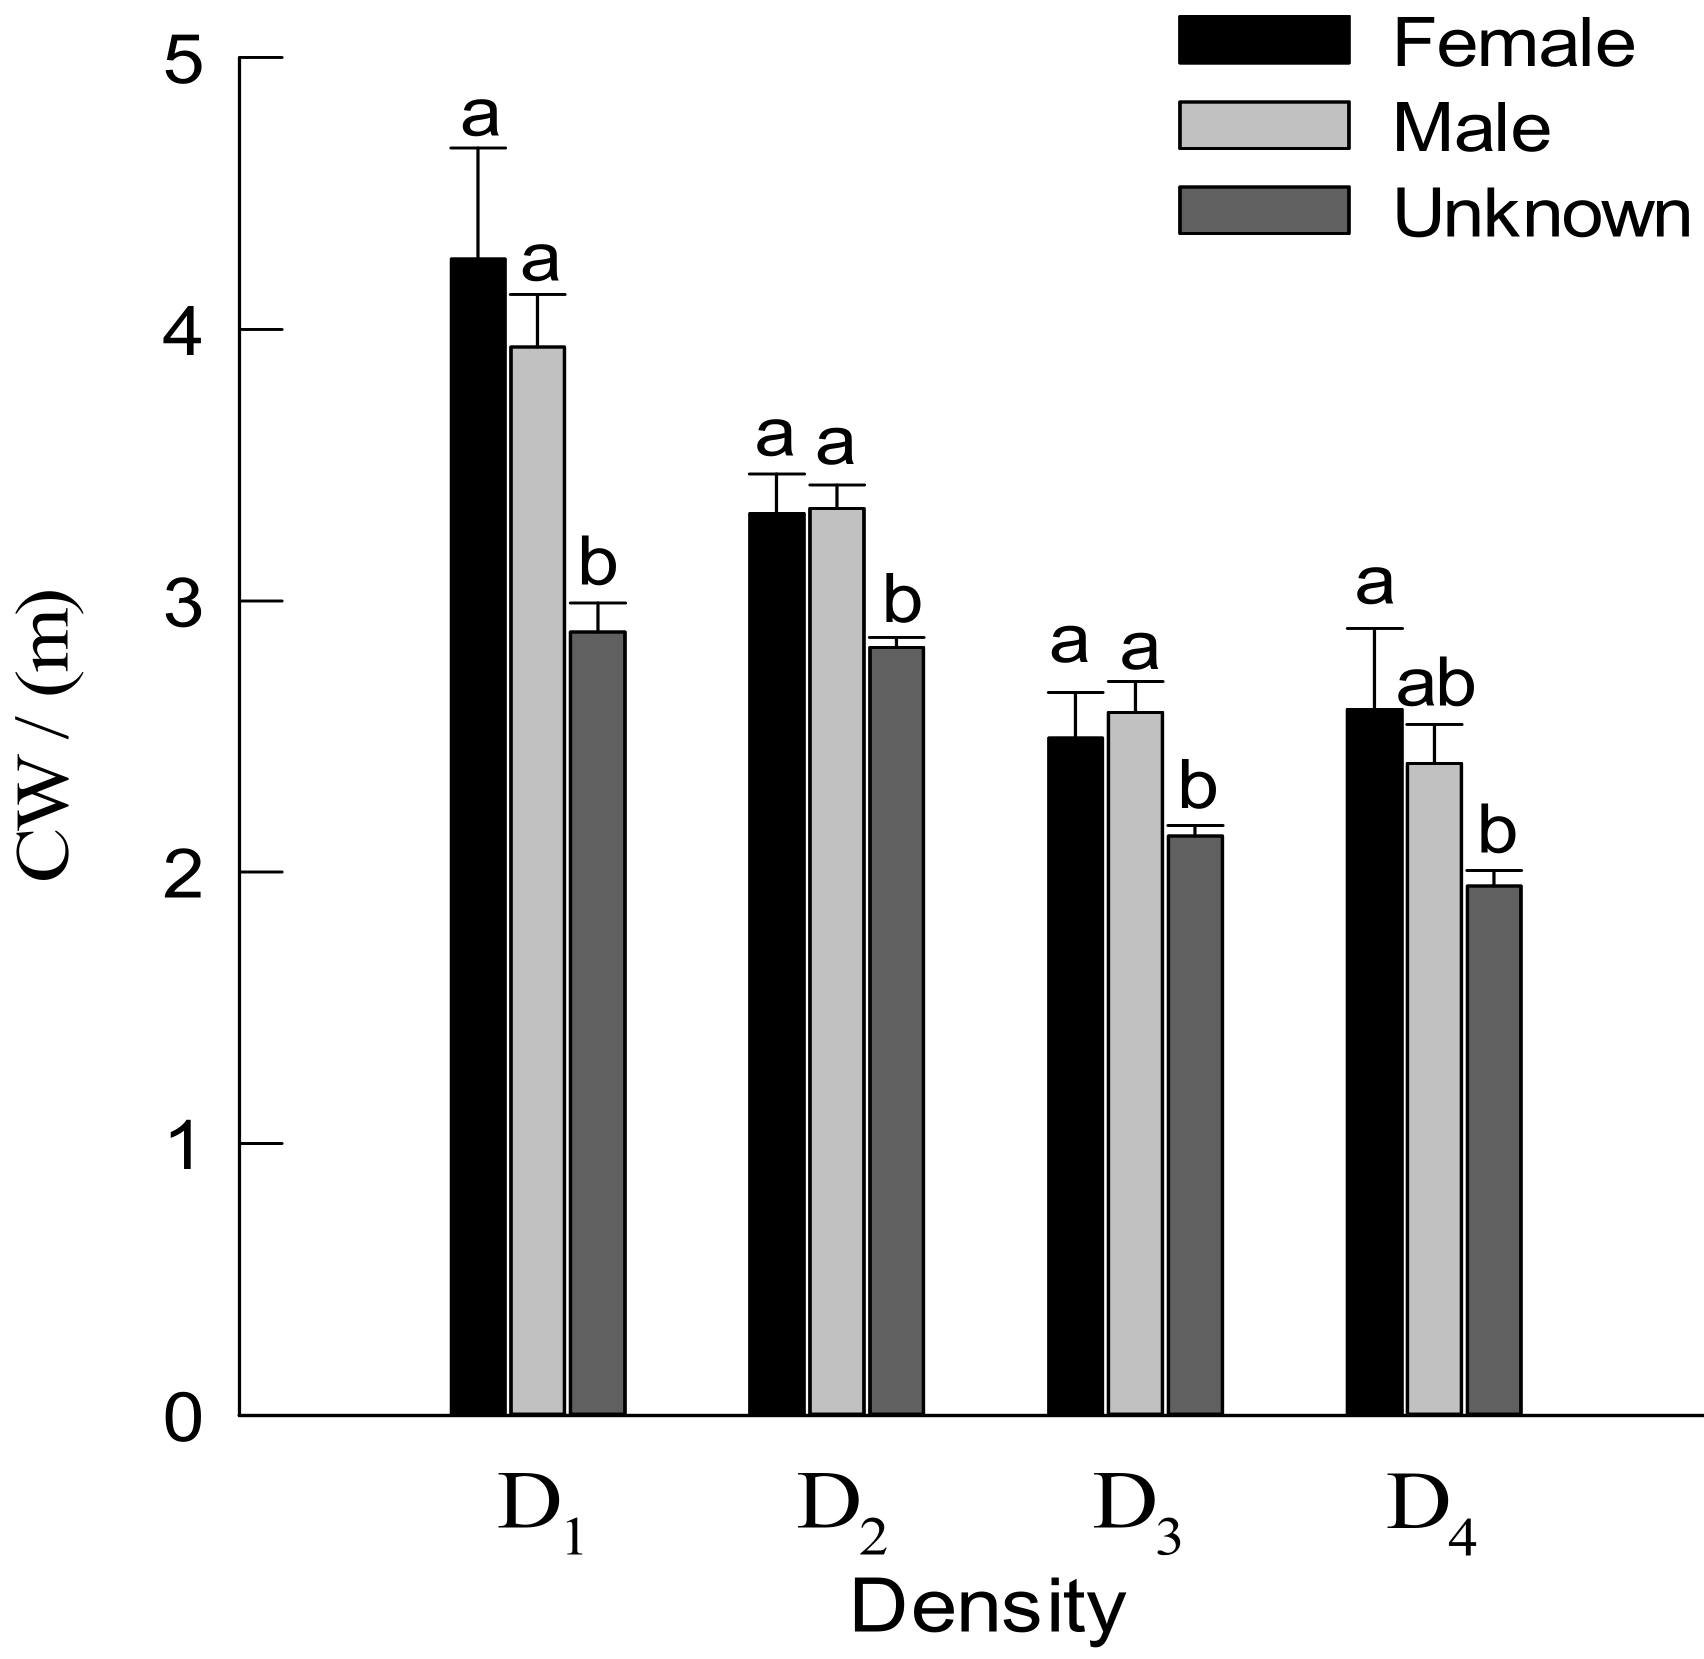
3.2. DBH, TH and Crown Traits of Males and Females Trees

The range of TH of F. mandshruia in each density was 12–16 cm. There was no significant difference in TH between males and females in the same density, but they were significantly higher than unknown individuals in the D1 and D4 densities (Figure 2A). The range of DBH with different densities was between 10–18 cm, and it gradually decreased with the increase in density. There was no significant difference in DBH between males and females within the same density, but they were significantly higher than the unknown (Figure 2B). In two extreme densities (D1 and D4), the LUH of males was higher than that of the females, and there was a significant difference in the D4 density. However, the LUH did not show a regular change (Figure 2C).
The number of unknown individuals was mostly in the small diameter class (<11 cm) and gradually decreased with the increase in DBH. The individuals of larger diameter class (>17 cm) were mostly distributed in the low densities (D1 and D2) (Figure 3A). In the distribution range of DBH, with the increase in stand density, the number of males and females presented a normal distribution (reaching the peak at 11–17 cm). The male plants had more quantitative advantages in the middle diameter class, and most of them were in the low stand densities. Individuals with larger diameter class (>17 cm) were also distributed in low density (Figure 3B).
The LCH of females and males had no significant difference among different densities, but on the whole, they all showed a decreasing trend (the highest at D3 density) (Figure 4A). The LCR of males and females were between 0.44 and 0.59, and the growth trend was similar to that of LCH (Figure 4B). With the increase in density, the CW gradually decreased. There was no significant difference in CW between males and females in the same density, but the CW of males and females was significantly higher than that of the unknown in D1–D3 densities (Figure 5).

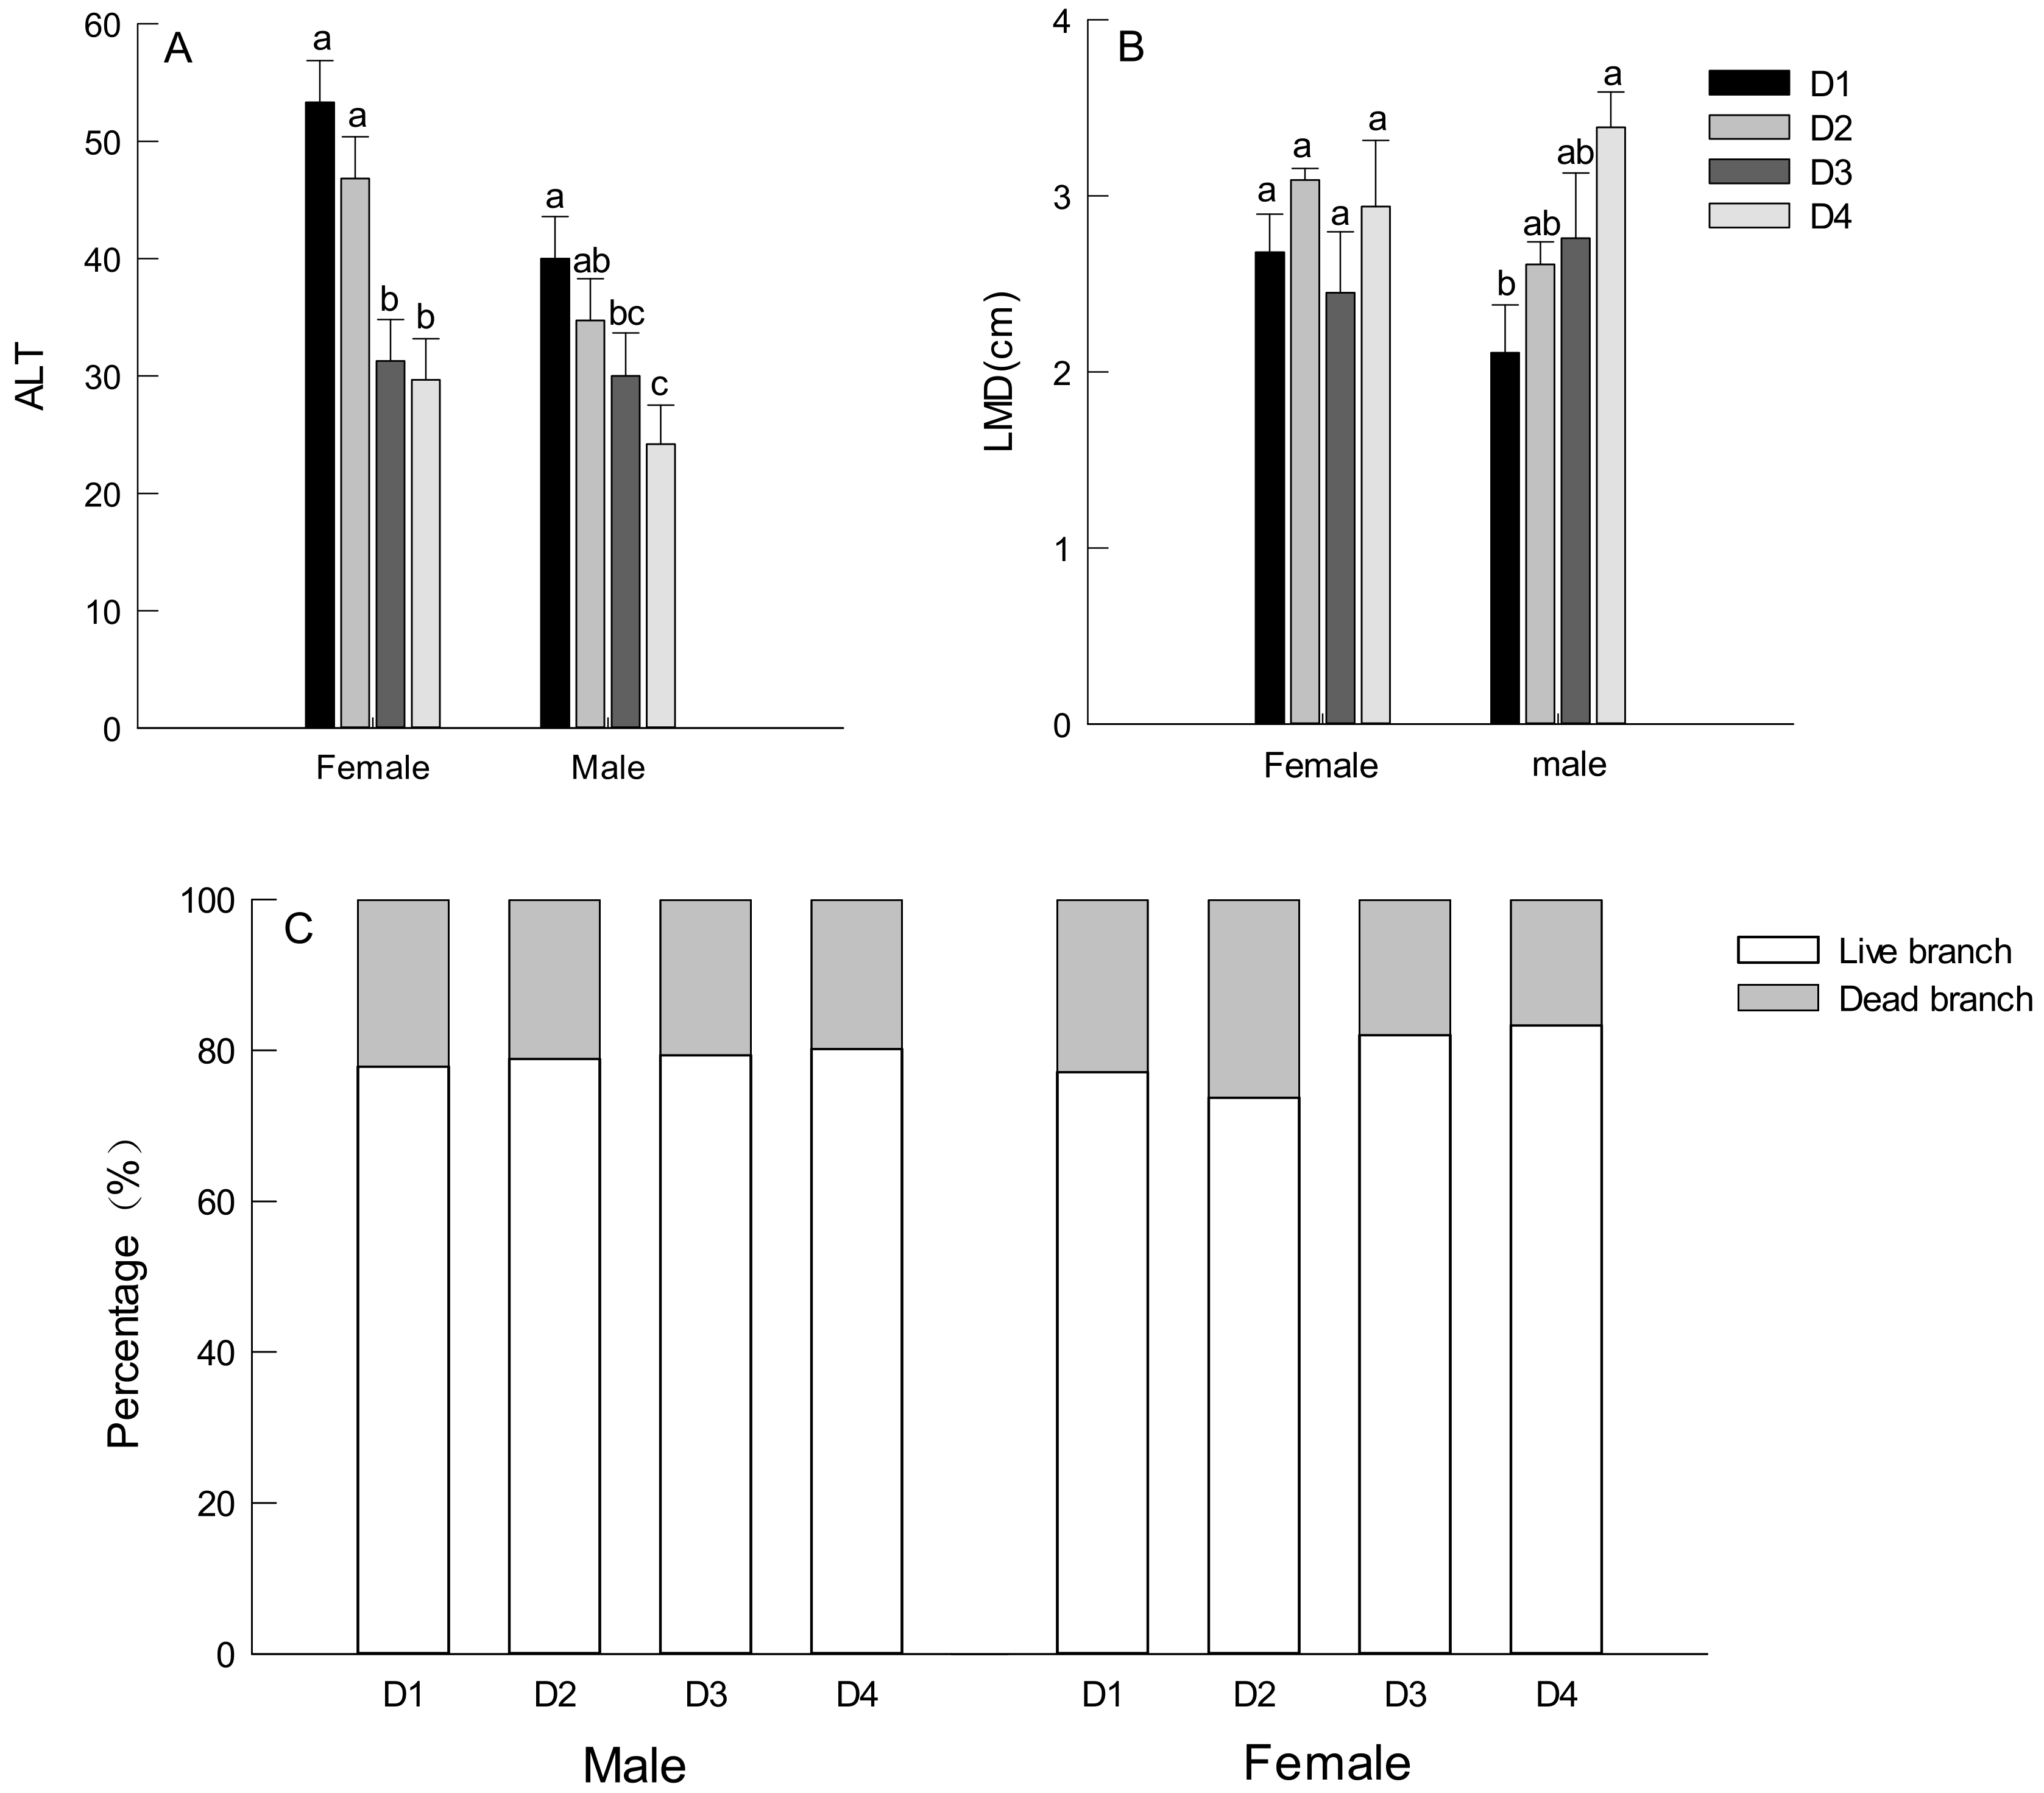
3.3. Branch Traits of Males and Females Trees

With the increase in density, the ALT of females and males gradually decreased. The ALT of females was significantly higher in low densities (D1 and D2) than that of high densities (D3 and D4) (Figure 6A). The LMD of females showed “N” shapes in four densities. Conversely, the LMD of the males increased monotonously to the increase in stand density, and there was a significant difference between high stand density (D4) and low stand density (D1) (Figure 6B). The LDP of male stands was relatively stable, accounting for 80%, and the LDP of female stands gradually increased from the increase in stand density (Figure 6C).

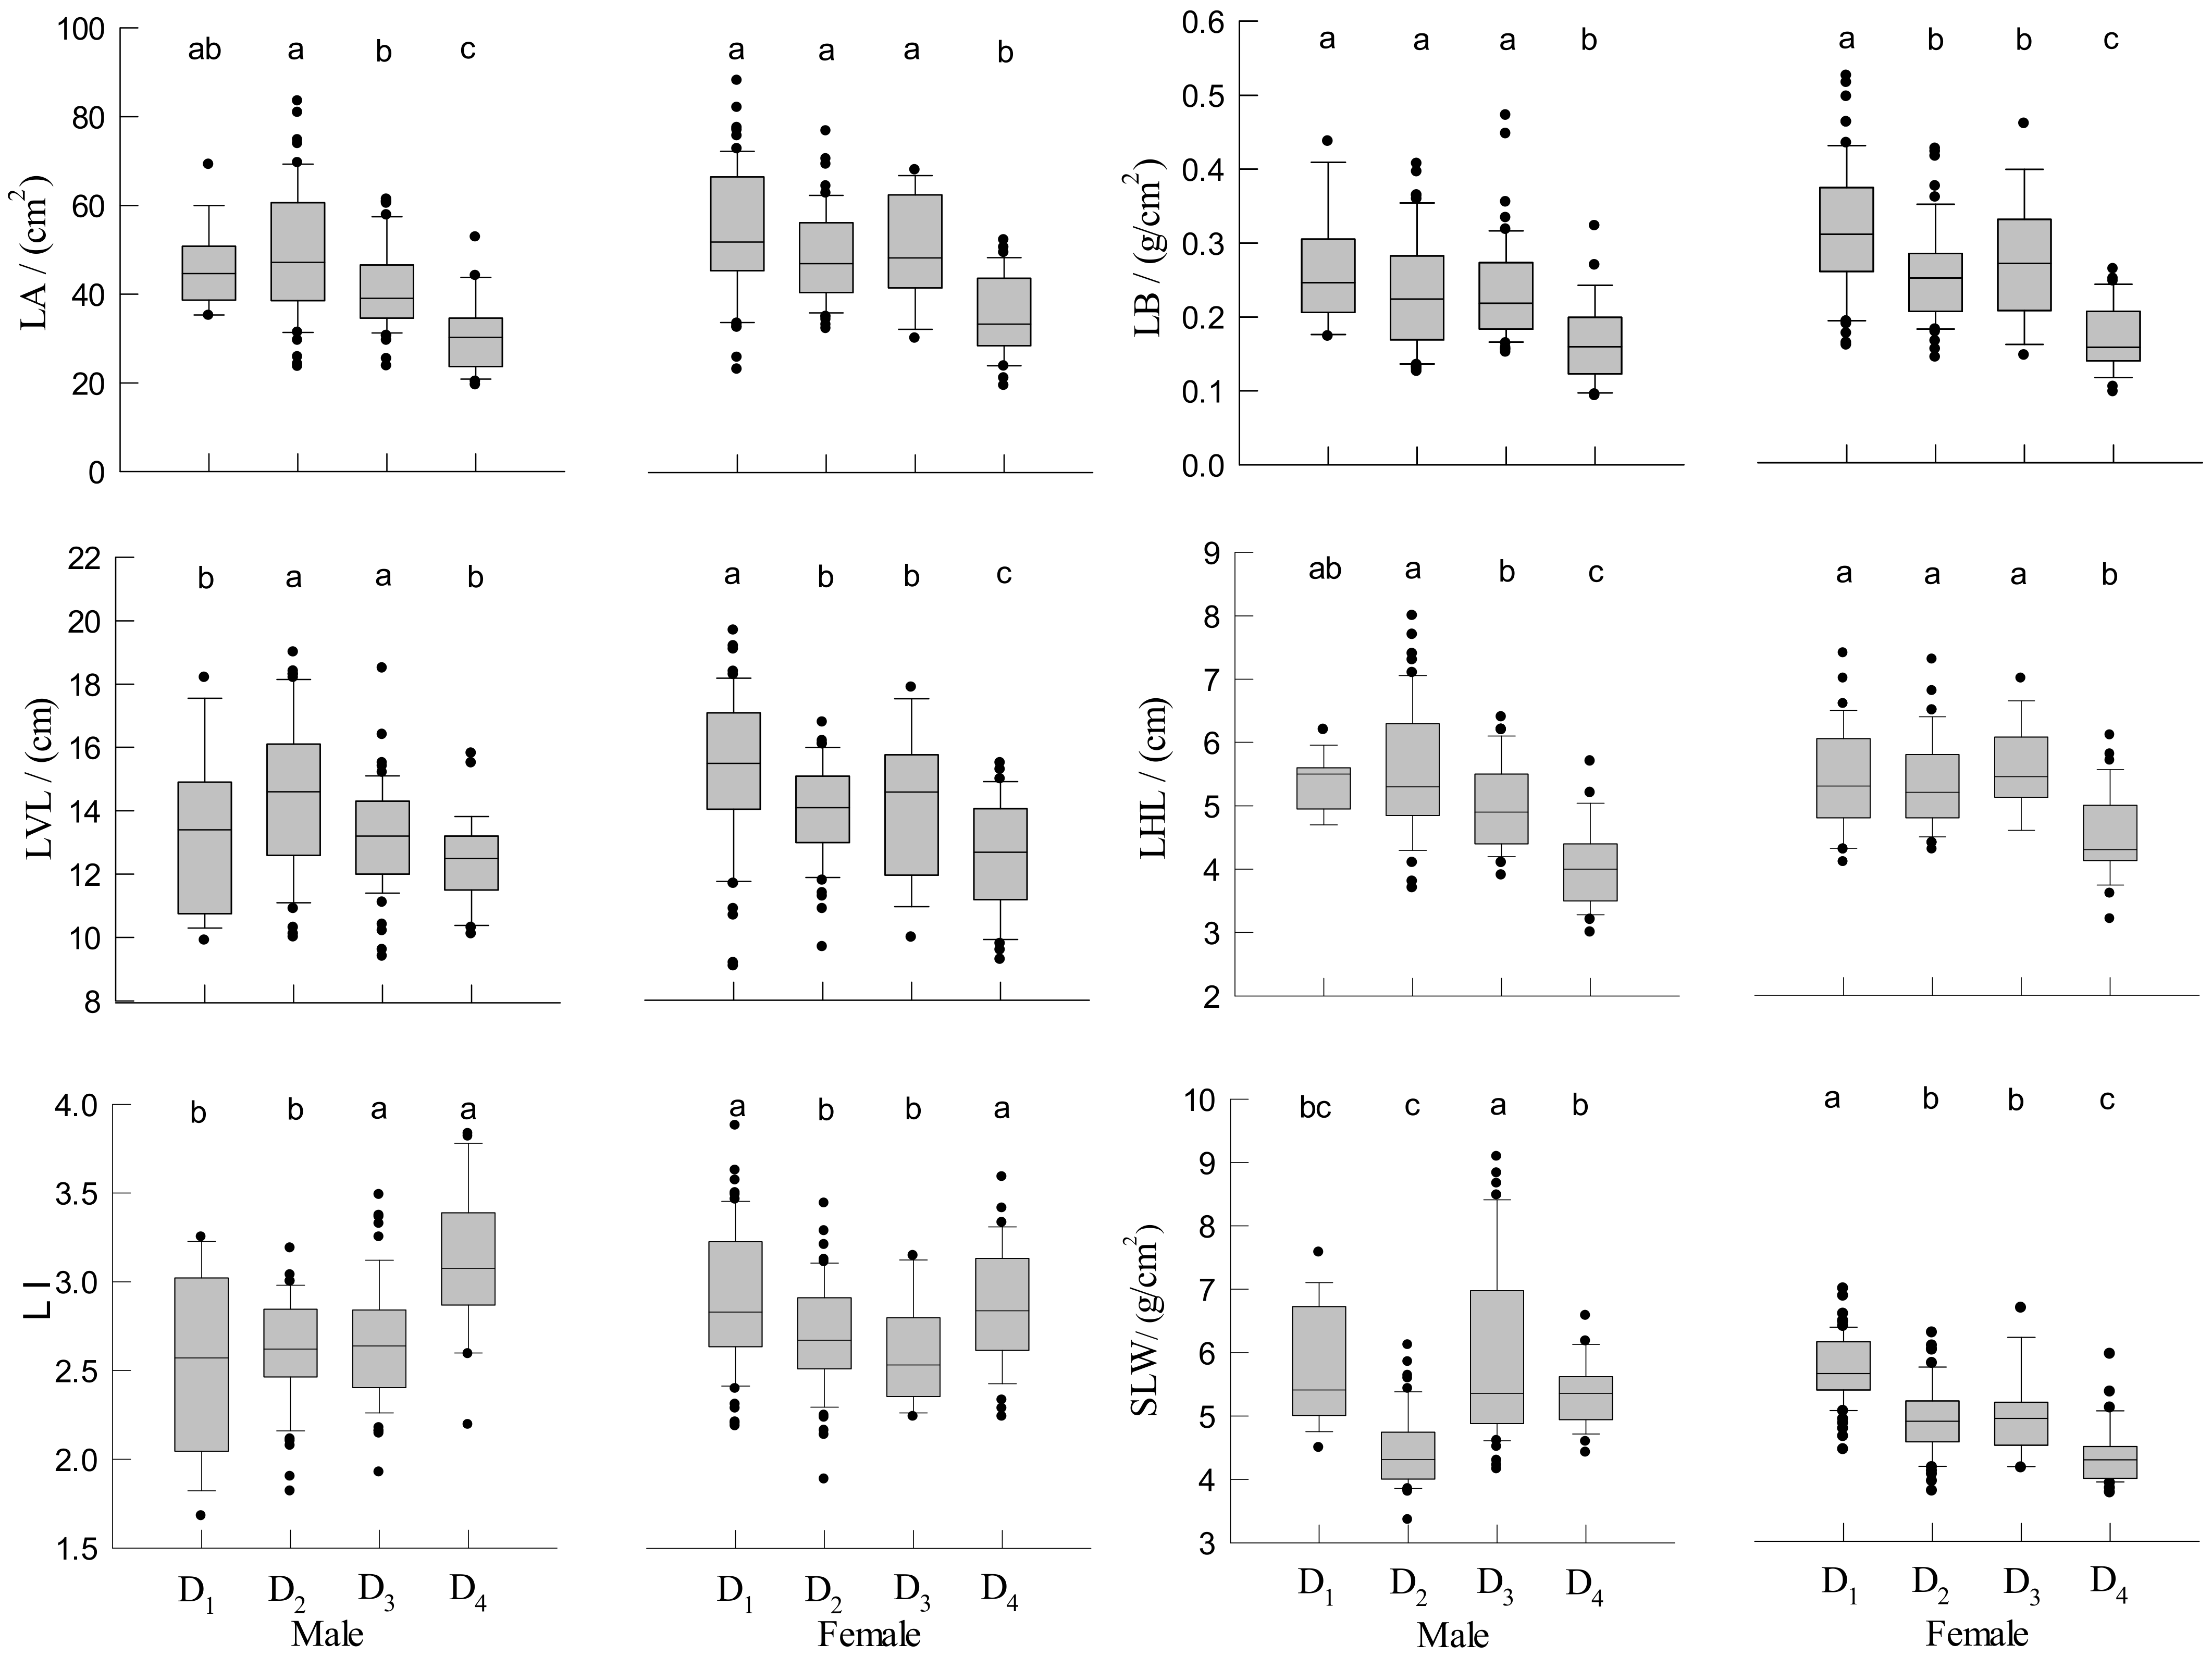
3.4. Leaf Traits of Male and Female Trees

The LA and LB of the males and females gradually decreased with the increase in density, and the LA of high density (D4) was significantly smaller than that of low density (D1). The LVL of female plants gradually decreased, while the length of male plants first increased and then decreased. The LHL of female plants was relatively stable from D1–D3 and decreased significantly to D4, while the overall male plants exhibited a monotonous decreasing trend. The LI of female plants first decreased (D1–D3) and then increased (D3–D4), whereas that of the males gradually increased. The specific leaf weight of the female plants showed a monotonous tendency to decrease, and the males first decreased (D1–D2) and then increased (D2–D4) (Figure 7).

3.5. The Influence of Density and Gender on Phenotypic Traits Variation

The stand density had a significant influence on DBH, CW and all leaf characters (p < 0.01). There were significant differences between the males and females for LVL and SLW (p < 0.05). The interaction between density and gender had significant effects on LMD, LA and LVL and extremely significant effects on LI and SLW (Table 4).
The TH of males and females were positively correlated with LCH, LCH and LCR, while LUH was negatively correlated with LCH and LCR. There was a significant negative correlation between the LMD and ALT for females. LA was positively correlated with LVL, LHL and LB. LVL was positively correlated with LI and LB. There was a significant correlation between LI and SLW (p < 0.05). TH of the males was positively correlated with LCR, LHL and LMD (p < 0.05). LA was significantly negatively correlated with DBH and CR, and LI was significantly negatively correlated with LMD and LHL (p < 0.05). LB was positively correlated with SLW and LI (p < 0.01). However, there was a significant positive correlation between the LUH of females and LCR (p< 0.05). DBH was positively correlated with CW, LHL with LVL, and LB (p < 0.01) (Table 5).

4. Discussion

4.1. The Number and Distribution of Males and Females for Different Densities

Density could have a significant impact on the gender development of F. Mandshurica Rupr. (Table 4). The tress in the low stand density can complete vegetative growth and enter reproductive growth earlier. The gender of the plants is influenced by both heredity and the environment [28,29]. However, the increase in stand density will lead to an increase in competition intensity among individuals, including light, nutrition and water, thus influencing the growth and development of the plants [10,30,31]. In natural forests with suitable habitats, the ratio of females to males of F. mandshurica has not deviated from “1:1” [23]. In this study, only the sex ratio in D3 was approximately “1:1”, and the number of males was dominant in the other densities. In addition, there was a large number of unidentified individuals (Table 2), because the stand had recently entered the stage of gender development. For dioecious plants, the difference in life history between female plants and male plants leads to their different adaptabilities to the environment [32,33], while males had stronger adaptability to the environment [34]. Thus, males preferentially develop over females. The preferential development of males can lay a foundation for the successful pollination of females [35].
The distribution pattern of the population has a great significance to the survival, development, successful reproduction, and regeneration ability of dioecious plants and maintaining the genetic diversity [36]. The adaptability of females and males to the habitats was various, and the females needed to accumulate more resources for reproductive activities [37]. The reason was that the reproduction cost and niche of dioecious plants varied between the males and females, which led to unusual patterns [38]. Zhang’s research [32] showed that the male and female trees of F. mandshurica were cluster distributed in the natural secondary forest of Changbai Mountain. Our research shows that the males and females of F. mandshurica were randomly distributed in unlikely sampling scales and stand densities. The possible reason was that the age of the stand was 25 years in this study, which was in the early stage of gender differentiation; not all individuals in the forest had entered reproductive development.

4.2. Effect of Density on Growth Traits

Previous studies have shown that there is competition for limited soil resources at different growth stages. Under the premise of constant light intensity, individuals with higher tree height (TH) and bigger crowns can accumulate nutrients relatively quickly and enter reproductive growth (mature stage) earlier [39,40]. Our study found that the diameter at breast height (DBH), the lowest angle of living main branch with the trunk (ALT), and crown width (CW) of the males and females gradually decreased with the increase in density, indicating that the competition among individuals for above-ground resources became stronger. However, in high stand density, males showed higher TH advantage, while females showed larger CW and DBH. In order to cope with environmental changes, females and males will show a certain reproductive trade-off on the premise of ensuring nutritional growth, and this trade-off will compensate the reproductive cost to a certain extent [41,42].

4.3. Effect of Density on Branch and Leaf Traits

The ALT of females and males gradually decreased, while the lowest living main branch base diameter (LMD) of males gradually increased (Figure 3A,B). In most dioecious plants, males are superior to females in growth speed and vegetative reproduction, and males tend to have higher branch yield, a thicker trunk and better tillering ability [37]. However, the change of ALT will further affect the size of CW, which can greatly help to carry out photosynthesis more fully to store nutrients to ensure growth [43]. When the competition intensity decreases, the forests have more resources to meet reproductive development; thus, there will be a larger ALT.
The responses of the leaf traits to density in the males and females were different. With the increase in density, the leaf vertical axis length (LVL) and specific leaf weight (SLW) decreased in females. However, the leaf index (LI) increased due to the gradual decrease in leaf horizontal axis length (LHL) in males (Figure 5). This showed that the leaves functional traits were more sensitive to environmental changes (such as stand density) [44]. This is because dioecious plants have differences in leaf structure and function, which promote males and females to show the most appropriate growth strategies under different environmental conditions [13]. Appropriate density adjustment can promote the accumulation of nutrients, but serried stand density will inhibit growth. For example, we found that the leaf area (LA), leaf biomass (LB) and LHL of high density (D4) were significantly lower than the other three densities. Ogawa [45] also found that the unit leaf efficiency of high density was significantly lower than that of low density, except for the number of leaves.

4.4. Factors Affecting the Growth of Males and Females

For dioecious plants, the phenotypic differences between males and females are not significant when plants enter the mature stage, or only at the flowering stage is there a discrepancy [46]. However, when the growing space of trees has changed, it will lead to a change in tree competition intensity for light and nutrients and then affect the phenotypic development of males and females, such as DBH and CW [47]. By comparison, it was found that there were significant differences between the males and females in LHL and SLW, and density significantly influenced DBH and CW. However, the interaction between density and gender enhanced the influence on LMD, LA, LI and SLW (Table 4), while gender weakened the influence of density on LHL. When the density increased, the CW and DBH gradually decreased, but the LA and SLW of males increased and the LI became narrow. However, the females had a relatively stable leaf area, which not only reduced the living under branch height (LUH) but also increased the LB. This result also confirms that dioecious trees have different coping strategies to handle competition while satisfying their own growth and development [36].
Proper stand density helps trees to grow better [48,49]. Our results showed that, in the initial stage of reproductive growth of an F. mandshurica plantation, male or female individuals will have different responses with different plantation density. This phenomenon may be found in the other dioecious species. This study is important for the density management of dioecious tree species in plantations.

5. Conclusions

This study revealed the response to phenotypic traits and distribution patterns to density with regard to male and female individuals in a Fraxinus mandshurica Rupr. plantation at the early stage of gender development. There were more sexually mature individuals in the low density, but with an increase in density, the number of sexually mature individuals gradually decreased. The males and females are randomly distributed among each density. With the increase in density, the LUH, LCR and ALT of the females were always greater than that of males. In addition, compared with the males, the females had relatively small SLW and LMD and relatively large LHL and LA at low density, but the above indicators were opposite at high density. Compared with unknown, sexually mature individuals in each density had certain growth advantages, while individuals that had not entered reproductive growth could continue to accumulate nutrients for wood growth. Comprehensive analyses showed that the initial planting density of D2 (2 × 2 m) had certain advantages on the number of individuals in the reproductive development of F. mandshurica, and the volume of unknown in this density was higher than other densities. Thus, the results of this study provide ideas about the selection of reasonable initial density in the process of cultivating dioecious tree species plantations, and they provide an important basis for achieving the best economic and genetic benefits.

Supplementary Materials

The following supporting information can be downloaded at: https://www.mdpi.com/article/10.3390/f13030472/s1, Figure S1: Schematic diagram of Fraxinus mandshurican plantation with different stand densities.

Author Contributions

Conceptualization, W.L. and Y.Z.; methodology, W.L. and Y.Z.; formal analysis, W.L. and Y.Z.; investigation, W.L., Y.Z. and Q.W.; data curation, Y.Z.; writing—original draft preparation, W.L.; writing—review and editing, X.W.; project administration, X.W. All authors have read and agreed to the published version of the manuscript.

Funding

This research was funded by the Fundamental Research Funds for the Central Universities (no. 2572021AW23; 2572020DR04).

Data Availability Statement

All relevant data are within the manuscript and Supplementary Materials.

Acknowledgments

We are especially grateful to Qingcheng Wang for the experimental stand.

Conflicts of Interest

The authors declare no conflict of interest.

Abbreviations

Tree height (TH); diameter at breast height (DBH); crown width (CW); living under branch height (LUH); living crown height (LCH); living crown ratio (LCR); the lowest living main branch base diameter (LMD); the lowest angle of living main branch with trunk (ALT); percentage of live and dead branches (LDP); leaf area (LA); leaf biomass (LB); leaf index (LI); leaf vertical axis length (LVL); leaf horizontal axis length (LHL); specific leaf weight (SLW).

References

  1. Andrews, C.M.; D’Amato, A.W.; Fraver, S.; Palik, B.; Battaglia, M.A.; Bradford, J.B. Low stand density moderates growth declines during hot droughts in semi-arid forests. J. Appl. Ecol. 2020, 57, 1089–1102. [Google Scholar] [CrossRef]
  2. Naji, H.R.; Nia, M.F.; Kiaei, M.; Abdul-Hmid, H.; Soltani, M.; Faghihi, A. Effect of intensive planting density on tree growth, wood density and fiber properties of maple (Acer velutinum Boiss.). Iforest-Biogeosciences For. 2016, 9, 325–329. [Google Scholar] [CrossRef] [Green Version]
  3. Mead, D.J. Forests for energy and the we of named trees. Crit. Rev. Plant Sci. 2015, 24, 407–421. [Google Scholar] [CrossRef]
  4. McEwan, A.; Marchi, E.; Spinelli, R.; Brink, M. Past, present and future of industrial plantation forestry and implication on future timber harvesting technology. J. For. Res. 2020, 31, 5–17. [Google Scholar] [CrossRef] [Green Version]
  5. Kerhoulas, L.P.; Kolb, T.E.; Koch, G.W. Tree size, stand density, and the source of water used across seasons by ponderosa pine in northern Arizona. For. Ecol. Manag. 2013, 289, 425–433. [Google Scholar] [CrossRef]
  6. Moore, J.R.; Dash, J.P.; Lee, J.R.; Russell, B.M.; Dungey, H.S. Quantifying the influence of seedlot and stand density on growth, wood properties and the economics of growing radiata pine. For. Int. J. For. Res. 2018, 91, 327–340. [Google Scholar] [CrossRef] [Green Version]
  7. Thurm, E.A.; Pretzsch, H. Growth–density relationship in mixed stands—Results from long-term experimental plots. For. Ecol. Manag. 2021, 483, 118909. [Google Scholar] [CrossRef]
  8. Beniušienė, L.; Šilinskas, B.; Beniušis, R.; Aleinikovas, M.; Petrauskas, E.; Varnagirytė-Kabašinskienė, I. Scots Pine Stem Parameters in Sites with Different Stand Densities in Lithuania. Forests 2020, 11, 716. [Google Scholar] [CrossRef]
  9. Zhao, D.H.; Kane, M.; Borders, B.E. Growth responses to planting density and management intensity in loblolly pine plantations in the southeastern USA lower coastal plain. Ann. For. Sci. 2011, 68, 625–635. [Google Scholar] [CrossRef] [Green Version]
  10. Trouvé, R.; Bontemps, J.D.; Seynave, I.; Collet, C.; Lebourgeois, F. Stand density, tree social status and water stress influence allocation in height and diameter growth of Quercus petraea (Liebl.). Tree Physiol. 2015, 35, 1035–1046. [Google Scholar] [CrossRef] [PubMed] [Green Version]
  11. Cregg, B.M.; Dougherty, P.M.; Hennessey, T.C. Growth and wood quality of young loblolly pine trees in relation to stand density and climatic factors. Can. J. For. Res. 1988, 18, 851–858. [Google Scholar] [CrossRef]
  12. Brunner, A.; Forrester, D.I. Tree species mixture effects on stem growth vary with stand density—An analysis based on individual tree responses. For. Ecol. Manag. 2020, 473, 118334. [Google Scholar] [CrossRef]
  13. Korgiopoulou, C.; Bresta, P.; Nikolopoulos, D.; Karabourniotis, G. Sex-specific structural and functional leaf traits and sun-shade acclimation in the dioecious tree Pistacia vera (Anacardiaceae). Funct. Plant Biol. 2019, 46, 649–659. [Google Scholar] [CrossRef]
  14. Renner, S.S.; Ricklefs, R.E. Dioecy and its correlates in the flowering plants. Am. J. Bot. 1995, 82, 596–606. [Google Scholar] [CrossRef] [Green Version]
  15. Renner, S.S. The relative and absolute frequencies of angiosperm sexual systems: Dioecy, monoecy, gynodioecy, and an updated online database. Am. J. Bot. 2014, 101, 1588–1596. [Google Scholar] [CrossRef] [PubMed] [Green Version]
  16. Yang, Y.; He, X.; Xu, X.; Yang, D.M. Scaling relationships among twig components are affected by sex in the dioecious tree Populus cathayana. Trees 2015, 29, 737–746. [Google Scholar] [CrossRef]
  17. Zhang, X.; Zhang, C.; Zhao, X. Biomass allocation patterns and allometric relationships between components of the androdioecious Acer tegmentosum. Ann. For. Sci. 2016, 73, 729–739. [Google Scholar] [CrossRef] [Green Version]
  18. Kersten, B.; Pakull, B.; Fladung, M. Genomics of sex determination in dioecious trees and woody plants. Trees 2017, 31, 1113–1125. [Google Scholar] [CrossRef]
  19. Gao, L.S.; Zhang, C.Y.; Zhao, X.H.; Gadow, K.V. Gender-related climate response of radial growth in dioecious Fraxinum mandshurica trees. Tree-Ring Res. 2010, 66, 105–112. [Google Scholar] [CrossRef]
  20. Tanis, S.R.; McCullough, G.G.; Cregg, B.M. Effects of paclobutrazol and fertilizer on the physiology, growth and biomass allocation of three Fraxinus species. Urban For. Urban Green 2015, 14, 590–598. [Google Scholar] [CrossRef]
  21. Bochenek, G.M.; Eriksen, B. Annual growth of male and female individuals of the Common Ash (Fraxinus excelsior L.). Plant Ecol. Divers. 2010, 3, 47–57. [Google Scholar] [CrossRef]
  22. Salako, V.K.; Kenou, C.; Daainou, K.; Assogbadjo, A.E.; Kakai, R.G. Impacts of land use types on spatial patterns and neighbourhood distance of the agroforestry palm Borassus aethiopum Mart. in two climatic regions in Benin, West Africa. Agrofor. Syst. 2019, 93, 1057–1071. [Google Scholar] [CrossRef]
  23. Zhang, X.N.; Zhang, C.Y.; Zhao, X.H. Effect of sex ratio, habitat factors and neighborhood competition on stem growth in the dioecious tree Fraxinus mandshurica. Ecol. Res. 2014, 29, 309–317. [Google Scholar] [CrossRef]
  24. Zhang, C.Y.; Zhao, X.H.; Gao, L.S.; Klaus, V.G. Gender-related distributions of Fraxinus mandshurica in secondary and old-growth forests. Acta Oecologica 2010, 36, 55–62. [Google Scholar] [CrossRef]
  25. Allen, M.G.; Burkhart, H.E. Growth-density relationships in Loblolly Pine plantations. For. Sci. 2019, 65, 250–264. [Google Scholar] [CrossRef]
  26. Masinda, M.M.; Li, F.; Liu, Q.; Sun, L.; Hu, T.X. Prediction model of moisture content of dead fine fuel in forest plantations in Maoer Mountain, Northeast China. J. For. Res. 2021, 32, 2023–2035. [Google Scholar] [CrossRef]
  27. Kershaw, K.A. An Empirical Approach to the Estimation of Pattern Intensity from Density and Cover Data. Ecology 1970, 52, 729–734. [Google Scholar] [CrossRef]
  28. Charlesworth, D. Plant sex determination and sex chromosomes. Heredity 2002, 80, 94–101. [Google Scholar] [CrossRef]
  29. Stehlik, I.; Friedman, J.; Barrett, S.C.H. Environment influence on primary sex ratio in a dioecious plant. Proc. Natl. Acad. Sci. USA 2008, 205, 10847–10852. [Google Scholar] [CrossRef] [PubMed] [Green Version]
  30. Akers, M.K.; Kane, M.; Zhao, D.H.; Teskey, R.O.; Daniels, R.F. Effect of planting density and cultural intensity on stand and crown attributes of mid-rotation loblolly pine plantations. For. Ecol. Manag. 2013, 310, 468–475. [Google Scholar] [CrossRef]
  31. Truax, B.; Fortier, J.; Gagnon, D.; Lambert, F. Planting density and site effects on stem dimensions, stand productivity, biomass partitioning, carbon stocks and soil nutrient supply in Hybrid poplar plantations. Forests 2018, 9, 293. [Google Scholar] [CrossRef] [Green Version]
  32. Litrico, I.; Maurice, S. Resources, competition and selfing: Their influence on reproductive system evolution. Evol. Ecol. 2013, 27, 923–936. [Google Scholar] [CrossRef]
  33. Nanami, S.; Kawaguchi, H.; Yamakura, T. Sex ratio and gender-dependent neighboring effects in Podocarpus nagi, a dioecious tree. Plant Ecol. 2005, 177, 209–222. [Google Scholar] [CrossRef]
  34. Melnikova, N.V.; Borkhert, E.V.; Snezhkina, A.V.; Kudryavtseva, A.V.; Dmitriev, A.A. Sex-Specific response to stress in populus. Front. Plant Sci. 2017, 8, 1827. [Google Scholar] [CrossRef] [Green Version]
  35. Delph, C. The Effects of Gender and plant architecture on allocation to flowers in dioecious Silene latifolia (Caryophyllaceae). Int. J. Plant Sci. 1996, 157, 493–500. [Google Scholar]
  36. Garbarino, M.; Weisberg, P.J.; Bagnara, L.; Urbinati, C. Sex-related spatial segregation along environmental gradients in the dioecious conifer, Taxus baccata. For. Ecol. Manag. 2015, 358, 122–129. [Google Scholar] [CrossRef] [Green Version]
  37. Iszkulo, G.; Broatynski, A. Initial period of sexual maturity determines the greater growth rate of male over female in the dioecious tree Juniperus communis subsp. Communis. Acta Oecologica-Int. J. Ecol. 2011, 37, 99–102. [Google Scholar] [CrossRef]
  38. Devaney, J.L.; Jansen, M.A.K.; Whelan, P.M. Spatial patterns of natural regeneration in stands of English yew (Taxus baccata L.); Negative neighbourhood effects. For. Ecol. Manag. 2014, 321, 52–60. [Google Scholar] [CrossRef]
  39. Walcroft, A.; Le Roux, X.; Diaz-Espejo, A.; Dones, N.; Sinoquet, H. Effects of crown development on leaf irradiance, leaf morphology and photosynthetic capacity in a peach tree. Tree Physiol. 2020, 22, 929–938. [Google Scholar] [CrossRef] [PubMed] [Green Version]
  40. Matthews, G.; Hangartner, S.; Chapple, D.G.; Connallon, T. Quantifying maladaptation during the evolution of sexual dimorphism. Proc. R. Soc. B Biol. Sci. 2019, 286, 20191372. [Google Scholar] [CrossRef] [PubMed] [Green Version]
  41. Slate, M.L.; Rosenstiel, T.N.; Eppley, S.M. Sex-specific morphological and physiological differences in the moss Ceratodon purpureus (Dicranales). Ann. Bot. 2017, 120, 845–854. [Google Scholar] [CrossRef] [PubMed]
  42. Zhang, D.-Y.; Jiang, X.-H. Size-dependent resource allocation and sex allocation in herbaceous perennial plants. J. Evol. 2002, 15, 74–83. [Google Scholar] [CrossRef]
  43. Chmura, D.J.; Rahman, M.S.; Tjoelker, M.G. Crown structure and biomass allocation patterns modulate aboveground productivity in young loblolly pine and slash pine. For. Ecol. Manag. 2007, 243, 219–230. [Google Scholar] [CrossRef]
  44. Pacey, E.K.; Maherali, H.; Husband, B.C. Endopolyploidy is associated with leaf functional traits and climate variation in Arabidopsis thaliana. Am. J. Bot. 2020, 107, 993–1003. [Google Scholar] [CrossRef] [PubMed]
  45. Ogawa, T.; Oikawa, S.; Hirose, T. Leaf dynamics in growth and reproduction of Xanthium canadense as influenced by stand density. Ann. Bot. 2015, 116, 807–819. [Google Scholar] [CrossRef] [PubMed] [Green Version]
  46. Mckown, A.D.; Klápště, J.; Guy, R.D.; Soolanayakanahally, R.Y.; Mantia, J.L.; Porth, I.; Skyba, O.; Unda, F.; Douglas, C.J.; EI-Kassaby, Y.A.; et al. Sexual homomorphism in dioecious trees: Extensive tests fail to detect sexual dimorphism in Populus. Sci. Rep. 2018, 8, 1831. [Google Scholar] [CrossRef]
  47. Farooq, T.H.; Wu, W.J.; Tigabu, M.; Ma, X.Q.; He, Z.M.; Rashid, M.H.U.; Gilani, M.M.; Wu, P.F. Growth, Biomass Production and Root Development of Chinese fir in Relation to Initial Planting Density. Forests 2019, 10, 236. [Google Scholar] [CrossRef] [Green Version]
  48. Wu, C.P.; Jiang, B.; Yuan, W.G.; Shen, A.H.; Yang, S.Z.; Yao, S.H.; Liu, J.J. On the Management of Large-Diameter Trees in China’s Forests. Forests 2020, 11, 111. [Google Scholar] [CrossRef] [Green Version]
  49. Roessiger, J.; Ficko, A.; Clasen, C.; Griess, V.C.; Knoke, T. Variability in growth of trees in uneven-aged stands displays the need for optimizing diversified harvest diameters. Eur. J. For. Res. 2016, 135, 283–295. [Google Scholar] [CrossRef]
Figure 1. Per plant and total timber volume of F. mandshurica at different densities. (A) The variation of timber volume for each female, male and unknown plants for the four densities. (B) The variation of total timber volume for each female, male and unknown plants for the four densities.
Forests 13 00472 g001
Figure 2. Differences in TH (tree height), DBH (diameter at breast height) and LUH (living under branch height) of F. mandshurica within each stand density. (A) Differences in the TH of female plants, male plants and undifferentiated individuals within different forest densities. (B) Differences in the DBH of female plants, male plants, and undifferentiated individuals within different forest densities. (C) The difference in LUH of female plants, male plants and undifferentiated individuals. The different lowercase letters in the figure indicate that at the level of α = 0.05, the difference between different individuals within the same density is significant (p < 0.05). The error bar represents the SE (standard error).
Forests 13 00472 g002
Figure 3. Quantity distribution of DBH for F. mandshurica with different stand densities. (B) Enlarged view of the dotted part of (A), which excludes unknown trees. Males are red color and females are blue. Density D1 is represented by round shape, D2 by triangle, D3 by rhombus, and D4 by square.
Forests 13 00472 g003
Figure 4. The influence of stand density on LCH (living crown height) and LCR (living crown ratio). (A) Difference of LCH between males and females in different densities. (B) Difference of LCR between males and females in different densities. The error bar represents the standard error (SE).
Forests 13 00472 g004
Figure 5. The influence of stand density on the CW (crown width). Difference of CW between male, female and unknown in different densities. The different lowercase letters in the figure indicate that at the level of α = 0.05, the difference between different individuals within the same density is significant (p < 0.05). The error bar represents the standard error (SE).
Forests 13 00472 g005
Figure 6. The influence of stand density on branches traits. (A) The ALT (the lowest angle of living main branch with trunk) between males and females in different densities. (B) The LMD (the lowest living main branch base diameter) between males and females in different densities. (C) The proportion of live branches and dead branches of males and females in each stand density. The different lowercase letters in the figure indicate that at the level of α = 0.05, the differences between different individuals within the same density is significant (p < 0.05). The error bar represents the SE (standard error).
Forests 13 00472 g006
Figure 7. Leaf phenotype traits of males and females on four densities. The different lowercase letters in the figure indicate that at the level of α = 0.05, the difference in leaf traits between different densities of the same sex is significant (p < 0.05). Abbreviation: LA (leaf area); LB (leaf biomass); LI (leaf index); LVL (leaf vertical axis length); LHL (leaf horizontal axis length); SLW (specific leaf weight).
Forests 13 00472 g007
Table 1. Basic status of four densities of a Fraxinus mandshurica plantation (2018).
Density TypePlant Space × Row SpaceOriginal Density
(Quantity/hm2)
Current Density
(Quantity/ha)
Survival Rate
D11.5 m × 3.0 m2200941 ± 710.8
D22.0 m × 2.0 m25001505 ± 1010.9
D31.5 m × 1.5 m44001823 ± 1030.9
D41.0 m × 1.0 m10,0002308 ± 610.9
Table 2. The percentage of males and females in each density.
DensityMales (%)Females (%)Unknown (%)
D119.718.0372.26
D220.309.7769.92
D37.928.9183.16
D48.004.0088.00
Table 3. The type of distribution of Fraxinus mandshurica female and male trees in four stand densities.
DensityScale (m)Ctt0.05Type
MaleFemaleMaleFemaleMaleFemaleMaleFemale
D16 m × 6 m0.790.92−0.84−0.322.072.07RandomRandom
6 m × 12 m0.801.09−0.550.242.202.20RandomRandom
12 m × 12 m0.791.10−0.400.192.572.57RandomRandom
12 m × 24 m0.931.51−0.090.634.304.30RandomRandom
D26 m × 6 m0.730.92−0.91−0.282.072.07RandomRandom
6 m × 12 m0.530.75−1.11−0.602.202.20RandomRandom
12 m × 12 m0.121.31−1.400.502.572.57RandomRandom
12 m × 24 m0.251.46−0.750.464.304.30RandomRandom
D36 m × 6 m0.620.74−1.11−0.762.072.07RandomRandom
6 m × 12 m0.571.13−0.860.252.202.20RandomRandom
12 m × 12 m0.500.70−0.79−0.472.572.57RandomRandom
12 m × 24 m0.501.00−0.504.304.30RandomRandom
D46 m × 6 m1.120.640.42−1.222.072.07RandomRandom
6 m × 12 m1.140.520.32−1.142.202.20RandomRandom
12 m × 12 m1.750.501.19−0.792.572.57RandomRandom
12 m × 24 m1.800.130.8−0.884.304.30RandomRandom
Table 4. The influence of density and gender on phenotype traits.
SourceDfP
DBHTHLUHCWLCHLCRALTLMDLALBLVLLHLLISLW
Density30.00 **0.810.120.00 **0.200.130.080.990.00 **0.00 **0.00 **0.00 **0.00 **0.00 **
Gender10.320.790.310.610.300.240.170.810.100.980.03 *0.310.750.04 *
D × G30.700.420.420.650.940.690.840.04 *0.04 *0.080.03 *0.080.00 **0.00 **
* 0.01 < p < 0.05, ** p < 0.01.
Table 5. Correlation of phenotypic traits of male and female trees in F. mandshurica.
THDBHLUHLCHLCRCWLMDALTLALVLLHLLILB
DBH0.22 (0.26)
LUH−0.06 (0.03)0.03 (0.29)
LCH0.64 ** (0.518 **)0.11 (−0.10)−0.80 ** (−0.88 **)
LCR0.44 * (0.25)0.03 (−0.22)−0.92 ** (−0.96 **)0.97 ** (0.96 **)
CW0.03 (0.21)0.34 (0.55 **)0.16 (0.45 *)−0.10 (−0.27)−0.14 (−0.37)
LMD0.27 (0.09)0.04 (0.33)0.02 (−0.17)0.15 (0.19)0.11 (0.18)−0.08 (−0.09)
ALT0.20 (−0.16)−0.20 (−0.29)0.03 (−0.23)0.08 (0.11)0.03 (0.18)−0.43 * (−0.06)−0.40 (−0.66 **)
LA0.17 (0.27)−0.15750.12 (0.22)0.02 (−0.40)−0.01 (−0.13)−0.01260.06 (0.23)0.35 (−0.11)
LVL0.03 (0.18)−0.33 (0.18)−0.12 (0.10)0.11 (0.01)0.13 (−0.50)−0.30 (−0.12)−0.21 (0.30)0.34 (−0.19)0.84 ** (0.84 **)
LHL0.20 (0.30)−0.36 (0.36)0.18 (0.12)−0.02 (0.06)−0.06 (−0.02)−0.30 (0.10)0.39 * (0.20)0.10 (−0.01)0.68 ** (0.84 **)0.26 (0.55 **)
LI−0.10 (−0.04)−0.06 (−0.09)−0.23 (0.04)0.12 (−0.06)0.16 (−0.07)−0.07 (−0.23)−0.0720.27 (−0.20)0.35 (0.25)0.78 ** (0.68 **)0.096
LB0.18 (0.29)−0.18 (0.29)−0.01 (0.21)0.11 (−0.12)0.08 (−0.12)−0.45 (−0.01)−0.07 (0.30)0.41 * (−0.19)0.75 ** (0.96 **)0.79 ** (0.90 **)0.31 (0.75 **)0.55 ** (0.38)
SLW0.14 (0.04)0.22 (0.04)−0.13 (−0.04)0.19 (0.05)0.16 (0.04)−0.16 (−0.27)−0.15 (0.28)0.28 (−0.27)0.02 (−0.01)0.25 (0.26)−0.28 (−0.16)0.44 * (0.41 *)0.67 ** (0.27)
Note: The correlation coefficients among the traits of females are shown in parentheses; the correlation coefficients among the traits of males are shown out of parentheses. * Indicates a significant correlation at the 0.05 level; ** indicates a significant correlation at the 0.01 level.
Publisher’s Note: MDPI stays neutral with regard to jurisdictional claims in published maps and institutional affiliations.

