Article

Experiencing Urban Green and Blue Spaces in Urban Wetlands as a Nature-Based Solution to Promote Positive Emotions

Jilin Provincial Key Laboratory of Municipal Wastewater Treatment, Changchun Institute of Technology, Changchun 130012, China
*
Author to whom correspondence should be addressed.
Forests 2022, 13(3), 473; https://doi.org/10.3390/f13030473
Submission received: 13 February 2022 / Revised: 14 March 2022 / Accepted: 16 March 2022 / Published: 18 March 2022
(This article belongs to the Section Forest Economics, Policy, and Social Science)

Abstract

:
Green and blue spaces are nature-based solutions (NBSs) that evoke positive emotions of experiencers therein. There is an impetus to optimize wetland forest landscapes by planning the geographical arrangement of metrics that promote positive emotion. The facial expressions of nature experiencers in photos, downloaded from social media databases with landscape metrics, were evaluated for emotions and given scores. Happy and sad scores were rated by FireFACE v1.0 software and positive response index (PRI) was calculated as happy score minus sad score. Spatial areas and tree height were evaluated from Landsat 8 images and digital model maps, respectively. Visitors at middle and senior ages smiled more frequently in southern parts than in northern parts, and females had higher happy scores and PRI than males. Both green- and blue-space areas had positive relationships with PRI scores, while blue spaces and their area to park area ratios had positive contributions to happy scores and PRI scores in multivariate linear regression models. Elevation had a negative relationship with positive facial emotion. Overall, based on spatial distributions of blue-space area and elevation, regional landscape was optimized so people perceived more happiness in wetlands around Zhejiang and Shanghai, while people in wetlands of Jiangxi and Hubei showed more net emotional expressions.

1. Introduction

The increasing population increases the frequency of experiencing negative emotions due to more conflictual interactions between people, disappointment, insecurity, etc. These together contribute to a stressful atmosphere in current society and increase the risk of mental illness [1]. According to the World Health Organization (WHO) [2], mental health burdens are increasing worldwide, with a 13% rise in mental health conditions from 2010 to 2017. Approximately one out of five people in post-conflict settings have a mental health condition. Depression and anxiety are the two most common mental health conditions, which together cost the global economy US$ 1 trillion annually [2].
Mental stress is the root to impair our health and well-being. Stressors are perceived from mental distresses, which result from external factors such as social contact or natural experiences (e.g., encountering a natural disaster) [3]. However, according to stress recovery theory (SRT), interacting with nature relieves stresses, but urban settings hamper recuperation [4]. These effects were together concluded to be an outcome of ecosystem services in a city [5]. City lifestyles contribute to a decrease in contact with nature due to more screen-time and less opportunities to interact with green spaces [6]. Therefore, more frequent contact with nature was recommended as a NBS to improve mental health and well-being for psychiatry patients [7]. Ordinary city dwellers, e.g., customers and travelers, share a common chance to perceive distresses and suffer bad moods. For them, NBS can be effective in improving mental well-being for a wider population beyond psychiatry patients [8,9,10]. Attention restoration theory (ART) suggests that even seeing a picture of a nature view can restore attention [11], which has been extended to a belief that experiencing a virtual nature can also bring mental well-being [12,13,14]. However, more powerful evidence supports that experiencing an actually natural setting will be more effective than a virtual counterpart [15,16,17]. However, there is still a knowledge gap in our understanding about the comprehensive attributes of nature to improve mental health and well-being.
Urban green and blue spaces can be taken as a NBS to help cope with perceived life stressors [18,19]. The WHO [20] defines an urban green space as “a necessary component for delivering healthy, sustainable, livable conditions.” Green space accounts for a big amount of urban nature as an affordable, accessible, and equitable infrastructure that protects mental health [21,22]. Multiple approaches (questionnaires, field surveys, GPS tracking, remote-sensing data, and mapping land uses) have been employed in studies on the association of exposure to green space with the health of users [23]. When the focus of subjects was on their mental health, the approach for assessment was mostly limited to survey data [24,25] and a few with crossover trials [24]. Significant discord exists among study designs and definitions, and scattered field investigations make it difficult to aggregate the evidence and identify mechanisms from causal findings [24].
A larger ambiguity is formed due to the lack of green space measurements with insufficient data about subjective accessibility, vertical distance neglection, and equity among communities [23,26]. Technically, the structure of a green space can modify one’s perception through adjusting meteorological perceptions [27,28,29,30]. A group of green spaces will also determine mental perceptions by varied levels in accessibility [31], equity [32], largeness [33], and biodiversity [34]. These issues also exist in studies on the relationship between blue space and mental health [35,36]. Individuals living near coastal communities reported generally healthier and happier self-states than those living inland [37]. People can perceive biodiversity of marine lives [38,39], which, combined with coastal settings, together characterize coastal wetlands as an effective NBS to alleviate anxiety and depression [38,40]. Most studies focused on adults [35], and more works are needed to design and plan green and blue infrastructures as NBSs for children and elders [41]. To our knowledge, studies that synthesize all of the above issues to assess the NBS effects of experiences in blue and green spaces are highly scarce.
The main source of data used for assessing NBS effects of green and blue spaces was formed as self-reported scores on questionnaires [23,24,25]. This methodology is not practical for accurate data collection in large-scale studies, where multiple factors of demographics, location variation, and spatial dimensions are all considered for collection. Expenditures of time and labor may at least partially limit the return of data in large spatiotemporal assessments, but inevitable human errors and lack of validation are two major limits of self-reported scores [42,43,44]. Both SRT and ART together suggest that our perception of psychological well-being comes from emotional self-cognition [5]. Our emotions occur in response to an event, either driven by objective or subjective incidents, which will be shown on our faces as facial expressions [45]. With modern face-reading recognition and big-data analysis techniques, studies have revealed that posted facial expressions can be used as a practical instrument to assess NBS effects on emotional perception in green spaces at local [29,42,44,46], regional [43,47], and national geographical scales [48]. The effect of green-space exposure on posted facial expressions showed spatial distributions along geographical gradients [43,47,48], which can be shaped by daytime dynamic [29,42,44], demographic variation [42,43,44,46], regional microclimate [22,29,36,47], and public arrangement of infrastructures [48]. Up to now, synthesized approaches based on facial expression scores have rarely been assessed for emotional responses to an experience in blue space. Knowledge on mental well-being in green space and conventional detection using a questionnaire methodology in blue space will be interesting for assessing NBS to cope with negative moods in green and blue spaces.
Wetland forests in urban areas are important NBS infrastructures to counteract effects from not only climate change but also urban stressors [49]. Urban wetland forests are a typical type of natural stand with dual-landscape types of green and blue spaces. The spatial distribution of facial expressions reflects emotional responses of wetland visitors, which can be optimized as a NBS to improve emotions in a combined green- and blue-space landscape. In this study, we conducted a large geographical scale investigation on the facial expressions of visitors in 20 wetland forest parks in cities across 15 coastal regions in East China. Our objective was to assess the NBS effect through evoking positive emotions by experiencing green and blue spaces. We also aimed to compare effects of two types of natural spaces as references to optimize forested wetland landscapes with greater outcomes in mental well-being for policymakers, planners, and designers. We hypothesized that: (i) positive emotions expressed through smiles can be evoked by experiences in both green and blue spaces, which (ii) suggests a geographical north–south gradient, (iii) with driving forces from demographic and landscape factors.

2. Materials and Methods

2.1. Study Location

In this study, Sina Weibo [50] was chosen as the social network service (SNS) platform for data collection. Photos of wetland park visitors’ faces were downloaded from micro-blogs, which needed to be labeled with specific locations. We focused on a total of 20 wetland forest parks (23°–41° N, 112°–122° E) in cities across 15 coastal regions in East China (Table 1). These wetland parks were chosen because they are all famous wetland scenic spots in their host cities, and all had combined landscape characteristics of green- and blue-space patches. Green spaces of these wetland parks were dominated by trees and woody plants, but not aquatic weeds or lawns. All these pieces of information were confirmed by online comments and posted experiences in local SNSs of China, including Sina Weibo, Mafengwo Traveling [51], Xiaohongshu Marks of Lives [52], and Zhihu Q&A [53].

2.2. Collection, Screening, and Pretreatment of Photos

To ensure facial recognition accuracy, we required that: (i) subjects in photos must have facial characteristics of typical East Asian race, (ii) all facial organs (ears, nose, mouth, cheek, eyebrow, etc.) have to be clearly visible, (iii) no facial organs are to be covered or subjected to a deep shadow, (iv) faces cannot be made up using over-dose of digital editing, and finally, (v) each photo had to contain only one visitor’s face. Both photos and selfies can be documented in our photo dataset. If a photo contains multiple faces, the photo needs to be cropped to leave only one face per photo. To avoid pseudo-replicated uses of photos from the same person, all photos with faces from the same person have been eliminated to leave only one. A total of 947 photos were collected from targeted wetland parks, with each park having 40–50 photos (Table 1).

2.3. Demographic Attribute of Photographed Subjects

Gender and age of visitors were visually evaluated by two undergraduates. One technician recognized and estimated demographic information for each subject in photos, which was visually checked again by another technician or corroborated by the poster’s personal information displayed on their profile page. Female subjects numbered three times the number of male subjects (Table 1). Ages of subjects were categorized into chronicle ranges as toddlers (1–5 years old), adolescents (6–19 years old), young adults (20–25 years old), middle-aged adults (35–50 years old), and senior adults (over 60 years old), according to standards of relevant studies [42,44,46]. Young aged people accounted for the greatest number of subjects, followed by toddlers, with seniors being the lowest (Table 1).

2.4. Facial Expression Recognition and Analysis

We focused on extremely positive and negative emotions that were presented on visitors’ faces. Hence, happy and sad expressions were recognized and rated, respectively. We are aware that facial expressions can be rated as scores for eight basic micro-expressions [43,44,46]. According to Keltner and Ekman [54], all facial expressions can be generally classified as presentation of positive emotions or presentation of negative emotions. The other reason to choose these two facial expressions was that they passed validation with the highest matching accuracies among all types [44,46]. FireFACE version 1.0 software (Zhilunpudao Agric. S&T Inc., Changchun, China) was used for facial analysis. This software has been successfully used to recognize micro-expressions on faces of urban forest experiencers, several times [29,42,43,44,46,47,48]. It recognizes facial expressions as three types of emotions (happy, sad, and neutral). In this study, we did not use neutral expressions. Photos were manually uploaded to the software, analyzed by clicking “analyze”, and rated to obtain facial expression scores, which can be output as “.xlsx” formatted files.

2.5. Landscape Structure Assessment for Green and Blue Spaces

The landscape structures were evaluated by metrics assessing horizontal and vertical components. Horizontal structure was evaluated by green-space area, blue-space area, whole park area, and area ratios of green and blue spaces to the whole area of parks. Vertical structure was evaluated by metrics of elevation and tree height in landscape patches occupied by vegetations. Horizontal and vertical structures’ landscape metrics were evaluated using ArcGIS V10.2. Locations of all wetland parks were outlined on Landsat 8 OLI images (15 m-resolution) [55] through human–computer interaction. Area metrics were evaluated by the average area of the outlined region that was given by the machine. Cloud cover was controlled to be lower than 10%, and radiometric errors and geometric distortions were corrected according to Zhao et al. [56]. Satellite images with coordinates at the same places were referred to for outlining in Baidu Map records [57]. All layers of landscape patterns were projected to the same set of coordinates, including WGS-1984-UTM-Zone-49N, -51N, and -52N. Patchy area can be calculated as the area that was given in the property of the geometry in ArcGIS. Elevation was determined by the digital elevation model (DEM) in ASTER GDEM 30M data [58]. The height of the tallest feature in landscape patches that were occupied by vegetations was calculated using digital surface models (DSMs) in the AW3D30 DSM data map [59]. Tree height was calculated by the difference between the DSM value and the DEM value. Spatial distributions of landscape metrics can be seen in Supplementary Material Figures S1–S7.

2.6. Data Analysis and Statistics

Happy and sad scores directly reflect expressions of positive and negative emotions, respectively. Happy and sad scores were used to calculate the net change in emotions, namely the positive response index (PRI) [43,44]. As a face is a mixture of multiple emotions, including both happy and sad expressions to varied extents, a PRI score can reveal the level to present expressions of net positive emotions without the involvement of negative affect. PRI score was used to detect net emotion expression when exposed to strong or weak stimuli.
SAS V9.4 was used for data analysis and statistics. Our data about facial expression scores failed to pass normal distribution, and therefore they were transformed to enable the statistical analysis using general linear models (GLMs). Dependent variables were ranked to transform them so that they were distribution-free [60] when being used in analyses [29,43]. This makes data flexible in different kinds of analyses for studies on data of facial expressions [29,43,44]. Analysis of variance (ANOVA) was used to detect combined effects (independent factors) of location variation (cities) and demographic differences (age and gender) on happy, sad, and PRI scores (dependent variables). When significant effects were indicted as the main or interactive sources of variances, raw data were averaged to compare their differences according to Duncan’s test at the 0.05 level. Specifically, results in response to an interactive effect involving location variation would be presented as stratifications to compare differences among locations at each category of demographic attributes. Spearman correlation was conducted to detect relationships between expression scores and landscape metrics. Since a correlation analysis can be used to detect the relationship between records of a landscape metric and scores of a type of facial expression, associations were different among relationships. Multivariate linear regression (MLR) was used to detect combined contributions of several landscape metrics to facial expression scores. When significant estimates were indicated by the MLR model, spatial distributions of estimated metrics were mapped in the study area. Thereafter, the outcome of optimizing patterns of significantly responsive expressions can be mapped using regressed data. This will be the final result that guides outlets using NBS theory.

3. Results

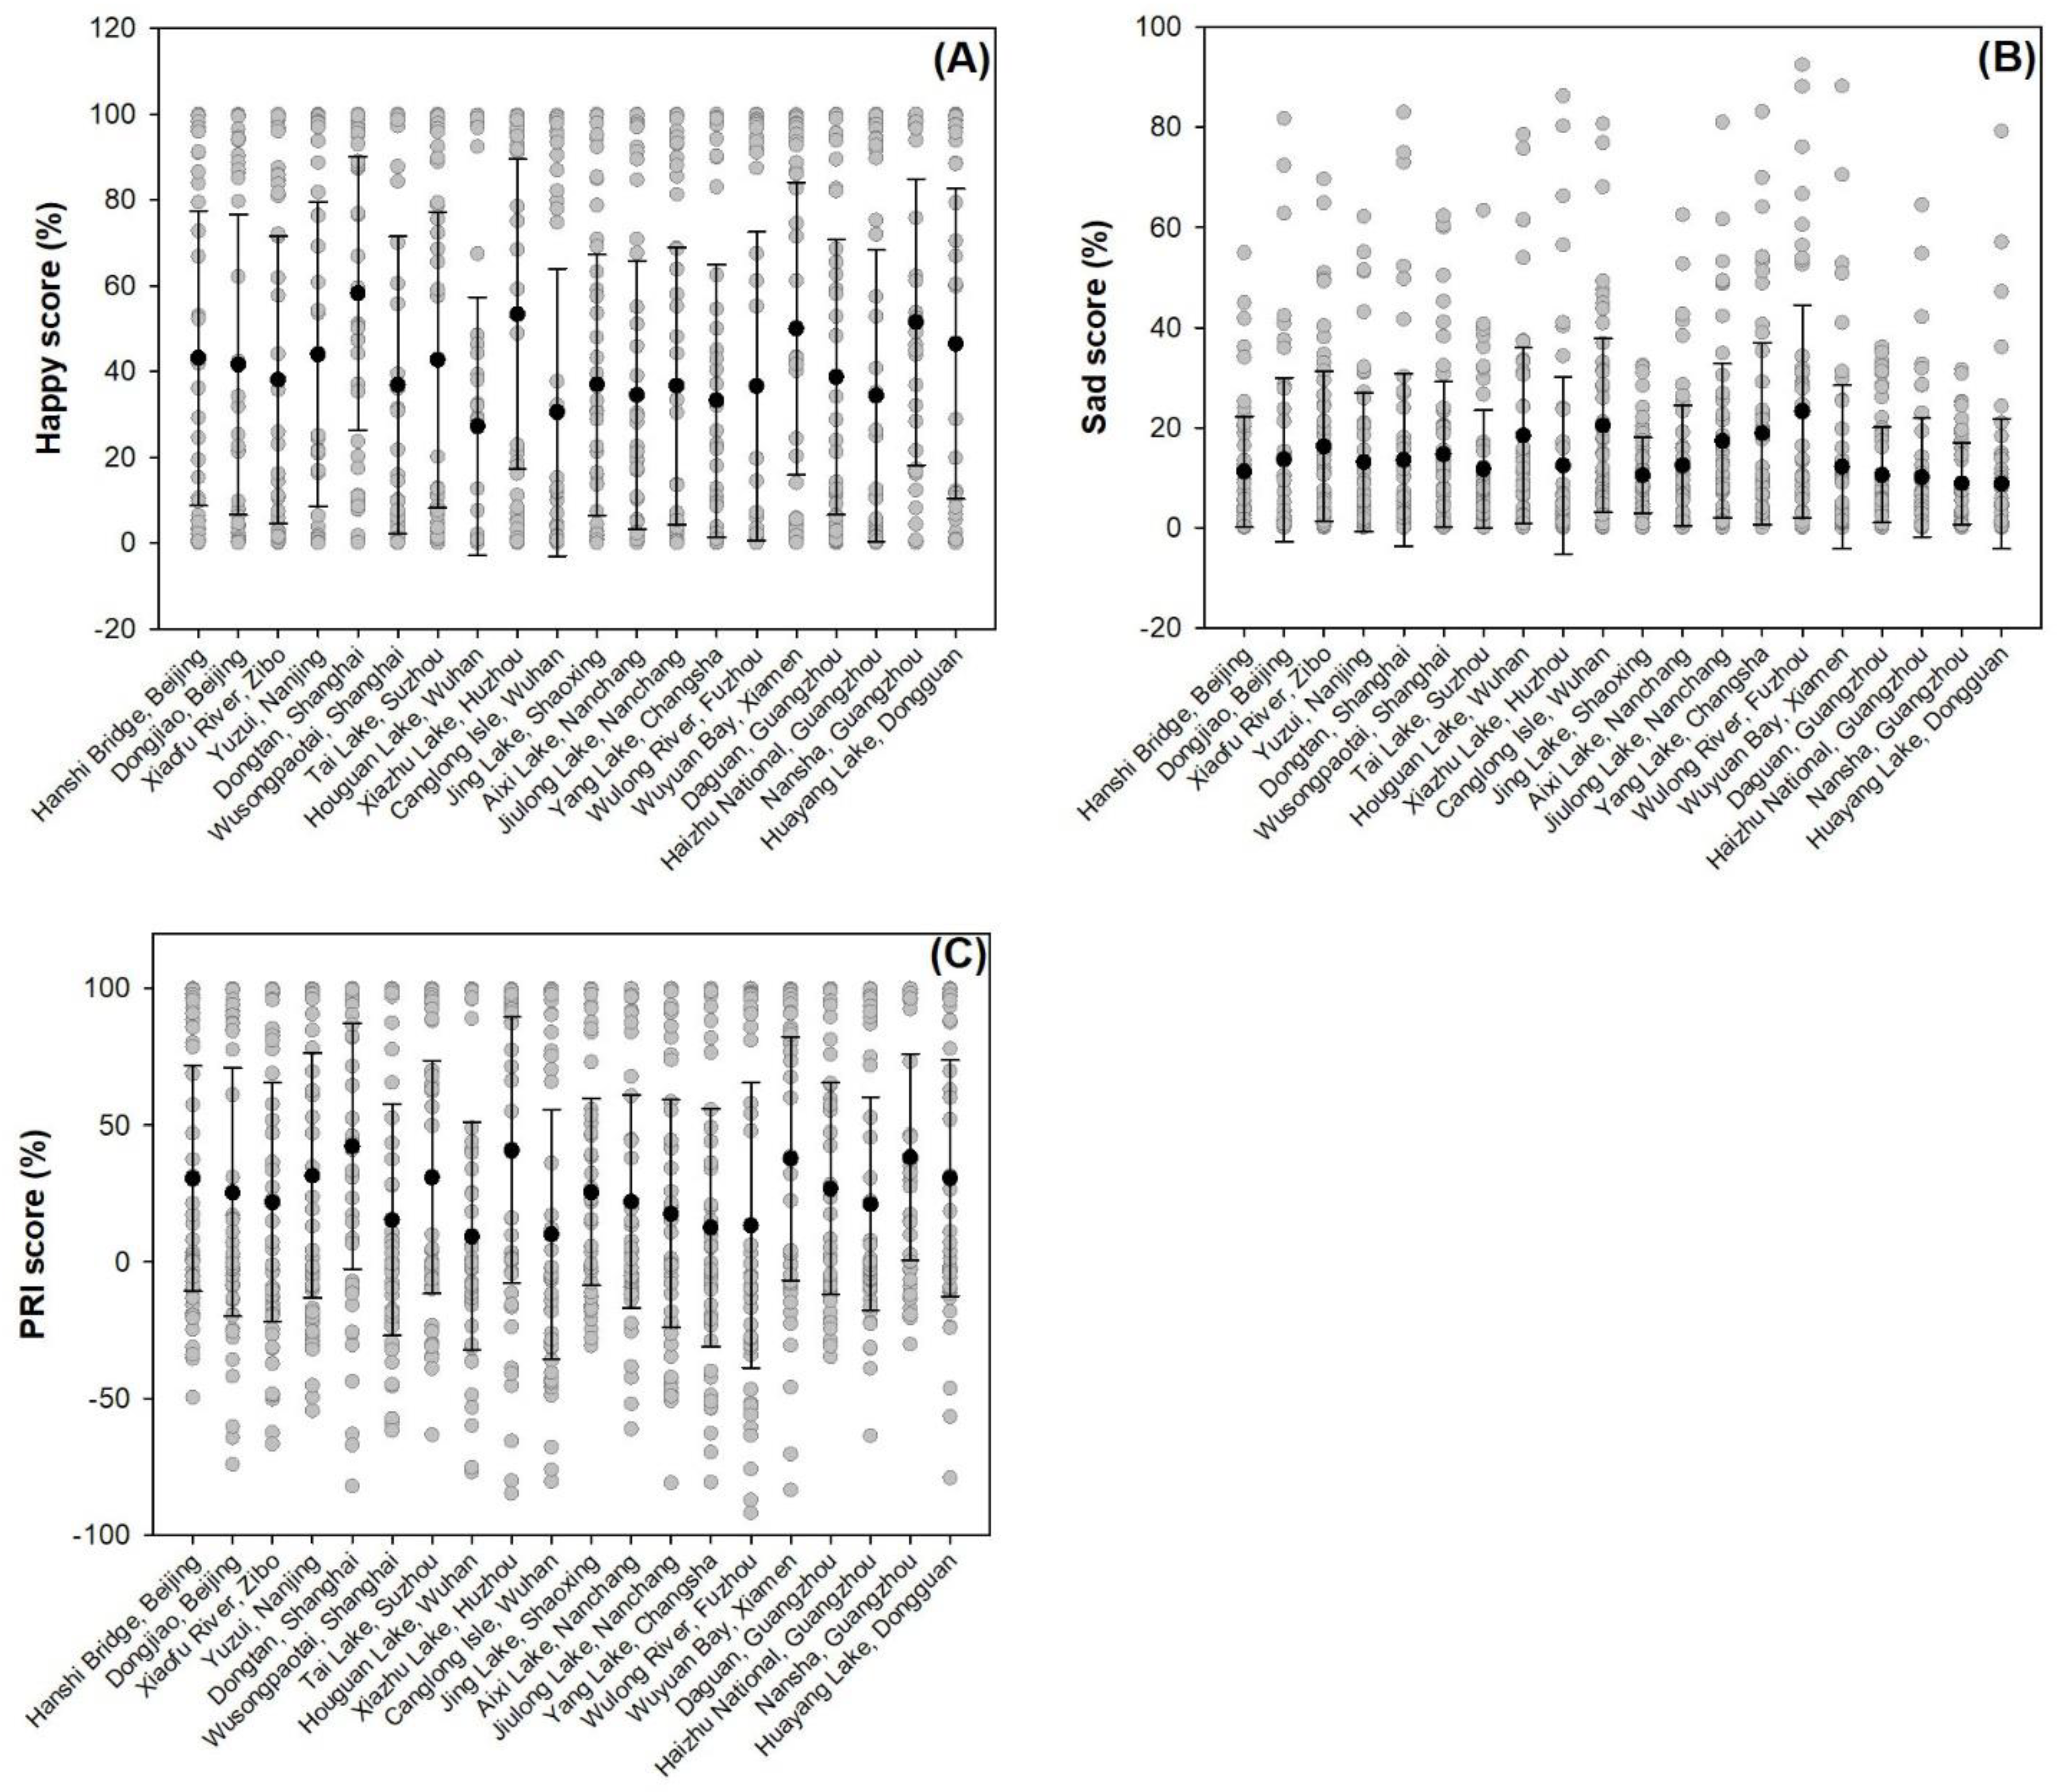
3.1. Differences in Facial Expressions among Wetland Locations

The variation of different wetland locations had a significant, main effect on the distribution of happy, sad, and PRI scores. The averaged happy score was higher in Dongtan (58.21% ± 31.90%) than that in most other locations (Figure 1A). In contrast, the average of the happy score was lower in Canglong Isle (30.47% ± 33.54%) than in Dongtan, Tai Lake (42.70% ± 34.55%), Xiazhu Lake (53.35% ± 36.14%), Jing Lake (36.91% ± 30.36%), Wuyuan Bay (49.99% ± 34.15%), Daguan (38.71% ± 32.09%), and Nansha (51.54% ± 33.38%) (Figure 1A). The average sad score was higher in Canglong Isle (20.40% ± 17.35%) than in Dongjiao (13.60% ± 16.38%), Dongtan (13.50% ± 17.29%), Xiazhu Lake (12.41% ± 17.63%), and Wuyuan Bay (12.16% ± 16.32%), and those in more southern locations (Figure 1B). Sad score tended to be lower in Huayang Lake (8.75% ± 13.03%) than in most northern locations. As a result, average PRI was higher in Dongtan (42.31% ± 44.87%) than in Wusongpaotai Bay (15.31% ± 42.40%), Houguan Lake (9.33% ± 41.58%), Canglong Isle (10.07% ± 45.70%), Yang Lake (12.55% ± 43.60%), and Wulong River (13.34% ± 52.09%) (Figure 1C).

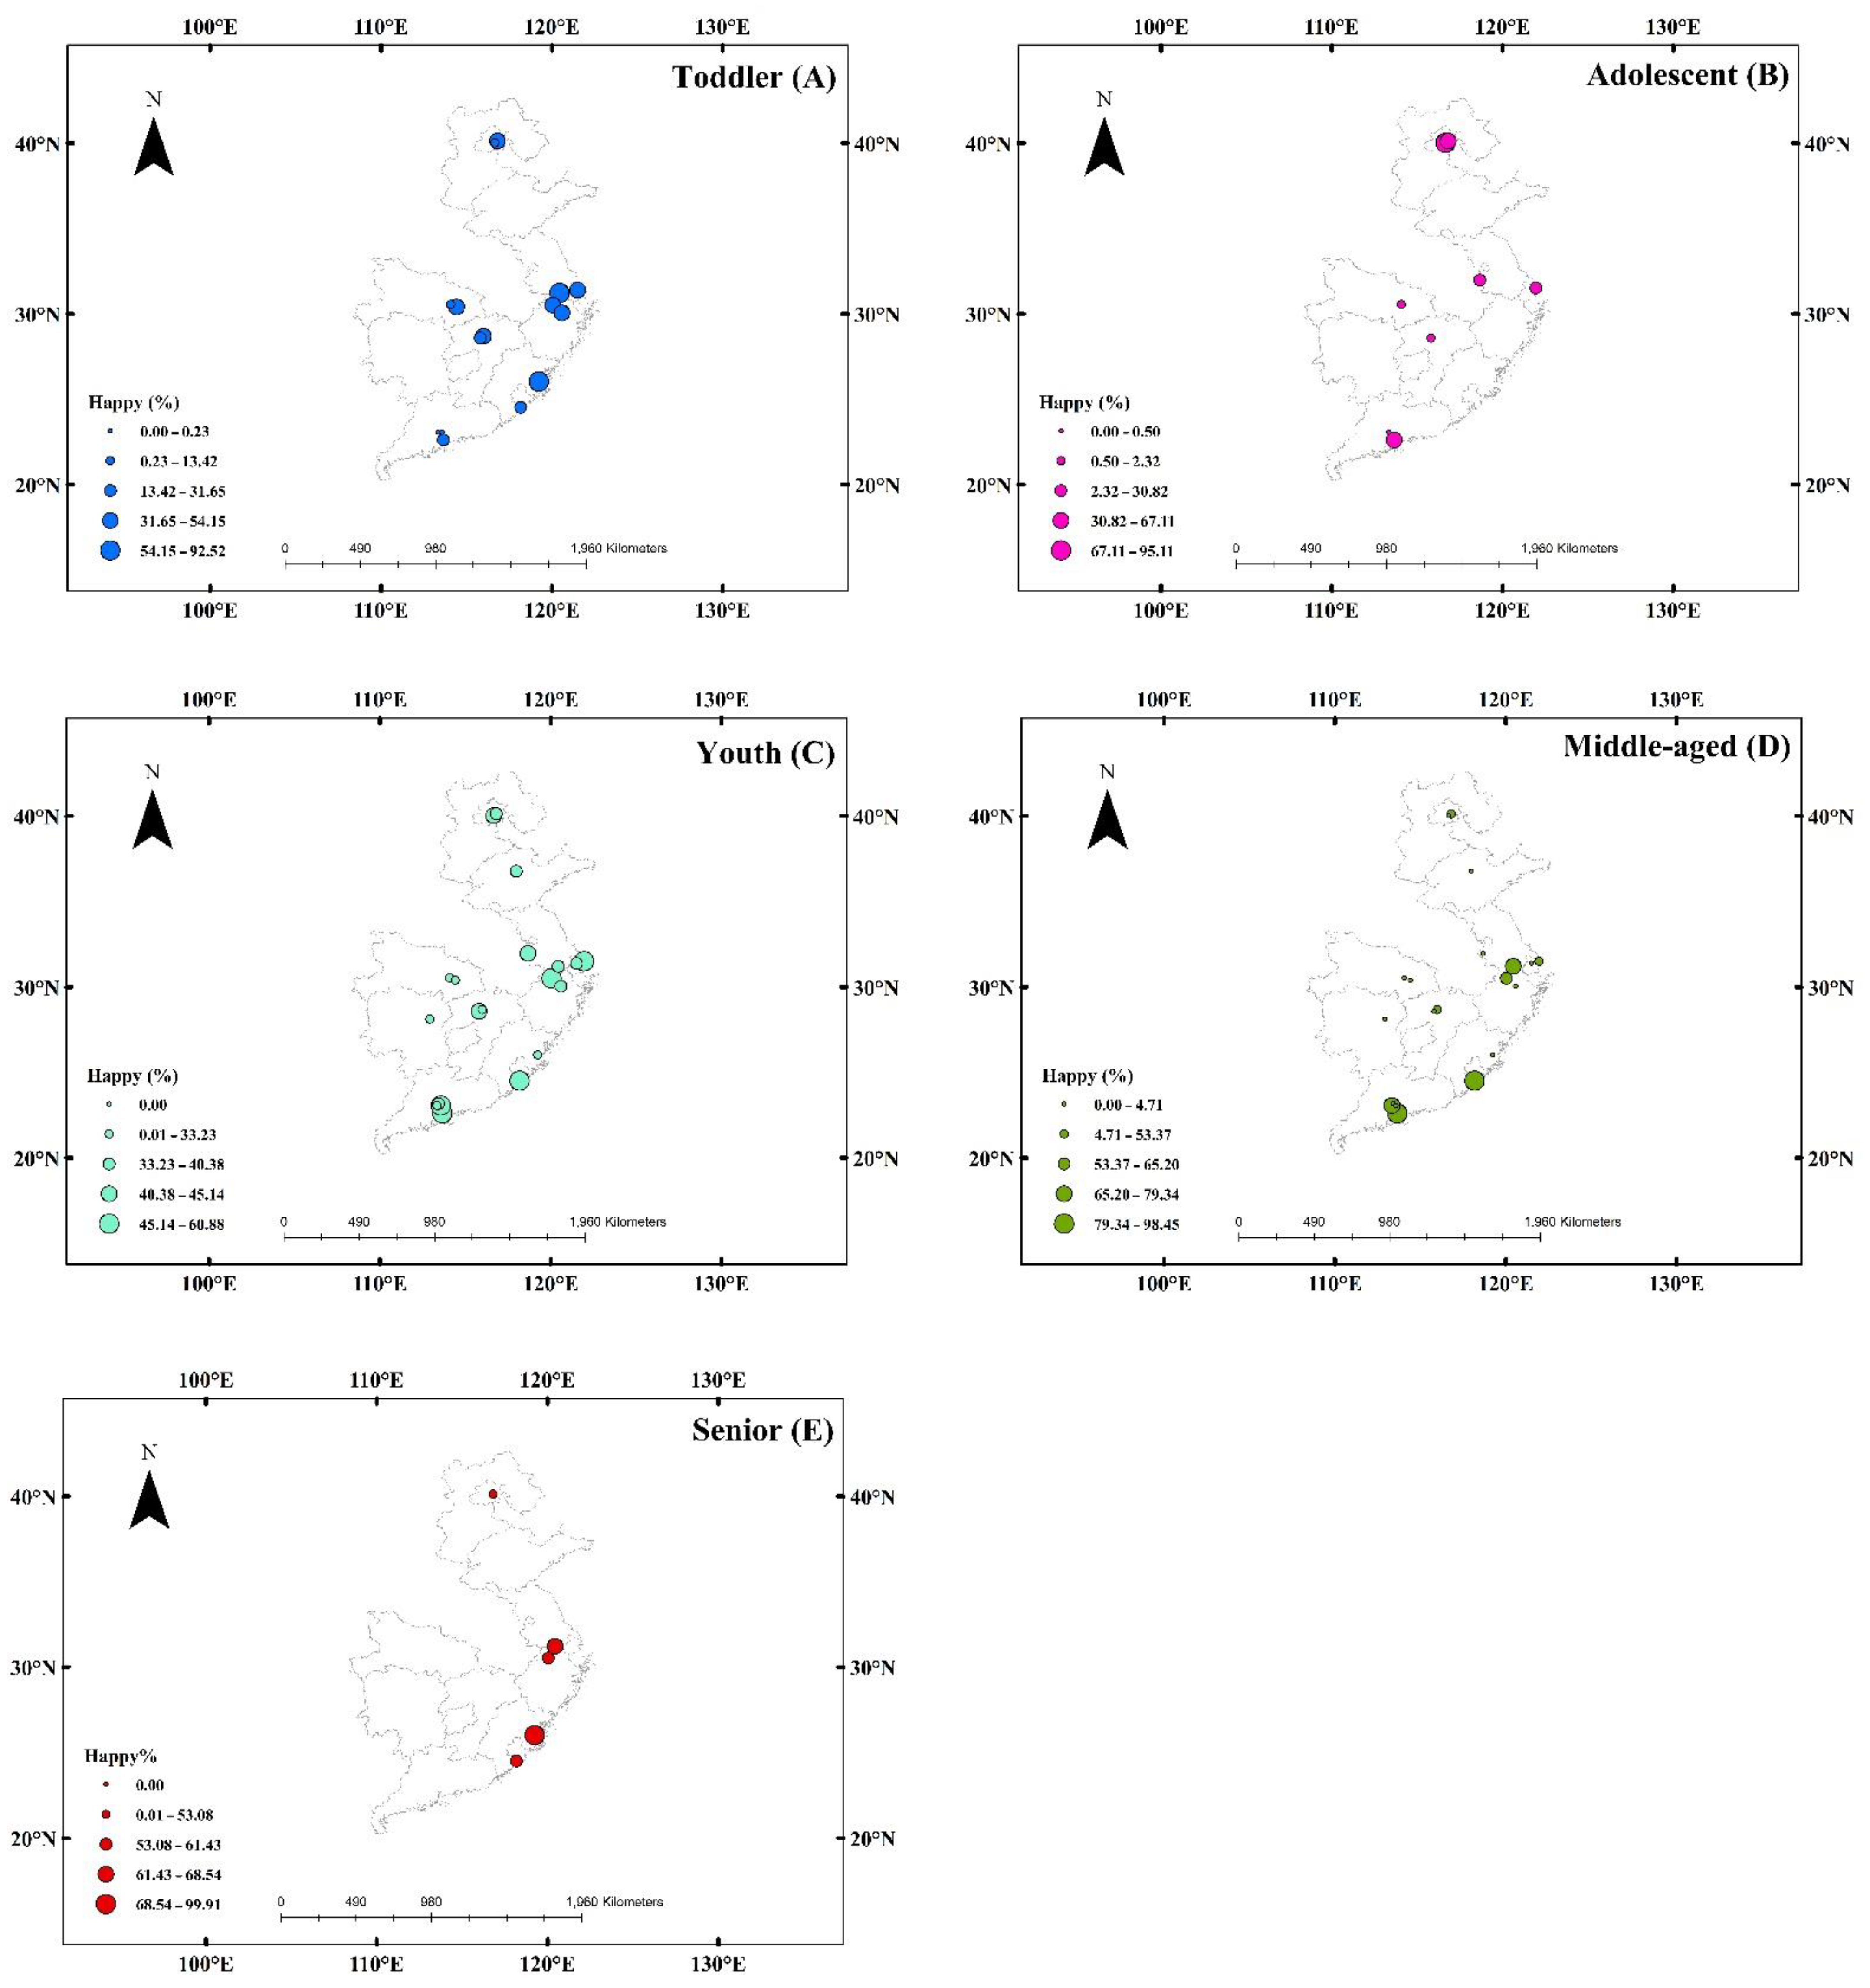
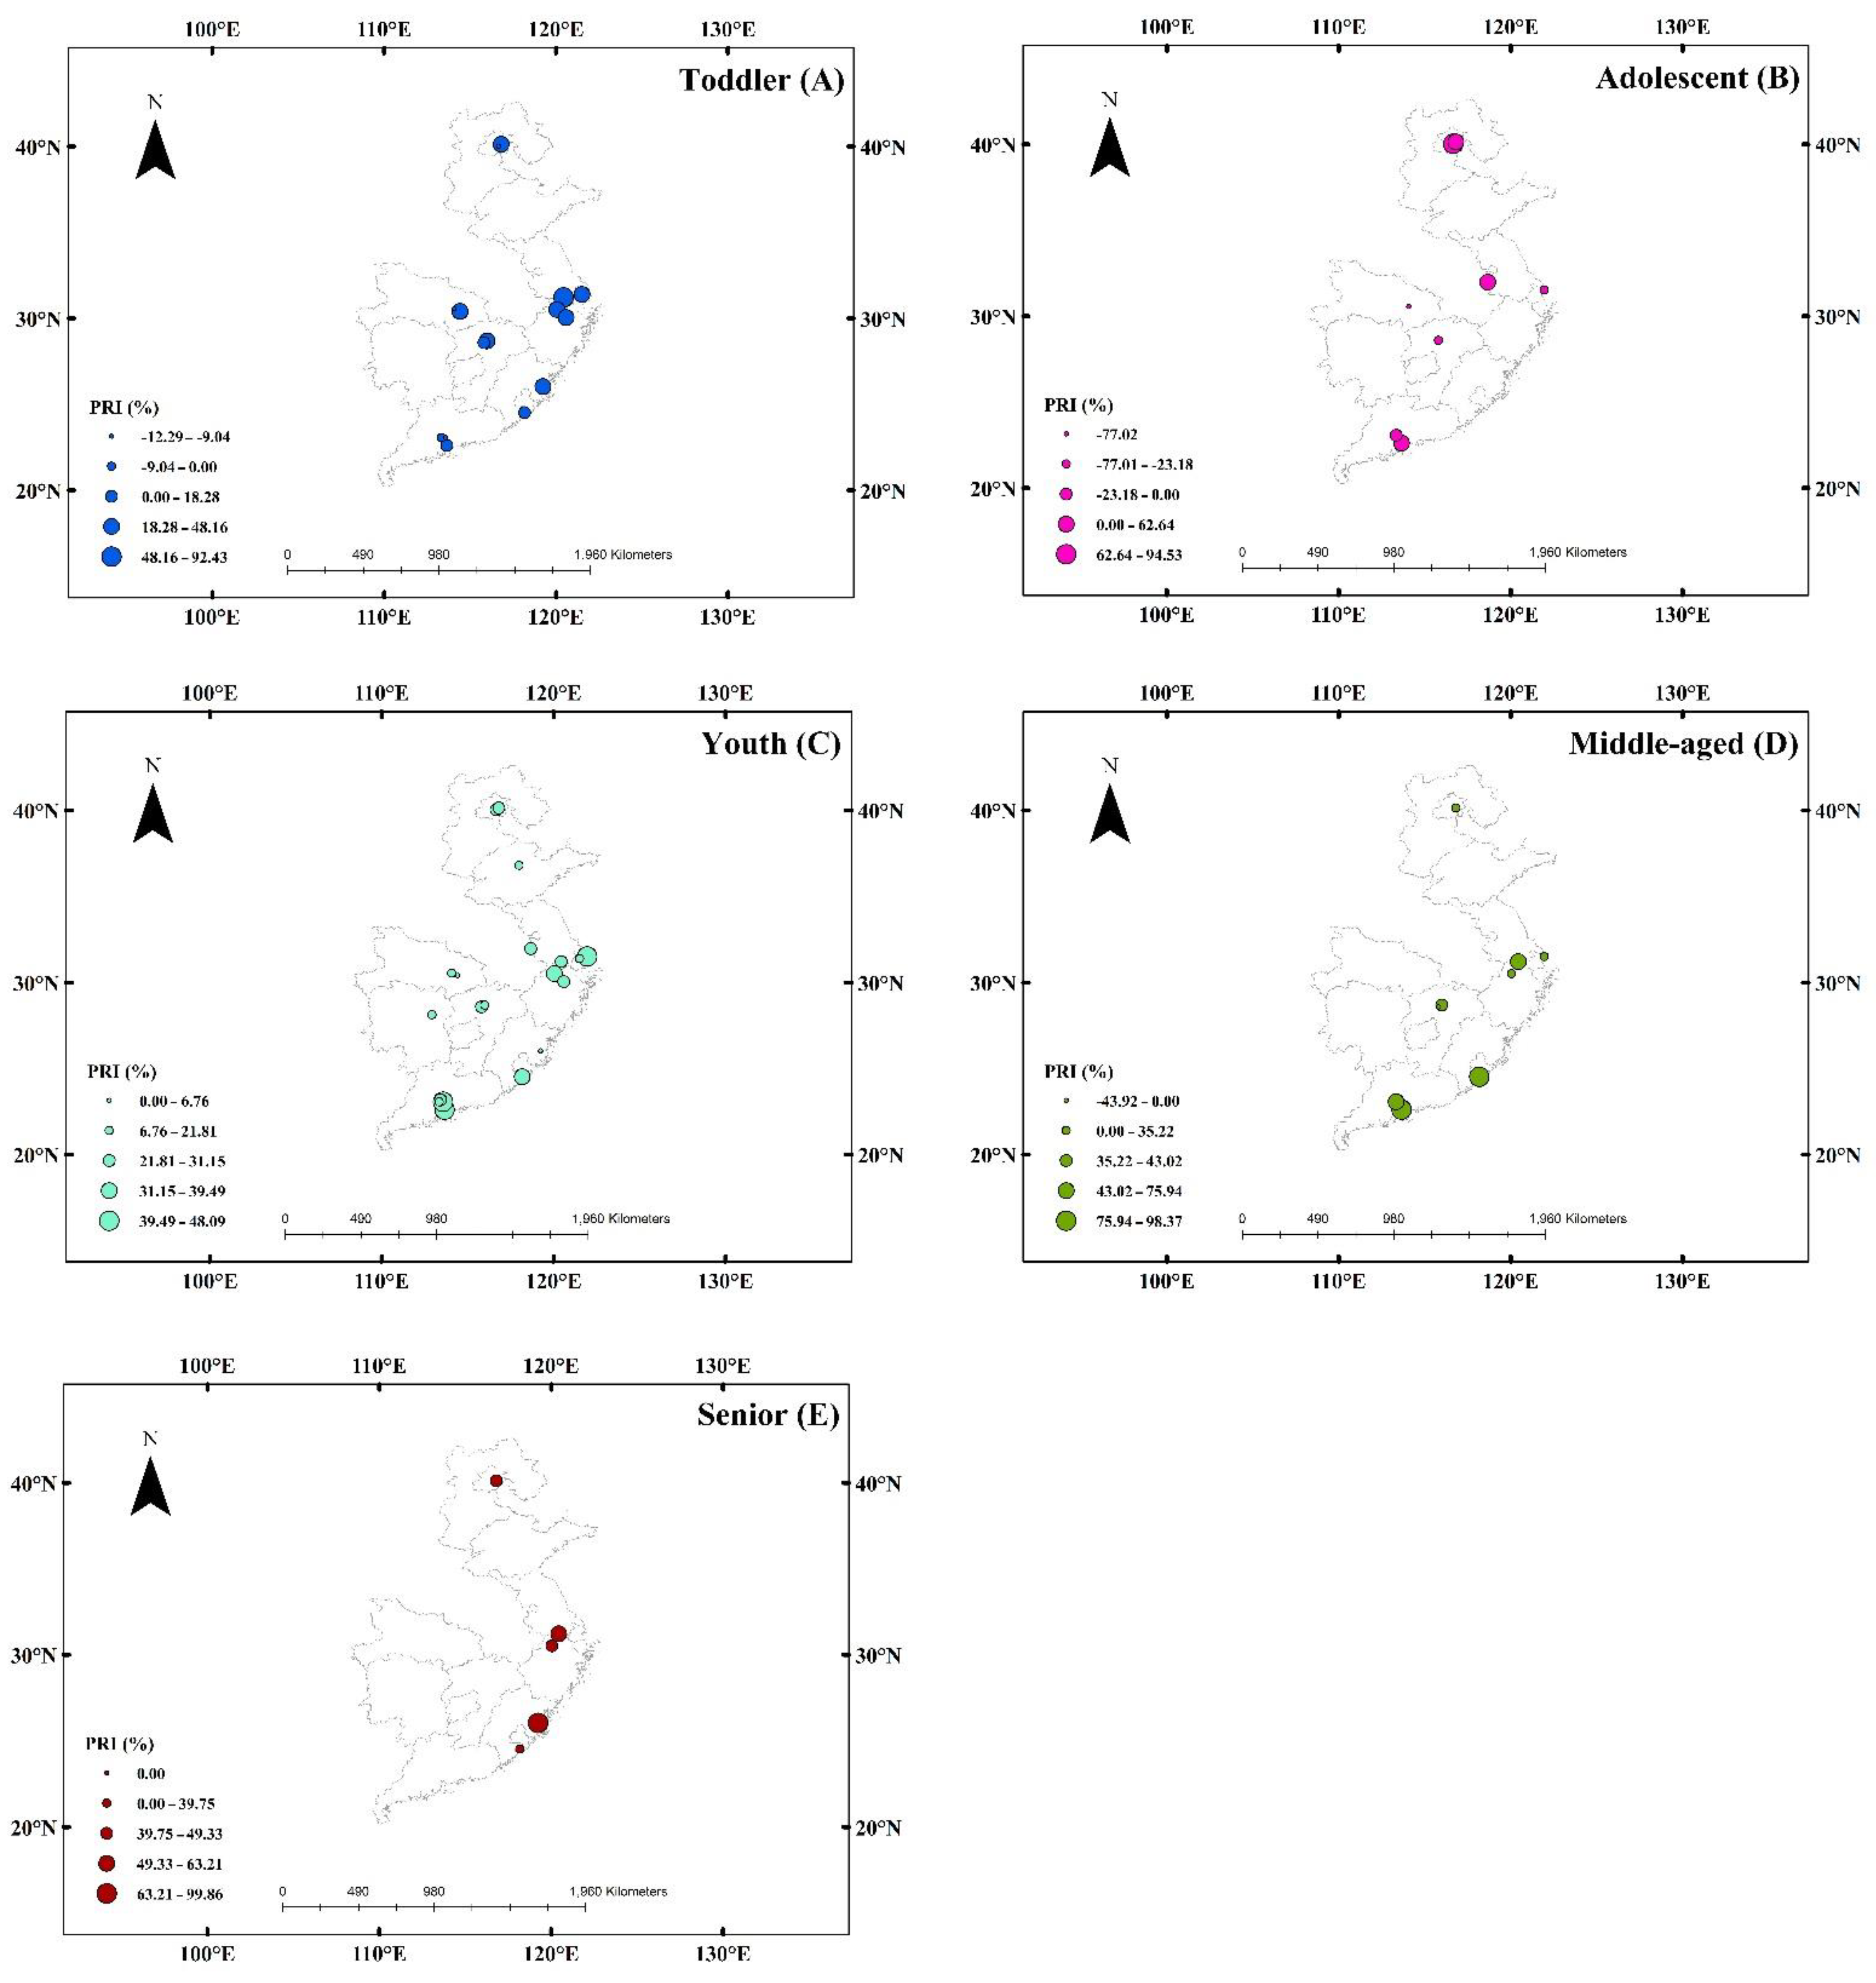
3.2. Effects of Wetland Location and Age on Facial Expressions

The significance of interactive effects from variations of park locations, and the gender and age of visitors, are shown in Table 2. ANOVA indicated an interactive effect between wetland location and visitors’ age on happy and PRI scores. Spatial distributions of happy and PRI scores for different ages of visitors are shown in Figure 2 and Figure 3. Statistical differences are shown in Table 3.
Toddlers tended to have higher happy scores in eastern parts than in central and southern parts of study locations (Figure 2A). For example, the happy score was higher for toddlers in Tai Lake than in Huangyan Lake and Haizhu National (Table 3). For adolescents, the happy score tended to be higher in northern and southern parts than in central parts (Figure 2B). Adolescents had higher happy scores in Dongjiao and Nansha than in Haizhu National (Table 3). Happy scores for youths had a heterogeneous pattern with alternative high and low levels along the latitudinal gradient (Figure 2C). A statistical difference for happy score was not observed in youths (Table 3). Happy scores for middle-aged visitors had an obvious geographical gradient with lower levels in the north and higher levels in the south (Figure 2D). Happy scores in Wuyuan Bay and Nansha were higher than in Jiulong Lake (Table 3). Again, senior visitors showed a higher happy score in southern parts than in northern parts (Figure 2E). However, no statistical difference existed for happy scores among senior visitors in different locations (Table 3).
Toddlers had a higher PRI score in northern wetland parks (Figure 3A). However, regional differences did not meet the statistical standard (Table 3). Adolescents in central parts had a lower PRI score than those in northern and southern parts (Figure 3B). Adolescents in Dongjiao and Nansha had a higher PRI than those in Dongtan and Houguan Lake (Table 3). Youths had a higher PRI score in eastern and southern parts of the study area than those in western and northern parts (Figure 3C). Again, this spatial distribution did not result in a significant difference among locations (Table 3). Middle-aged visitors in southern parts had a higher PRI score than those in northern parts (Figure 3D). Middle-aged visitors in Wuyuan Bay, Nansha Park, and Haizhu National had higher PRI scores than those in Jiulong Lake (Table 3). There was no significant variation in PRI score for seniors from different locations (Figure 3E, Table 3).

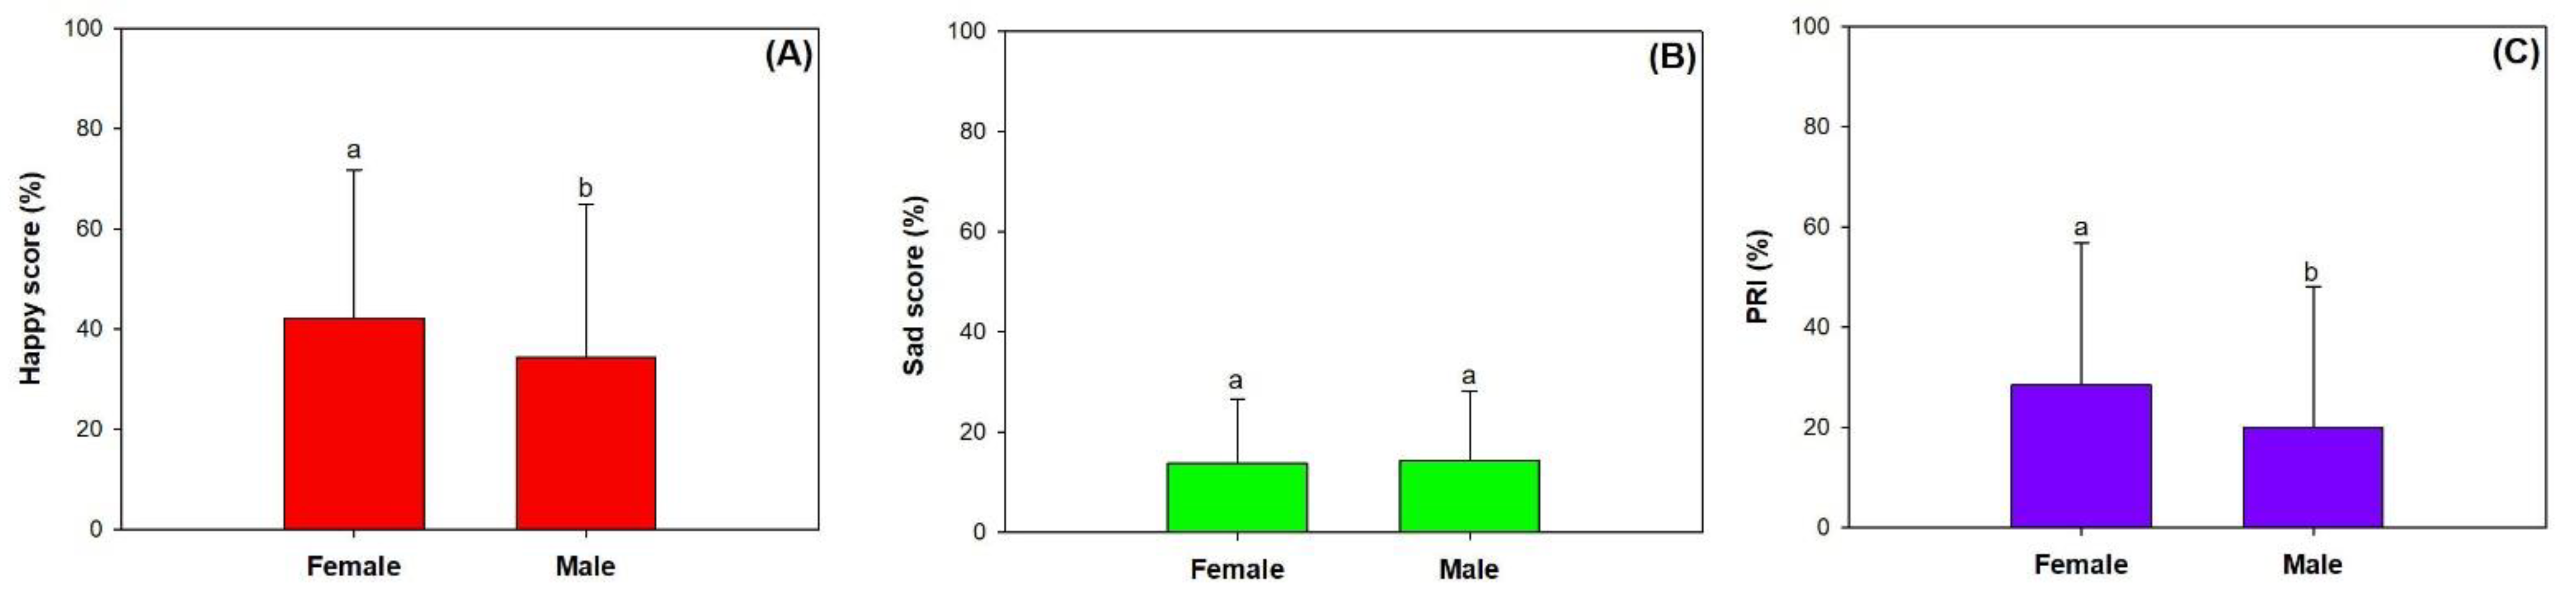
3.3. Gender Effects on Facial Expressions

Gender had a significant effect on happy and PRI scores (Table 2). Compared to males, females’ happy score was 22.7% higher (Figure 4A). In addition, females’ PRI score was 42.5% higher than males’ (Figure 4C). Gender had no effect on sad score, which ranged around 14.00% for male and female visitors (Figure 4B).

3.4. Spearman Correlations between Facial Expressions and Landscape Metrics

Correlations were found between facial expression scores (happy, sad, and PRI) and landscape metrics (green-space area/area-ratio, blue-space area/area-ratio, park area, elevation, and tree height). Green- and blue-space areas both had positive relationships with PRI scores (Figure 5). In addition, blue-space area also had a positive relationship with happy scores. The area ratio of blue space had a positive relationship with PRI (R = 0.4587; p = 0.0420). On the other hand, the relationships between elevation and happy and PRI scores were negative. Elevation had a negative relationship with sad scores. Happy and PRI scores had positive relationships with each other, both of which had negative relationships with sad score.

3.5. Landscape Optimization by Multivariate Linear Regression

Blue-space area had a strong, positive contribution to ranked happy scores, while elevation had a small, negative contribution (Table 4).
The area ratio of blue space also had a strong, positive contribution to ranked PRI scores and, again, elevation had a negative contribution. Therefore, we obtained two regression models for ranked happy (HappyRank) and PRI scores (PRIRank), as follows:
H a p p y R a n k = 5.71 × A r e a B l u e 0.23 × E l e v a t i o n + 10.89
P R I R a n k = 16.58 × A R B l u e 0.27 × E l e v a t i o n + 10.70
where, AreaBlue is blue-space area, and ARBlue is the area ratio of blue space. Spatial distributions of blue-space area, area ratio of blue space, and elevation can be seen in Figure 6. Elevation showed a generally decreasing trend from the east to the west in the study area (Figure 6A). Blue-space area appeared to be greater in the central region of the study area along a latitudinal gradient (Figure 6B). The area ratio of blue space was alternatively high and low along the latitudinal gradient (Figure 6C).
According to models (1) and (2), and landscape metrics in Figure 6, spatial distributions for happy and PRI scores can be optimized as shown in Figure 7. The central-eastern part of the study area tended to have higher happy scores than most other regions (Figure 7A). However, the central-eastern regions had lower PRI scores. Instead, the PRI score in western parts was higher.

4. Discussion

The photos we used in this study were posted by users to Sina Weibo, which is a SNS platform with an open visiting policy. We admit that most emotions in these photos were posted rather than spontaneously captured. One may suspect that posed emotions caused significant errors and do not reflect one’s actual emotional life. However, it has been found that expressed emotions on social media have an association with users’ emotional lives, unless individuals posted photos to seal the access due to privacy protection [61]. All photos that we collected were taken from users in public spaces of nature where posters aimed to share their appearance in a green or blue space. No photo was taken from anywhere that required private access. It has also been revealed that posed emotions in public can be affected by perceived stimuli, such as weather [28,29,47] and landscape metrics [62,63]. Users were conscious that they were photographed and that such photos were uploaded online and included the setting around them. However, users were not aware that their photos were used for an academic study. Hence, emotions with perceived stimuli were evaluated at unconsciousness when analyzed in a regional pool.
We can accept our first hypothesis because both green- and blue-space areas had positive relationships with PRI scores. This suggests that experiencing both green and blue spaces can evoke net positive emotions for visitors. Our results were derived from posted emotions as facial expressions, which may have errors in reflecting emotions between true perceptions and posted ones. However, all our photos were collected from the same platform, leaving the source of variation as only drivers of location, gender, and age. Posted photo scores can be used for evaluating emotions in different spaces. Our results concur with previous results found by the questionnaire methodology [23,24,25]. It was surprising that the positive relationship between blue-space area and happy scores did not exist for green-space area and happy scores. These results suggest that people can perceive more positive emotions in larger green spaces, but this effect was not so strong, as expected in blue spaces. Blue-space area also contributed to the spatial distribution of happy scores as a strong promotor. Therefore, the largeness of a blue space is a parameter that can be planned for when landscaping to improve NBS. Our results agree with Dr. Matthew White’s findings in a program researching the health and well-being benefits of natural experiences across 18 countries [37,39]. These contributions made by Dr. White were further confirmed by an editorial that states that to touch the aquatic environment in coastal blue spaces is a driver to make people happy [64]. Pasanen et al. [65] stated that spending time in aquatic environments has greater benefits in inducing positive mood and reducing negative mood and stress than green space does. Our results also highly concur with those of Pasanen et al. [65], where natural experiences without blue spaces showed no association between mental health and green space. Further explanations for why blue space has a stronger effect than green space require more research. The largeness of a natural space should have contained more specific metrics that can be effective, but received rare disclosures.
We did not expect that elevation would have a negative effect on the presentation of positive emotions either as a main driver or in a group of contributors. Elevation generated a negative effect on positive emotions but a positive effect for blue-space areas, but we did not find any relationship between elevation and blue or green space areas. High-altitude exposure can induce negative feelings about enduring extreme environments and exercise needs [66,67], which will impair mood and cognitive functions [68,69]. The microclimates beside water are colder and more moist than surrounding places at a further distance [36]. Both conditions will also elicit negative emotions [69,70]. In China, scenic spots in a natural park are usually linked by stairs, and those in high altitudes would arrive by walking up the stairs instead of twisted lanes. Negative emotions may also be shown in the tiredness on visitors’ faces when they just arrived at a place for taking photos.
We can partly accept our second hypothesis because spatial distribution of expressed positive emotions interacts with the age of visitors. Older visitors in ages ranging from middle to senior tended to show positive emotions along the latitudinal gradient. Temperature is the main driver for the expression of positive emotions along a latitudinal gradient [47]. Southern parts of our study area were subtropical and tropical regions with a warmer local climate than northern parts. Elderly visitors’ emotions were sensitive to the local warm temperature of wetland parks and showed a geographical response. Demographic age also had an interactive effect with different locations of green spaces on smiles on visitors’ faces in North China [62]. Therein, seniors also showed more happy faces in southern regions.
Gender of visitors was another demographic factor that had a significant effect on facial expressions. Females showed more positive emotions than males in our study. These results concur with those found by Liu et al. [47] and Wei et al. [43], which both adapted facial expression data from SNS as well. In a northern city of Shenyang, Guan et al. [46] also reported more happy emotions for random female pedestrians, both in a forest and along a promenade. In contrast, female pedestrians were found to show more negative emotions in natural settings in Changchun [44] and Harbin [42]. We do not have enough evidence to assert that females look more unhappy than males when they are unconscious of being photographed. At least, more females had happy faces than males in posed photos that were uploaded online.
Finally, we cannot accept our third hypothesis because of null effects from the interaction between demographic and landscape factors. To result in significant responses of facial expressions, demographic age interacted with geographical distribution and two landscape metrics (elevation and area).
Our study has some limits that can be improved by further studies. First, the use of photos from the SNS platform is limited because most emotions are consciously presented. This causes some similar types of errors, for human subjects, to the questionnaire methodology. This limits the further comparison between posted photo emotions in SNS and others with unconscious emotions. A better way may be to collect big data with more respondents to dilute individual errors. Second, there were some uncertainties in the identification of the gender and age of people in photos, which may cause errors. For example, the experience of an undergraduate towards the age of a middle-aged visitor may lead to identification of the visitor as a senior. The assistant confirmation by checking personal information also has limits because not all users of Sina Weibo post their private information. The agreement of identification from more people across different levels of life experiences would help with this. Third, the satellite imageries we used had some limits in their resolutions. Landsat 8 OLI images’ resolution is 15 m, while DEM and DSM extracts’ resolutions are 30 m. The average area of a park in our study was 2.2 square kilometers, which meant that a park can generally harbor 9760 grids for area analysis and 16 grids for altitude and elevation analyses. This is acceptable in a study, such as ours, at a regional scale across 20 parks. Human–computer interaction will further promote accuracy by correcting radiometric errors and geometric distortions. However, images with higher resolutions will be needed if a higher accuracy is acquired. In some specific regions, high-resolution imageries will be the basic requirement for analyzing landscape metrics, which needs to be considered in future works.

5. Conclusions

Using online records of facial photos, we found spatial differences of positive emotions and a north–south gradient distribution of smiles on faces of middle-aged and senior visitors. According to multivariate linear regression, we confirmed that blue spaces can be taken as a NBS to promote positive emotions by experiencing wetland forests with a large area and at low elevation. Therefore, wetlands in the central parts around Zhejiang and Shanghai were recommended as sites that bring a high probability of happiness. When considering the net positive emotion of happiness minus sadness, it was suggested to visit wetland parks in western parts around Hubei and Jiangxi. Our study utilized green and blue spaces of wetland forests as NBSs. Further studies are suggested to continue the approach and layout of our study and extend the geographical range to other places in the world. Green space should not always lack a relationship with facial expressions, but more studies are needed to form confirmative conclusions on using green and blue spaces as NBSs.

Supplementary Materials

The following supporting information can be downloaded at: https://www.mdpi.com/article/10.3390/f13030473/s1, Figure S1: Spatial distributions of blue-space areas in wetland parks. Figure S2: Spatial distributions of blue-space area ratios in wetland parks. Figure S3: Spatial distributions of elevations in wetland parks. Figure S4: Spatial distribution of green-space area in wetland parks. Figure S5: Spatial distribution of green-space area ratios in wetland parks. Figure S6: Spatial distribution of park area ratios in wetland parks. Figure S7: Spatial distribution of tree height in wetland parks.

Author Contributions

Conceptualization, H.L.; methodology, H.L.; software, H.L., J.P. and Y.J.; validation, S.A.; formal analysis, H.L., J.P. and Y.J.; investigation, J.P. and Y.J.; resources, H.L.; data curation, J.P. and Y.J.; writing—original draft preparation, H.L.; writing—review and editing, S.A.; visualization, H.L.; supervision, H.L. and S.A.; project administration, H.L. and S.A.; funding acquisition, H.L. and S.A. All authors have read and agreed to the published version of the manuscript.

Funding

This research was funded by the National Key R&D Program of China (Grant No. 2019YFC0409102), Scientific Research Project of Education Department of Jilin Province (Grant No. JJKH20220638KJ), and Project of Changchun Science and Technology Bureau (Grant No. 21ZGM03).

Institutional Review Board Statement

The study was conducted in accordance with the Declaration of Helsinki, and approved by the Ethics Committee of School of Water Conservancy and Environment Engineering (protocol code CCIT-SWCEE-EC-2019-002 and 13 October 2019).

Informed Consent Statement

Not applicable.

Acknowledgments

Authors acknowledge Ling Quan for his assistance in facial expression analysis and Mengnan Liu and Tingting Xia for their contributions to photo collection and data analysis.

Conflicts of Interest

The authors declare no conflict of interest.

References

  1. Yates, D. The stress of city life. Nat. Rev. Neurosci. 2011, 12, 430. [Google Scholar] [CrossRef]
  2. WHO. Mental Health. Available online: https://www.who.int/health-topics/mental-health#tab=tab_2 (accessed on 13 October 2021).
  3. Rosellini, A.J.; Dussaillant, F.; Zubizarreta, J.R.; Kessler, R.C.; Rose, S. Predicting posttraumatic stress disorder following a natural disaster. J. Psychiatr. Res. 2018, 96, 15–22. [Google Scholar] [CrossRef] [PubMed]
  4. Ulrich, R.S.; Simons, R.F.; Losito, B.D.; Fiorito, E.; Miles, M.A.; Zelson, M. Stress recovery during exposure to natural and urban environments. J. Environ. Psychol. 1991, 11, 201–230. [Google Scholar] [CrossRef]
  5. Bratman, G.N.; Anderson, C.B.; Berman, M.G.; Cochran, B.; Vries, S.d.; Flanders, J.; Folke, C.; Frumkin, H.; Gross, J.J.; Hartig, T.; et al. Nature and mental health: An ecosystem service perspective. Sci. Adv. 2019, 5, eaax0903. [Google Scholar] [CrossRef] [PubMed] [Green Version]
  6. Shlay, A.B. Book Review: Triumph of the City: How Our Greatest Invention Makes Us Richer, Smarter, Greener, Healthier and Happier. City Community 2012, 11, 332–333. [Google Scholar] [CrossRef]
  7. Vujcic, M.; Tomicevic-Dubljevic, J.; Grbic, M.; Lecic-Tosevski, D.; Vukovic, O.; Toskovic, O. Nature based solution for improving mental health and well-being in urban areas. Environ. Res. 2017, 158, 385–392. [Google Scholar] [CrossRef]
  8. van den Bosch, M.; Ode Sang, Å. Urban natural environments as nature-based solutions for improved public health—A systematic review of reviews. Environ. Res. 2017, 158, 373–384. [Google Scholar] [CrossRef]
  9. Panno, A.; Carrus, G.; Lafortezza, R.; Mariani, L.; Sanesi, G. Nature-based solutions to promote human resilience and wellbeing in cities during increasingly hot summers. Environ. Res. 2017, 159, 249–256. [Google Scholar] [CrossRef]
  10. Han, H.; Jongsik, Y.; Hyun, S.S. Nature based solutions and customer retention strategy: Eliciting customer well-being experiences and self-rated mental health. Int. J. Hosp. Manag. 2020, 86, 102446. [Google Scholar] [CrossRef]
  11. Kaplan, S. The restorative benefits of nature: Toward an integrative framework. J. Environ. Psychol. 1995, 15, 169–182. [Google Scholar] [CrossRef]
  12. van Vliet, E.; Dane, G.; Weijs-Perree, M.; van Leeuwen, E.; van Dinter, M.; van den Berg, P.; Borgers, A.; Chamilothori, K. The Influence of Urban Park Attributes on User Preferences: Evaluation of Virtual Parks in an Online Stated-Choice Experiment. Int. J. Environ. Res. Public Health 2021, 18, 212. [Google Scholar] [CrossRef] [PubMed]
  13. Zhu, H.Z.; Yang, F.; Bao, Z.Y.; Nan, X.G. A study on the impact of Visible Green Index and vegetation structures on brain wave change in residential landscape. Urban For. Urban Green. 2021, 64, 22. [Google Scholar] [CrossRef]
  14. Cottet, M.; Vaudor, L.; Tronchere, H.; Roux-Michollet, D.; Augendre, M.; Brault, V. Using gaze behavior to gain insights into the impacts of naturalness on city dwellers’ perceptions and valuation of a landscape. J. Environ. Psychol. 2018, 60, 9–20. [Google Scholar] [CrossRef]
  15. Browning, M.; Shipley, N.; McAnirlin, O.; Becker, D.; Yu, C.P.; Hartig, T.; Dzhambov, A.M. An Actual Natural Setting Improves Mood Better Than Its Virtual Counterpart: A Meta-Analysis of Experimental Data. Front. Psychol. 2020, 11, 12. [Google Scholar] [CrossRef] [PubMed]
  16. Mayer, F.S.; Frantz, C.M.; Bruehlman-Senecal, E.; Dolliver, K. Why Is Nature Beneficial?: The Role of Connectedness to Nature. Environ. Behav. 2008, 41, 607–643. [Google Scholar] [CrossRef]
  17. Capaldi, C.A.; Passmore, H.-A.; Nisbet, E.K.; Zelenski, J.M.; Dopko, R.L. Flourishing in nature: A review of the benefits of connecting with nature and its application as a wellbeing intervention. Int. J. Wellbeing 2015, 5, 1–16. [Google Scholar] [CrossRef]
  18. Fletcher, D.H.; Likongwe, P.J.; Chiotha, S.S.; Nduwayezu, G.; Mallick, D.; Md, N.U.; Rahman, A.; Golovatina-Mora, P.; Lotero, L.; Bricker, S.; et al. Using demand mapping to assess the benefits of urban green and blue space in cities from four continents. Sci. Total Environ. 2021, 785, 12. [Google Scholar] [CrossRef]
  19. Lafortezza, R.; Chen, J.; van den Bosch, C.K.; Randrup, T.B. Nature-based solutions for resilient landscapes and cities. Environ. Res. 2018, 165, 431–441. [Google Scholar] [CrossRef]
  20. WHO. Urban Green Spaces and Health—A Review of Evidence. Available online: http://www.euro.who.int/en/health-topics/environment-and-health/urban-health/publications/2016/urban-green-spaces-and-health-a-review-of-evidence-2016 (accessed on 14 April 2021).
  21. Roe, J. Cities, Green Space, and Mental Well-Being. In Oxford Research Encyclopedia of Environmental Science; Oxford University Press: Oxford, UK, 2016. [Google Scholar]
  22. Mao, B.; Liang, F.; Li, Z.; Zheng, W. Microclimates Potentially Shape Spatial Distribution of Facial Expressions for Urban Forest Visitors: A Regional Study of 30 Parks in North China. Sustainability 2022, 14, 1648. [Google Scholar] [CrossRef]
  23. Dadvand, P.; Nieuwenhuijsen, M. Green Space and Health. In Integrating Human Health into Urban and Transport Planning: A Framework; Nieuwenhuijsen, M., Khreis, H., Eds.; Springer International Publishing: Cham, Switzerland, 2019; pp. 409–423. [Google Scholar]
  24. Wendelboe-Nelson, C.; Kelly, S.; Kennedy, M.; Cherrie, J.W. A Scoping Review Mapping Research on Green Space and Associated Mental Health Benefits. Int. J. Environ. Res. Public Health 2019, 16, 2081. [Google Scholar] [CrossRef] [Green Version]
  25. Callaghan, A.; McCombe, G.; Harrold, A.; McMeel, C.; Mills, G.; Moore-Cherry, N.; Cullen, W. The impact of green spaces on mental health in urban settings: A scoping review. J. Ment. Health 2021, 30, 179–193. [Google Scholar] [CrossRef] [PubMed]
  26. Sharifi, F.; Levin, I.; Stone, W.M.; Nygaard, A. Green space and subjective well-being in the Just City: A scoping review. Environ. Sci. Policy 2021, 120, 118–126. [Google Scholar] [CrossRef]
  27. Sun, S.; Xu, X.; Lao, Z.; Liu, W.; Li, Z.; Higueras García, E.; He, L.; Zhu, J. Evaluating the impact of urban green space and landscape design parameters on thermal comfort in hot summer by numerical simulation. Build. Environ. 2017, 123, 277–288. [Google Scholar] [CrossRef]
  28. Park, B.-J.; Furuya, K.; Kasetani, T.; Takayama, N.; Kagawa, T.; Miyazaki, Y. Relationship between psychological responses and physical environments in forest settings. Landsc. Urban Plan. 2011, 102, 24–32. [Google Scholar] [CrossRef]
  29. Wei, H.X.; Ma, B.Q.; Hauer, R.J.; Liu, C.Y.; Chen, X.; He, X.Y. Relationship between environmental factors and facial expressions of visitors during the urban forest experience. Urban For. Urban Green. 2020, 53, 126699. [Google Scholar] [CrossRef]
  30. An, B.-Y.; Wang, D.; Liu, X.-J.; Guan, H.-M.; Wei, H.-X.; Ren, Z.-B. The effect of environmental factors in urban forests on blood pressure and heart rate in university students. J. For. Res. 2019, 24, 27–34. [Google Scholar] [CrossRef]
  31. Coombes, E.; Jones, A.P.; Hillsdon, M. The relationship of physical activity and overweight to objectively measured green space accessibility and use. Soc. Sci. Med. 2010, 70, 816–822. [Google Scholar] [CrossRef] [PubMed] [Green Version]
  32. Xu, C.; Haase, D.; Pribadi, D.O.; Pauleit, S. Spatial variation of green space equity and its relation with urban dynamics: A case study in the region of Munich. Ecol. Indic. 2018, 93, 512–523. [Google Scholar] [CrossRef]
  33. Akpinar, A. How is quality of urban green spaces associated with physical activity and health? Urban For. Urban Green. 2016, 16, 76–83. [Google Scholar] [CrossRef]
  34. Lai, H.; Flies, E.J.; Weinstein, P.; Woodward, A. The impact of green space and biodiversity on health. Front. Ecol. Environ. 2019, 17, 383–390. [Google Scholar] [CrossRef]
  35. Coventry, P.A.; Brown, J.E.; Pervin, J.; Brabyn, S.; Pateman, R.; Breedvelt, J.; Gilbody, S.; Stancliffe, R.; McEachan, R.; White, P.L. Nature-based outdoor activities for mental and physical health: Systematic review and meta-analysis. SSM-Popul. Health 2021, 16, 100934. [Google Scholar] [CrossRef] [PubMed]
  36. Li, H.; Wang, X.; Wei, H.; Xia, T.; Liu, M.; Ai, S. Geographical Distribution and Driving Meteorological Forces of Facial Expressions of Visitors in Urban Wetland Parks in Eastern China. Front. Earth Sci.-Hydrosphere. 2022. Provisionally Accepted. Available online: https://www.frontiersin.org/articles/10.3389/feart.2022.781204/abstract (accessed on 11 February 2022).
  37. White, M.P.; Pahl, S.; Wheeler, B.W.; Fleming, L.E.F.; Depledge, M.H. The ‘Blue Gym’: What can blue space do for you and what can you do for blue space? J. Mar. Biol. Assoc. U. K. 2016, 96, 5–12. [Google Scholar] [CrossRef]
  38. Sutton-Grier, A.E.; Sandifer, P.A. Conservation of Wetlands and Other Coastal Ecosystems: A Commentary on their Value to Protect Biodiversity, Reduce Disaster Impacts, and Promote Human Health and Well-Being. Wetlands 2019, 39, 1295–1302. [Google Scholar] [CrossRef] [Green Version]
  39. White, M.P.; Weeks, A.; Hooper, T.; Bleakley, L.; Cracknell, D.; Lovell, R.; Jefferson, R.L. Marine wildlife as an important component of coastal visits: The role of perceived biodiversity and species behaviour. Mar. Policy 2017, 78, 80–89. [Google Scholar] [CrossRef]
  40. Maund, P.R.; Irvine, K.N.; Reeves, J.; Strong, E.; Cromie, R.; Dallimer, M.; Davies, Z.G. Wetlands for Wellbeing: Piloting a Nature-Based Health Intervention for the Management of Anxiety and Depression. Int. J. Environ. Res. Public Health 2019, 16, 4413. [Google Scholar] [CrossRef] [PubMed] [Green Version]
  41. Andreucci, M.B.; Russo, A.; Olszewska-Guizzo, A. Designing Urban Green Blue Infrastructure for Mental Health and Elderly Wellbeing. Sustainability 2019, 11, 6425. [Google Scholar] [CrossRef] [Green Version]
  42. Wei, H.; Hauer, R.J.; Guo, S. Daytime dynamic of spontaneous expressions of pedestrians in an urban forest park. Urban For. Urban Green. 2021, 65, 127326. [Google Scholar] [CrossRef]
  43. Wei, H.X.; Hauer, R.J.; Chen, X.; He, X.Y. Facial Expressions of Visitors in Forests along the Urbanization Gradient: What Can We Learn from Selfies on Social Networking Services? Forests 2019, 10, 1049. [Google Scholar] [CrossRef] [Green Version]
  44. Wei, H.X.; Hauer, R.J.; He, X.Y. A forest experience does not always evoke positive emotion: A pilot study on unconscious facial expressions using the face reading technology. For. Policy Econ. 2021, 123, 102365. [Google Scholar] [CrossRef]
  45. Ekman, P. Facial epxression and emotion. Am. Psychol. 1993, 48, 376–379. [Google Scholar] [CrossRef]
  46. Guan, H.M.; Wei, H.X.; Hauer, R.J.; Liu, P. Facial expressions of Asian people exposed to constructed urban forests: Accuracy validation and variation assessment. PLoS ONE 2021, 16, e0253141. [Google Scholar] [CrossRef] [PubMed]
  47. Liu, P.; Liu, M.N.; Xia, T.T.; Wang, Y.T.; Wei, H.X. Can Urban Forest Settings Evoke Positive Emotion? Evidence on Facial Expressions and Detection of Driving Factors. Sustainability 2021, 13, 8687. [Google Scholar] [CrossRef]
  48. Wei, H.X.; Hauer, R.J.; Zhai, X.Q. The Relationship between the Facial Expression of People in University Campus and Host-City Variables. Appl. Sci. 2020, 10, 1474. [Google Scholar] [CrossRef] [Green Version]
  49. Pedersen, E.; Weisner, S.E.B.; Johansson, M. Wetland areas’ direct contributions to residents’ well-being entitle them to high cultural ecosystem values. Sci. Total Environ. 2019, 646, 1315–1326. [Google Scholar] [CrossRef]
  50. Sina Weibo. Weibo.com: Discovering Novelties Whenever and Wherever Possible. Available online: https://weibo.com/ (accessed on 10 October 2021).
  51. Mafengwo Traveling. Mafengwo Official Webpage. Available online: http://www.mafengwo.cn/ (accessed on 10 October 2021).
  52. Xiaohongshu Marks of Lives. Xiaohongshu Webpage. Available online: https://www.xiaohongshu.com/ (accessed on 10 October 2021).
  53. Zhihu Q&A. Zhihu Q&A Webpage. Available online: https://www.zhihu.com/signin?next=%2F (accessed on 10 October 2021).
  54. Keltner, D.; Ekman, P. Chapter 15: Facial Expression of Emotion. In Handbook of Emotions, 2nd ed.; Lewis, M., Haviland-Jones, J., Eds.; Guilford Publications, Inc.: New York, NY, USA, 2000; pp. 151–249. [Google Scholar]
  55. USGS. USGS EarthExplorer. Available online: https://earthexplorer.usgs.gov/ (accessed on 21 October 2021).
  56. Zhao, H.; Ren, Z.; Tan, J. The Spatial Patterns of Land Surface Temperature and Its Impact Factors: Spatial Non-Stationarity and Scale Effects Based on a Geographically-Weighted Regression Model. Sustainability 2018, 10, 2242. [Google Scholar] [CrossRef] [Green Version]
  57. Baidu Map. Baidu Map: World Prospect. Available online: https://www.map.baidu.com (accessed on 11 October 2021).
  58. NASA EarthData. NASA EarthData. Available online: https://search.earthdata.nasa.gov/search/?ac=true&m=0.0703125!0!2!1!0!0%2C2 (accessed on 27 October 2021).
  59. JAEA. Japan Aerospace Exploration Agency: ALOS World 3D-30m. Available online: https://doi.org/10.5069/G94M92HB (accessed on 28 October 2021).
  60. Conover, W.J.; Iman, R.L. Rank transformations as a bridge between parametric and nonparametric statistics. Am. Stat. 1981, 35, 124–129. [Google Scholar]
  61. Panger, G.T. Emotion in Social Media; University of California: Berkeley, CA, USA, 2017. [Google Scholar]
  62. Liu, P.; Liu, M.; Xia, T.; Wang, Y.; Guo, P. The Relationship between Landscape Metrics and Facial Expressions in 18 Urban Forest Parks of Northern China. Forests 2021, 12, 1619. [Google Scholar] [CrossRef]
  63. Zhang, J.; Yang, Z.; Chen, Z.; Guo, M.; Guo, P. Optimizing Urban Forest Landscape for Better Perceptions of Positive Emotions. Forests 2021, 12, 1691. [Google Scholar] [CrossRef]
  64. Hunt, E. Blue spaces: Why Time Spent Near Water Is the Secret of Happiness. Available online: https://www.theguardian.com/lifeandstyle/2019/nov/03/blue-space-living-near-water-good-secret-of-happiness (accessed on 3 November 2019).
  65. Pasanen, T.P.; White, M.P.; Wheeler, B.W.; Garrett, J.K.; Elliott, L.R. Neighbourhood blue space, health and wellbeing: The mediating role of different types of physical activity. Environ. Int. 2019, 131, 105016. [Google Scholar] [CrossRef]
  66. Lane, A.M.; Terry, P.C.; Stevens, M.J.; Barney, S.A.M.; Dinsdale, S.L. Mood responses to athletic performance in extreme environments. J. Sports Sci. 2004, 22, 886–897. [Google Scholar] [CrossRef]
  67. Bardwell, W.A.; Ensign, W.Y.; Mills, P.J. Negative mood endures after completion of high-altitude military training. Ann. Behav. Med. 2005, 29, 64–69. [Google Scholar] [CrossRef] [PubMed] [Green Version]
  68. de Aquino Lemos, V.; Antunes, H.K.M.; dos Santos, R.V.T.; Lira, F.S.; Tufik, S.; de Mello, M.T. High altitude exposure impairs sleep patterns, mood, and cognitive functions. Psychophysiology 2012, 49, 1298–1306. [Google Scholar] [CrossRef] [PubMed]
  69. Guo, W.; Chen, G.; Qin, J.; Zhang, J.; Guo, X.; Yu, J.; Song, P.; Lu, W.; Xu, B.; Li, J.; et al. Short-term high-altitude pre-exposure improves neurobehavioral ability. Neuroreport 2016, 27, 367–373. [Google Scholar] [CrossRef] [PubMed] [Green Version]
  70. Chow, W.T.L.; Akbar, S.N.A.B.A.; Heng, S.L.; Roth, M. Assessment of measured and perceived microclimates within a tropical urban forest. Urban For. Urban Green. 2016, 16, 62–75. [Google Scholar] [CrossRef] [Green Version]
Figure 1. Scattered dots of scores for happy (A) and sad (B) emotions and positive response index (PRI) (C) for people in different urban wetland parks. Scattered dots in light grey indicate original records of raw data. Dots in fully black color present mean values. Whiskers stand for standard errors that are ended by bars of upper and lower limits. All parks are ranked in a latitudinal order from left to right, as in the south to north order.
Forests 13 00473 g001
Figure 2. Spatial distribution patterns of happy scores of wetland forest visitors at different ages. Circles present the level of happiness in a positive relationship.
Forests 13 00473 g002
Figure 3. Spatial distribution patterns of positive response index (PRI) scores of wetland forest visitors at different ages. Circles present the level of happiness in a positive relationship.
Forests 13 00473 g003
Figure 4. Differences of facial scores for happy (A), sad (B), and PRI (happiness minus sadness) (C) between female and male visitors in wetland forests of East China. Error bars stand for standard errors. Different letters indicate significant difference according to Duncan’s test at the 0.05 level.
Forests 13 00473 g004
Figure 5. Conceptual descriptions of spearman correlations between landscape metrics and facial expression scores. Lines in red bridge two parameters with a positive relationship, and lines in blue with a negative. Abbreviations: GreenA, green-space area; blueA, blue-space area; TreeH, tree height; PRI, positive response index.
Forests 13 00473 g005
Figure 6. Spatial distributions of elevation (A), blue-space area (B), and blue-space area ratio to the whole park (C) of wetland forest parks in East China.
Forests 13 00473 g006
Figure 7. Spatial patterns of optimized distributions of happy (A) and positive response index (PRI) (B) scores using regressed scores against landscape metrics (Figure 6) in multivariate linear regression models (Table 4).
Forests 13 00473 g007
Table 1. Basic information about numbers of facial photo subjects in different wetland locations and varied genders and ages of visitors therein.
Variation and Varied ItemsTotal Number of Subjects: n = 947
CityWetland LocationNumber of SubjectsLongitudeLatitude
BeijingHanshi Bridge47116.8140.12
Dongjiao46116.6640.02
ZiboXiaofu River49117.9836.79
NanjingNanjing Yuzui48118.6731.97
ShanghaiDongtan48121.9531.52
Wusongpaotai Bay49121.5131.40
SuzhouTai Lake47120.4431.22
WuhanHouguan Lake42114.0730.55
HuzhouXiazhu Lake47120.0530.52
WuhanCanglong Isle47114.4230.40
ShaoxingJing Lake49120.5930.06
NanchangAixi Lake48115.9928.69
Jiulong Lake48115.8028.58
ChangshaYang Lake47112.9328.13
FuzhouWulong River48119.2426.04
XiamenWuyuan Bay46118.1824.52
GuangzhouDaguan50113.4223.18
Haizhu National50113.3423.07
Nansha49113.6522.61
DongguanHuayang Lake42113.5723.07
Gender
Female767
Male180
Age range
Toddler115
Adolescent24
Youth766
Middle aged33
Senior9
Table 2. Analysis of variance (ANOVA) of main effects and interactions among wetland park locations, and gender and age of visitors, on happy, sad, and positive response index (PRI) scores.
Source of VarianceDFHappySadPRI
FpFpFp
Location192.170.0031.90.0121.850.015
Gender116<0.00013.740.0537.680.006
Age44.150.0021.330.2581.90.108
Location × Gender171.580.06210.4561.420.121
Location × Age331.590.021.410.0651.660.012
Gender × Age30.10.960.270.8490.130.943
Location × Gender × Age111.290.2280.610.8190.790.646
Note: DF, degree of freedom; F, value of F test; p, significance level.
Table 3. Differences of happy and positive response index (PRI) scores for visitors in varied age ranges among wetland parks at different locations.
Age RangeWetland LocationNHappyPRI
MeanSEDifferenceMeanSEDifference
ToddlerAixi Lake246.52 62.64 abcdefg43.44 66.37 abcde
Canglong Isle544.16 38.65 abcdefg37.86 39.63 abcde
Dongjiao85.88 9.79 defg−12.29 21.25 cdef
Houguan Lake1113.42 26.79 cdefg−9.04 37.81 cdef
Hanshi Bridge1242.96 39.01 abcdefg34.81 45.20 abcde
Huayang Lake60.23 0.26 fg−9.94 4.56 cdef
Haizhu National10.02 0.00 g−2.79 0.00 bcdef
Jing Lake450.00 53.70 abcdef46.92 57.09 abcd
Jiulong Lake1431.65 35.40 bcdefg18.28 40.64 abcdef
Nansha1128.04 33.01 bcdefg17.91 38.42 abcdef
Tai Lake192.52 0.00 abc92.43 0.00 abc
Wulong River569.63 38.31 abcde46.63 73.82 abcd
Wusongpaotai Bay449.99 53.54 abcdef45.04 59.25 abcd
Wuyuan Bay1225.84 28.09 bcdefg14.21 30.85 bcdef
Xiazhu Lake1954.15 36.14 abcdef48.16 40.22 abcd
AdolescentDongjiao595.11 8.07 ab94.53 8.90 ab
Dongtan123.70 0.00 abcdefg−26.01 0.00 def
Houguan Lake11.54 0.00 cdefg−77.02 0.00 f
Hanshi Bridge553.81 45.41 abcdef48.97 49.56 abcde
Haizhu National20.50 0.13 efg−3.26 4.49 bcdef
Jiulong Lake12.32 0.00 cdefg−23.18 0.00 def
Nansha567.11 42.40 abcd62.64 46.62 abc
Nanjing Yuzui430.82 43.17 bcdefg27.70 45.60 abcdef
YouthAixi Lake4131.56 31.41 abcdefg18.45 39.56 abcdef
Canglong Isle4228.84 33.78 bcdefg6.76 46.62 bcdef
Daguan5038.71 32.09 abcdefg28.21 39.17 abcdef
Dongjiao3342.11 34.88 abcdefg27.64 46.55 abcdef
Dongtan4160.88 33.49 abcde48.09 47.16 abcd
Houguan Lake3033.10 31.82 abcdefg18.20 41.18 abcdef
Hanshi Bridge2340.38 34.66 abcdef26.30 43.80 abcdef
Huayang Lake4352.87 35.75 abcde44.31 44.84 abcd
Haizhu National4332.52 34.08 abcdefg21.35 40.85 abcdef
Jing Lake4535.74 29.13 abcdefg24.63 33.45 abcdef
Jiulong Lake3043.31 33.39 abcdefg27.62 43.96 abcdef
Nansha2455.15 31.86 abcde45.30 37.55 abcd
Tai Lake4440.14 34.78 abcdefg28.17 43.14 abcdef
Wulong River4129.44 34.02 bcdefg5.06 48.93 bcdef
Wusongpaotai Bay4535.67 33.94 abcdefg20.18 44.52 abcdef
Wuyuan Bay2852.85 35.96 abcdef39.49 49.83 abcde
Xiaofu River4938.02 33.52 abcdefg21.81 43.55 abcdef
Xiazhu Lake2350.72 39.42 abcdef34.99 55.29 abcde
Yang Lake4733.23 31.74 abcdefg14.41 44.34 bcdef
Nanjing Yuzui4445.14 35.72 abcdefg31.15 45.39 abcde
Middle agedAixi Lake553.37 28.97 abcde43.02 37.46 abcd
Dongtan645.67 22.40 abcdef33.41 26.02 abcde
Hanshi Bridge541.58 38.87 abcdef28.96 45.19 abcdef
Haizhu National479.06 18.39 abcd75.94 20.58 abc
Jiulong Lake34.71 7.38 defg−43.92 7.56 ef
Nansha298.45 0.29 ab98.37 0.31 ab
Tai Lake179.34 0.00 abcd62.28 0.00 abcd
Wuyuan Bay496.63 3.35 ab96.08 4.03 ab
Xiazhu Lake365.20 52.26 abcde35.22 98.40 abcde
SeniorHanshi Bridge253.08 63.67 abcde44.81 74.80 abcd
Tai Lake168.54 0.00 abcde63.21 0.00 abcd
Wulong River299.91 0.07 a99.86 0.12 a
Wuyuan Bay261.43 29.09 abcde39.75 55.40 abcde
Xiazhu Lake258.26 55.06 abcd49.33 66.29 abcd
Note: SE, standard error. Different letters along a column indicate significant difference according to Duncan’s test at the 0.05 level.
Table 4. Multivariate linear regression of happy and positive response index (PRI) scores (ranked transformed) against blue-space area and elevation in wetland parks.
Facial ExpressionVariableParameterStandardType II SSFp
EstimateError
HappyIntercept10.89 2.09 576.96 27.01 <0.0001
BlueA5.71 2.33 128.81 6.03 0.0251
Elevation−0.23 0.10 116.06 5.43 0.0323
PRIIntercept10.70 2.16 501.62 24.63 0.0001
Elevation−0.27 0.10 163.74 8.04 0.0114
BlueR16.58 6.67 126.06 6.19 0.0235
Note: SS, sum of squares; F, value of F test; p, probably of significance; BlueA, blue-space area; BlueR, blue-space area ratio.
Publisher’s Note: MDPI stays neutral with regard to jurisdictional claims in published maps and institutional affiliations.

