Abstract
Timber haulage is the last phase of the raw timber production process, necessary to transport timber to the customer. To improve the efficiency of logging truck operations, it is necessary to observe and assess several operational parameters through the electronic systems installed on the logging trucks. Measurements for this study were conducted for three logging truck types, which hauled 24,648 m3 of timber over 54,857 km and 1232 round trips. The RMC system was used for truck monitoring, equipped with a CAP04 capacitance sensor and a WGS 48 GPS module. The monitoring was continuous, lasting 27 to 74 weeks. Data acquired were evaluated via regression and correlation analyses and ANOVA. The results showed a moderately strong negative correlation between haulage productivity and haulage distance, ranging from r = −0.47 to r = −0.68. Simultaneously, a rather low efficiency of timber haulage was found for long-range haulage caused by legislation-based small utilization of the load-carrying capacity of the logging trucks. This showed in increased fuel consumption per production unit (2.01 Lm−3) as well as increased carbon emissions production (5.54 kg m−3).
1. Introduction
Timber haulage is an important link in the raw timber supply chain, with substantial amounts of energy consumption and costs connected to it. Logging trucks, either equipped with or without hydraulic manipulators, are the most abundant machines used in timber haulage [1]. For example, in Finland, 75% of timber is transported to mills by trucks [2]. The rest, 25%, is transported to mills either by train (22%) or waterways (3%), though these, too, include roundwood trucking at the beginning of transportation chain (50 km on average). A large majority of Sweden’s cargo is transported on the road and a special case of that is timber transports. The total fleet of timber trucks consists of over 1600 registered trucks that transported 60 million tonnes of roundwood last year [3]. Furthermore, the State Forests National Forest Holding in Poland harvested over 42 million m3 of timber in 2018 and supplied it to several thousand recipients, which presented a major transportation challenge both in terms of logging operations and product transport. In most cases, approximately 90% of the transport is conducted by vehicles using high-tonnage five- or six-axle truck units [4].
These trucks and their equipment are specifically designed for timber haulage and can be used to transport other goods only to a limited extent [5]. Other than their operation on public roads, their design must enable their movement on the narrow, frequently unpaved, forest roads [6]. Accounting for 40 to 60% of all transport costs, timber haulage is also the costliest transport operation [7]. In central Europe, timber haulage accounts for about 30% of the price of roundwood [8], whereas according to [9] it accounts for about 45% of the total operational costs of forest harvesting. A substantial portion of the costs is connected to fuel consumption, and [10] reports fuel costs are around 35% of the total operational costs of timber haulage in Sweden. Another substantial cost type in timber haulage is the investment cost. The whole investment cost of a low-bed truck consists of the price of the truck chassis and the platform, including mounting. The purchase price of a truck is between EUR 90,000 and EUR 110,000 (excluding value-added tax), with the purchase price level depending on the quality of the equipment installed and the number of axles (contractor interviews, 2005). The price of the trailer platform ranges from EUR 16,000 to EUR 21,000 (excluding the value-added tax) including installation costs [11]. Therefore, companies that operate logging trucks try to reduce their travel, thus increasing their efficiency and competitiveness [12]. According to [1], efficiency can be increased by optimizing routes, decreasing travel time, and increasing the cargo capacity, through fleet management systems. Furthermore, [13] and [14] state that reducing the variability of loads by their consistent maximization to the limits of the applicable public transport regulations are key to improving the efficiency of timber transport. In the USA, maintaining a uniform timber load weight can save approximately 4 to 14% of timber haulage operational costs [15]. Authors of [16] believe that between 5 and 10% of fuel can be saved by fitting wind deflectors and removing unnecessary accessories that can increase drag, such as signboards, extra air horns, extra lamps, among others. According to [17] and [18], timber transport contributes to environmental problems on various scales, ranging from local emissions to global climate change. In Sweden, [19] estimates that roundwood timber haulage accounts for an annual emission of 428,000 tons of CO2. The author of [20] argues that replacing 60 t vehicle combinations with 76 t vehicles could reduce the CO2 and NOx emissions by 32% and 41%, respectively, thus reducing the overall contribution of timber haulage to climate change.
This study is focused on analysing the parameters of logging trucks used in different operational modes in mountainous terrains of the Western Carpathians. Based on the temporal analyses of particular operations, fuel consumption, and productivity, we aim to identify the main factors affecting these parameters in the various operational modes, thus enabling the improvement of timber haulage efficiency, productivity, and reduction of its CO2 emissions.
2. Materials and Methods
Measurements were conducted on three types of logging trucks owned by the University Forest Enterprise of the Technical University in Zvolen (UFE). The University Forest Enterprise managed forests in three geographic areas—the Kremnica mountains, Stiavnica mountains, and Javorie—covering 9724 ha of forest land. Natural conditions were variable, with altitudes ranging from 250 to 1025 m asl. The forest enterprise was organized into a headquarters (located in Zvolen, Slovakia), forest district (in Budča), and a conversion depot (in Lieskovec). Deciduous trees, mainly beeches, oaks, and hornbeams, accounted for approximately 82% of all trees in the forest stands; the remainder was composed of mainly spruces and firs.
The annual volume of harvested timber was 36,991 m3 (2020), including broadleaves (28,307 m3) and coniferous (8684 m3). The forest road density at the UFE was about 47.5 m/ha−1. Almost 120,000 m of roads were suitable for timber haulage, either year-round (the so-called 1L-type roads) or seasonally (the so-called 2L-type roads). These were used by logging trucks owned by the UFE or by machines owned by companies contracted to perform timber haulage for the UFE. The University Forest Enterprise owned several logging trucks equipped for primary and secondary timber haulage. Stems and longwood (max. 12 m long) were hauled in primary haulage by stinger-steered log trailer trucks and fixed-length log trailer trucks owned by the UFE from roadside landings to the conversion depot, where the timber was converted into assortments. Secondary haulage of pulpwood (4 m long assortments) was secured by fixed-length log trailer trucks from the roadside landings or the conversion depot to the paper mill in Ružomberok (approximately 70 km from the headquarters in Zvolen). The University Forest Enterprise operates 195 roadside landings with a minimal haulage distance of 6.4 km and maximal distance of 29.8 km from the conversion depot in Lieskovec.
Observations of operational parameters were conducted on three different types of logging trucks employed in both primary and secondary haulage and were owned by the UFE:
- SCANIA P450—made by Scania AB, Södertälje, Sweden (truck with stinger-steered trailer and a hydraulic manipulator) for primary haulage (P4),
- SCANIA G500—made by Scania AB, Södertälje, Sweden (truck with a fixed-length log trailer and a hydraulic manipulator) for primary haulage and loading of logging trucks for secondary haulage (G5),
- SCANIA G440—made by Scania AB, Södertälje, Sweden (truck with a fixed-length log trailer) for secondary haulage (G4).
Basic technical parameters of the observed logging trucks are shown in Table 1.

Table 1.
Technical parameters of the observed logging trucks.
To monitor the logging trucks, we used a remote monitoring control (RMC) system (PARTNER mb, Prague, Czech Republic). The system was composed of an FMS data bus and a capacitive fuel sensor (CAP 04) located in the vehicle’s fuel tank. The system also contained a general communication module equipped with sensors and a WGS 84 GPS module that transmitted the truck’s locations along with the operational data to a server where the data were processed and displayed on the RMC system’s web-based application (Figure 1).
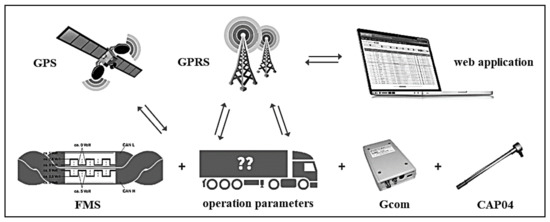
Figure 1.
Graphical depiction of the functions of the RMC system and the communication of its components [21].
The system enabled a continuous monitoring of the operational parameters of the logging trucks. Data were gathered in PDF or XLSX formats as either a daily summary report or as the values of particular parameters at one-minute intervals. Operational parameters were observed during the following periods:
- 16 July 2019 to 14 December 2020 (74 weeks) SCANIA P 450,
- 15 January 2020 to 14 December 2020 (47 weeks and six days) SCANIA G500,
- 17 July 2019 to 24 January 2020 (27 weeks and three days) SCANIA G440.
The empirical material consisted of the summary data from the daily reports and information on the volume of each load gathered from the databases of the UFE containing individual haulage dockets. Each docket contained information on the time (day and time of loading), and the load itself (number of logs, length, midspan diameters, volume in m3, tree species). The load volume was, depending on the tree species and its state (freshly felled or air dried), converted into mass. The load was limited by the maximal permissible mass of the rig in Slovakia—40 t, according to the Regulation of the European Council no. 2015/719 from 25 April 2015, which amended the Regulation of the European Council no. 96/53 ES from 25 July 1996 [22].
From the databases and reports, the following parameters were extracted: (i) number of trips (v1); (ii) total daily travel distance (km) (v2); (iii) logging truck speed (km/h−1) (v3); (iv) load volume (m3) (v4); (v) daily output (m3) (v5); (vi) shift duration (h) (v6); (vii) delays duration (h) (v7); (viii) engine operational time (h) (v8); (ix) total travel duration (h) (v9); (x) total braking duration (h) (v10); (xi) total duration of hydraulic manipulation operations (h) (v11); (xii) total duration of engine idling (h) (v12); (xiii) fuel consumption (l/100 km) (v13)); (xiv) total fuel consumption (v14); (xv) total CO2 emitted (kg) (v15); (xvi) CO2 emissions per 1 km of travel (kg) (v16). Total CO2 emissions were calculated by the RMC system installed in all logging trucks from the truck fuel consumption by a coefficient of 2.68 kg CO2 per litre of diesel consumed.
The following parameters were calculated from the aforementioned parameters: (xvii) haulage distance (km) (Equation (1); v17); (xviii) productivity (m3 × h−1) (Equation (2); v18); (xix) fuel consumption per cubic meter of hauled timber (l/m3) (Equation (3); v19); (xx) fuel consumption (l/km) (Equation (4); v20); (xxi) CO2 emissions per cubic meter of hauled timber (kg/m3) (Equation (5); v21); (xxii) CO2 emissions per hour of operation of the logging trucks (kg/h) (Equation (6); v22); (xxiii) CO2 emissions (kg) outside of driving (Equation (7); v23).
To analyse the relationships between the variables, regression and correlation analyses between v18 and v17, v19 and v17, and v23 and v11 were conducted. Multiple regression and correlation analysis was used between v15 and v2, v5. One-way ANOVA and Duncan’s test were used to compare the significance of the differences between variables v13, v14, v19, and v20 for the particular logging trucks (P4, G5, G4). We used STATISTICA 12 and MS Excel for the purposes of data processing and analysis.
3. Results
The logging trucks hauled 24,648 m3 of timber over 1232 trips during the whole observed period. In total, they travelled 54,857 km and consumed 30,137 L of fuel (Table 2).
Table 2.
Summary of selected timber haulage parameters for the Scania P450 (P4), G500 (G5), and G440 (G4) logging trucks.
Mean haulage distance ranged between 18.62 and 72.14 km (Table 3), longer haulage distances were typical for secondary haulage. Individual logging trucks made 1.68 to 3.59 trips daily, with the least trips recorded for the G4 logging truck, which handled the secondary haulage of pulpwood from Zvolen to Ružomberok. Mean daily travel ranged between 76 and 225 km depending on the type of haulage (primary or secondary). The smallest daily travel was recorded for the G5 truck as this logging truck loaded and unloaded the G4 truck for secondary haulage, resulting in smaller amounts of trips taken by the G5 between the roadside landings and the conversion depot. The mean speed of the logging trucks ranged between 48 and 54 km/h−1, with the highest speed recorded for the G4, which travelled mostly on motorways and primary roads.
Table 3.
Mean values of selected operational parameters of the Scania P450 (P4), G500 (G5), and G440 (G4) logging trucks.
The mean load volume ranged between 18.35 and 27.14 m3. Logging trucks used predominantly in primary haulage of longwood had greater gross service mass, mainly because they were equipped with hydraulic manipulators and reinforced truck and trailer chassis, thus resulting the smaller overall load volumes. The G4 truck hauled 32% larger loads compared to the G5 and 28% larger loads compared to the P4.
Daily productivity varied between 37.95 m3 and 69.80 m3 and was affected mainly by the volume of the transported logs and travel distance. The relationship between travel distance and productivity was confirmed by the regression and correlation analysis: P4 (R = −0.59; p = 0.00), G5 (R = −0.48; p = 0.00), G4 (R = −0.39; p = 0.00). Hourly productivity of timber haulage based on the haulage distance can be seen on Figure 2. The drop in hourly productivity when haulage distance increased was more substantial for the G5 and P4 logging trucks, which were not intended for long-range timber haulage. The mean hourly timber haulage productivity was: 9.12 m3 × h−1 (P4), 5.29 m3 × h−1 (G4), where the lower productivity was caused by the longer travels and delays, and 5.07 m3 × h−1 (G5), because it was used to loading other logging trucks. The relationship between haulage distance and hourly haulage productivity was moderately strong for all observed logging trucks (Table 4).
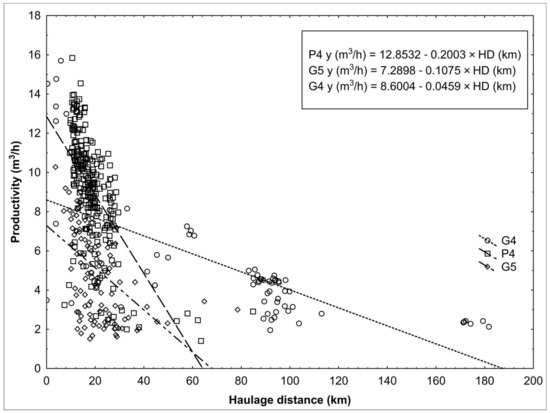
Figure 2.
Productivity of the Scania P450 (P4), G500 (G5), and G440 (G4) logging trucks based on the haulage distance.
Table 4.
Outcomes of the regression and correlation analysis between hourly productivity (y; m3 × h−1) and haulage distance (HD; km).
Duration of shifts differed for trucks used in primary and secondary haulage (Table 5). The longer overall duration of the work shift of the G4 truck was caused by the combination of haulage over longer distances and delays at the entry of the paper mill in Ružomberok (1.90 h). The distribution of the operational time of the logging trucks can be seen in Table 5. The distribution among travel, braking, and using the hydraulic manipulator was relatively uniform for the two trucks equipped with the device. The G5 truck drivers left the engine idling substantially longer than P4 truck drivers because they loaded other logging trucks with the G5’s hydraulic manipulator. The G4 logging truck had an even longer engine idling time than the two trucks used for primary haulage. This was caused by the need to use air conditioning or heating during the delays at the entry of the paper mill.
Table 5.
Duration of selected operational parameters of the Scania P450 (P4), G500 (G5), and G440 (G4) logging trucks during the work shifts and their share on the total shift duration in %.
Mode of operation of the logging trucks affected their fuel consumption. The lowest consumption per unit of distance was recorded for the G4 truck as it was hauling timber over longer distances, on smooth, paved roads (Figure 3). The truck that consumed the most fuel per km was the G5, which hauled over smaller distances through difficult terrains, secured haulage of pulpwood from roadside landings to the paper mill, and was used to load other trucks for secondary haulage. From a different perspective, haulage distance and the number of trips the trucks were able to achieve inverted the perceived fuel consumption per cubic meter. Here, the G4 truck seemed the least fuel efficient, whereas the P4 truck seemed the most efficient. The longer duration of the trips of the G4 truck, and the delays caused by loading other trucks for the G5 decreased their haulage output, thus increasing their consumption per cubic metre.
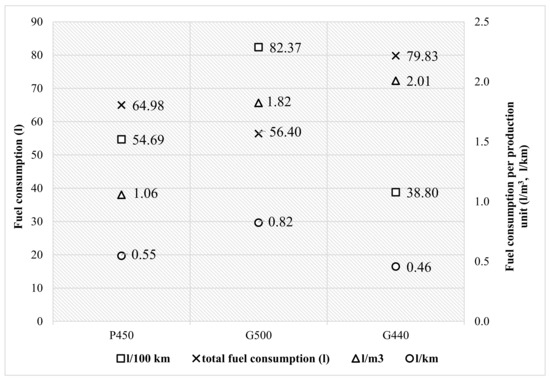
Figure 3.
Fuel consumption per 100 km, total fuel consumption in L, fuel consumption per m3 of hauled timber and per travel distance.
One-way ANOVA and Duncan’s test proved that differences between the fuel consumption in litres per 100 km and fuel consumption per unit of distance (km), as well as the between total fuel consumption, were significant (both p = 0.00). Analysis of variance showed significant differences between the fuel consumptions of the trucks per cubic metre (p = 0.00), however, the differences between G4 and G5 were not significant. Regression and correlation analysis showed a strong relationship between fuel consumption in litres per cubic metre and haulage distance for the G4 and P4 trucks and a moderately strong relationship for the G5 truck (Table 6).
Table 6.
Output of the regression and correlation analysis between the fuel consumption (y; L m−3) and haulage distance (HD; km) for the Scania P450 (P4), G500 (G5), and G440 (G4) logging trucks.
The impacts of timber haulage on climate can be expressed through the production of carbon dioxide emissions. The total carbon dioxide emission production ranged from 152 to 220 kg per shift (Table 7). The most carbon-efficient truck from a haulage distance point of view was the G4, with about 1 kg of CO2 emitted per km travelled. However, if we look at haulage output in m3, then the P4 haulage truck seemed to be the most efficient, with about 2.8 kg of CO2 emitted per m3 of hauled timber.
Table 7.
Carbon dioxide production of the Scania P450 (P4), G500 (G5), and G440 (G4) logging trucks.
Multiple regression and correlation analysis showed that there was a very strong, significant relationship between the independent variables total driving distance and volume of hauled timber and the amount of CO2 emitted for all observed trucks (Table 8). The outcomes of the analysis showed that the total driving distance had the most impact on the dependent variable. The remainder of the carbon emissions was attributed mainly to working with the hydraulic manipulator. The P4 and G5 trucks showed a very strong relationship (P4–r = 0.94; G5–r = 0.95) between the duration of operation of their hydraulic manipulators and fuel consumption, excluding the drive operation. In the case of the G4 truck, carbon dioxide emitted when the truck was not travelling was attributed to the engine idling during the delays at the paper mill.
Table 8.
Multiple regression and correlation analysis showing relationship between CO2 (kg) production as a dependent variable and driving distance and volume of hauled timber as an independent variable.
4. Discussion
The mean haulage distance between 19 and 72 km observed in this study seems to be relatively standard for road timber haulage in the EU. To compare, [5] reported haulage distances ranging from 29 to 76 km, while [1] reported slightly longer maximal distances, between 27 and 102 km. In Finland, [6] stated that unloaded logging trucks travel 33 km on average and when loaded they travel approximately 67 km. The differences were caused by the differing technologies of timber haulage, terrain configurations, as well as locations of the timber processing plants.
Loads ranged between 18 and 20 m3 for primary haulage and were on average 27 m3 for secondary haulage. In Austria, the loads are typically 25 m3 according to [1], whereas [5] stated a mean load volume of 25 m3, 23 m3, 28 m3 for three different logging trucks (IVECO, TATRA, Mercedes-Benz). In both countries, the load volumes were larger than in Slovakia, mainly because in our case, the species hauled were hardwoods, with greater bulk densities than softwoods. Legislation, too, affected the load volumes. In the Czech Republic, the maximal permitted mass of a haulage rig is 48 t, and in Austria, logging trucks that haul timber from forests up to 100 km away from the processing plant can have a mass of up to 44 t, thus enabling haulage of larger volumes.
Productivity is the most important operational parameter in timber haulage. Researchers of [1] stated that productivity of a logging truck at a 50 km haulage distance, with a load of 25 m3, is 6.5 m3/h−1. Our results were similar to this figure, when the P4 logging truck achieved a productivity of 9.12 m3 × h−1 at a haulage distance of 19 km and mean load volume of 20 m3. The G5, hindered by the need to load and unload other trucks, reached a productivity of 5.07 m3/h−1 at a haulage distance of 21 km and a mean load volume of 18 m3. Perhaps the best comparable to thein [1] was the G4, which reached 5.29 m3/h−1 productivity at a 72 km haulage distance and 27 m3 mean load volume. Authors of [1] also stated that fixed-length trailers used for long-range haulage achieve greater productivity than stinger-steered trailers, mainly due to their ability to haul greater loads, which was also the case in our study.
Up to 60% of all operational time of haulage trucks is spent travelling (either loaded or unloaded) [1]. Furthermore, 27% of operational time is spent loading and unloading the trucks. These values are reported for cases where haulage distance from the roadside to the processing plant are about 50 km. In our case, driving accounted for 42 to 50% of the total shift time in the case of primary timber haulage and 59% in the case of secondary haulage to the customer. The differences are caused by the shorter haulage distances in our case (19 to 21 km distance for primary haulage), whereas for secondary haulage our data could be distorted because the G4 truck drivers worked non-standard, prolonged, shifts.
When comparing the duration of operation of the hydraulic manipulator, [1] stated a share of 28%, which included loading at the roadside and unloading at the processing plant, by the log yard loaders. In our case, the share of this operation was greater, around 45%. This was due to the shorter haulage distance, subsequent shorter trips we observed, and the fact that there was no machinery aiding the logging truck unloading at the destinations.
Fuel economy is an important factor in timber haulage operations. Authors of [5] stated a similar consumption of fuel per 100 km to our figures. The trucks they observed consumed between 58 and 72 L/100 km. In our case, the range was between 39 and 82 L/100 km. In their study, [5] showed that there is a negative correlation between fuel consumption and haulage distance, i.e., the longer the haul, the smaller the consumption. In our study, this was also the case, though the correlations were very weak, and in the case of the G5 truck, the relationship was insignificant. The weak correlations can be attributed to the variability of the road conditions and short haulage distances (i.e., greater share of travel over forest roads). Per cubic metre, [5] reported a mean fuel consumption between 2 and 3 L m−3. Authors of [1] reported a mean consumption of 2 L/m−3. In our study, the fuel consumption per cubic metre was between 1 and 2 (L/m−3). Higher consumptions were recorded for longer haulage distances, which is supported by [5]. Per kilometre, [1] reported a mean fuel consumption of 0.77 L/km−1, whereas [23] reported 0.56 L/km−1 for longer hauls over small slopes in Sweden. Authors of [24] reported 0.62 L/km−1 fuel consumption in southwestern Victoria, Australia, for six-axle single or semi-trailer trucks (42.5 to 45.5 t mass) and 0.67 L/km−1 for nine-axle double B trucks (62.5 to 68 t mass). The logging trucks we observed reached similar fuel consumptions, from 0.55 to 0.82 L/km−1, with the higher consumptions being reached in cases with a large share of travel on forest roads. In cases of secondary haulage, the mean fuel consumption was 0.46 L/km−1, though in this case the logging truck travelled on paved motorways or primary roads.
Considering the mitigation of climate change, the logging trucks compliant to emission standards EURO 5 and 6 used in this study emitted 1.04 to 2.21 kg of CO2 per km or 2.83 to 5.54 kg of CO2 per m3 of hauled timber. This was considerably lower than figures reported by [1], who stated mean carbon emissions of 2.05 kg km−1 and 5.55 kg m−3.
That the G4 truck emitted the most CO2 per m3 of hauled timber points to the fact that with the 40-t maximum permissible mass of rigs, long-distance road haulage is rather unfriendly in terms of climate change. Based on the results, we can state that to improve the efficiency and productivity of the logging trucks, it would be necessary to increase the maximal capacity from 40 t to 44 or 48 t, similar to Austria and the Czech Republic. This would increase the size of hauled loads, improve utilization of the logging truck capacities, and decrease the number of trips needed and the travel distances, which would translate into decreased fuel consumption. Authors of [25] stated that the Finnish forest industry has been demanding higher loads for trucking. Although gross weights for trucks are already at the top of the European scale, both Finland and Sweden are pushing toward higher gross weights. In Finland, the maximum weight of the trucks has been increased to 76 t for vehicles equipped with four axles on the truck and five on the trailer [26]. In Sweden, the research project ETT, Modular System for Timber Transport has run vehicles with a gross weight of up to 90 t on public roads. In Sweden, the argument for an increase in gross weights has been supported by lower fuel consumption and therefore lower emissions of environmental contaminants along with lower transport costs [27]. Another improvement could stem from reducing the unproductive delays, observed both in primary and secondary haulage, which accounted for about 20% of total shift duration.
5. Conclusions
Logging trucks are the most popular technology of timber haulage in Europe. Observing their operational parameters in order to optimize travel distances and eliminating inefficiencies can save their operators considerable amounts of money through improved fuel consumption, machine reliability, and part wear. Society, on the other hand, would benefit from the smaller carbon footprint of timber haulage.
The presented paper compared various operational parameters of two modes of timber haulage in terms of productivity, time intensiveness of particular operations, fuel consumption, and their climate impacts. Further research is needed to confirm the relationships found in this study based on a larger number and variety of trucks and with a more detailed view on the factors affecting operational parameters throughout driving operations. A limitation of this study was the small variability of hauled load volumes in secondary timber haulage; larger variability would enable researchers to improve their ability to observe the effects of vehicle loading, along with its environmental impact, on a larger scale.
Author Contributions
Conceptualization, M.A. and M.J.; data curation, M.A.; formal analysis, M.A. and Z.D.; funding acquisition, J.M.; methodology, M.A.; project administration, J.M.; software, M.J.; supervision, M.A. and J.M.; validation, M.J.; visualization, Z.D.; writing—original draft, M.A.; writing—review & editing, Z.D. and M.J. All authors have read and agreed to the published version of the manuscript.
Funding
This work was supported by the Slovak Research and Development Agency (APVV) (grant number 15-0714). Mitigation of climate change risk by optimization of forest harvesting scheduling (grant number 18-0305). “Utilisation of progressive methods for evaluation of forest logging impacts on forest ecosystems and road network”, Scientific Grant Agency VEGA (grant number: 1/0241/20) “Optimization and environmental impact of logging technologies in close to nature forest management”, project FOMON-ITMS 313011V465, supported by the Operational Programme Integrated Infrastructure (OPII) funded by the ERDF.
Institutional Review Board Statement
Not applicable.
Informed Consent Statement
Not applicable.
Data Availability Statement
Data are available upon request from authors.
Conflicts of Interest
The authors declare no conflict of interest.
References
- Holzleitner, F.; Kanzian, C.; Stampfer, K. Analyzing time and fuel consumption in road transport of round wood with an onboard fleet manager. Eur. J. For. Res. 2011, 130, 293–301. [Google Scholar] [CrossRef]
- Statistics of Finland. Goods Transport by Road (Statistics of Finland, Helsinki). 2013. Available online: https://tilastokeskus.fi/til/kttav/2013/02/kttav_2013_02_2013-09-27_tie_001_en.html (accessed on 16 January 2021).
- Johannes, E.; Ekman, P.; Huge-Brodin, M.; Karlsson, M. Sustainable Timber Transport—Economic Aspects of Aerodynamic Reconfiguration. Sustainability 2018, 10, 1965. [Google Scholar] [CrossRef]
- Trzciński, G.; Sieniawski, W.; Moskalik, T. Effects of Timber Loads on Gross Vehicle Weight. Folia. Pol. Ser. 2014, 55, 159–167. [Google Scholar] [CrossRef]
- Klvač, R.; Kolařík, J.; Volná, M.; Drápela, K. Fuel consumption in timber haulage. Croat. J. For. Eng. J. Theory Appl. For. Eng. 2013, 34, 229–240. [Google Scholar]
- Nurminen, T.; Heinonen, J. Characteristics and time consumption of timber trucking in Finland. Silva Fenica 2007, 41, 471–487. [Google Scholar] [CrossRef]
- Shaffer, R.M.; Stuart, W.B. A Checklist for Efficient Log Trucking. Virginia Cooperative Extension. Available online: https://vtechworks.lib.vt.edu/bitstream/handle/10919/54904/420-094.pdf?sequence=1 (accessed on 10 December 2017).
- Hirsch, P.; Gronalt, M. The timber transport order smoothing problem as part of the three-stage planning approach for round timber transport. J. Appl. Oper. Res. 2013, 5, 70–81. [Google Scholar]
- Audy, J.F.; D’Amours, S.; Rönnqvist, M. Planning Methods and Decision Support Systems in Vehicle Routing Problems for Timber Transportation: A Review; Interuniversity Research Centre on Enterprise Networks, Logistics and Transportation: Montreal, QC, Canada, 2012; p. 47. [Google Scholar]
- Svenson, G. 2011: The impact of road characteristics on fuel consumption for timber trucks. In Innovation in Forest Engineering–Adapting to Structural Change, Proceedings of 4th Forest Engineering Conference, Whire River, South Africa, 5–7 April 2011; Ackerman, P., Ham, H., Gleasure, E., Eds.; Stellenbosch University: Matieland, South Africa, 2011; ISBN 978-0-7972-1284-8. [Google Scholar]
- Väätäinen, K.; Asikainen, A.; Sikanen, L.; Ala-Fossi, A. The cost effect of forest machine relocations on logging costs in Finland. For. Stud. 2006, 45, 135–141. [Google Scholar]
- Trzciński, G.; Moskalik, T.; Wojtan, R. Total weight and axle loads of truck units in the transport of timber depending on the timber cargo. Forests 2018, 9, 12. [Google Scholar] [CrossRef]
- Sosa, A.; Klvac, R.; Coates, E.; Kent, T.; Devlin, G. Improving Log Loading Efficiency for Improved Sustainable Transport within the Irish Forest and Biomass Sectors. Sustainability 2015, 7, 3017–3030. [Google Scholar] [CrossRef]
- Lukason, O.; Ukrainski, K.; Varblane, U. Economic benefit of maximum truck weight regulation change for Estonian forest sektor. Veokite täismassi regulatsiooni muutmise majanduslikud mõjud eesti metsatööstuse sektorile. Est. Discuss. Econ. Policy 2011, 19, 87–100. [Google Scholar]
- Hamsley, A.K.; Greene, W.D.; Siry, J.P.; Mendell, B.C. Improving timber trucking performance by reducing variability of log truck weights. South. J. Appl. For. 2007, 31, 12–16. [Google Scholar] [CrossRef]
- Lofroth, C.; Lindholm, E.L. Reduced Fuel Consumption on Roundwood Haulage Rigs; Skogforsk Resultat No. 23; The Forestry Research Institute of Sweden: Uppsala, Sweden, 2005. [Google Scholar]
- Palander, T. Local factors and time-variable parameters in tactical planning models: A tool for adaptive timber procurement planning. Scand. J. For. Res. 1995, 10, 370–382. [Google Scholar] [CrossRef]
- Handler, R.M.; Shonnard, D.R.; Lautala, P.; Abbas, D.; Srivastava, A. Environmental impacts of roundwood supply chain options in Michigan: Life-cycle assessment of harvest and transport stages. J. Clean. Prod. 2014, 76, 64–73. [Google Scholar] [CrossRef]
- Andersson, G.; Frisk, M. Forestry Transports 2010. Arbetsrapport Från Skogforsk nr. 79. 2013. Available online: https://www.skogforsk.se/cd_20190114162259/contentassets/c0ef5042b44a4008a2c81579ac1d94bd/skogsbrukets-transporter-2010.pdf (accessed on 12 December 2020).
- Palander, T. The environmental emission efficiency of larger and heavier vehicles—A case study of road transportation in Finnish forest industry. J. Clean. Prod. 2017, 155, 57–62. [Google Scholar] [CrossRef]
- HanyTech s.r.o. Available online: http://www.hanytech.sk/popis-systemu/ (accessed on 20 January 2021).
- Directive (EU) 2015/719 of the European Parliament and of the Council of 29 April 2015 Amending Council Directive 96/53/EC Laying Down for Certain Road Vehicles Circulating within the Community the Maximum Authorised Dimensions in National and International Traffic and the Maximum Authorised Weights in International Traffic (Text with EEA Relevance). Available online: https://publications.europa.eu/en/publication-detail/-/publication/22b313fc-f3bc-11e4-a3bf-01aa75ed71a1/language-en (accessed on 26 January 2017).
- Lindholm, E.L. Energy Use in Swedish Forestry and Its Environmental Impact. Licentiate Thesis, SLU Service/Repro, Uppsala, Sweden, 2006; pp. 1–28, ISBN 91-576-7156-8. [Google Scholar]
- Griffin, R.; Brown, M. Forest Truck Fuel Consumption Survey. CRC for Forestry Bulletin 8. 2010. Available online: https://research.usc.edu.au/discovery/fulldisplay/alma99450039602621/61USC_INST:ResearchRepository (accessed on 20 April 2021).
- Malinen, J.; Nousiainen, V.; Palojarvi, K.; Palander, T. Prospects and challenges of timber trucking in a changing operational environment in Finland. Croat. J. For. Eng. J. Theory Appl. For. Eng. 2014, 35, 91–100. [Google Scholar]
- Korpilahti, A. 2013: Puutavara-Autot Mitta-ja Massamuutoksen Jälkeen. [Timbertrucks According New Height and Weight Restrcitions]. Metsätehon Tuloskalvosarja 11/2013. Available online: http://www.metsateho.fi/files/metsateho/Tuloskalvosarja/Tuloskalvosarja_2013_11_Puutavara-autot_mitta_ja_massamuutoksen_jalkeen_ak.pdf (accessed on 11 February 2014). (In Finnish).
- ETT–Modular System for Timber Transport. Skogforsk Project Brochure 2013: 38p. Available online: http://www.skogforsk.se/en/Press/ETT---Modular-system-for-timber-haulage/ (accessed on 13 February 2013).


Publisher’s Note: MDPI stays neutral with regard to jurisdictional claims in published maps and institutional affiliations. |
© 2021 by the authors. Licensee MDPI, Basel, Switzerland. This article is an open access article distributed under the terms and conditions of the Creative Commons Attribution (CC BY) license (https://creativecommons.org/licenses/by/4.0/).