Abstract
Vegetation plays a key role in ecosystem regulation and influences our capacity for sustainable development. Global vegetation cover has changed dramatically over the past decades in response to both natural and anthropogenic factors; therefore, it is necessary to analyze the spatiotemporal changes in vegetation cover and its influencing factors. Moreover, ecological engineering projects, such as the “Grain for Green” project implemented in 1999, have been introduced to improve the ecological environment by enhancing forest coverage. In our study, we analyzed the changes in vegetation cover across the Loess Plateau of China and the impacts of influencing factors. First, we analyzed the latitudinal and longitudinal changes in vegetation coverage. Second, we displayed the spatiotemporal changes in vegetation cover based on Theil-Sen slope analysis and the Mann-Kendall test. Third, the Hurst exponent was used to predict future changes in vegetation coverage. Fourth, we assessed the relationship between vegetation cover and the influence of individual factors. Finally, ordinary least squares regression and the geographically weighted regression model were used to investigate the influence of various factors on vegetation cover. We found that the Loess Plateau showed large-scale greening from 2000 to 2015, though some regions showed decreasing vegetation cover. Latitudinal and longitudinal changes in vegetation coverage presented a net increase. Moreover, some areas of the Loess Plateau are at risk of degradation in the future, but most areas showed a sustainable increase in vegetation cover. Temperature, precipitation, gross domestic product (GDP), slope, cropland percentage, forest percentage, and built-up land percentage displayed different relationships with vegetation cover. Geographically weighted regression model revealed that GDP, temperature, precipitation, forest percentage, cropland percentage, built-up land percentage, and slope significantly influenced (p < 0.05) vegetation cover in 2000. In comparison, precipitation, forest percentage, cropland percentage, and built-up land percentage significantly affected (p < 0.05) vegetation cover in 2015. Our results enhance our understanding of the ecological and environmental changes in the Loess Plateau.
1. Introduction
Over the past decades, research has increasingly focused on vegetation change, as it significantly influences the ecological environment and the capacity for sustainable development [1,2,3]. Vegetation plays a key role in ecosystem regulation, surface evaporation, soil erosion, and surface temperature [4,5,6,7]. Moreover, the distribution of vegetation determines ecosystem patterns that form various ecological landscapes. Vegetation change also alters the original ecological regulation, creating an ecological imbalance or forming neo-ecosystems that may be influenced by natural or anthropogenic factors [8,9]. Therefore, it is necessary for researchers to monitor vegetation change and determine the dominant vegetation patterns.
In recent years, remote sensing has become one of the most important methods for obtaining data. In particular, the satellites designed for vegetation monitoring are more convenient than ground-based observations [10]. The Normalized Difference Vegetation Index (NDVI) reflects the canopy density and growth of vegetation, which is a more convenient technique for analyzing present ecosystems. Multi-resource, numerous, and highly accessible datasets of NDVI, such as AVHRR, SPOT, and MODIS, are provided by various platforms that allow researchers to investigate long-term and large-scale vegetation cover change. Due to the importance of vegetation, research has increasingly focused on the spatiotemporal variability of vegetation coverage across the world, such as in the United States [11] and Brazil [12]. The available evidence suggests that both physical and anthropogenic factors drive vegetation cover changes under the background of climate change and carbon dioxide concentrations; however, vegetation cover changes in different regions are dominated by diverse natural elements and anthropogenic disturbance [13,14]. Natural factors, such as precipitation, temperature, and topography, alter the spatial distribution of vegetation cover [15]. Climate, in particular, has a major influence on the spatial pattern of vegetation [16]. Human activities, such as rapid urban development and ecological engineering, have been found to have a positive and negative influence on vegetation cover [17]. With the increasing risk of ongoing ecological deterioration, the Chinese government launched the “Grain for Green” plan, which aims to increase vegetation cover in regions of steep gradients by converting anthropogenic crops into tree canopy or grass [18]. The Loess Plateau was one of the most fragile regions in the world. Ecological engineering projects played a key role in the fragile region which could accelerate the local improvement of the environment. Therefore, the research on the above-mentioned vulnerable areas is worthy of attention.
Traditional regression models lack consideration of spatial location on features. According to the first law of geography, similar things are more closely related; in other words, things with similar positions will have a close relationship in space. Nevertheless, previous studies have neglected to assess the interaction between spatial elements and only focused on the relationship between vegetation coverage and influencing factors. Thus, it is vital to investigate how factors influence vegetation coverage by considering the spatial impact. The Geographically Weighted Regression (GWR) model is an improved model for considering the spatial weight [19] and has been used to explore the spatial change of data [20]. Therefore, we adopted the GWR model to comprehensively analyze the effects of different factors on vegetation cover.
The objectives of our study were to (i) analyze the spatiotemporal variation of vegetation coverage in the Loess Plateau of China, and (ii) investigate the factors influencing vegetation cover.
2. Materials and Methods
2.1. Study Area
The Loess Plateau is located in the middle-north region of China between 33°43′ N–41°16′ N and 100°54′ E–114°33′ E [21] and covers an area of ~6.35 × 10⁵ km2 (Figure 1). The region has a continental monsoon climate and is in an arid and semi-arid climate zone [22]. The terrain of the Loess Plateau is high in the northwest and low in the southeast. The mean annual precipitation and temperature range from 135.2 to 873.6 mm and from 4.3 to 14.3 °C, respectively [23,24].
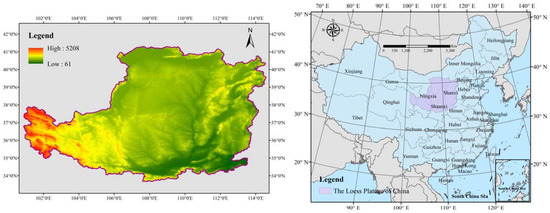
Figure 1.
Elevation map of the Loess Plateau.
2.2. Research Procedure
The NDVI reflected the degree of vegetation cover. Therefore, the NDVI was appropriate to characterize the vegetation cover in the Loess Plateau of China. In our study, vegetation cover is the value to monitor the degree of vegetation growth. Though the study area existed with bare land, it only occupied a small part of the whole, thus could be ignored. However, the NDVI (vegetation cover) of bare land also reflected changes in the ecological environment. Therefore, we selected NDVI to characterize the whole vegetation cover in the study area. The “vegetation cover” which was characterized by NDVI, would be the primary research object to reflect the environmental change in the whole research. In our study, we used quantitative analysis to investigate the temporal changes and latitudinal and longitudinal changes in vegetation cover. We also predicted the vegetation cover change in the future. We then conducted a Theil-Sen slope analysis and Mann-Kendall test to investigate the spatiotemporal variations in different seasons and years. Next, we analyzed the relationship between single factors and vegetation cover. Finally, we adopted the GWR model to investigate the effects of factors on vegetation changes. The detailed research procedure is shown in Figure 2.
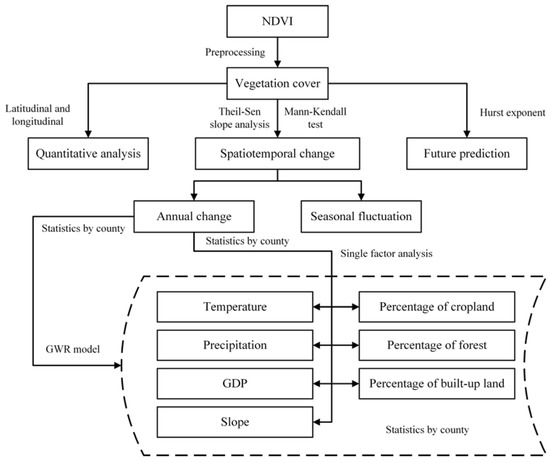
Figure 2.
Research procedure.
2.3. Data Source and Preprocessing
(I) The MODIS NDVI dataset was downloaded from the Geospatial Data Cloud (http://www.gscloud.cn, accessed on 3 December 2019). The NDVI dataset was processed by the Maximum Value Composite, which could reduce the negative impact of the cloud, to reclass the different seasons: spring (March, April, May); summer (June, July, August); autumn (September, October, November); and winter (December, January, February) by “Cell Statistics” of ArcGIS 10.3. The dataset kept origin geographic projection, i.e., the WGS 1984 coordinate system. Related changes were calculated to obtain the results of trends and significances in Matlab 2019a based on corresponding formulas. (II) The gross domestic product (GDP) dataset was provided by the Wind database (https://www.wind.com.cn/newsite/edb.html, accessed on 3 December 2019) and the Statistical Yearbook (2000 and 2015). Then, we imported the collated GDP data into ArcGIS 10.3. (III) The meteorological dataset was downloaded from the National Meteorological Information Center (2000 and 2015) (http://data.cma.cn/, accessed on 3 September 2020). Mapping temperature and precipitation were achieved by using the Kriging Interpolation technique, which was also corrected and compensated by the elevation dataset. (IV) The slope dataset was provided by the Geospatial Data Cloud (http://www.gscloud.cn/, accessed on 3 September 2020). The dataset was converted into the WGS 1984 coordinate system. (V) The national administrative boundary of the county was downloaded from the Data Center for Resources and Environment Sciences, Chinese Academy of Sciences (RESDC) (http://www.resdc.cn, accessed on 3 September 2020). The dataset was converted into the WGS 1984 coordinate system. In our study, the “nearest” resampling technique was selected to process the projection conversion. This technique could not alter the value of the raster of datasets and achieve higher efficiency in preprocessing.
In the GWR model, the selected factors (temperature, precipitation, GDP, slope, percentage of cropland, percentage of forest, and percentage of built-up land) were calculated as average values in the unit of the model, i.e., the boundary of the county in the study area. Illumination conditions were the relatively stable factor in our small-scale region. Meanwhile, we partly compensated the above-mentioned variability in the interpolation of temperature and precipitation, i.e., the elevation dataset corrected and compensated the interpolated datasets in the Kriging Interpolation. Some factors such as elevation were relatively stable in the study period. It was appropriate to ignore the small change of the relatively stable factor in our model.
2.4. Methods
2.4.1. Quantitative Analysis of Total Change
In this study, we aimed to determine the spatiotemporal changes in vegetation cover from a latitudinal and longitudinal perspective. Therefore, our study compared the latitudinal and longitudinal vegetation cover between 2000 and 2015. All pixels located in the same latitude or longitude were regarded as a statistical unit to calculate both the increased and reduced vegetation coverage values.
2.4.2. Theil-Sen Slope Analysis and Mann-Kendall Test
The Theil-Sen slope analysis was used to investigate the changes in vegetation cover, and the Mann-Kendall test was used to investigate the significance of the vegetation cover changes. This approach reduces the impact of external errors and provides a more accurate change trend in vegetation cover. These methods were used to investigate the time-series variability for each pixel with the aim to determine the total spatiotemporal change from 2000 to 2015 in China. The formulas of the approach are as follows:
where is the trend of vegetation coverage change, and i, j are the different years. > 0 indicates an increasing trend in vegetation coverage, and < 0 indicates a decreasing trend in vegetation coverage.
where Z reflects the significance of variation in vegetation coverage, and n is the time sequence of the study. |Z| > 1.96 indicates that the time-series trend rejects the original hypothesis and is therefore significant at the 0.05 level; |Z| < 1.96 indicates that the time-series trend is insignificant.
2.4.3. Geographically Weighted Regression Model
The traditional ordinary linear squares (OLS) regression fixes the relationships between the dependent variable and its covariates [25]. The GWR model has been used to analyze the influence of various independent variables on the dependent variable in the case of dealing with spatial autocorrelation impacts [26]. We selected several anthropogenic and climatic factors in our study that are known to alter the changes in vegetation cover, including temperature, precipitation, GDP, slope, cropland percentage, forest percentage, and built-up land percentage. The formulas are as follows:
where yi represents the values of vegetation cover, xki represents the corresponding factors in pixel i, β0i is the estimated intercept, βki is the parameter estimate for the ith explanatory variable, and ε is the error in location i [27,28]. The bandwidth is determined by AIC (Akaike Information Criterion).
2.4.4. Hurst Exponent
The Hurst exponent is a technique used to assess the sustainability of a time series [29]. In this study, this approach was used to predict future changes in vegetation cover. Therefore, we calculated the Hurst exponent to analyze the trend of vegetation cover as follows:
- (1)
- The following formula defines the time series of vegetation cover during the period of study:
- (2)
- The accumulated deviation was calculated as follows:
- (3)
- The following equation was used to calculate the range of the time series:
- (4)
- The standard deviation was calculated as follows:
- (5)
- The Hurst exponent (H) was fitted in the following equation:
H = 0.5 indicates a stochastic trend in the time series; H < 0.5 indicates that the future time series showed the opposite trend to the present time series, and a lower H value infers more significant opposition results; H > 0.5 indicates that the time series showed the same trend of sustainability, and a higher H value indicates a more notable sustainable trend.
3. Results
3.1. Changes in Vegetation Cover
The box plot (Figure 3) shows a notable increase in the mean values of vegetation cover from 2000 to 2015. Vegetation cover changes in the latitudinal and longitudinal profiles are shown in Figure 4 and Figure 5, respectively. All latitudes in the study area displayed a positive net change in vegetation cover, indicating that the increase in vegetation cover exceeded the decrease in vegetation cover. The peak increase in vegetation occurred at ~35.3° N, while the peak decreases in vegetation cover occurred at ~103° E, 105.5° E, and 110.4° E.
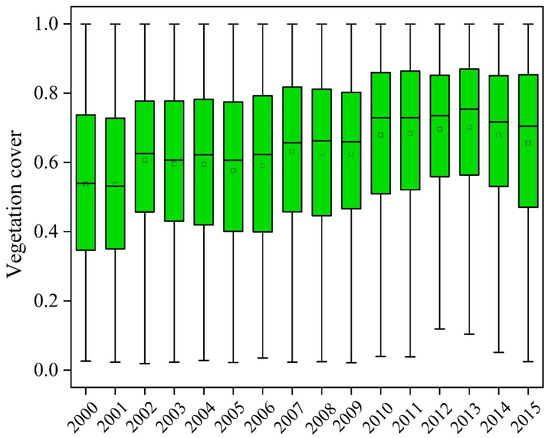
Figure 3.
Changes in vegetation cover in the Loess Plateau from 2000 to 2015.
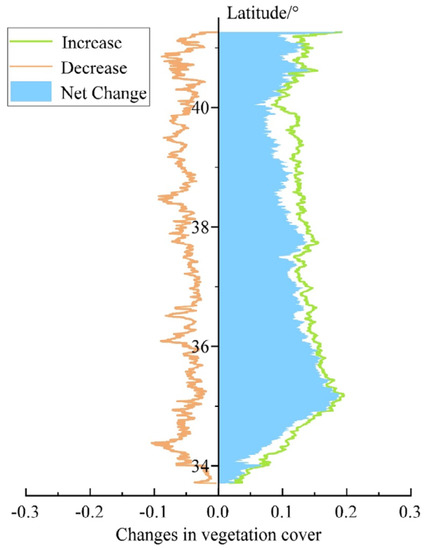
Figure 4.
Latitudinal profile of vegetation cover changes.
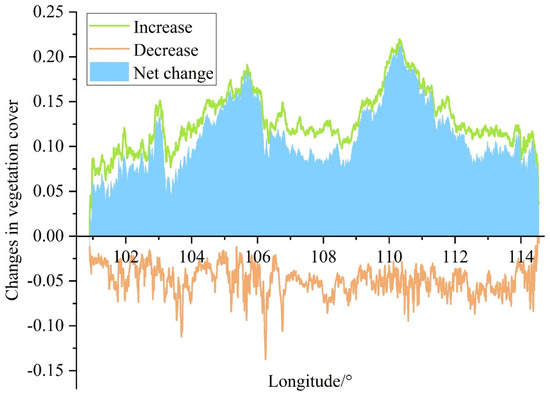
Figure 5.
Longitudinal profile of vegetation cover changes.
The changes in vegetation cover from 2000 to 2015 are displayed in Figure 6. On the whole, the Loess Plateau area showed a significant growth trend in vegetation cover, and the decreasing trend was mainly concentrated in the areas of rapid urban development, such as Taiyuan City and Shanxi Province. The vegetation cover fluctuations in different seasons are shown in Figure 7. In spring, the vegetation coverage of most areas in the middle and northeast of the Loess Plateau showed a significant upward trend. The western region and the southeastern region showed no significant growth, wherein, the western Gansu Province, the border area of the Qinghai Province, the northeast of Shaanxi Province, the Western Guanzhong Plain, and the southern part of Shanxi Province showed no significant decrease; the northern part of the Loess Plateau showed a significant decrease, and; the western and southeastern parts of the Loess Plateau showed scattered trends. We also identified a significant decrease in the number of areas. In summer, the vegetation coverage of the Loess Plateau was relatively high. Except for the western region, most regions showed a significant upward trend. Among them, the western and northwest regions showed a large, concentrated area of no significant growth; the northern, northeastern, eastern, and southeastern marginal areas showed relatively scattered trends and no significant reduction; the southern, southeastern, northeastern, and western marginal areas showed scattered trends and significant declines in some areas. In autumn, the vegetation coverage in most areas of the central Loess Plateau showed a significant upward trend. Among them, most areas of Shanxi Province in the northeast, some areas of Shaanxi Province in the middle and south, and some areas of Qinghai Province and Gansu Province in the west showed no significant growth; the border areas of eastern Qinghai Province and western Gansu Province in the west, central Shaanxi Province in the south, and western Henan Province in the south showed no significant decrease; some areas and regions in the west of the study area showed no significant growth. Moreover, we observed a significant decrease in vegetation coverage in some northern areas. In winter, the Loess Plateau as a whole showed a significant upward trend in vegetation coverage. The Yellow River flow area in the north, the south, and the western part of Shanxi Province, located at the edge of the study area, showed no significant vegetation growth. The north, the southeast, the east, and the transition area between Qinghai Province and Gansu Province had lower distributions of non-significant decline areas, while a few areas in the north showed a significant decline trend.
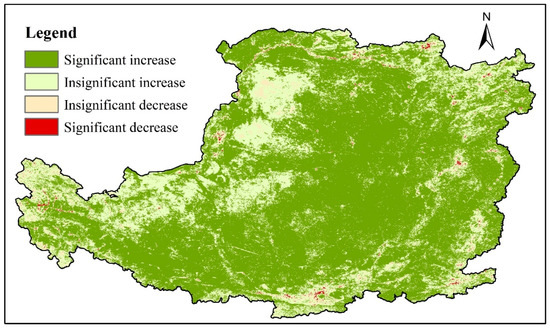
Figure 6.
Changes in vegetation cover from 2000 to 2015.
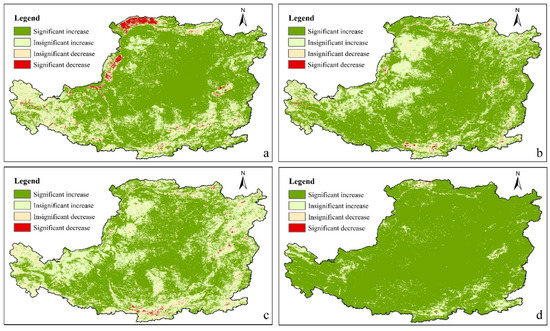
Figure 7.
Fluctuations in vegetation cover in (a) spring; (b) summer; (c) autumn; (d) winter.
The vegetation coverage for the entire area showed a sustainable growth trend, with no significant change in the northwest, northeast, and southeast regions, and a potential decreasing trend in the southwest and eastern regions (Figure 8).
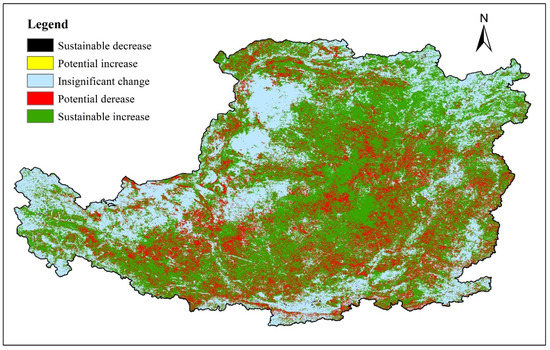
Figure 8.
The predicted result of vegetation cover change based on the Hurst exponent.
3.2. Influence of Factors on Vegetation Coverage
3.2.1. Influence of Individual Factors on Vegetation Coverage
The relationships between vegetation cover and individual influencing factors are displayed in Figure 9 and Figure 10. We observed a negative correlation between GDP and vegetation coverage, and the relationship points were mainly concentrated in areas with higher vegetation coverage and lower GDP. We observed a positive correlation between temperature and vegetation cover, and the relationship points were mainly concentrated in areas with higher temperatures and higher precipitation. We also identified a positive correlation between precipitation and vegetation cover, and the relationship points were mainly concentrated in areas with higher vegetation cover and higher precipitation. The forest percentage and vegetation cover were mainly positively correlated. The cropland percentage was positively correlated with vegetation cover; it was also high in some areas with high vegetation cover. We observed no obvious correlation between the percentage of built-up land and vegetation cover, and the correlation points were mainly concentrated in areas with a low percentage of built-up land. The slope showed a positive correlation with vegetation cover, and the relationship points were mainly concentrated in areas with higher vegetation cover and higher slope.
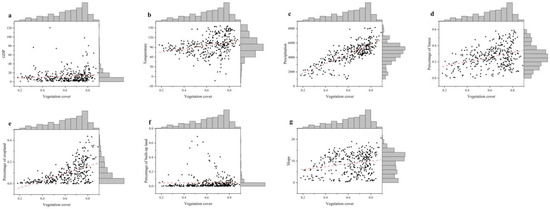
Figure 9.
(a–g) Relationship between vegetation cover and individual influencing factors in 2000.
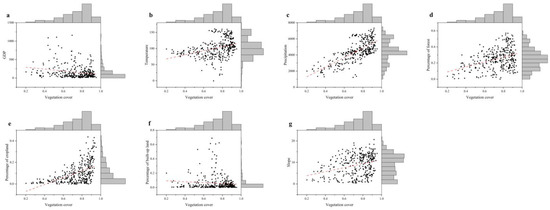
Figure 10.
(a–g) Relationship between vegetation cover and individual influencing factors in 2015.
3.2.2. Comprehensive Influences on Vegetation Coverage
The results of the comprehensive analysis showed that GDP, temperature, precipitation, forest percentage, cropland percentage, built-up land percentage, and slope significantly influenced vegetation cover in 2000 (Table 1). Temperature is an important factor affecting vegetation coverage. As shown in Figure 11, the influence of temperature on vegetation coverage gradually decreased from the south to the north and west. Moreover, a negative impact was observed in the middle of the Loess Plateau, with the largest negative impact in the most western region. Precipitation is also an important factor affecting vegetation coverage, and its influence on vegetation coverage gradually decreased from the south to the north and west; it first decreased slightly to the northeast and then increased gradually to the northeast of the Loess Plateau. The largest influence of GDP and vegetation cover occurred in the northernmost region of the Loess Plateau and gradually decreased in the southern, eastern, and western regions. Moreover, a negative impact was observed in the westernmost region. The slope had a positive influence on vegetation coverage in the westernmost and northeastern regions of the Loess Plateau, which gradually became negative toward the central region, with the largest negative influence in the southeast and southwest regions. The ratio of cultivated land is an important indicator of vegetation coverage, and its impact on vegetation coverage was the strongest in the western part of the Loess Plateau, showing a decreasing trend from west to east. Forest ratio had the largest impact on vegetation coverage in the west and north of the Loess Plateau and gradually decreased to the southeast. The construction land ratio had the largest impact on vegetation coverage in the western and northern regions of the Loess Plateau and gradually decreased to the eastern and southern regions; it also exerted a negative influence in the southern region of the Loess Plateau, and the degree of influence gradually increased.

Table 1.
The effects of factors on vegetation cover based on the Geographically Weighted Regression (GWR) model in 2000.
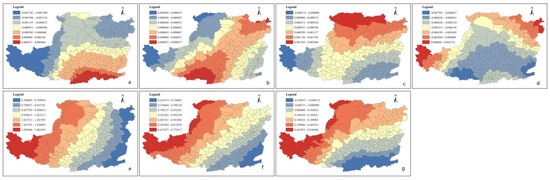
Figure 11.
Distribution of regression coefficients of various factors in 2000: (a) temperature; (b) precipitation; (c) GDP; (d) topography (slope); (e) percentage of cropland; (f) percentage of forest; (g) percentage of built-up land.
Precipitation, forest percentage, cropland percentage, and built-up land percentage had significant effects on vegetation cover in 2015 (Table 2). Compared with 2000, the effect of temperature on vegetation coverage in 2015 showed different spatial variability. In the western part of the Loess Plateau, the degree of negative influence gradually weakened from the west to the east; this transitioned to a positive influence in the central region, which then gradually strengthened to the eastern part (Figure 12). Precipitation had the strongest influence on vegetation coverage in the western region of the Loess Plateau, and the influence gradually decreased from west to east. GDP had a negative impact on vegetation coverage, with the strongest impact in the southern part of the Loess Plateau, which gradually decreased from south to north. The slope had the strongest influence on vegetation coverage in the northeast Loess Plateau, which gradually weakened to the west and south. The influence reached a minimum in the Qinghai area but rarely increased to the western region. Cultivated land is an important factor affecting vegetation coverage in the Loess Plateau, and its influence was the largest in the northwest, which gradually decreased to the southeast. Forest ratio had the greatest impact on vegetation coverage in the northwest of the Loess Plateau and then gradually decreased to the southeast. The construction land ratio had the largest impact on vegetation coverage in the western region of the Loess Plateau and then gradually decreased to the eastern region.
Table 2.
Effects of factors on vegetation cover based on the GWR model in 2015.
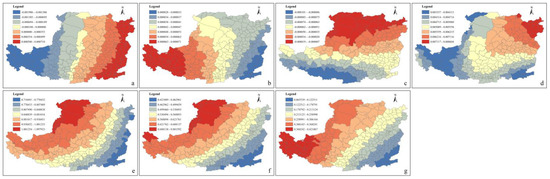
Figure 12.
Distribution of regression coefficients of various factors in 2015: (a) temperature; (b) precipitation; (c) GDP; (d) topography (slope); (e) percentage of cropland; (f) percentage of forest; (g) percentage of built-up land.
4. Discussion
Due to the pursuit of economic development, the continuous expansion of construction land has led to the decline of vegetation cover in some areas [30]. However, construction land did not have a large impact on vegetation coverage in the Loess Plateau, and most areas showed a significant growth trend. Ecological engineering and the implementation of strategies to return farmland to forest and grassland have effectively improved the vegetation cover, which has been reflected in the results [31,32]. The vegetation coverage in all latitudes and longitudes in the study area showed a net growth. In complex land type transformations, the overall vegetation cover is maintained at a certain level, and land consolidation projects play an important role in the protection of the ecological environment during the transformation of land types [33,34]. Moreover, part of it may be attributed to the focus on protecting the ecological environment of new land-use types following land-use change.
The Loess Plateau is prone to drought and water shortage, and the impact of temperature on vegetation cover is mostly negative [35]. However, the water supply is generally sufficient at the southern part of the Loess Plateau due to the confluence of many rivers in the Guanzhong Basin. As water is not limited in this region, temperature becomes a more significant factor in vegetation coverage, which is evident in the observed positive correlation between vegetation coverage and temperature in the Guanzhong Basin. The Lvliang Mountain barrier has the strongest influence on precipitation in the middle region than on both sides. However, the role of precipitation increased from 2000 to 2015, and a large-scale afforestation policy was implemented in the Loess Plateau [36,37]. In this context, the net water demand for forest growth has been increasing, despite the reduced water limitation, and the role of meteorological precipitation on vegetation growth is strengthening. Therefore, due to human management, the negative effect of temperature on vegetation coverage is also decreasing. The pattern of GDP influence is affected by other factors. Moreover, this study was conducted on the county scale, and the relationship between vegetation and GDP within the county is still unknown. Our results also indicate a weak impact of GDP distribution on vegetation coverage. Although construction land is destroying the original ecosystem environment, the completion of residential areas and relevant green landscape facilities are constantly being constructed. Moreover, the concepts of sponge and ecological cities are gaining traction. Therefore, the factor analysis results for 2015 showed an unexpected positive value. Green landscapes, parks, and urban green spaces are continuously growing to improve the living environment of local populations and enhance vegetation coverage. Forest and arable land also have a large impact on vegetation coverage. The Chinese government has enforced a policy to return farmland to forest in high-slope areas and also encouraged the use of cultivated land in some low-slope areas (mechanized operation, irrigation and drainage systems, artificial chemical fertilizers, etc.,) to improve the output efficiency of cultivated land. This policy has effectively controlled the problem of soil erosion. The farmland to forest policy showed no significant impact during its initial implementation in 2000; however, its impact on vegetation coverage was greater than that of other factors in 2015 (higher t-statistic than that of other factors), which suggests that the national policy played a certain role in the improvement of vegetation coverage. It also reflects the impact of slope on the spatial layout of vegetation coverage, with continual greening in high slope areas.
The verified relationship between the government’s financial investment in greening and the overall vegetation coverage suggests that the government’s policies have played a leading role in enhancing vegetation coverage. However, the results of the Hurst analysis highlight the potential for future vegetation degradation in some areas in response to ongoing afforestation, farmland intensification, and urban greening. It is, therefore, necessary to continue to strengthen the investment of relevant policies and further promote relevant ecological construction projects.
5. Conclusions
Vegetation cover in the Loess Plateau significantly increased from 2000 to 2015. Moreover, the latitudinal and longitudinal profiles of vegetation cover change also showed notable improvement from 2000 to 2015. Human activities were found to have a certain impact on vegetation coverage, especially the implementation of national policies. However, some regions are still at future risk of vegetation degradation. Precipitation, forest area ratio, cultivated land area ratio, construction land area ratio, and slope, all showed a continuous impact on vegetation coverage. The comprehensive analysis revealed that GDP, temperature, precipitation, forest percentage, cropland percentage, built-up land percentage, and slope showed significant influences on vegetation cover in 2000. In comparison, precipitation, forest percentage, cropland percentage, and built-up land percentage showed significant effects on vegetation cover in 2015. Our results enhance our understanding of the ecological and environmental changes in the Loess Plateau over the last decade.
Author Contributions
Methodology, D.F.; formal analysis, C.Y. and D.F.; investigation, D.F., Y.S., C.Y. and G.Z.; data curation, C.Y.; writing—original draft preparation, C.Y., D.F. and Y.S.; writing—review and editing, M.F.; visualization, C.Y.; funding acquisition, M.F. All authors have read and agreed to the published version of the manuscript.
Funding
This research was funded by National Natural Science Foundation of China’s General Program, grant number 41771204 and the APC was funded by Chen Yang.
Conflicts of Interest
The authors declare no conflict of interest.
References
- Li, Y.; Piao, S.; Li, L.Z.X.; Chen, A.; Wang, X.; Ciais, P.; Huang, L.; Lian, X.; Peng, S.; Zeng, Z.; et al. Divergent hydrological response to large-scale afforestation and vegetation greening in China. Sci. Adv. 2018, 4. [Google Scholar] [CrossRef] [PubMed]
- Jian, S.; Zhao, C.; Fang, S.; Yu, K. Effects of different vegetation restoration on soil water storage and water balance in the Chinese Loess Plateau. Agric. Forest Meteorol. 2015, 206, 85–96. [Google Scholar] [CrossRef]
- Nunes, A.N.; de Almeida, A.C.; Coelho, C.O.A. Impacts of land use and cover type on runoff and soil erosion in a marginal area of Portugal. Appl. Geogr. 2011, 31, 687–699. [Google Scholar] [CrossRef]
- Li, P.; Sheng, M.; Yang, D.; Tang, L. Evaluating flood regulation ecosystem services under climate, vegetation and reservoir influences. Ecol. Indic. 2019, 107. [Google Scholar] [CrossRef]
- De Carvalho, R.M.; Szlafsztein, C.F. Urban vegetation loss and ecosystem services: The influence on climate regulation and noise and air pollution. Environ. Pollut. 2019, 245, 844–852. [Google Scholar] [CrossRef] [PubMed]
- Duveiller, G.; Hooker, J.; Cescatti, A. The mark of vegetation change on Earth’s surface energy balance. Nat. Commun. 2018, 9. [Google Scholar] [CrossRef] [PubMed]
- Zeng, Z.; Piao, S.; Li, L.Z.X.; Zhou, L.; Ciais, P.; Wang, T.; Li, Y.; Lian, X.; Wood, E.F.; Friedlingstein, P.; et al. Climate mitigation from vegetation biophysical feedbacks during the past three decades. Nat. Clim. Chang. 2017, 7, 432. [Google Scholar] [CrossRef]
- Chu, H.; Venevsky, S.; Wu, C.; Wang, M. NDVI-based vegetation dynamics and its response to climate changes at Amur-Heilongjiang River Basin from 1982 to 2015. Sci. Total Environ. 2019, 650, 2051–2062. [Google Scholar] [CrossRef]
- Liu, S.; Huang, S.; Xie, Y.; Wang, H.; Huang, Q.; Leng, G.; Li, P.; Wang, L. Spatial-temporal changes in vegetation cover in a typical semi-humid and semi-arid region in China: Changing patterns, causes and implications. Ecol. Indic. 2019, 98, 462–475. [Google Scholar] [CrossRef]
- Dardel, C.; Kergoat, L.; Hiernaux, P.; Mougin, E.; Grippa, M.; Tucker, C.J. Re-greening Sahel: 30 years of remote sensing data and field observations (Mali, Niger). Remote Sens. Environ. 2014, 140, 350–364. [Google Scholar] [CrossRef]
- Li, Z.T.; Kafatos, M. Interannual variability of vegetation in the United States and its relation to El Nino/Southern Oscillation. Remote Sens. Environ. 2000, 71, 239–247. [Google Scholar] [CrossRef]
- Gurgel, H.C.; Ferreira, N.J. Annual and interannual variability of NDVI in Brazil and its connections with climate. International J. Remote Sens. 2003, 24, 3595–3609. [Google Scholar] [CrossRef]
- Piao, S.; Wang, X.; Park, T.; Chen, C.; Lian, X.; He, Y.; Bjerke, J.W.; Chen, A.; Ciais, P.; Tømmervik, H.; et al. Characteristics, drivers and feedbacks of global greening. Nat. Rev. Earth Environ. 2020, 1, 14–27. [Google Scholar] [CrossRef]
- Qu, L.; Huang, Y.; Yang, L.; Li, Y. Vegetation Restoration in Response to Climatic and Anthropogenic Changes in the Loess Plateau, China. Chin. Geogr. Sci. 2020, 30, 89–100. [Google Scholar] [CrossRef]
- Deng, S.-f.; Yang, T.-b.; Zeng, B.; Zhu, X.-f.; Xu, H.-j. Vegetation cover variation in the Qilian Mountains and its response to climate change in 2000–2011. J. Mt. Sci. 2013, 10, 1050–1062. [Google Scholar] [CrossRef]
- Wu, D.; Zhao, X.; Liang, S.; Zhou, T.; Huang, K.; Tang, B.; Zhao, W. Time-lag effects of global vegetation responses to climate change. Glob. Chang. Biol. 2015, 21, 3520–3531. [Google Scholar] [CrossRef] [PubMed]
- Kong, D.; Miao, C.; Borthwick, A.G.L.; Lei, X.; Li, H. Spatiotemporal variations in vegetation cover on the Loess Plateau, China, between 1982 and 2013: Possible causes and potential impacts. Environ. Sci. Pollut. Res. 2018, 25, 13633–13644. [Google Scholar] [CrossRef] [PubMed]
- Sun, W.; Song, X.; Mu, X.; Gao, P.; Wang, F.; Zhao, G. Spatiotemporal vegetation cover variations associated with climate change and ecological restoration in the Loess Plateau. Agric. For. Meteorol. 2015, 209, 87–99. [Google Scholar] [CrossRef]
- Qiu, B.; Zeng, C.; Chen, C.; Zhang, C.; Zhong, M. Vegetation distribution pattern along altitudinal gradient in subtropical mountainous and hilly river basin, China. J. Geogr. Sci. 2013, 23, 247–257. [Google Scholar] [CrossRef]
- Pearsall, H.; Christman, Z. Tree-lined lanes or vacant lots? Evaluating non-stationarity between urban greenness and socio-economic conditions in Philadelphia, Pennsylvania, USA at multiple scales. Appl. Geogr. 2012, 35, 257–264. [Google Scholar] [CrossRef]
- Liu, Y.; Lyu, Y.; Bai, Y.; Zhang, B.; Tong, X. Vegetation Mapping for Regional Ecological Research and Management: A Case of the Loess Plateau in China. Chin. Geogr. Sci. 2020, 30, 410–426. [Google Scholar] [CrossRef]
- Zhang, B.; He, C.; Burnham, M.; Zhang, L. Evaluating the coupling effects of climate aridity and vegetation restoration on soil erosion over the Loess Plateau in China. Sci. Total Environ. 2016, 539, 436–449. [Google Scholar] [CrossRef]
- Wang, X.; Wang, B.; Xu, X.; Liu, T.; Duan, Y.; Zhao, Y. Spatial and temporal variations in surface soil moisture and vegetation cover in the Loess Plateau from 2000 to 2015. Ecol. Indic. 2018, 95, 320–330. [Google Scholar] [CrossRef]
- Guo, R.; Li, F.; He, W.; Yang, S.; Sun, G. Spatial and Temporal Variability of Annual Precipitation during 1958–2007 in Loess Plateau, China. In Proceedings of the Computer and Computing Technologies in Agriculture IV, Nanchang, China, 22–25 October 2010. [Google Scholar]
- Zhao, R.; Yao, M.; Yang, L.; Qi, H.; Meng, X.; Zhou, F. Using geographically weighted regression to predict the spatial distribution of frozen ground temperature: A case in the Qinghai-Tibet Plateau. Environ. Res. Lett. 2021, 16. [Google Scholar] [CrossRef]
- Tan, X.; Guo, P.-T.; Wu, W.; Li, M.-F.; Liu, H.-B. Prediction of soil properties by using geographically weighted regression at a regional scale. Soil Res. 2017, 55, 318–331. [Google Scholar] [CrossRef]
- Yang, S.-H.; Liu, F.; Song, X.-D.; Lu, Y.-Y.; Li, D.-C.; Zhao, Y.-G.; Zhang, G.-L. Mapping topsoil electrical conductivity by a mixed geographically weighted regression kriging: A case study in the Heihe River Basin, northwest China. Ecol. Indic. 2019, 102, 252–264. [Google Scholar] [CrossRef]
- Jin, Y.; Zhang, H.; Yan, Y.; Cong, P. A Semi-Parametric Geographically Weighted Regression Approach to Exploring Driving Factors of Fractional Vegetation Cover: A Case Study of Guangdong. Sustainability 2020, 12, 7512. [Google Scholar] [CrossRef]
- Zhang, D.; Ge, W.; Zhang, Y. Evaluating the vegetation restoration sustainability of ecological projects: A case study of Wuqi County in China. J. Clean. Prod. 2020, 264. [Google Scholar] [CrossRef]
- Feng, D.; Fu, M.; Sun, Y.; Bao, W.; Zhang, M.; Zhang, Y.; Wu, J. How Large-Scale Anthropogenic Activities Influence Vegetation Cover Change in China? A Review. Forests 2021, 12, 320. [Google Scholar] [CrossRef]
- Li, J.; Peng, S.; Li, Z. Detecting and attributing vegetation changes on China’s Loess Plateau. Agric. For. Meteorol. 2017, 247, 260–270. [Google Scholar] [CrossRef]
- Liu, Z.; Wang, J.; Wang, X.; Wang, Y. Understanding the impacts of ‘Grain for Green’ land management practice on land greening dynamics over the Loess Plateau of China. Land Use Policy 2020, 99. [Google Scholar] [CrossRef]
- He, M.; Wang, Y.; Tong, Y.; Zhao, Y.; Qiang, X.; Song, Y.; Wang, L.; Song, Y.; Wang, G.; He, C. Evaluation of the environmental effects of intensive land consolidation: A field-based case study of the Chinese Loess Plateau. Land Use Policy 2020, 94. [Google Scholar] [CrossRef]
- Hong, C.; Jin, X.; Ren, J.; Gu, Z.; Zhou, Y. Satellite data indicates multidimensional variation of agricultural production in land consolidation area. Sci. Total Environ. 2019, 653, 735–747. [Google Scholar] [CrossRef] [PubMed]
- Bai, M.; Mo, X.; Liu, S.; Hu, S. Contributions of climate change and vegetation greening to evapotranspiration trend in a typical hilly-gully basin on the Loess Plateau, China. Sci. Total Environ. 2019, 657, 325–339. [Google Scholar] [CrossRef] [PubMed]
- Li, G.; Sun, S.; Han, J.; Yan, J.; Liu, W.; Wei, Y.; Lu, N.; Sun, Y. Impacts of Chinese Grain for Green program and climate change on vegetation in the Loess Plateau during 1982–2015. Sci. Total Environ. 2019, 660, 177–187. [Google Scholar] [CrossRef] [PubMed]
- Zhao, A.; Zhang, A.; Liu, J.; Feng, L.; Zhao, Y. Assessing the effects of drought and “Grain for Green” Program on vegetation dynamics in China’s Loess Plateau from 2000 to 2014. Catena 2019, 175, 446–455. [Google Scholar] [CrossRef]
Publisher’s Note: MDPI stays neutral with regard to jurisdictional claims in published maps and institutional affiliations. |
© 2021 by the authors. Licensee MDPI, Basel, Switzerland. This article is an open access article distributed under the terms and conditions of the Creative Commons Attribution (CC BY) license (https://creativecommons.org/licenses/by/4.0/).