Article

Assessing the Connectivity of Riparian Forests across a Gradient of Human Disturbance: The Potential of Copernicus “Riparian Zones” in Two Hydroregions

by
André Fonseca
1,*,
Jean-Philippe Ugille
2,
Adrien Michez
2,3,
Patricia María Rodríguez-González
1,
Gonçalo Duarte
1,
Maria Teresa Ferreira
1 and
Maria Rosário Fernandes
1
1
Centro de Estudos Florestais (CEF), Instituto Superior de Agronomia, Universidade de Lisboa, Tapada da Ajuda, 1349-017 Lisboa, Portugal
2
TERRA Teaching and Research Centre (Forest is Life), Gembloux Agro-Bio Tech, University of Liège (ULiège), 2, Passage des Déportés, 5030 Gembloux, Belgium
3
Littoral, Environnement, Télédétection, Géomatique (LETG) (CNRS UMR 6554), University Rennes 2, Place du Recteur Henri Le Moal, CEDEX, 35043 Rennes, France
*
Author to whom correspondence should be addressed.
Forests 2021, 12(6), 674; https://doi.org/10.3390/f12060674
Submission received: 30 March 2021 / Revised: 7 May 2021 / Accepted: 20 May 2021 / Published: 25 May 2021

Abstract

:
The connectivity of riparian forests can be used as a proxy for the capacity of riparian zones to provide ecological functions, goods and services. In this study, we aim to test the potential of the freely available Copernicus “Riparian Zones” dataset to characterize the connectivity of riparian forests located in two European bioclimatic regions—the Mediterranean and the Central Baltic hydroregions—when subject to a gradient of human disturbance characterized by land-use/land-cover and hydromorphological pressures. We extracted riparian patches using the Copernicus “Actual Riparian Zone” (ARZ) layer and calculated connectivity using the Integral Index of Connectivity (IIC). We then compared the results with a “Manual Riparian Zone” (MRZ) layer, produced by manually digitizing riparian vegetation patches over a very high-resolution World Imagery layer. Our research evidenced reduced forest connectivity in both hydroregions, with the exception of Least Disturbed sites in the Central Baltic hydroregion. The ARZ layer exhibited overall suitability to assess the connectivity of riparian forests in the Central Baltic hydroregion, while the Mediterranean hydroregion displayed a consistent pattern of connectivity overestimation in all levels of human disturbance. To address this, we recommend some improvements in the spatial resolution and thematic accuracy of the Copernicus ARZ layer.

Graphical Abstract

1. Introduction

Riparian zones are co-constructed by the long-standing influence of environmental and human disturbance processes that shape their structural and compositional attributes [1]. They represent the interface between aquatic and terrestrial ecosystems, encompassing the stream channel and that portion of the terrestrial landscape where vegetation may be influenced by fluctuations in the water table, flooding and waterlogged soils [2,3]. Bioclimatic and geomorphological conditions drive the spatial and temporal patterns of riparian zones, but as highly dynamic and hierarchically dependent ecosystems they are also extremely vulnerable and responsive to local and catchment-scale human disturbance factors [4]. Particularly, land-use/land-cover (LULC) changes and hydromorphological alterations have affected the structure of riparian zones across Europe, with a strong impact on riparian connectivity [5,6].
The connectivity of riparian forests can be used as a proxy for the capacity of riparian zones to provide ecosystem functions, goods and services [7,8,9,10,11]. On one hand, the vertical and longitudinal connectivity of riparian forests are usually representative of the amount of available habitat within the riparian zone and measure the capacity of the riparian zone to sustain biodiversity and promote biological dispersal [12,13,14]. On the other hand, the lateral connectivity of riparian forests is usually representative of the exchange of energy and materials with the surrounding landscape, translating the effectiveness of the riparian zone to regulate flow velocity and sedimentation processes and to act as a buffer for nutrient sink and pollutant removal [15,16].
Although riparian zones are affected by multiple stressors, given the complexity of human–environment interactions in different geographic contexts, and the generalized lack of freely available tools to monitor riparian zones at distinct spatial scales, most studies have relied on a unique-pressure or single-scale perspective to perceive the effects of human disturbance on the structure of riparian zones. Thus, there is a global need for efficient and comprehensive monitoring tools, based on a multi-stressor and multi-scale approach, capable of: (i) properly characterizing the levels of variation; (ii) disentangling the different sources of variation; (iii) recognizing the cause–effect mechanisms on the structure of riparian zones in multiple geographic contexts.
In the last 2 decades, the development of image-based methods and computing capacity are increasingly relevant to characterize and monitor the structure of riparian zones [1,17,18]. The Copernicus Land Monitoring Service, from the European Environmental Agency, enabled the creation of an extensive dataset to map riparian zones across Europe [19]. Nevertheless, few studies have explored the potential of this dataset to characterize the structure of riparian zones across Europe and the inherent capacity of riparian zones to provide ecosystems services in distinct bioclimatic typologies (but see Clerici and Vogt [20], Bechter et al. [21], and Piedelobo et al. [22]). In addition, to the best of our knowledge, none of them examined the suitability of Copernicus products to assess the connectivity of riparian forests, especially under a gradient of human disturbance. This evaluation is of major importance, since large-scale studies concerning green infrastructure analysis, conservation of priority habitats and biodiversity management are likely to be conducted using this publicly available dataset as input data.
Given the exposed assumptions, this study aims to:
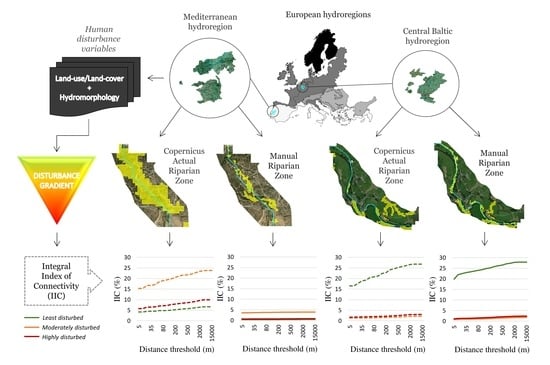
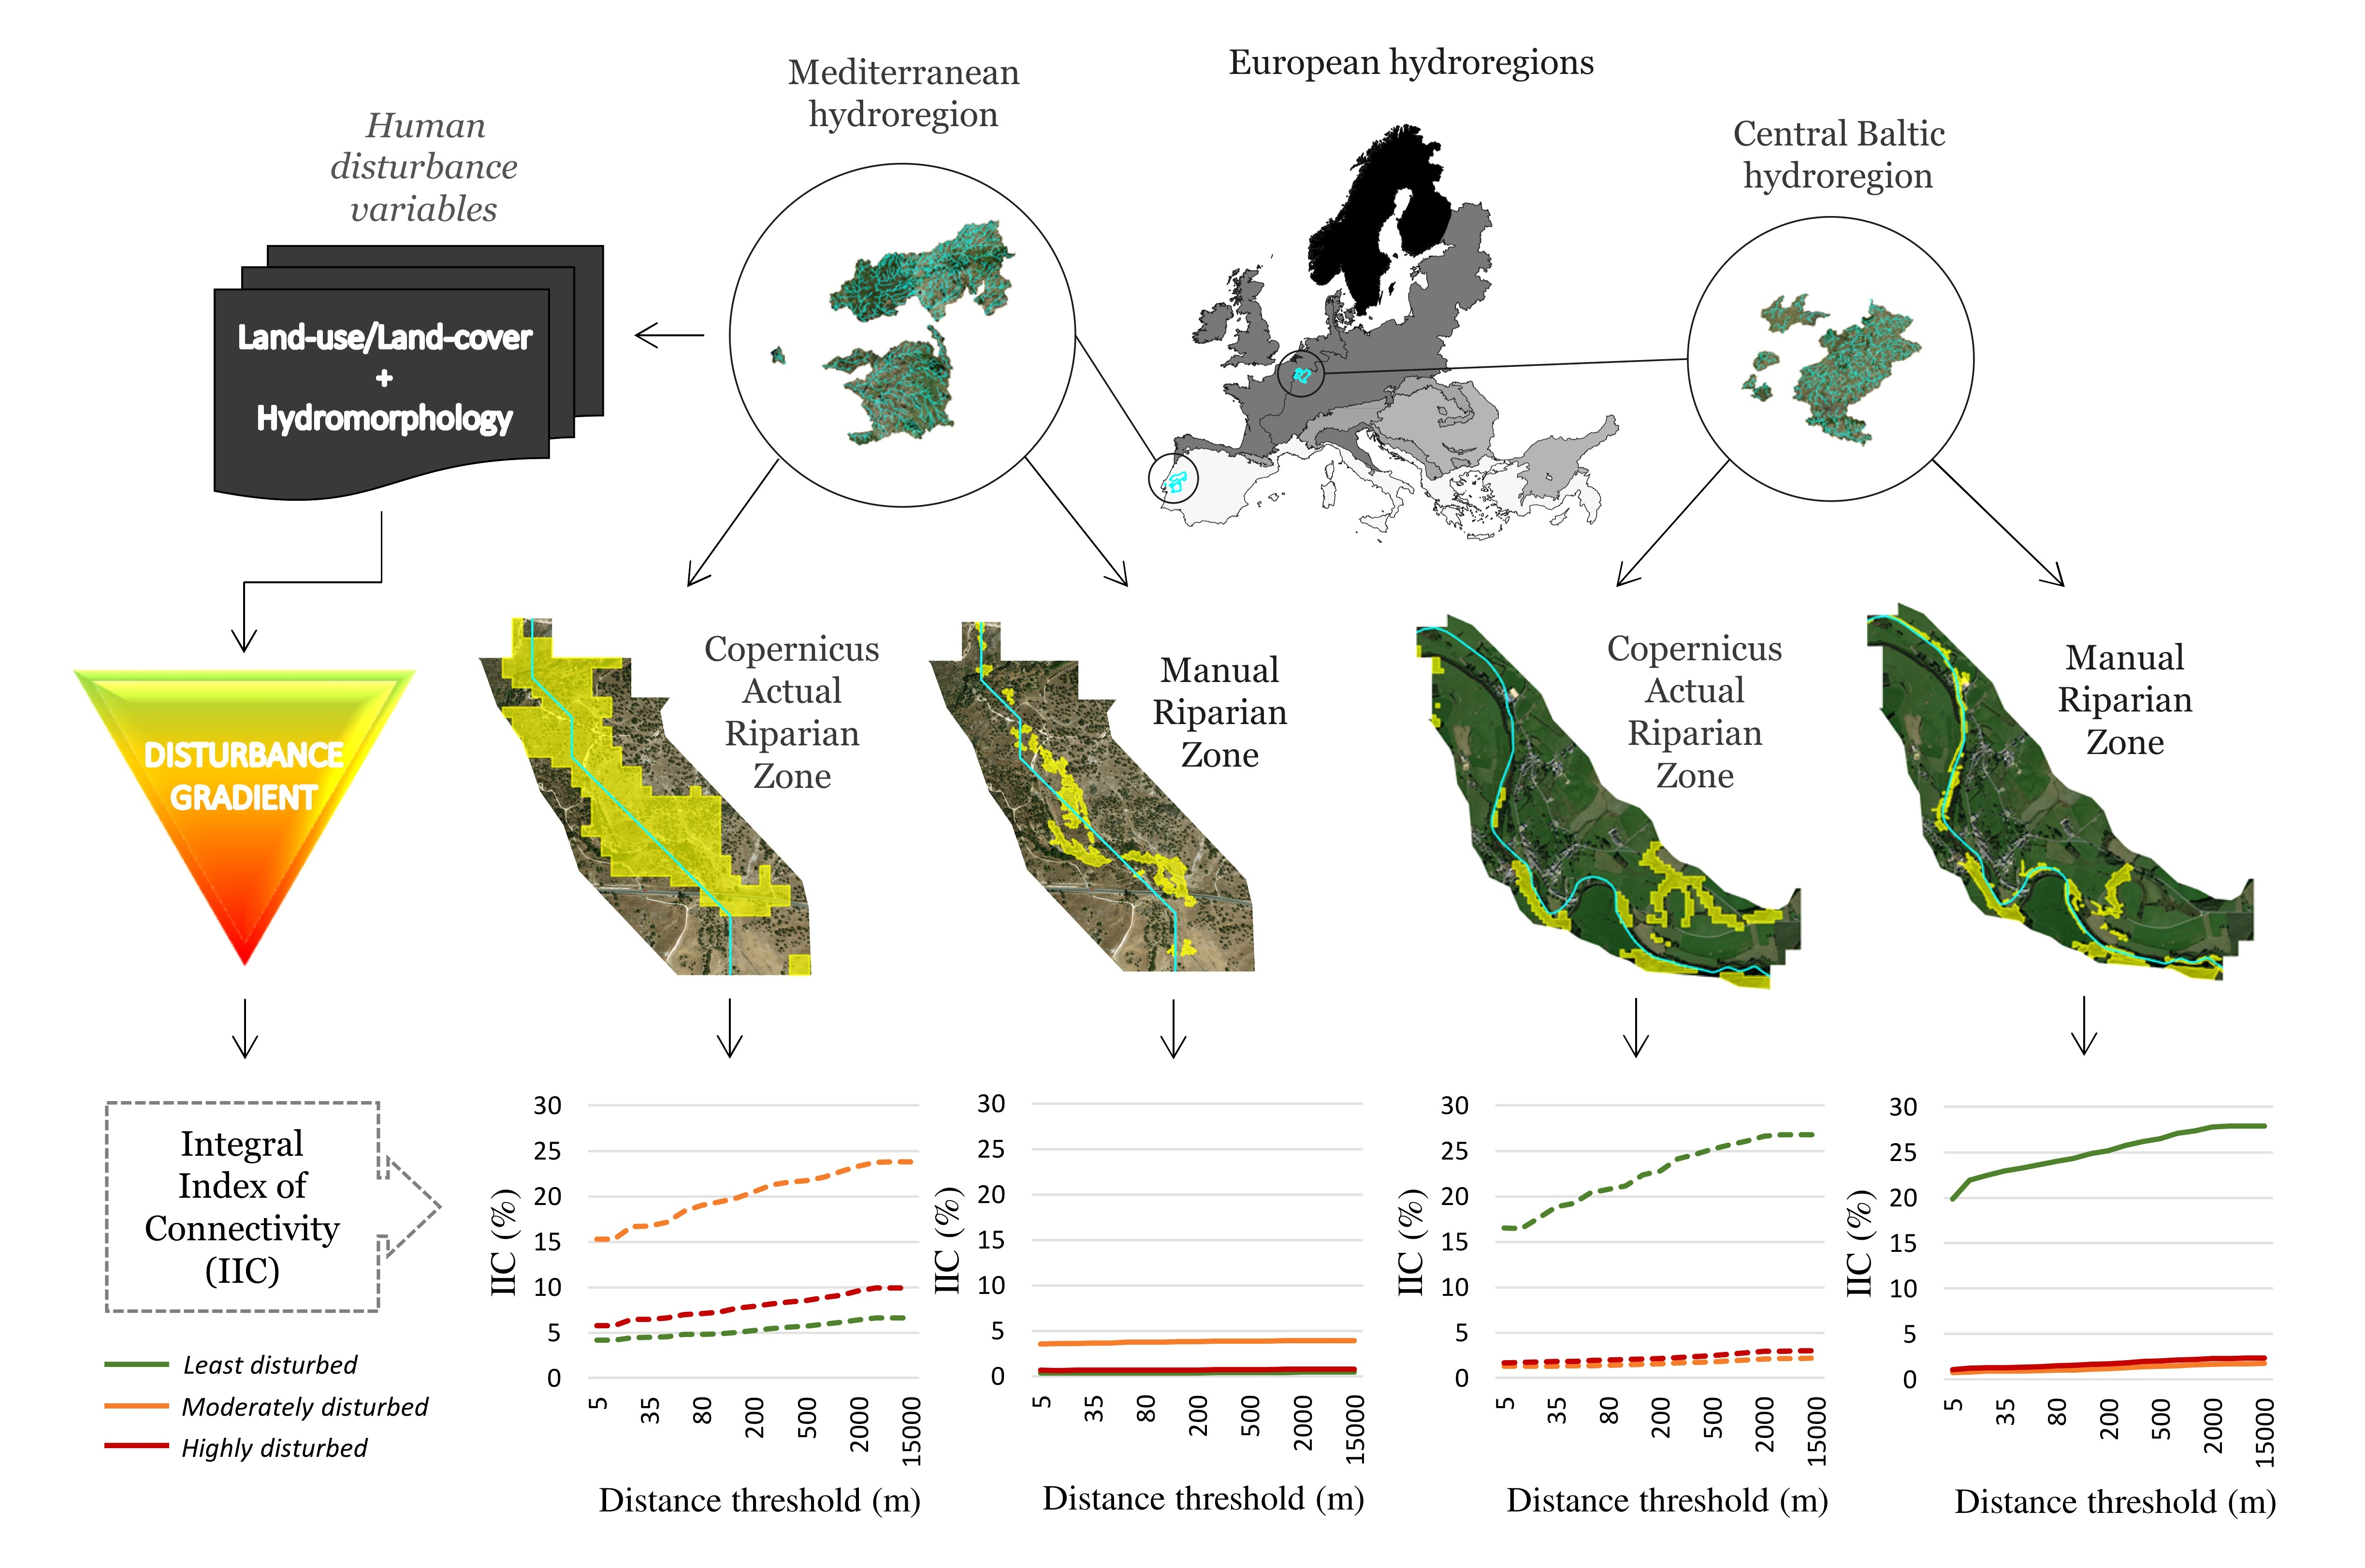
  • Assess the longitudinal connectivity of riparian forests located in two distinct European bioclimatic regions (Mediterranean and Central Baltic hydroregions) when subject to a gradient of human disturbance. We considered land-use/land-cover and hydromorphology as the main human disturbance factors and assessed them at catchment and segment scales.
  • Identify the drawbacks and strengths of the freely available Copernicus “Riparian Zones” dataset to assess the longitudinal connectivity of riparian forests located in the Mediterranean and Central Baltic hydroregions.
We hypothesized that river segments subject to increasing levels of human disturbance will present increasingly smaller and less-connected riparian vegetation patches in both hydroregions. We also hypothesized that the Copernicus ARZ model will produce higher misclassification errors when assessing the connectivity of riparian forests in the Mediterranean hydroregion, especially in river segments subject to a high level of human disturbance.
This study contributes to the assessment and monitoring of riverine habitats and related ecosystem services in distinct river typologies across Europe.

2. Materials and Methods

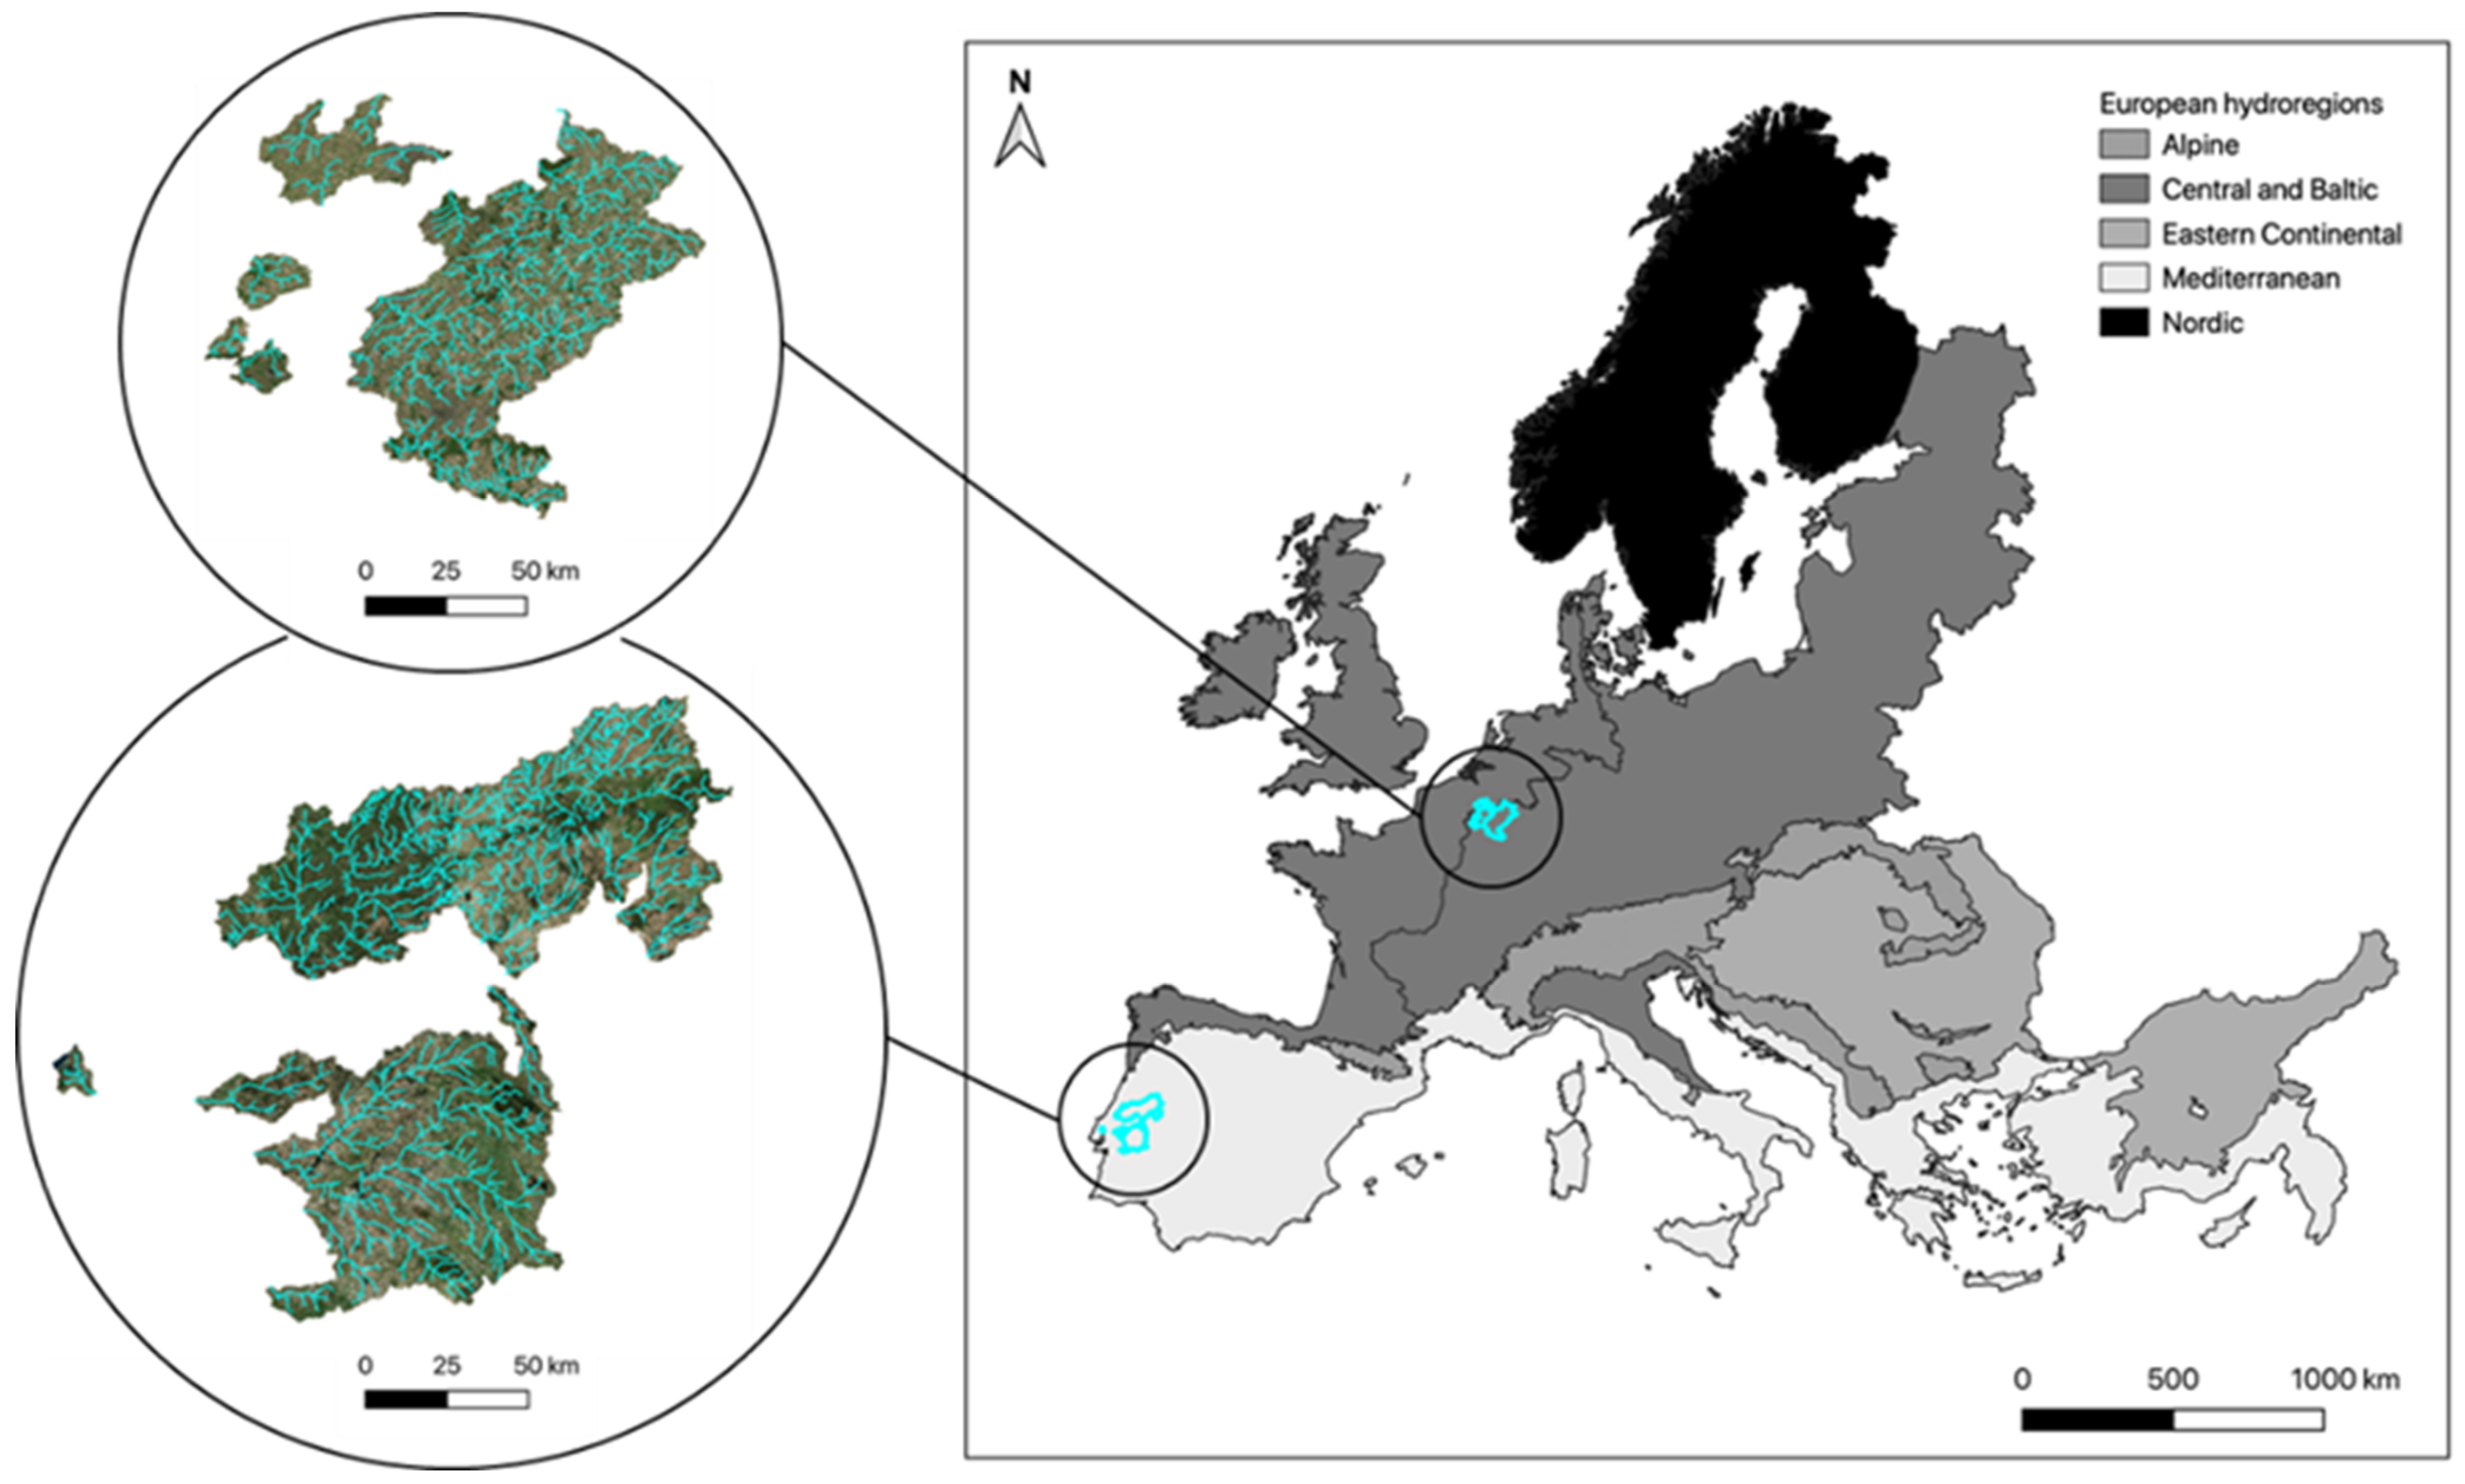
2.1. Study Area and Sampling Design

European hydroregions are continental homogenous, near-contiguous regions with similar bioclimatic conditions [23], and may be used to identify different riparian typologies across Europe (EU-project MARS, http://mars-project.eu/, accessed on 21 May 2021) [23,24]. The present study was conducted in the Mediterranean and Central Baltic hydroregions, along several river segments, here defined as the river section between two tributaries located in Tagus and Sorraia catchments (Portugal) and Meuse and Escaut catchments (Wallonia, Belgium) (Figure 1).
River segments were selected using the European river network Catchment Characterization Model database (CCM2; available at https://data.europa.eu/, accessed on 30 September 2020) [25]. We made a prior selection based on a large dataset obtained from previous studies during the implementation of the Water Framework Directive [26] for the Mediterranean hydroregion, and the context of a study developed by Debruxelles et al. [27] for the Central Baltic hydroregion. We selected 55 and 1071 sampling sites located in segments of the Mediterranean and Central Baltic hydroregions, respectively. Due to the small representativeness of riparian forests in headwater streams, we only retained segments located in sub-catchments greater than 100 km2, and in order to minimize spatial autocorrelation in the data, we sub-sampled sites separated at least by 2.5 km [5]. In the end, we retained a total of 38 and 40 segments for the Mediterranean and Central Baltic hydroregions, respectively, ensuring a wide range of ecological conditions and a balanced sampling between hydroregions. A total of 213.6 km and 232.8 km of river was covered in each hydroregion, respectively.
We validated the site selection to ensure that all river segments share similar geomorphological and climatic features in each hydroregion (Table 1). An analysis of similarities (ANOSIM) based on Euclidean distances was performed, with variables extracted from the CCM2 database, using the River Network Toolkit software (RivTool) [28]. No significant differences were found between catchments within each hydroregion (Global RANOSIM for the Mediterranean hydroregion = 0.58, p = 0.0001; Global RANOSIM for the Central Baltic hydroregion = 0.65; p = 0.0064).

2.2. Riparian Data

Riparian data were gathered using an image-based approach, supported by a Geographic Information System, and are comprised of polygons representing homogenous riparian vegetation patches, including trees and tall shrubs, occurring within the riparian zone [29]. The riparian zone is defined by the area surrounding the river systems occupied by vegetation that is influenced by fluctuations in the water table and flooding [2,3].
Two datasets were derived from all river segments. In the first dataset, riparian patches were extracted using the Copernicus “Actual Riparian Zone” (ARZ) layer (available at https://land.copernicus.eu/local/riparian-zones, accessed on 30 September 2020). This layer was mapped during the Copernicus Initial Operations 2011–2013 phase, by making use of remote-sensing classification techniques applied on optical VHR spatial-resolution satellite imagery [2,3]. The Minimum Mapping Unit was 0.5 ha and the Minimum Map Width 10 m.
The second riparian dataset was obtained by manually digitizing riparian vegetation patches located in the previously selected segments. The classification was obtained by visual analysis of very high spatial-resolution imagery (orthophoto images with 60 cm of spatial resolution) obtained in 2018 (Esri World Imagery, ArcGIS Online data, Copyright © Esri). The riparian vegetation patches were digitized at a 1:1000 scale and the Minimum Mapping Unit was 200 m2. A total of 1482 and 1845 riparian vegetation patches were attained for the Mediterranean and Central Baltic hydroregions, respectively. We termed this dataset as the Manual Riparian Zone (MRZ). Due to its very high spatial detail, we used it as ground-truth data to test the potential of the Copernicus ARZ layer in assessing the longitudinal connectivity of riparian forests.
In both datasets, the inner and outer boundaries of the riparian zone were harmonized. For the inner frontier, we used the water–land interface by delineating the stream riverbank. As for the outer frontier, we adopted the Copernicus “Potential Riparian Zone” (PRZ) layer from the European Copernicus Land Monitoring Service (available at https://land.copernicus.eu/local/riparian-zones, accessed on 30 September 2020). This layer was derived from a complex hydrological rainfall–runoff model that simulates catchment hydrological processes by integrating topographic, hydrological and geomorphological data [2], and represents the maximum potential area that can be occupied by the riparian zone [3].
Since riparian zones and their inherent structural patterns are determined not only by catchment-scale drivers but also by local-scale factors [5], we extracted riparian data, in both margins, separately. The resulting PRZ, ARZ and MRZ layers were thus split into right and left margins using the inner frontier obtained by the aforementioned method, and a total of 76 and 80 Sampling Units (SUs) were produced for the Mediterranean and Central Baltic hydroregions, respectively.

2.3. Human Disturbance Gradient

Two sets of variables describing the human disturbance gradient (i.e., the anthropogenic pressures), describing land-use/land-cover and hydromorphological aspects, were calculated for each Sampling Unit (SU), at the catchment (upstream drainage area of each SU) and segment scale (Copernicus PRZ layer).

2.3.1. Land-Use/Land-Cover (LULC) Data

Land-use/land-cover data were obtained using five classes representing a decreasing human disturbance for the riparian ecosystem [5,6], namely: (1) Artificial surfaces; (2) Intensive agriculture; (3) Managed forest; (4) Extensive agriculture; (5) Unmanaged forest.
For the assessment of land-use/land-cover at the catchment-scale (C_LULC), we used the Corine Land Cover 2012 dataset (available at https://land.copernicus.eu/pan-european/corine-land-cover/clc2012, accessed on 30 September 2020) and evaluated the percentage of each LULC class at the upstream drainage area of each SU. For the segment scale (S_LULC), we used the Copernicus Riparian Land-cover/Land-use layer (available at https://land.copernicus.eu/local/riparian-zones/land-cover-land-use-lclu-image, accessed on 30 September 2020) and evaluated the percentage of each LULC class in the Copernicus PRZ area of each SU.
In the Mediterranean hydroregion, we reclassified the areas occupied by eucalyptus forests using the Land-Use/Land-Cover COS 2015 dataset (available at: http://www.dgterritorio.pt/, accessed on 30 September 2020), in order to include these intensive broadleaved plantations in the Managed forest class.

2.3.2. Hydromorphological Data

Hydromorphological data were assessed by using surrogate variables for streamflow alterations and morphological changes. Two variables were computed for the catchment scale—the Number of Dams in the Upstream Drainage Area (C_DAM) and the Reservoir Capacity Upstream the Drainage Area (C_RES). The former represents the number of existing large dams restraining water flow in the upstream drainage area of each SU, and the latter the capacity of those dams to function as reservoirs. These catchment-scale variables were obtained using RivTool [28] and were derived from georeferencing large dams included in the ICOLD database [30]. For the segment scale, we computed the Number of Barriers (S_BAR) by visually identifying the number of weirs and barriers that were affecting water flow along each river segment over the Esri World Imagery layer. In the end, we obtained 13 disturbance variables at the segment and catchment scale (see Supplementary Materials, Table S1).

2.4. Riparian Connectivity

To assess the connectivity of riparian forests with the ARZ and MRZ layers, we applied the Integral Index of Connectivity (IIC), developed by Pascual-Hortal and Saura [31]. This index is largely adopted to assess connectivity for target species by quantitatively describing a landscape as a set of interconnected patches [32,33,34]. Patches usually represent suitable habitats and are considered connected if the dispersal ability of the organism is higher than the distance among each pair of patches. In this study, we tested several incremental distance thresholds (from 5 to 15,000 m) to account for the different theoretical dispersal abilities of organisms that depend on riparian habitats [35,36,37].
The IIC was calculated for the ARZ and MRZ layers using the Conefor 2.6 software [38] and ranges from 0 to 1, increasing with improved connectivity and being equal to 1 in the hypothetical case that all the landscape is occupied by habitat. For the landscape area, we used the left and right margins of the PRZ layer for each respective SU and represented the IIC as the percentage of connected habitat.
Finally, we compared the results of riparian connectivity obtained with the Copernicus ARZ layer with the IIC values for the connectivity of riparian vegetation patches obtained with the ground-truth MRZ layer.

2.5. Statistical Analysis

To classify SUs along a human disturbance gradient, we applied a hierarchical agglomerative cluster analysis using the land-use/land-cover and hydromorphological variables. In order to prioritize clustering by the merging of the least dissimilar SUs, we used the complete-linkage method, allowing us to maximize the distance between groups and minimize distance within groups [39]. The obtained groups were validated by observing the significance and degree of segregation using ANOSIM tests. The name of each disturbance group was assigned according to the main direct physical effects and potential ecological consequences caused by LULC occupation and hydromorphological changes in the riparian vegetation structure.
A Non-Metric Multidimensional Scaling Analysis (NMDS) was performed to allow better visualization of the level of similarity between the disturbance groups and to identify the relative contribution of each variable for the distinct disturbance group.

3. Results

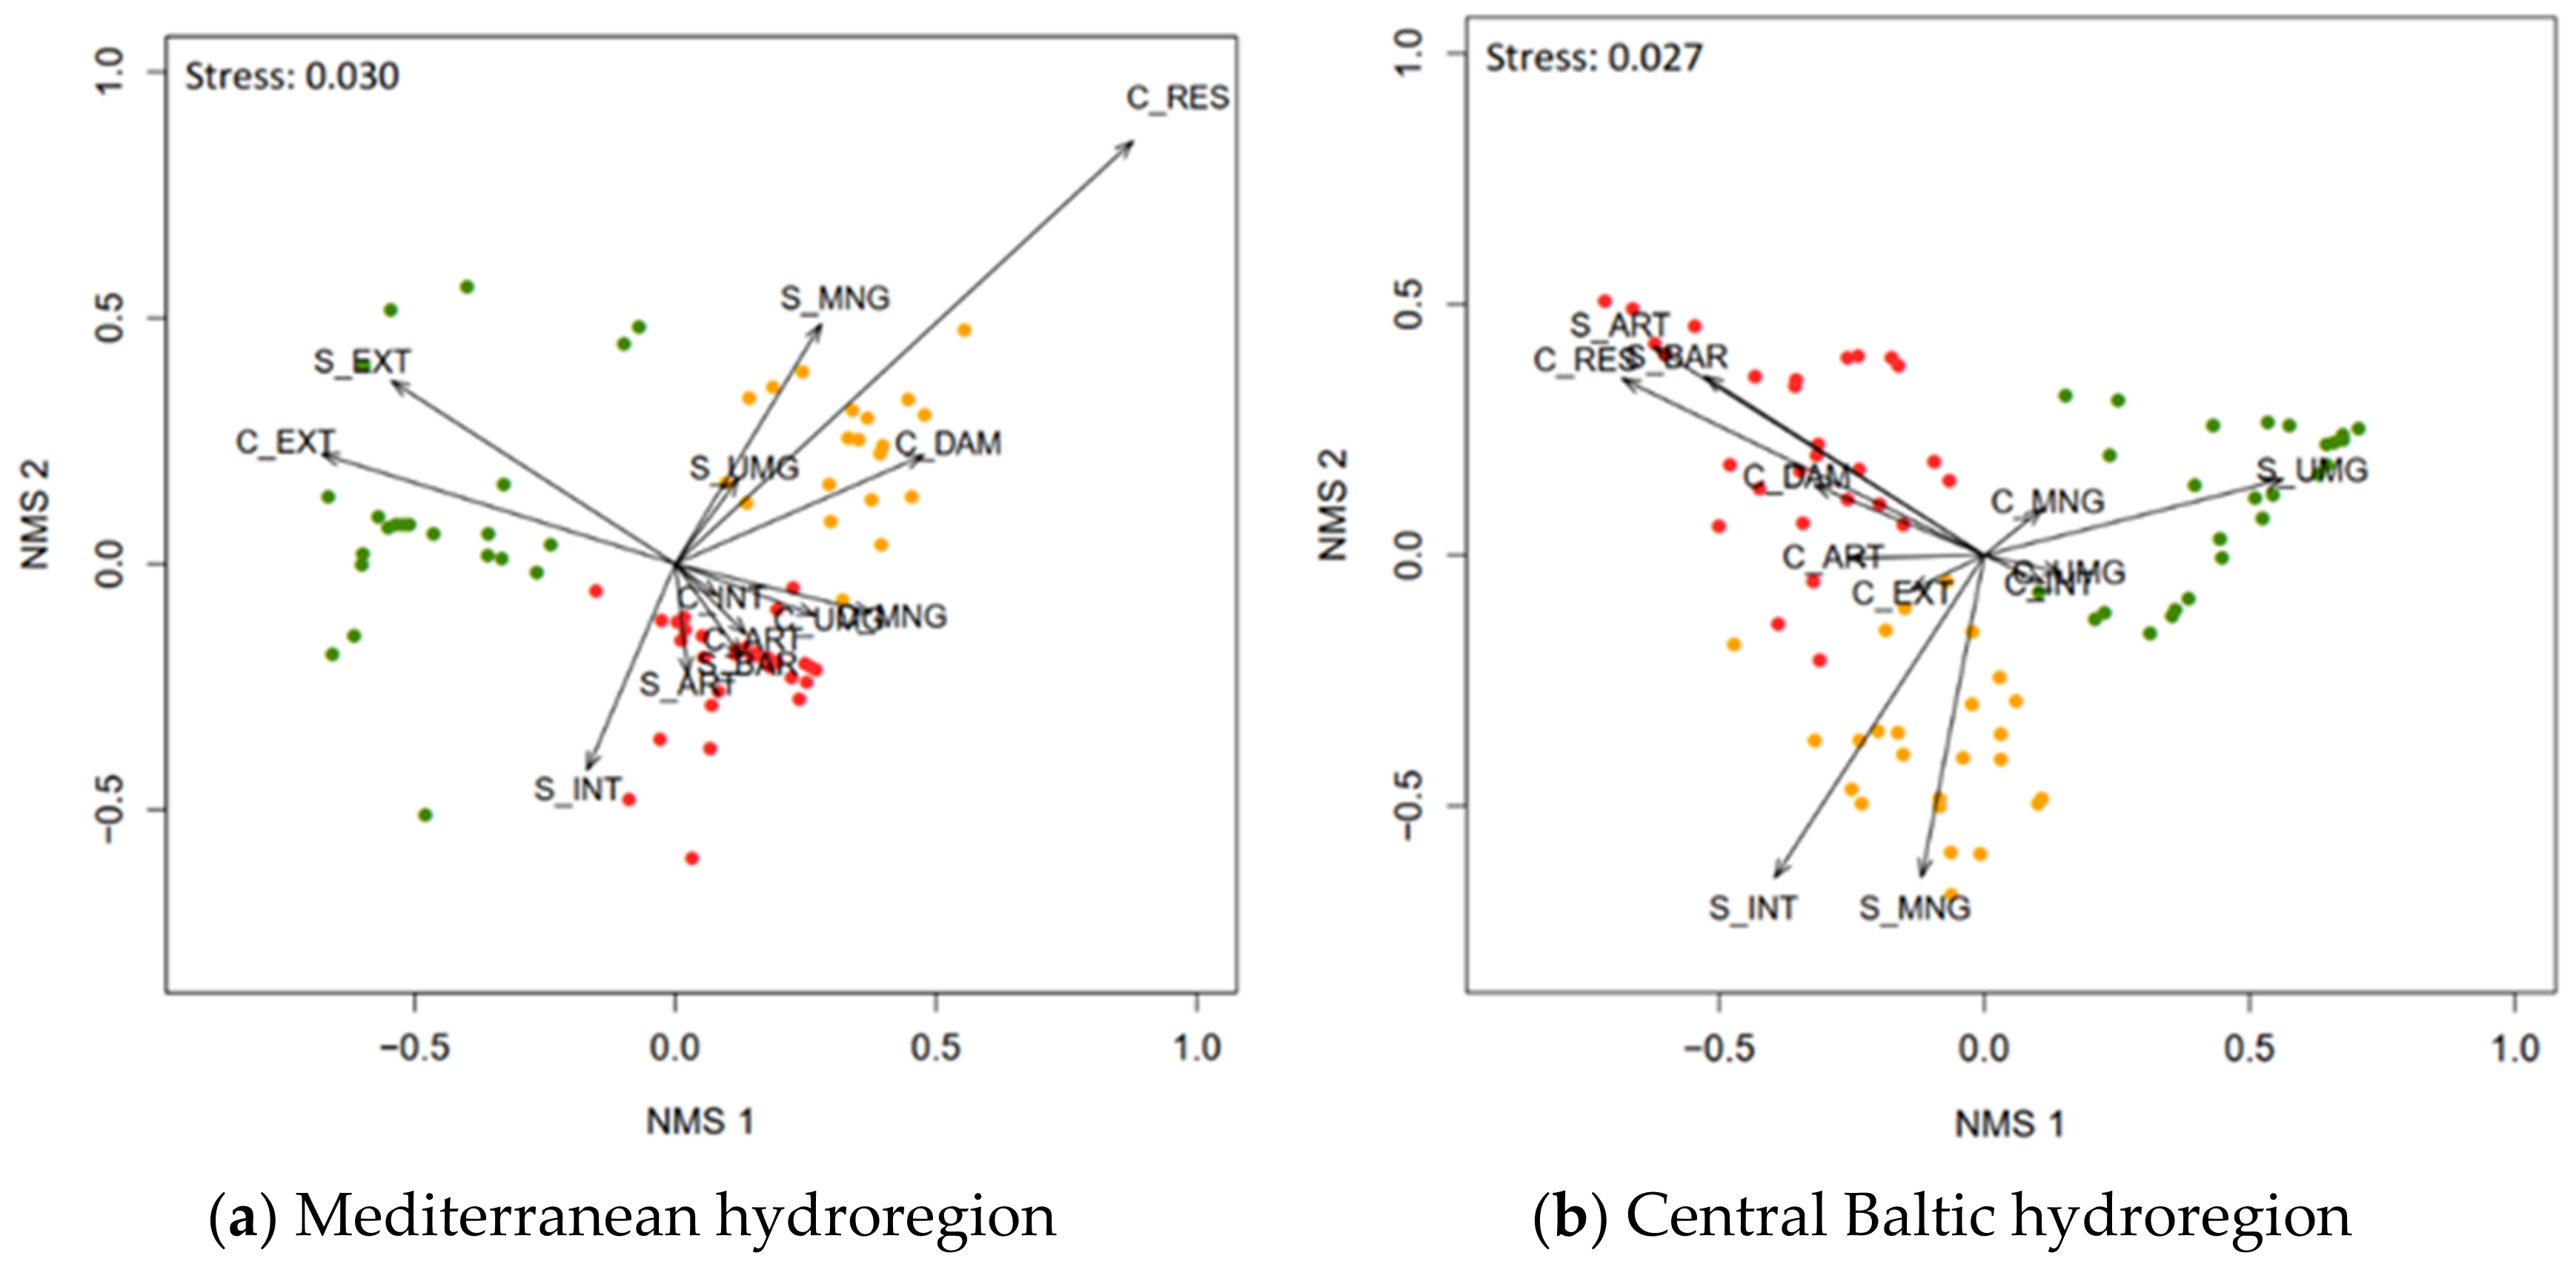
3.1. Land-Use/Land-Cover and Hydromorphology

For the Mediterranean hydroregion, unmanaged broad-leaved forests dominated Tagus and Sorraia catchments (C_UMG = 31.7%), followed by Extensive agriculture, mostly represented by agroforestry systems (C_EXT = 25.6%). Managed forests and Intensive agriculture, characterized by olive groves and permanently irrigated land, also composed Tagus and Sorraia catchments (C_MNG = 20.9%; C_INT = 20.7%). At the segment-scale, natural and semi-natural forests (S_UMG = 46.4%), followed by Intensive agriculture (S_INT = 40.3%), established the dominant LULC along the river margins.
As for the Central Baltic, Extensive agriculture, composed of pastures and non-irrigated arable land (C_EXT = 29.8%), alongside managed coniferous and mixed forests (C_MNG = 29.6%) dominated the upstream drainage area of the SUs. Intensive agriculture (C_INT) represented 18.8%, while unmanaged broad-leaved forests (C_UMG) achieved 11.6%. Nevertheless, at the segment-scale, LULC was mostly composed of managed grasslands (S_MNG = 33.2%) and unmanaged forests (S_UMN = 32.6%). Urban and industrial areas (S_ART) represented 25.4% of the total area—nearly 10 times higher than in the Mediterranean hydroregion (S_ART = 2.6%).
Regarding hydromorphology, we observed a higher level of hydromorphological disturbance in the Mediterranean hydroregion, which is particularly evident in the variable capacity of the reservoirs upstream the drainage area (C_RES) (see Supplementary Materials, Table S2). Barriers along the watercourses of the Mediterranean hydroregion (S_BAR) are mostly comprised of small weirs commissioned for flood control and irrigation, while in the Central Baltic, in a lower number, the barriers mostly represent locks and other hydraulic systems for navigation and recreational purposes.

3.2. Human Disturbance Gradient

By choosing a dendrogram cut level based on dissimilarity of 80%, we obtained three groups of human disturbance (Global RANOSIM Mediterranean = 0.9578, p = 0.0001; Global RANOSIM Central Baltic = 0.9909, p = 0.0001), and classified them as: (1) Least Disturbed; (2) Moderately Disturbed; (3) Highly Disturbed. No significant partial superposition of groups was found within hydroregions (ANOSIM pairwise tests for differences between groups in the Mediterranean hydroregion: Global RANOSIM > 0.98, p = 0.0001; for the Central Baltic hydroregion: Global RANOSIM > 0.96, p = 0.0001).
In the Mediterranean hydroregion (Figure 2a), roughly a third of the clustered SUs were considered Least Disturbed and closely related with cork-oak silvopastoral systems at the catchment and segment-scale (C_EXT and S_EXT). About a quarter of the SUs were considered Moderately Disturbed, in close association with dams upstream the drainage area (C_RES and C_DAM), but also with monocultural areas of eucalyptus and pine plantations (C_MNG and S_MNG). The remaining SUs were considered Highly Disturbed, impacted by Artificial surfaces and Intensive agriculture (S_ART and S_INT) and by the presence of local barriers along the watercourse (S_BAR).
For the Central Baltic hydroregion (Figure 2b), roughly one-third of the SUs were considered Least Disturbed, typically associated with natural and semi-natural broad-leaved forests (C_UMG and S_UMG). The other third were considered Moderately Disturbed and were mostly related to segment-scale arable land (S_INT) as well as managed scrublands (S_MNG). The remaining SUs were considered Highly Disturbed, mostly driven by highly impacting variables such as urban and industrial areas at the catchment and segment scale (C_ART, S_ART) and by the presence of local barriers and large upstream dams (S_BAR, C_RES, C_DAM).

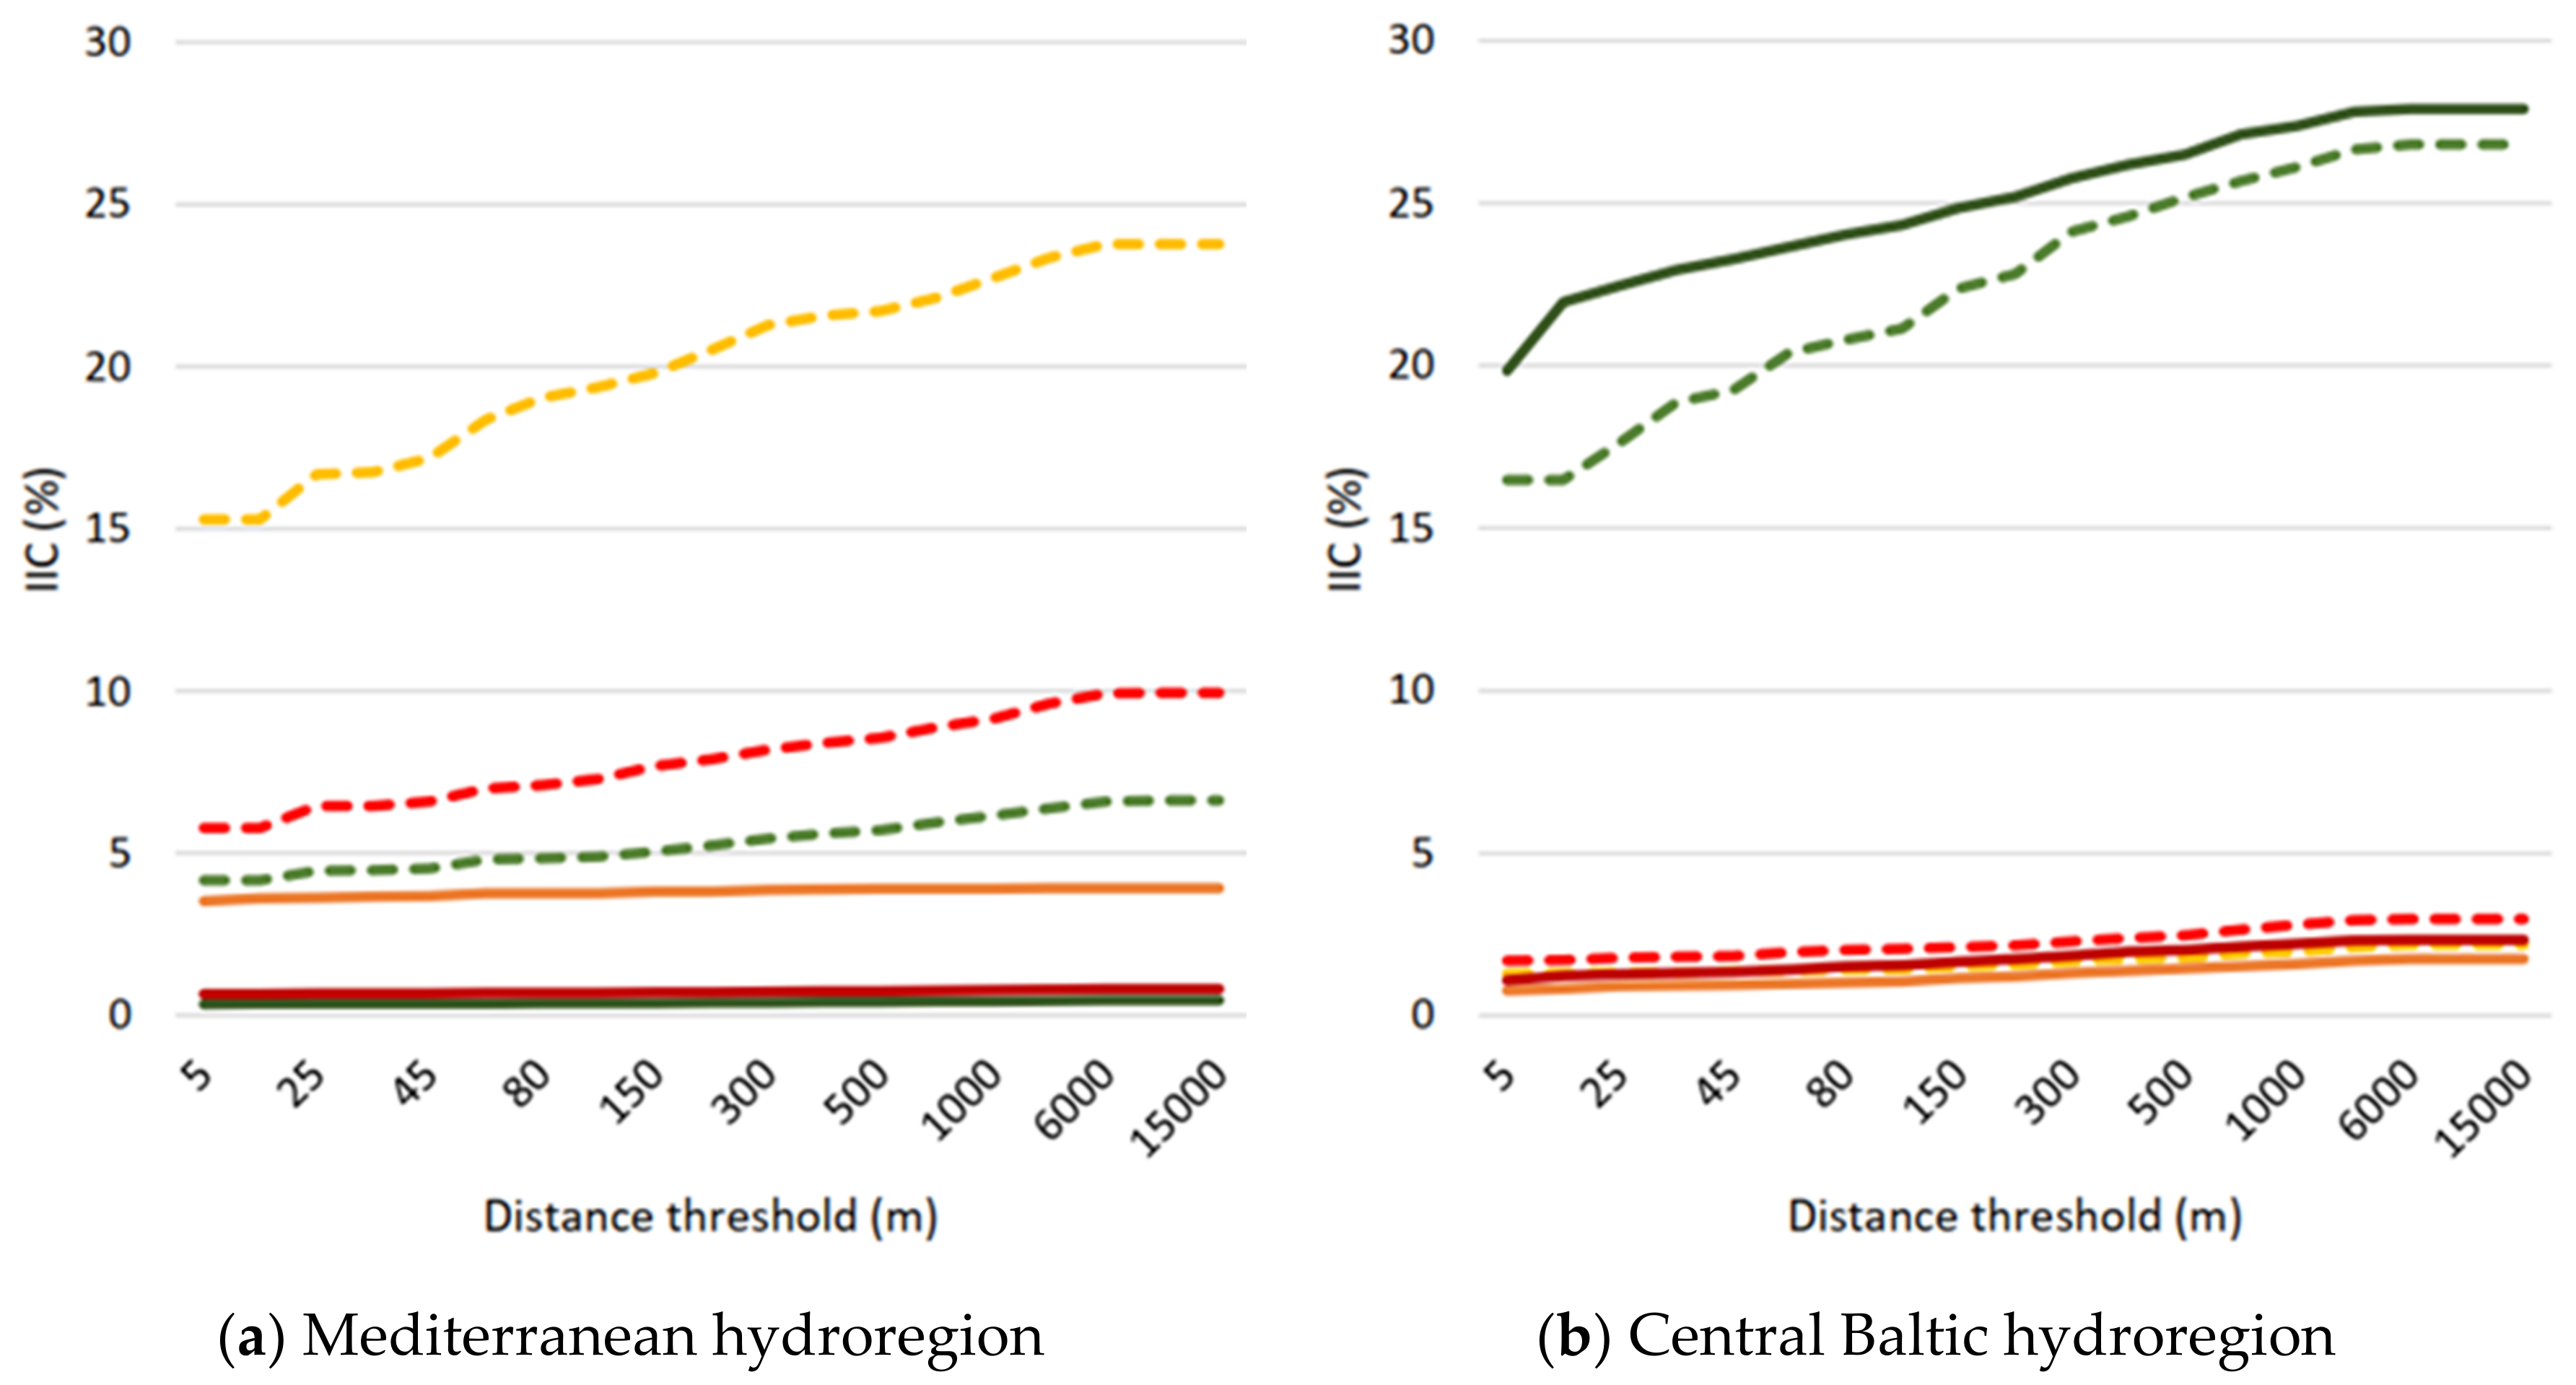
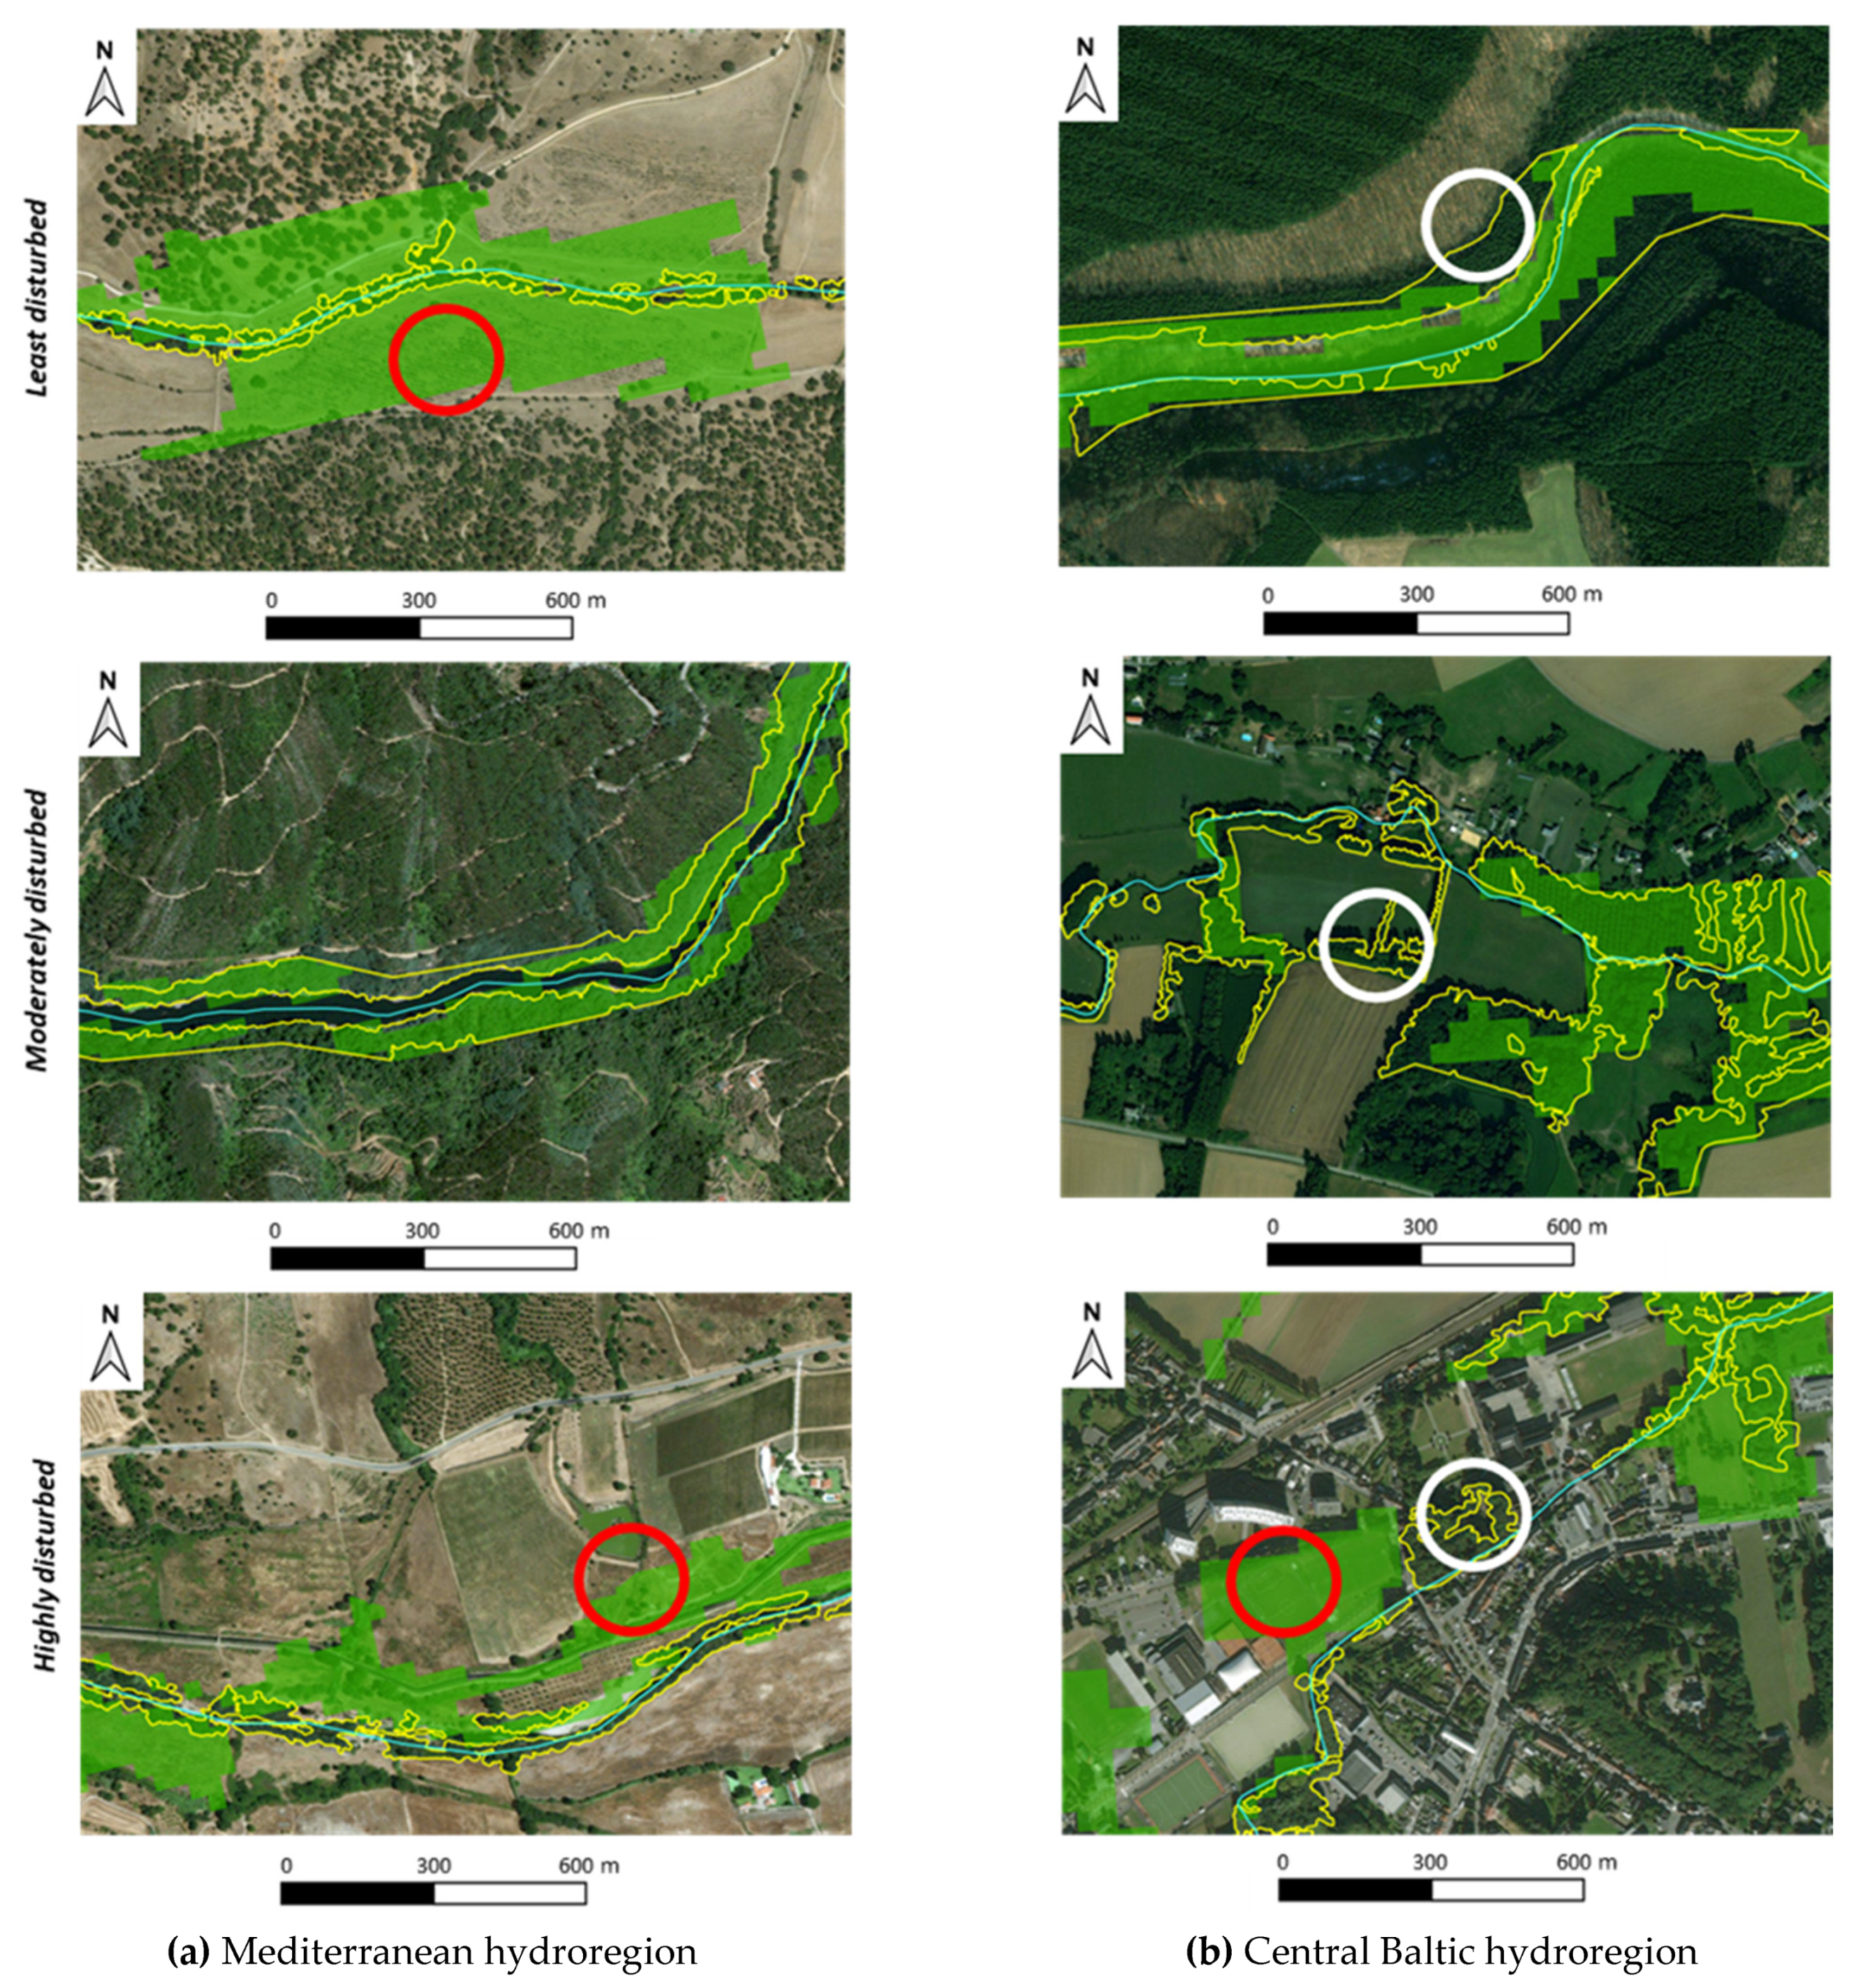
3.3. Riparian Connectivity

In the Mediterranean hydroregion, the highest riparian connectivity was obtained in Moderately Disturbed SUs, although only achieved an average maximum of 4%. We observed a consistent pattern of riparian forest connectivity overestimation when using the Copernicus ARZ layer (Figure 3a). Additionally, and although connectivity calculated with the Copernicus ARZ layer displayed a clear pattern of increasing IIC along the gradient of distance thresholds, we did not significantly observe this trend using the MRZ layer (overall average IIC values ranged from 1.32% to 1.53%).
For the Central Baltic hydroregion, the highest connectivity was obtained in the Least Disturbed SUs using the MRZ layer (27.9%) (Figure 3b). Moderately and Highly Disturbed SUs showed similar low connectivity values, not only among disturbance groups but also between both datasets. Nevertheless, a slight pattern of increasing connectivity and a higher agreement between the two riparian layers was detected across the gradient of distance thresholds.

4. Discussion

4.1. Connectivity of Riparian Forests across the Two Hydroregions

In the Mediterranean hydroregion, the highest value of connectivity, as given by the MRZ layer, can be explained by the presence of dams upstream of the studied segments and by the occurrence of managed forests in the vicinity of the river. Water regulation promoted by dam construction causes changes in sediment transport and the physical morphology of the river channel, altering the structure of riparian vegetation [40]. Similar patterns of large, complex and well-connected riparian vegetation patches were also observed in Mediterranean rivers subjected to dam-induced regulation, in a phenomenon called riparian encroachment [41], in which riparian forests tend to colonize the channel due to a lack of flushing flows. Additionally, in the last decades, intensive agricultural areas in the margins of the Tagus and Sorraia rivers are being gradually substituted by monocultural eucalyptus and pine plantations, also promoting changes in riparian vegetation structure and floristic composition [42].
The Least Disturbed SUs of the Mediterranean hydroregion exhibited small and simple riparian vegetation patches with reduced connectivity and were found to be closely associated with “montados” [43]. The main ecological consequences for riparian forests subject to this low-intensity agroforestry system include the removal of bank vegetation by grazing and a decreasing rate of natural regeneration. Nevertheless, those effects are considered less severe than the ones promoted by Intensive agriculture and Artificial surfaces observed in Highly Disturbed SUs, which include inputs of nutrients and pesticides as well as the intensification of runoff from impervious surfaces to the riparian zone [5]. In addition, riparian forests often constitute areas excluded from production and thus can generate a negative perception for farm managers [44,45]. Thus, many of these Least and Highly Disturbed SUs in the Mediterranean hydroregion are subjected to tree clearing in order to prevent damages in the surrounding productive areas. Furthermore, these long-standing human alterations to the Mediterranean landscape are often heightened by the dryness of the Mediterranean climate.
In the Central Baltic hydroregion, the highest connectivity, as given by the MRZ layer, was obtained in the Least Disturbed SUs, typically associated with large and complex patches of preserved riparian forest remnants surrounded by broadleaved woodlands. Nevertheless, Moderately and Highly Disturbed SUs of the Central Baltic hydroregion exhibited smaller and more isolated riparian vegetation patches.
The Central Baltic hydroregion can be characterized by a long-term agricultural intensification of riverine areas [4]. This is especially evident in Moderately Disturbed SUs, highly impacted by crops. In addition, there is a generalized historical degradation of the river’s hydromorphology, mostly characterized by alterations in channel dimensions, forms and features and by the presence of dams and local barriers upstream and along the river segments. The combination of water flow hindrance with the imperviousness of artificialized margins may explain the lower values of forest connectivity recorded in the riparian zones of the Central Baltic hydroregion.
Overall, we observed that segment-scale variables were particularly relevant to explain the variability in the connectivity of riparian forest remnants in Highly Disturbed SUs of both hydroregions. Previous studies also report similar conclusions regarding the effect of proximal disturbance variables on the structural degradation of riparian forests [5,46].

4.2. Drawbacks and Strengths of Copernicus Data for the Assessment of Riparian Forest Connectivity

Due to the effects of the long-standing human influence in Mediterranean riparian zones, we expected the Copernicus ARZ model to produce “false negative” misclassifications errors since high spatial resolution data is usually required to detect small riparian forest remnants. However, the ARZ layer produced an overall overestimation of riparian forest connectivity, resulting in “false positive” misclassification errors (Figure 4a). Weissteiner et al. [2] noted that the ARZ layer is unavoidably subjected to simplification, but we observed a generalized inaccuracy of the Copernicus ARZ model to separate the natural and semi-natural terrestrial environments from riparian forest remnants in the Mediterranean hydroregion (Figure 4a). As for the Central Baltic, despite an overall agreement between the two layers, we observed an underestimation of riparian forest connectivity in the Least Disturbed SUs with the ARZ layer, which can be explained by the coarse spatial resolution of the images used to produce it (Figure 4b).
The connectivity of riparian forests was calculated as the percentage of area occupied by riparian vegetation patches relative to a potential riparian zone established by the Copernicus PRZ layer. The Copernicus PRZ boundary is naturally characterized by a high degree of uncertainty due to its intrinsic fuzzy nature [2]. Thus, it should be noted that the values obtained in this study represent relative and not absolute connectivity measures, although conclusions regarding the comparison of connectivity between the two hydroregions remain similar.
Another source of potential errors in the adopted methodology is related to the mismatch between image dates and spatial resolution. While the Copernicus ARZ layer was derived from the analysis of images collected between 2011 and 2013, the MRZ layer was derived from airborne imagery collected in 2018. Although riparian zones are highly dynamic ecosystems, relevant changes in the riparian woody strata usually require more than 5 years to be significantly detectable with the image resolution that was used in the current study. Other riparian woody vegetation analyses have been successfully conducted with similar temporal mismatch among images and field data [47]. As for differences in the spatial resolution, due to the coarser resolution used to develop the ARZ model, riparian patches appear larger, more homogeneous and less numerous, while with the MRZ layer, representative of the ground-truth, patches are smaller, more heterogeneous and in higher number (Figure 4). Nevertheless, since these methodological features are overall transversal and systematic in both hydroregions, they do not explain the variability observed in the data or alter the main conclusions about the comparison between hydroregions.

4.3. Implications for the Management of Riparian Zones

Although relevant broad-scale analysis can be made using the Copernicus “Riparian Zones” dataset to assess the connectivity of riparian forests [21,22,29], particular attention should be given in regions subject to high levels of human disturbance and extreme bioclimatic conditions, such as the Mediterranean hydroregion, since they usually present highly altered riparian zones [4]. Besides the higher spatial resolution required to use the Copernicus ARZ layer as input data to assess the connectivity of riparian forests, aspects related to floristic composition could be also directly included in the model [48,49]. The forest vegetation classes, detected near streams in the Copernicus ARZ layer, do not necessarily represent near-natural vegetation classes nor riparian dominant species. Alien invasive species, such as Arundo donax L. in the Mediterranean region, or even-aged mono-specific plantations (Populus sp. or Picea abies L.) in the Central Baltic, can form large and highly connected riparian zones, with negative impacts on ecological integrity [50,51]. In addition, and for the proper evaluation of the Copernicus “Riparian Zones” dataset, a more extensive bioclimatic and geomorphological coverage should be considered, alongside other human disturbance factors, emerging threats to riparian ecosystems and their respective interactions (e.g., nutrients and pesticides in agricultural runoff, plant invasions, fire effects and disease-induced riparian decline [52,53]).
When using the current Copernicus ARZ layer to assess the connectivity of riparian forests and, consequently, to measure the capacity of riparian zones to provide Ecosystem Services (ES), caution must be taken. Provisioning and regulation ES are mostly supported by processes based on the biophysical structure of the riparian vegetation. By overestimating the size and connectivity of riparian forests, the Copernicus ARZ layer overestimates, for instance, the capacity of riparian zones to filter pollutants and sediments, or the capacity to provide a habitat for species maintenance and dispersal. Furthermore, riparian vegetation restoration measures in Highly Disturbed river segments may be also impacted when using the Copernicus ARZ layer, since misclassified riparian forests are more prone to produce errors in restoration budgets, as shown by Gergel et al. [54].
The Copernicus ARZ layer could be also combined with other ancillary datasets to produce novel indicators, able to support the objectives of European programs and policy initiatives, such as the EU Biodiversity Strategy to 2030, the Habitats and Birds Directives and the Water Framework Directive. Weissteiner et al. [2] demonstrated that the ratio of the Copernicus ARZ/PRZ can provide valuable insights concerning the ecological status of European riparian zones. By improving the spatial resolution and thematic accuracy of the ARZ layer, this indicator could give a clearer idea about the current deviation of riparian zones from a reference situation, as described by the PRZ layer.

5. Conclusions

Land-use/land-cover and hydromorphological disturbance constrain the structure of riparian zones by strongly affecting the connectivity and spatial attributes of riparian forests. We found an overall pattern of reduced riparian connectivity, except for Least Disturbed areas in the Central Baltic hydroregion. Fragmentation was particularly evident in the Mediterranean hydroregion as a result of its legacy concerning the combination of LULC changes and hydromorphological regulation with the dryness of the Mediterranean climate. In Moderate and Highly Disturbed areas of the Central Baltic hydroregion, low riparian connectivity was also apparent, as a direct result of the hydromorphological degradation of the river caused by the historical artificialization of the river channel, features and forms.
The Copernicus ARZ layer was found to be useful and usable when assessing the connectivity of riparian forests in the Central Baltic but displayed a pattern of consistent connectivity overestimation in the Mediterranean hydroregion. Nevertheless, it could be interesting to observe how this layer would behave in other European hydroregions, as the dynamics of riparian zones differ from one bioclimatic region to another.

Supplementary Materials

The following are available online at https://www.mdpi.com/article/10.3390/f12060674/s1, Table S1: List of pressure variables, respective acronyms, measurement units and supporting references, Table S2: Land-use/land-cover percentages and hydromorphology values for the catchment and segment scale in each hydroregion.

Author Contributions

All authors conceptualized the project; A.F. and M.R.F. designed the methodology and led the writing. A.F., J.-P.U. and G.D. collected the data, and all authors analyzed the data and discussed and interpreted results. P.M.R.-G. and M.T.F. gathered funding. All authors contributed critically to the manuscript’s drafts, revised them for important intellectual content and gave final approval for publication. All authors have read and agreed to the published version of the manuscript.

Funding

This study received backing, and the publication in open access was financed by the Forest Research Center (CEF). CEF is a research unit funded by the Foundation for Science and Technology (FCT), Portugal (UIDB/00239/2020).

Institutional Review Board Statement

Not applicable.

Informed Consent Statement

Not applicable.

Data Availability Statement

The dataset that supports the findings of this study (Manual Riparian Zone) is openly available at https://doi.org/10.6084/m9.figshare.12573494 (accessed on 21 May 2021).

Acknowledgments

This study was conducted in the context of STSM 43939 “Potential of Copernicus data to assess European riparian zones integrity” COST Action (CA16208)—CONVERGES: Knowledge Conversion for Enhancing Management of European Riparian Ecosystems and Services. We acknowledge the Project OPTIMUS PRIME FCT-PTDC/ASP-AGR/29771/2017 and Project CERES Interreg IV-B SUDOE-SOE2/P5/F0551. GD was supported by national funds via FCT, by the project PTDC/ASP-AGR/29771/2017. FCT also supported AF, under PD/BD/142884/2018. PMRG was funded through the Investigador FCT Programme (IF/00059/2015) and the CEEC Individual Programme (2020.03356.CEECIND). AM was supported by the Stereo program (grant SR/00/347) from the Belgian Scientific Policy Department. We also thank Emilio Politti and Simon Dufour for fruitful discussions in the preliminary stages of this study.

Conflicts of Interest

The authors declare no conflict of interest. The funders had no role in the design of the study; in the collection, analyses, or interpretation of data; in the writing of the manuscript, or in the decision to publish the results.

References

  1. Dufour, S.; Rodríguez-González, P.M.; Laslier, M. Tracing the scientific trajectory of riparian vegetation studies: Main topics, approaches and needs in a globally changing world. Sci. Total Environ. 2019, 653, 1168–1185. [Google Scholar] [CrossRef] [PubMed]
  2. Weissteiner, C.J.; Ickerott, M.; Ott, H.; Probeck, M.; Ramminger, G.; Clerici, N.; de Sousa, A.M.R. Europe’s green arteries—A continental dataset of riparian zones. Remote Sens. 2016, 8, 925. [Google Scholar] [CrossRef] [Green Version]
  3. Clerici, N.; Weissteiner, C.J.; Paracchini, M.L.; Strobl, P. Riparian zones: Where green and blue networks meet: Pan-European zonation modelling based on remote sensing and GIS. Eur. Com. JRC Sci. Tech. Rep. 2011. [Google Scholar] [CrossRef]
  4. Tockner, K.; Stanford, J.A. Riverine flood plains: Present state and future trends. Environ. Conserv. 2002, 29, 308–330. [Google Scholar] [CrossRef] [Green Version]
  5. Fernandes, M.R.; Aguiar, F.C.; Ferreira, M.T. Assessing riparian vegetation structure and the influence of land use using landscape metrics and geostatistical tools. Landsc. Urban Plan. 2011, 99, 166–177. [Google Scholar] [CrossRef] [Green Version]
  6. Aguiar, F.C.; Martins, M.J.; Silva, P.C.; Fernandes, M.R. Riverscapes downstream of hydropower dams: Effects of altered flows and historical land-use change. Landsc. Urban Plan. 2016, 153, 83–98. [Google Scholar] [CrossRef]
  7. Turner, M.G. Landscape ecology: The effect of pattern on process. Annu. Rev. Ecol. Syst. 1989, 20, 171–197. [Google Scholar] [CrossRef]
  8. Malanson, G.P. Riparian Landscapes; Cambridge Studies in Ecology; Cambridge University Press: Cambridge, UK, 1996. [Google Scholar]
  9. Capon, S.J.; Chambers, L.E.; Mac Nally, R.; Naiman, R.J.; Davies, P.; Marshall, N.; Williams, S.E. Riparian Ecosystems in the 21st Century: Hotspots for Climate Change Adaptation? Ecosystems 2013, 16, 359–381. [Google Scholar] [CrossRef]
  10. Clerici, N.; Paracchini, M.L.; Maes, J. Land-cover change dynamics and insights into ecosystem services in European stream riparian zones. Ecohydrol. Hydrobiol. 2014, 14, 107–120. [Google Scholar] [CrossRef]
  11. Fernandes, M.R.; Segurado, P.; Jauch, E.; Ferreira, M.T. Riparian responses to extreme climate and land-use change scenarios. Sci. Total Environ. 2016, 569–570, 145–158. [Google Scholar] [CrossRef]
  12. Ward, J.V.; Tockner, K.; Schiemer, F. Biodiversity of floodplain river ecosystems: Ecotones and connectivity. Regul. Rivers Res. Manag. 1999, 15, 125–139. [Google Scholar] [CrossRef]
  13. Moggridge, H.L.; Gurnell, A.M.; Mountford, J.O. Propagule input, transport and deposition in riparian environments: The importance of connectivity for diversity. J. Veg. Sci. 2009, 20, 465–474. [Google Scholar] [CrossRef]
  14. De la Fuente, B.; Mateo-Sánchez, M.C.; Rodríguez, G.; Gastón, A.; Pérez de Ayala, R.; Colomina-Pérez, D.; Saura, S. Natura 2000 sites, public forests and riparian corridors: The connectivity backbone of forest green infrastructure. Land Use Policy 2018, 75, 429–441. [Google Scholar] [CrossRef]
  15. Ward, J.V.; Tockner, K.; Arscott, D.B.; Claret, C. Riverine landscape diversity. Freshw. Biol. 2002, 47, 517–539. [Google Scholar] [CrossRef] [Green Version]
  16. De Sosa, L.L.; Glanville, H.C.; Marshall, M.R.; Abood, S.A.; Williams, A.P.; Jones, D.L. Delineating and mapping riparian areas for ecosystem service assessment. Ecohydrology 2018, 11, 1–16. [Google Scholar] [CrossRef]
  17. Rodríguez-González, P.M.; Albuquerque, A.; Martínez-Almarza, M.; Díaz-Delgado, R. Long-term monitoring for conservation management: Lessons from a case study integrating remote sensing and field approaches in floodplain forests. J. Environ. Manag. 2017, 202, 392–402. [Google Scholar] [CrossRef] [PubMed]
  18. Huylenbroeck, L.; Laslier, M.; Dufour, S.; Georges, B.; Lejeune, P.; Michez, A. Using remote sensing to characterize riparian vegetation: A review of available tools and perspectives for managers. J. Environ. Manag. 2020, 267, 1–38. [Google Scholar] [CrossRef]
  19. European Environment Agency. EEA/MDI/14/001 Copernicus Initial Operations 2011–2013—Land Monitoring Service Local Component: Riparian Zones. Available online: https://www.eea.europa.eu/about-us/tenders/eea-mdi-14-001-copernicus (accessed on 25 March 2021).
  20. Clerici, N.; Vogt, P. Ranking European regions as providers of structural riparian corridors for conservation and management purposes. Int. J. Appl. Earth Obs. Geoinf. 2013, 21, 477–483. [Google Scholar] [CrossRef]
  21. Bechter, T.; Baumann, K.; Birk, S.; Bolik, F.; Graf, W.; Pletterbauer, F. LaRiMo—A simple and efficient GIS-based approach for large-scale morphological assessment of large European rivers. Sci. Total Environ. 2018, 628–629, 1191–1199. [Google Scholar] [CrossRef]
  22. Piedelobo, L.; Taramelli, A.; Schiavon, E.; Valentini, E.; Molina, J.L.; Xuan, A.N.; González-Aguilera, D. Assessment of green infrastructure in Riparian zones using copernicus programme. Remote Sens. 2019, 11, 2967. [Google Scholar] [CrossRef] [Green Version]
  23. Meybeck, M.; Kummu, M.; Dürr, H.H. Global hydrobelts and hydroregions: Improved reporting scale for water-related issues? Hydrol. Earth Syst. Sci. 2013, 17, 1093–1111. [Google Scholar] [CrossRef] [Green Version]
  24. Ferreira, T.; Globevnik, L.; Schinegger, R. Water Stressors in Europe: New Threats in the Old World. In Multiple Stressors in River Ecosystems. Status, Impacts and Prospects for the Future; Sabater, S., Elosegi, A., Ludwig, R., Eds.; Elsevier: Amsterdam, The Netherlands, 2019; pp. 139–155. [Google Scholar] [CrossRef]
  25. Vogt, J.; Soille, P.; De Jager, A.; Rimavičiūtė, E.; Mehl, W.; Foisneau, S.; Bamps, C. A Pan-European River and Catchment Database; OPOCE: Luxembourg, 2007. [Google Scholar] [CrossRef]
  26. Inag, I.P. Tipologia de Rios em Portugal Continental no âmbito da Implementação da Directiva Quadro da Água. I—Caracterização Abiótica. Available online: http://apambiente.pt/dqa/tipologia.html (accessed on 25 March 2021).
  27. Debruxelles, N.; Claessens, H.; Lejeune, P.; Rondeux, J. Design of a watercourse and riparian strip monitoring system for environmental management. Environ. Monit. Assess. 2009, 156, 435–450. [Google Scholar] [CrossRef]
  28. Duarte, G.; Segurado, P.; Oliveira, T.; Haidvogl, G.; Pont, D.; Ferreira, M.T.; Branco, P. The River Network Toolkit—RivTool. Ecography 2019, 42, 549–557. [Google Scholar] [CrossRef] [Green Version]
  29. Clerici, N.; Weissteiner, C.J.; Paracchini, M.L.; Boschetti, L.; Baraldi, A.; Strobl, P. Pan-European distribution modelling of stream riparian zones based on multi-source Earth Observation data. Ecol. Indic. 2013, 24, 211–223. [Google Scholar] [CrossRef]
  30. International Commission on Large Dams. ICOLD. Available online: http://www.icold-cigb.org/ (accessed on 30 April 2020).
  31. Pascual-Hortal, L.; Saura, S. Comparison and development of new graph-based landscape connectivity indices: Towards the priorization of habitat patches and corridors for conservation. Landsc. Ecol. 2006, 21, 959–967. [Google Scholar] [CrossRef]
  32. Pascual-Hortal, L.; Saura, S. Integrating landscape connectivity in broad-scale forest planning through a new graph-based habitat availability methodology: Application to capercaillie (Tetrao urogallus) in Catalonia (NE Spain). Eur. J. For. Res. 2008, 127, 23–31. [Google Scholar] [CrossRef]
  33. Saura, S.; Pascual-Hortal, L. A new habitat availability index to integrate connectivity in landscape conservation planning: Comparison with existing indices and application to a case study. Landsc. Urban Plan. 2007, 83, 91–103. [Google Scholar] [CrossRef]
  34. Van Looy, K.; Cavillon, C.; Tormos, T.; Piffady, J.; Landry, P.; Souchon, Y. A scale-sensitive connectivity analysis to identify ecological networks and conservation value in river networks. Landsc. Ecol. 2013, 28, 1239–1249. [Google Scholar] [CrossRef] [Green Version]
  35. Lees, A.C.; Peres, C.A. Conservation value of remnant riparian forest corridors of varying quality for Amazonian birds and mammals. Conserv. Biol. 2008, 22, 439–449. [Google Scholar] [CrossRef]
  36. Gilbert-Norton, L.; Wilson, R.; Stevens, J.R.; Beard, K.H. A meta-analytic review of corridor effectiveness. Conserv. Biol. 2010, 24, 660–668. [Google Scholar] [CrossRef]
  37. Santos, M.J.; Matos, H.M.; Palomares, F.; Santos-Reis, M. Factors affecting mammalian carnivore use of riparian ecosystems in Mediterranean climates. J. Mammal. 2011, 92, 1060–1069. [Google Scholar] [CrossRef] [Green Version]
  38. Saura, S.; Torné, J. Conefor Sensinode 2.2: A software package for quantifying the importance of habitat patches for landscape connectivity. Environ. Model. Softw. 2009, 21, 135–139. [Google Scholar] [CrossRef]
  39. Oksanen, J.; Blanchet, F.G.; Friendly, M.; Kindt, R.; Legendre, P.; O’Hara, R.B.; Wagner, H. Vegan: Community Ecology Package. Version 2.4-2. Available online: https://github.com/vegandevs/vegan (accessed on 25 March 2021).
  40. Corenblit, D.; Davies, N.S.; Steiger, J.; Gibling, M.R.; Bornette, G. Considering river structure and stability in the light of evolution: Feedbacks between riparian vegetation and hydrogeomorphology. Earth Surf. Process. Landf. 2015, 40, 189–207. [Google Scholar] [CrossRef] [Green Version]
  41. García de Jalón, D.; Martínez-Fernández, V.; Fazelpoor, K.; González del Tánago, M. Vegetation encroachment ratios in regulated and non-regulated Mediterranean rivers (Spain): An exploratory overview. J. Hydro Environ. Res. 2020, 30, 35–44. [Google Scholar] [CrossRef]
  42. Stromberg, J.C.; Rychener, T.J. Effects of fire on riparian forests along a free-flowing dryland river. Wetlands 2010, 30, 75–86. [Google Scholar] [CrossRef]
  43. Plieninger, T.; Wilbrand, C. Land use, biodiversity conservation, and rural development in the dehesas of Cuatro Lugares, Spain. Agrofor. Syst. 2001, 51, 23–34. [Google Scholar] [CrossRef]
  44. Fielding, K.S.; Terry, D.J.; Masser, B.M.; Bordia, P.; Hogg, M.A. Explaining landholders’ decisions about riparian zone management: The role of behavioural, normative, and control beliefs. J. Environ. Manag. 2005, 77, 12–21. [Google Scholar] [CrossRef]
  45. Thomas, E.; Riley, M.; Spees, J. Good farming beyond farmland—Riparian environments and the concept of the “good farmer”. J. Rural Stud. 2019, 67, 111–119. [Google Scholar] [CrossRef]
  46. Von Schiller, D.; Martí, E.; Riera, J.L.; Ribot, M.; Marks, J.C.; Sabater, F. Influence of land use on stream ecosystem function in a Mediterranean catchment. Freshw. Biol. 2008, 53, 2600–2612. [Google Scholar] [CrossRef]
  47. Aguiar, F.C.; Fernandes, M.R.; Martins, M.J.; Ferreira, M.T. Effects of a large irrigation reservoir on aquatic and riparian plants: A history of survival and loss. Water 2019, 11, 2379. [Google Scholar] [CrossRef] [Green Version]
  48. Husson, E.; Ecke, F.; Reese, H. Comparison of manual mapping and automated object-based image analysis of non-submerged aquatic vegetation from very-high-resolution UAS images. Remote Sens. 2016, 8, 724. [Google Scholar] [CrossRef] [Green Version]
  49. Michez, A.; Piégay, H.; Lisein, J.; Claessens, H.; Lejeune, P. Classification of riparian forest species and health condition using multi-temporal and hyperspatial imagery from unmanned aerial system. Environ. Monit. Assess. 2016, 188, 1–19. [Google Scholar] [CrossRef] [Green Version]
  50. Aguiar, F.C.; Ferreira, M.T.; Albuquerque, A.; Moreira, I. Alien and endemic flora on reference and non-reference sites from Mediterranean type-streams of Portugal. Aquat. Conserv. Mar. Freshw. Ecosyst. 2007, 17, 335–347. [Google Scholar] [CrossRef]
  51. Schneider, J.-B. Plaidoyer pour une restauration des cordons rivulaires naturels des ruisseaux et ruisselets forestiers. For. Wallonne 2007, 86, 43–57. [Google Scholar]
  52. Bjelke, U.; Boberg, J.; Oliva, J.; Tattersdill, K.; Mckie, B.G. Dieback of riparian alder caused by the Phytophthora alni complex: Projected consequences for stream ecosystems. Freshw. Biol. 2016, 61, 565–579. [Google Scholar] [CrossRef] [Green Version]
  53. Enderle, R.; Stenlid, J.; Vasaitis, R. An overview of ash (Fraxinus spp.) and the ash dieback disease in Europe. CAB Rev. Perspect. Agric. Vet. Sci. Nutr. Nat. Resour. 2019, 14. [Google Scholar] [CrossRef] [Green Version]
  54. Gergel, S.E.; Stange, Y.; Coops, N.C.; Johansen, K.; Kirby, K.R. What is the value of a good map? An example using high spatial resolution imagery to aid riparian restoration. Ecosystems 2007, 10, 688–702. [Google Scholar] [CrossRef]
Figure 1. Map of the European hydroregions with the geographic location of the study areas (light blue polygons). Left circular panels show the hydrological network (light blue lines) in the Mediterranean (light grey) and Central Baltic (dark grey) hydroregions.
Forests 12 00674 g001
Figure 2. Non-metric Multidimensional Scaling (NMDS) biplot showing the distances among variables. Disturbance groups with sampling units organized in clusters (green = Least Disturbed; orange = Moderately Disturbed; red = Highly Disturbed) for the (a) Mediterranean and (b) Central Baltic hydroregions.
Forests 12 00674 g002
Figure 3. Integral Index of Connectivity (IIC) (%) with incremental distance thresholds (m) along the gradient of human disturbance (dashed lines—Copernicus Actual Riparian Zone (ARZ); solid lines—Manual Riparian Zone (MRZ); green lines—Least Disturbed Sampling Units (SUs); orange lines—Moderately Disturbed SUs; Red lines—Highly Disturbed SUs) for the (a) Mediterranean and (b) Central Baltic hydroregions.
Forests 12 00674 g003
Figure 4. Least, Moderately and Highly Disturbed Sampling Units in the (a) Mediterranean and (b) Central Baltic hydroregions (light blue line—river segment; green areas—Copernicus Actual Riparian Zone (ARZ); yellow polygons—Manual Riparian Zone (MRZ); red circles—“false positive” misclassification; white circles—“false negative” misclassification).
Forests 12 00674 g004
Table 1. Main environmental and geomorphological characteristics of the studied segments (average (min–max)) in the Mediterranean and Central Baltic hydroregions.
Mediterranean HydroregionCentral Baltic Hydroregion
TagusSorraiaMeuseEscaut
Annual temperature (°C) *15.8 (13.4–16.5)13.4 (11.8–14.3)8.3 (7.4–9.6)9.7 (9.7–9.7)
Annual precipitation (mm.year−1) *769.4 (647.5–1048.2)1083.8 (953.9–1297.6)1030.1 (844.4–1128.1)828.2 (827.2–829.3)
Strahler order number *3 (2–5)4 (3–5)4 (3–5)3 (3–3)
Upstream drainage area (UDA) (km2) *572.6 (66.6–4765.9)1286.0 (129.0–5038.6)680.6 (108.5–2884.6)251.2 (174.3–328.1)
Drainage density UDA (km.km−2) *324.4 (228.5–547.6)491.1 (307.5–638.5)347.3 (204.7–437.7)234.7 (233.6–235.8)
Stream frequency (# segments.km−2) *10,140.9 (4504.5–25,999.4)27,445.6 (10,046.1–57,025.4)12,646.8 (5217.1–19,528.6)6624.5 (5790.6–7458.4)
River segment length (km)5.8 (0.8–17.9)5.2 (1.2–14.3)5.5 (0.9–20.3)7.5 (4.5–10.6)
* Extracted from Vogt et al. [25].
Publisher’s Note: MDPI stays neutral with regard to jurisdictional claims in published maps and institutional affiliations.

