1. Introduction
Soil erosion consists of detachment, transportation, and deposition of sediments due to rainfall and surface runoff [
1,
2]. Soil detachment is the separation of soil particles from the matrix over the terrain surface caused by erosive agents [
3], providing loose and non-cohesive sediment for subsequent transport and deposition [
4]. The process of soil detachment may be due to both raindrop impact and the overland flow [
5,
6]. When detachment is due to the overland flow, this process plays an important role in the overall erosion process [
1,
7,
8]. The maximum value of the soil detachment due to the overland flow is the soil detachment capacity [
9].
The mechanisms of soil detachment due to overland flow are different for inter-rill and rill erosion [
10]. Soil detachment in inter-rill erosion is mainly caused and enhanced by raindrop impact, which is insignificant in soil detachment due to rill erosion [
11,
12]. The latter mechanism, which mainly caused by overland flow, is the most important erosive process on steep slopes [
7,
13] and it is different between shallow or low flows and high flow rates [
14].
Understanding rill erosion due to low flow rates, particularly when erosion affects delicate forestland ecosystems, is important for hydrological predictions using process-based erosion models [
15], such as the Water Erosion Prediction Project (WEPP) [
16]. Since rill erosion is the prevailing form in process-based erosion models, the so-called “soil detachment capacity by rill flow” or, more simply, the “rill detachment capacity” (hereinafter indicated by “
Dc”), is a key parameter for accurate predictions of erosion [
17]. Therefore, the quantification of
Dc under different conditions is a critical issue to improve the prediction accuracy of these models.
Dc depends on both the characteristics of the overland flow and soil properties [
18]. In regards to the flow characteristics, the shear stress [
18,
19], stream power [
20,
21], unit stream power [
22,
23], and unit energy [
8,
24] are the hydraulic parameters that mainly influence the rill detachment capacity. In general, the shear stress and stream power are most commonly used to predict the soil detachment capacity using power functions [
25], although stream power is preferred [
10,
26,
27]. Among the relationships between the soil properties on
Dc, the type, texture, bulk density, cohesion, stability and median diameter of aggregates, organic matter and water content, and infiltrability [
4,
22,
28] are the most effective characteristics for predicting the soil detachment capacity. In more detail, Li et al. [
27] showed that the latter is well estimated using the soil bulk density, median diameter, silt content, cohesion, and root density, while the bulk density and moisture of undisturbed soil samples were the best predictors of soil detachment capacity according to De Baets and Poesen [
29].
Having highlighted the importance of soil properties in estimating
Dc, it is thus clear that a specific land use plays an important role on soil erodibility, since it influences soil hydrology by modifying the soil properties [
30,
31,
32,
33,
34,
35]. Therefore, an inappropriate land use can have a strong influence on the erosion process [
33,
36], due to variations in soil detachment capacity [
4,
27]. For instance, intensive agriculture and land abandonment may generally cause soil damage, thus increasing the erosion rates [
37,
38,
39], on which soil detachment clearly has some impact. Since forestland and woodland are very delicate ecosystems, and land use changes (such as deforestation and conversion into agricultural activities) may aggravate their susceptibility to soil erosion, it is important to evaluate the effects of land use on the rill detachment capacity due to the rill overland flow. At present, few studies have accomplished this task and the effects of different land uses on rill detachment capacity have not been quantified in depth [
4], particularly for forestland and woodland. Zhang et al. [
4,
40] found that the detachment rate of cropland soil was from two to 13 times greater than in grassland, shrubland, and wasteland. More recently, Li et al. [
27] reported that, on average, the ratios of the soil detachment capacity of cropland due to overland flow are much higher (from seven to 45 times) compared to for orchards, shrubland, woodland, grassland, and wasteland, and their variability for different types of land uses is closely related to soil properties, root systems, and tillage operations.
Evidently, there is still a need for a better comprehension of the land use influence on rill detachment capacity. Moreover, the hydraulic parameters of overland flow, which provide accurate estimates of rill detachment capacity (with particular attention to forestland and woodland), have not been completely identified and this need deserves more investigation.
To fill these gaps, this study quantifies the rill detachment capacity at low flow rates using an experimental flume on soils sampled in woodland, forestland, cropland, and grassland of the Saravan watershed (Northern Iran). We hypothesize that the more developed vegetation cover and structure of woodland and forestland are able to reduce the rill detachment capacity, compared to the other land uses. Moreover, regression equations are proposed to predict Dc and Kr from hydraulic parameters under controlled conditions of flow rate and terrain slope.
The study is a contribution to understand the relationships between the soil erodibility and both the soil properties and the hydraulic parameters under different land uses.
2. Materials and Methods
2.1. Study Area
In Iran, the anthropogenic activities (e.g., deforestation, intensive agriculture, farm abandonment), which play important influences on the natural soil pedogenesis, have been very intense in the past 50 years. In the northern part of this country, the reduction of forestland cover, due to the expansion of arable land and intensive cultivation, population growth, and technological development [
41], has led to soil degradation in large areas [
42]. Therefore, this region seems to be suitable for the study aims, since degradation of soil quality and increased erosion rate have been the main results of land use changes.
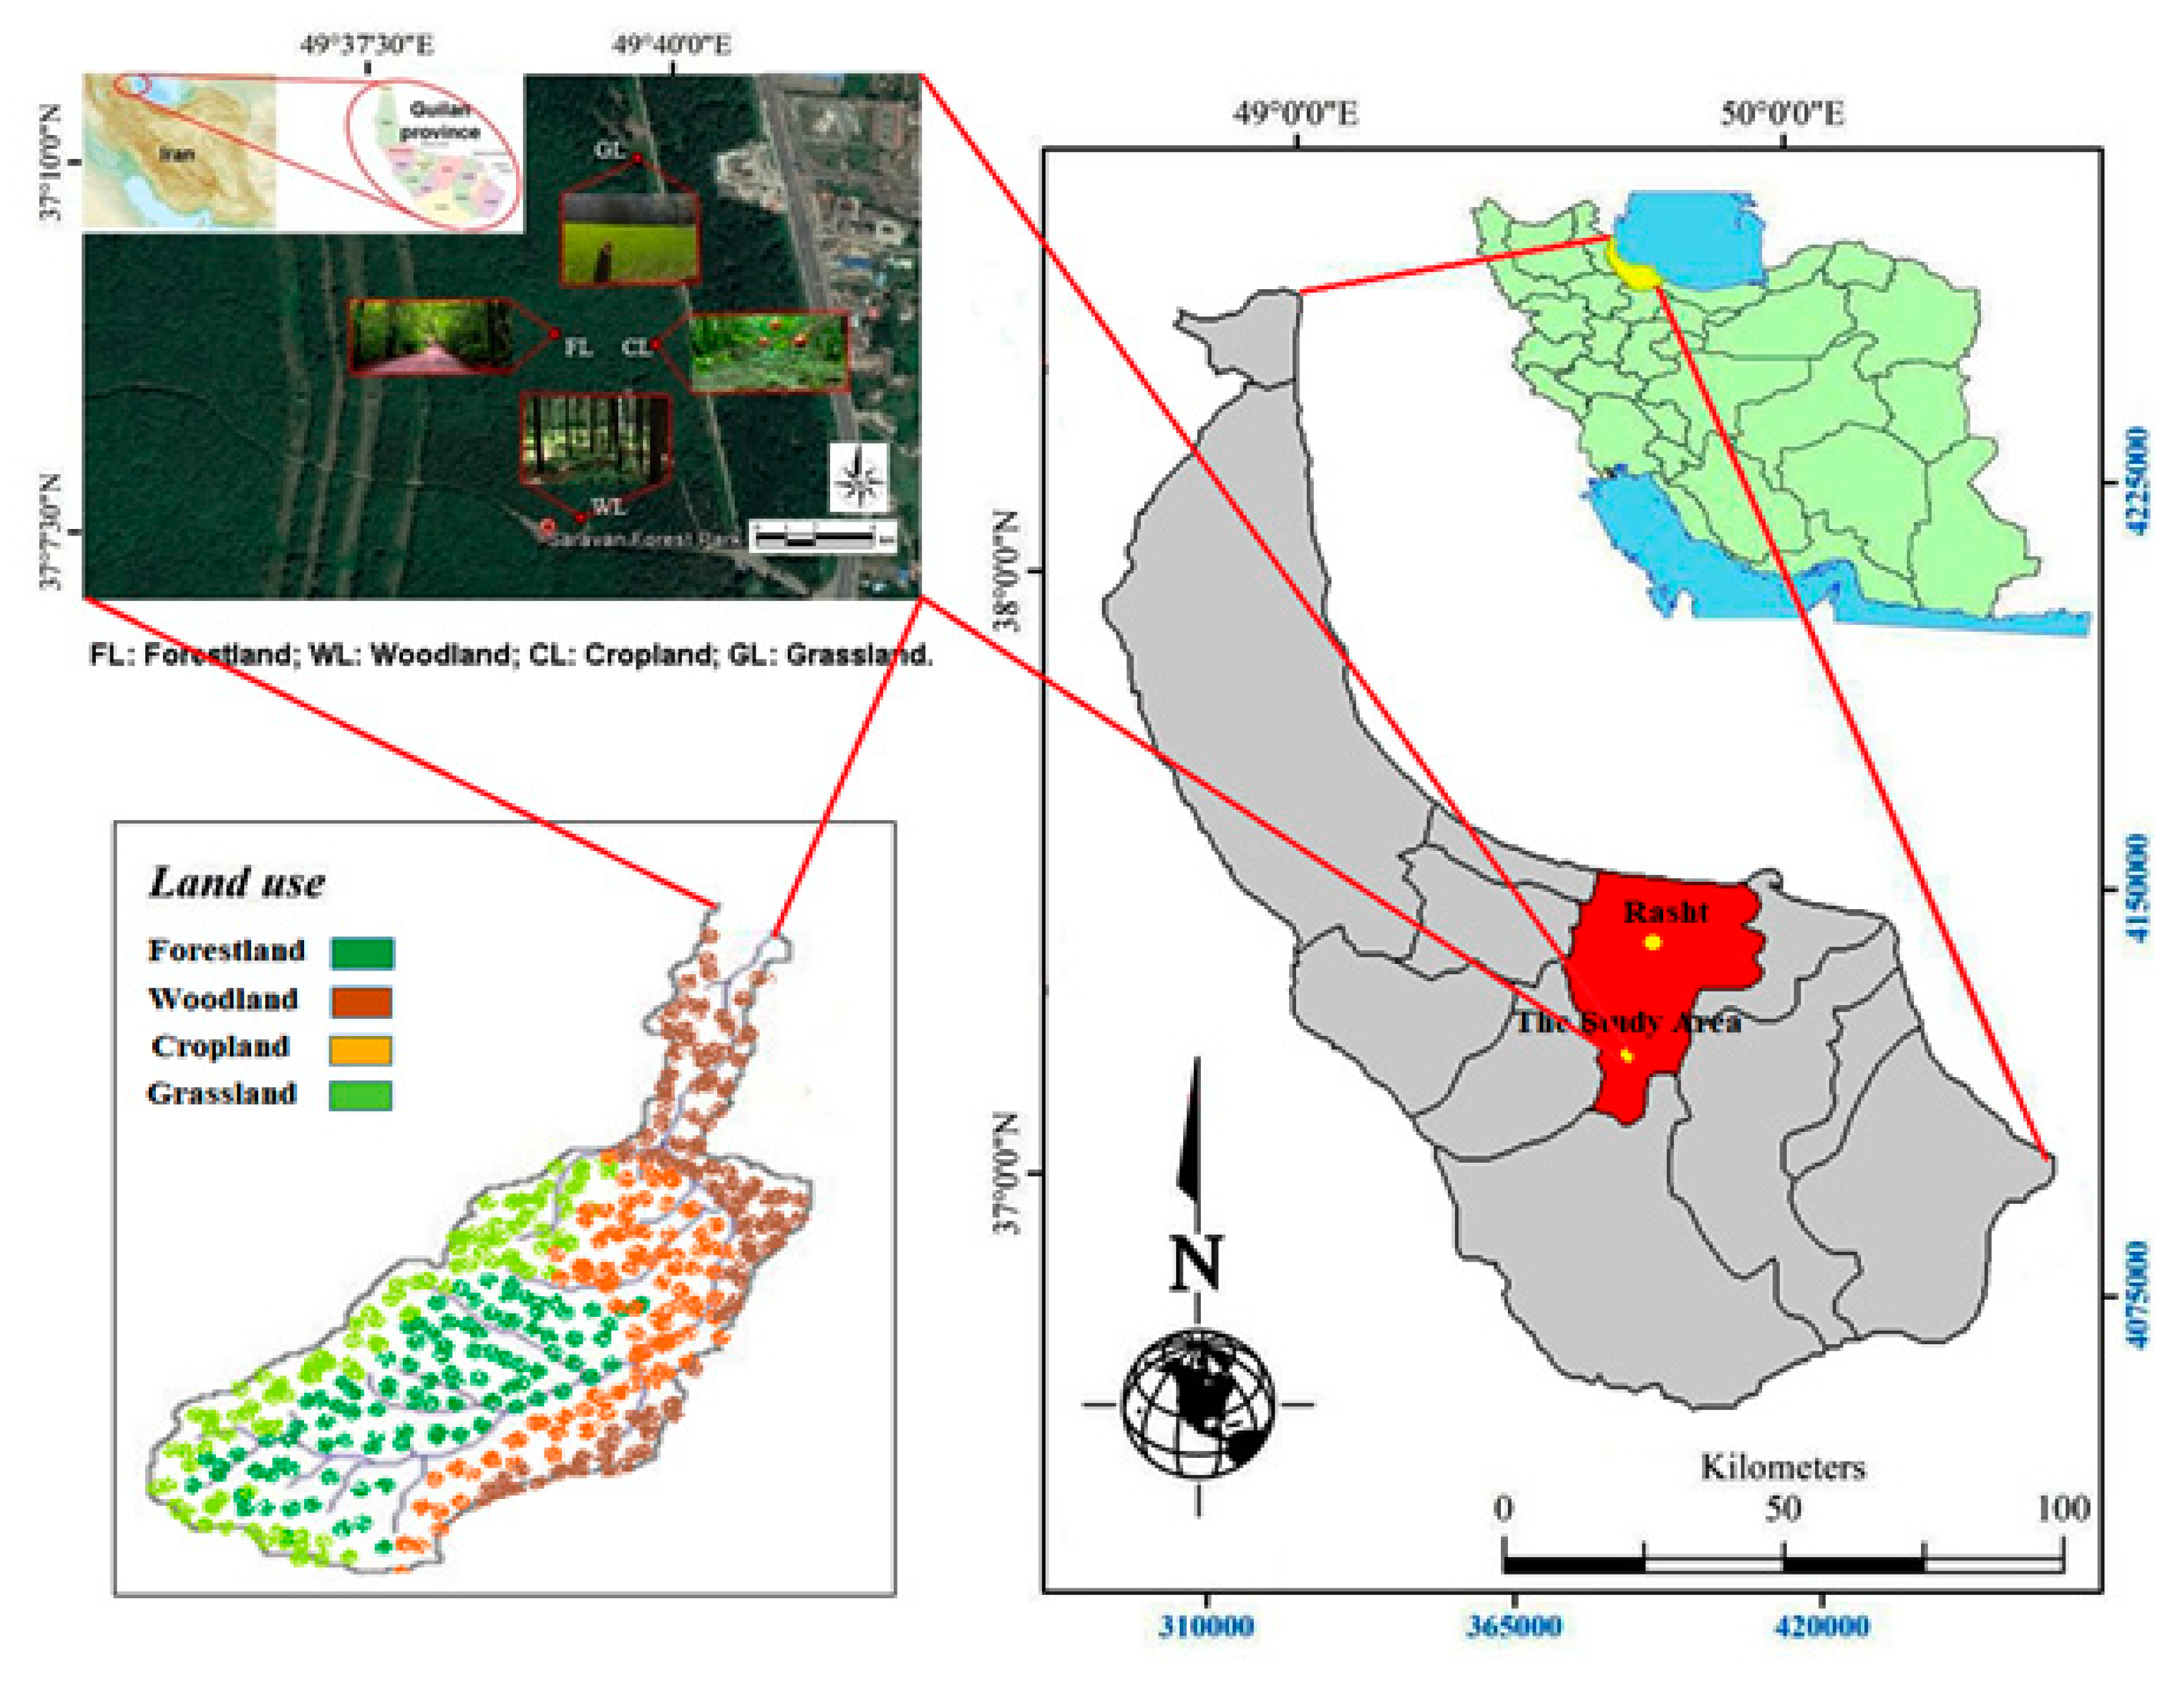
The study area is the Saravan Forestland Park, which is one of the oldest forestlands in Guilan province. The experiments were carried out in the Saravan watershed, which covers an area of 14.87 km
2 (outlet coordinates 37°08′04′′ N, 49°39′44″ E) between 50 and 250 m above the mean sea level (
Figure 1).
The climate of the area is typically Mediterranean,
Csa type, according to the Köppen-Geiger classification [
43]. The mean annual temperature and precipitation are 16.3 °C and 1360 mm, respectively [
44].
Forestland, cropland, grassland, and woodland in the Saravan watershed were the land uses under investigation in this study. The representative tree and plant species of the forestland are Carpinus betulus, Parrotia, willow, and pussy willow. Woodland is covered by smaller trees with lower density than forestlands. Grassland is covered by herbaceous vegetation and shrubs. Cropland consists of planted black berry, greengage, and sloe, subjected only to planting and harvesting as tillage operations.
2.2. Soil Sampling and Analyses
Dc was measured between August and September 2018 after collecting undisturbed soil samples of the four land uses in areas with similar slope gradients and elevation. In cropland, soil was sampled from flat patches.
The sampling procedure was adopted in accordance with the work of Zhang et al. [
4,
10]. A steel ring (0.1 m in diameter and 0.05 m in height) was used to extract the samples from soil. Before sampling, rocks, weeds, and litter were removed over the soil surface. In other to ensure minimum disturbance of the soil sample, roots and other debris surrounding the steel ring were clipped, while gently pressing the ring into the soil. After that, the steel ring was inserted into the soil and the sample bottom was carefully trimmed to remove the excess soil. Two cotton cloths were used to cushion the top and bottom of the steel ring, in order to avoid disturbance while the sample was transported to the laboratory.
Bulk density, aggregate stability in water, organic matter content, and root weight density were determined on additional 100 soil samples (25 samples × 4 land uses), randomly collected in the same location of each land use. Soil bulk density and aggregate stability were measured by the oven-drying and the wet-sieving methods, respectively. Soil organic matter was estimated by using the potassium dichromate colorimetric method. Root weight density was measured using a washing method over a sieve with a 1-mm mesh and subsequently roots of each soil sample were weighted after oven-drying for 24 h at 65 °C.
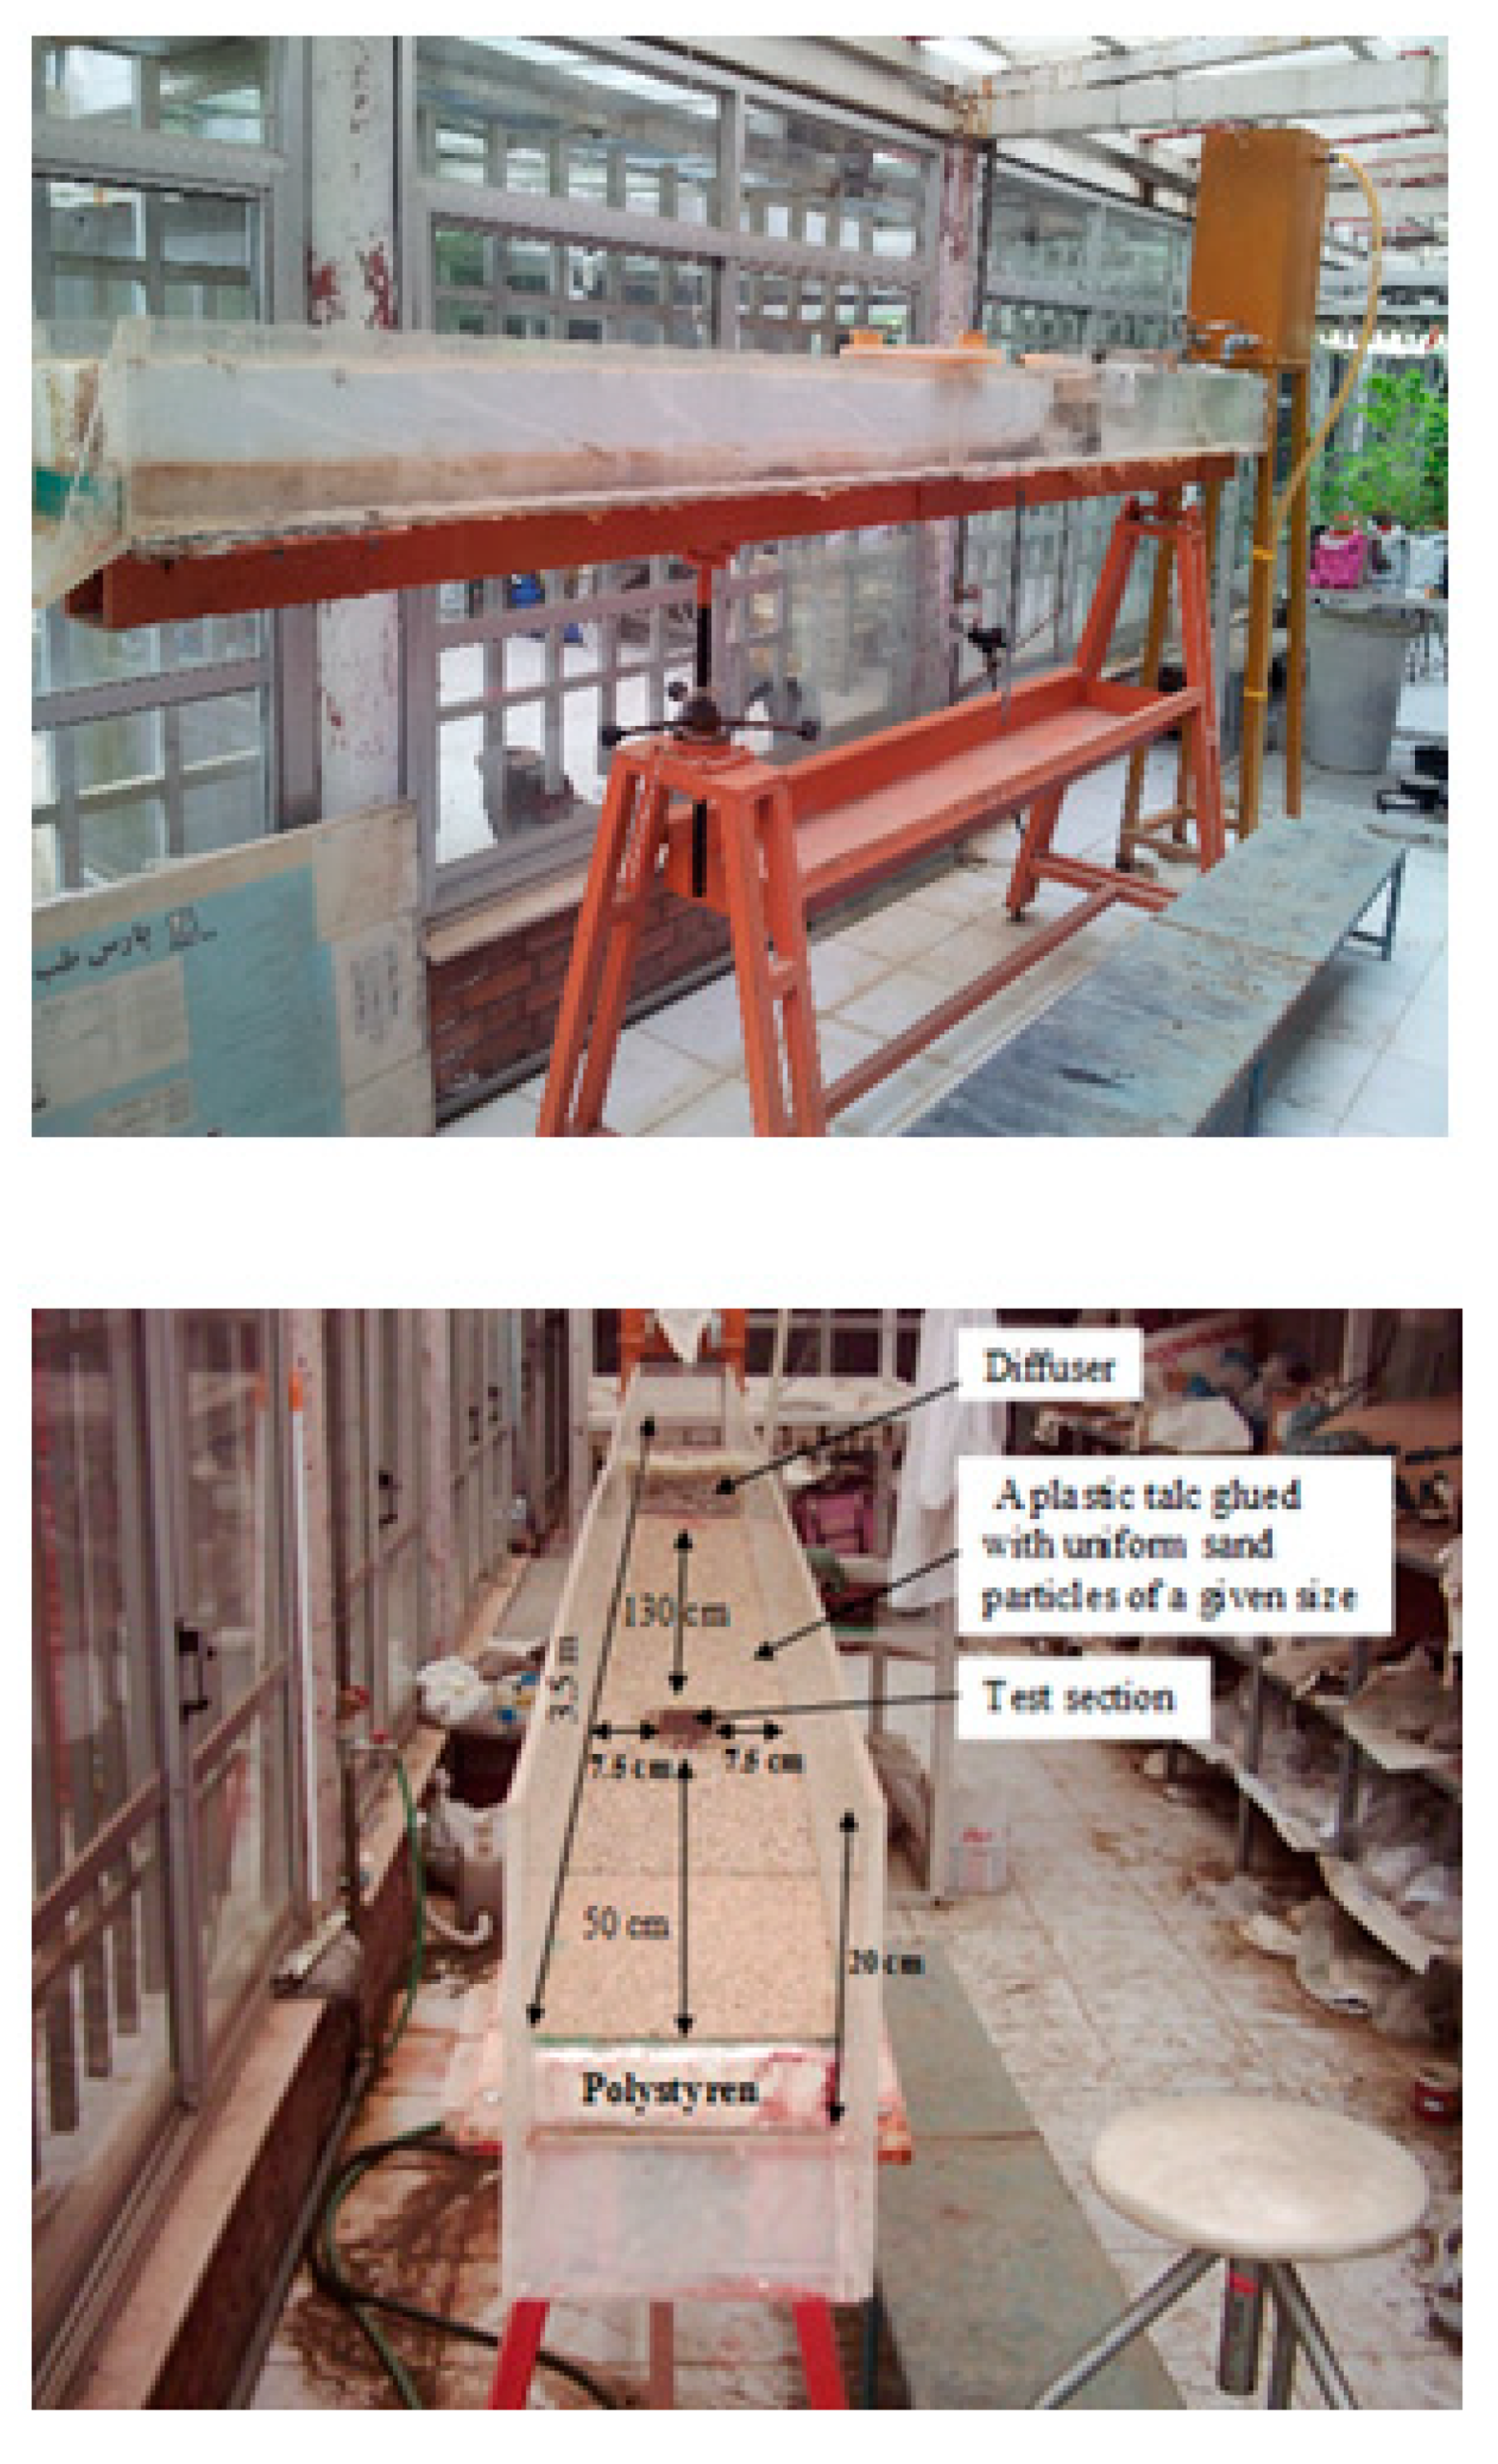
2.3. The Laboratory Flume
To generate rill flows, a laboratory scale flume was used (
Figure 2). Combinations of soil samples of each land use and different values of flow rate and terrain slope were simulated (hereinafter each combination will be indicated as “experiment”).
More detailed information about the experimental flume is reported in Asadi et al. [
45,
46]. To summarize, this flume, with a rectangular cross section, was 3.5-m long and 0.2-m wide. In order to reproduce the natural roughness of the soil, a 5-mm layer was put on the flume bed [
14].
2.4. The Experimental Design
For each experiment, a sample of soil was packed in a steel ring (0.1 m in diameter, 0.05 m in height). The surface of each soil sample, sieved through a 2-mm mesh, was wetted by light spraying. The wetted sample in the steel ring was then placed in a hole (0.1 m in diameter) of the flume bed, located far from the flume outlet [
10], making sure that the sample upper surface was flushed by water flowing over the flume bed surface [
14,
18]. Then, the flume slope and flow rate were adjusted to the desired values. The slope of the flume, set manually, could range between 0 and 38%. Water was poured into the flume from an upstream tap and the flow rate measured at the outlet, as explained in
Section 2.6.
Before starting the experiment, a cover panel was used to prevent soil samples from scouring. Once the water flow started and stabilized, the panel was removed and
Dc was measured together with the hydraulic parameters of the water flow. Each experiment was carried out for no more than five minutes. In order to reduce the influence of uneven detachment within the sample, the time of the experimental test was controlled by the scouring depth (0.02 m) for each soil sample [
14,
18]. The experiment ended when the depth of the eroded soil in the steel ring was 0.015 m. Finally, the wet soil of the sample was oven-dried at 105 °C for 24 h to measure its dry weight.
For each land use, five water flow rates (0.22, 0.33, 0.44, 0.56, and 0.67 L m−1 s−1) and as many slope gradients (3.4%, 8.5%, 17.6%, 26.8%, and 36.4%) were simulated in the flume. Overall, 400 soil samples (4 land uses × 5 water flow rates × 5 slope gradients × 4 replications) were subjected to the experiments.
2.5. Determination of the Rill Detachment Capacity and Erodibility
During each experiment,
Dc [kg s
−1 m
−2] was calculated as the average value of four replicates, using the following equation:
where:
ΔM [kg] = dry weight of detached soil
Δt [s] = experiment duration [s]
A [m2] = area of the soil sample.
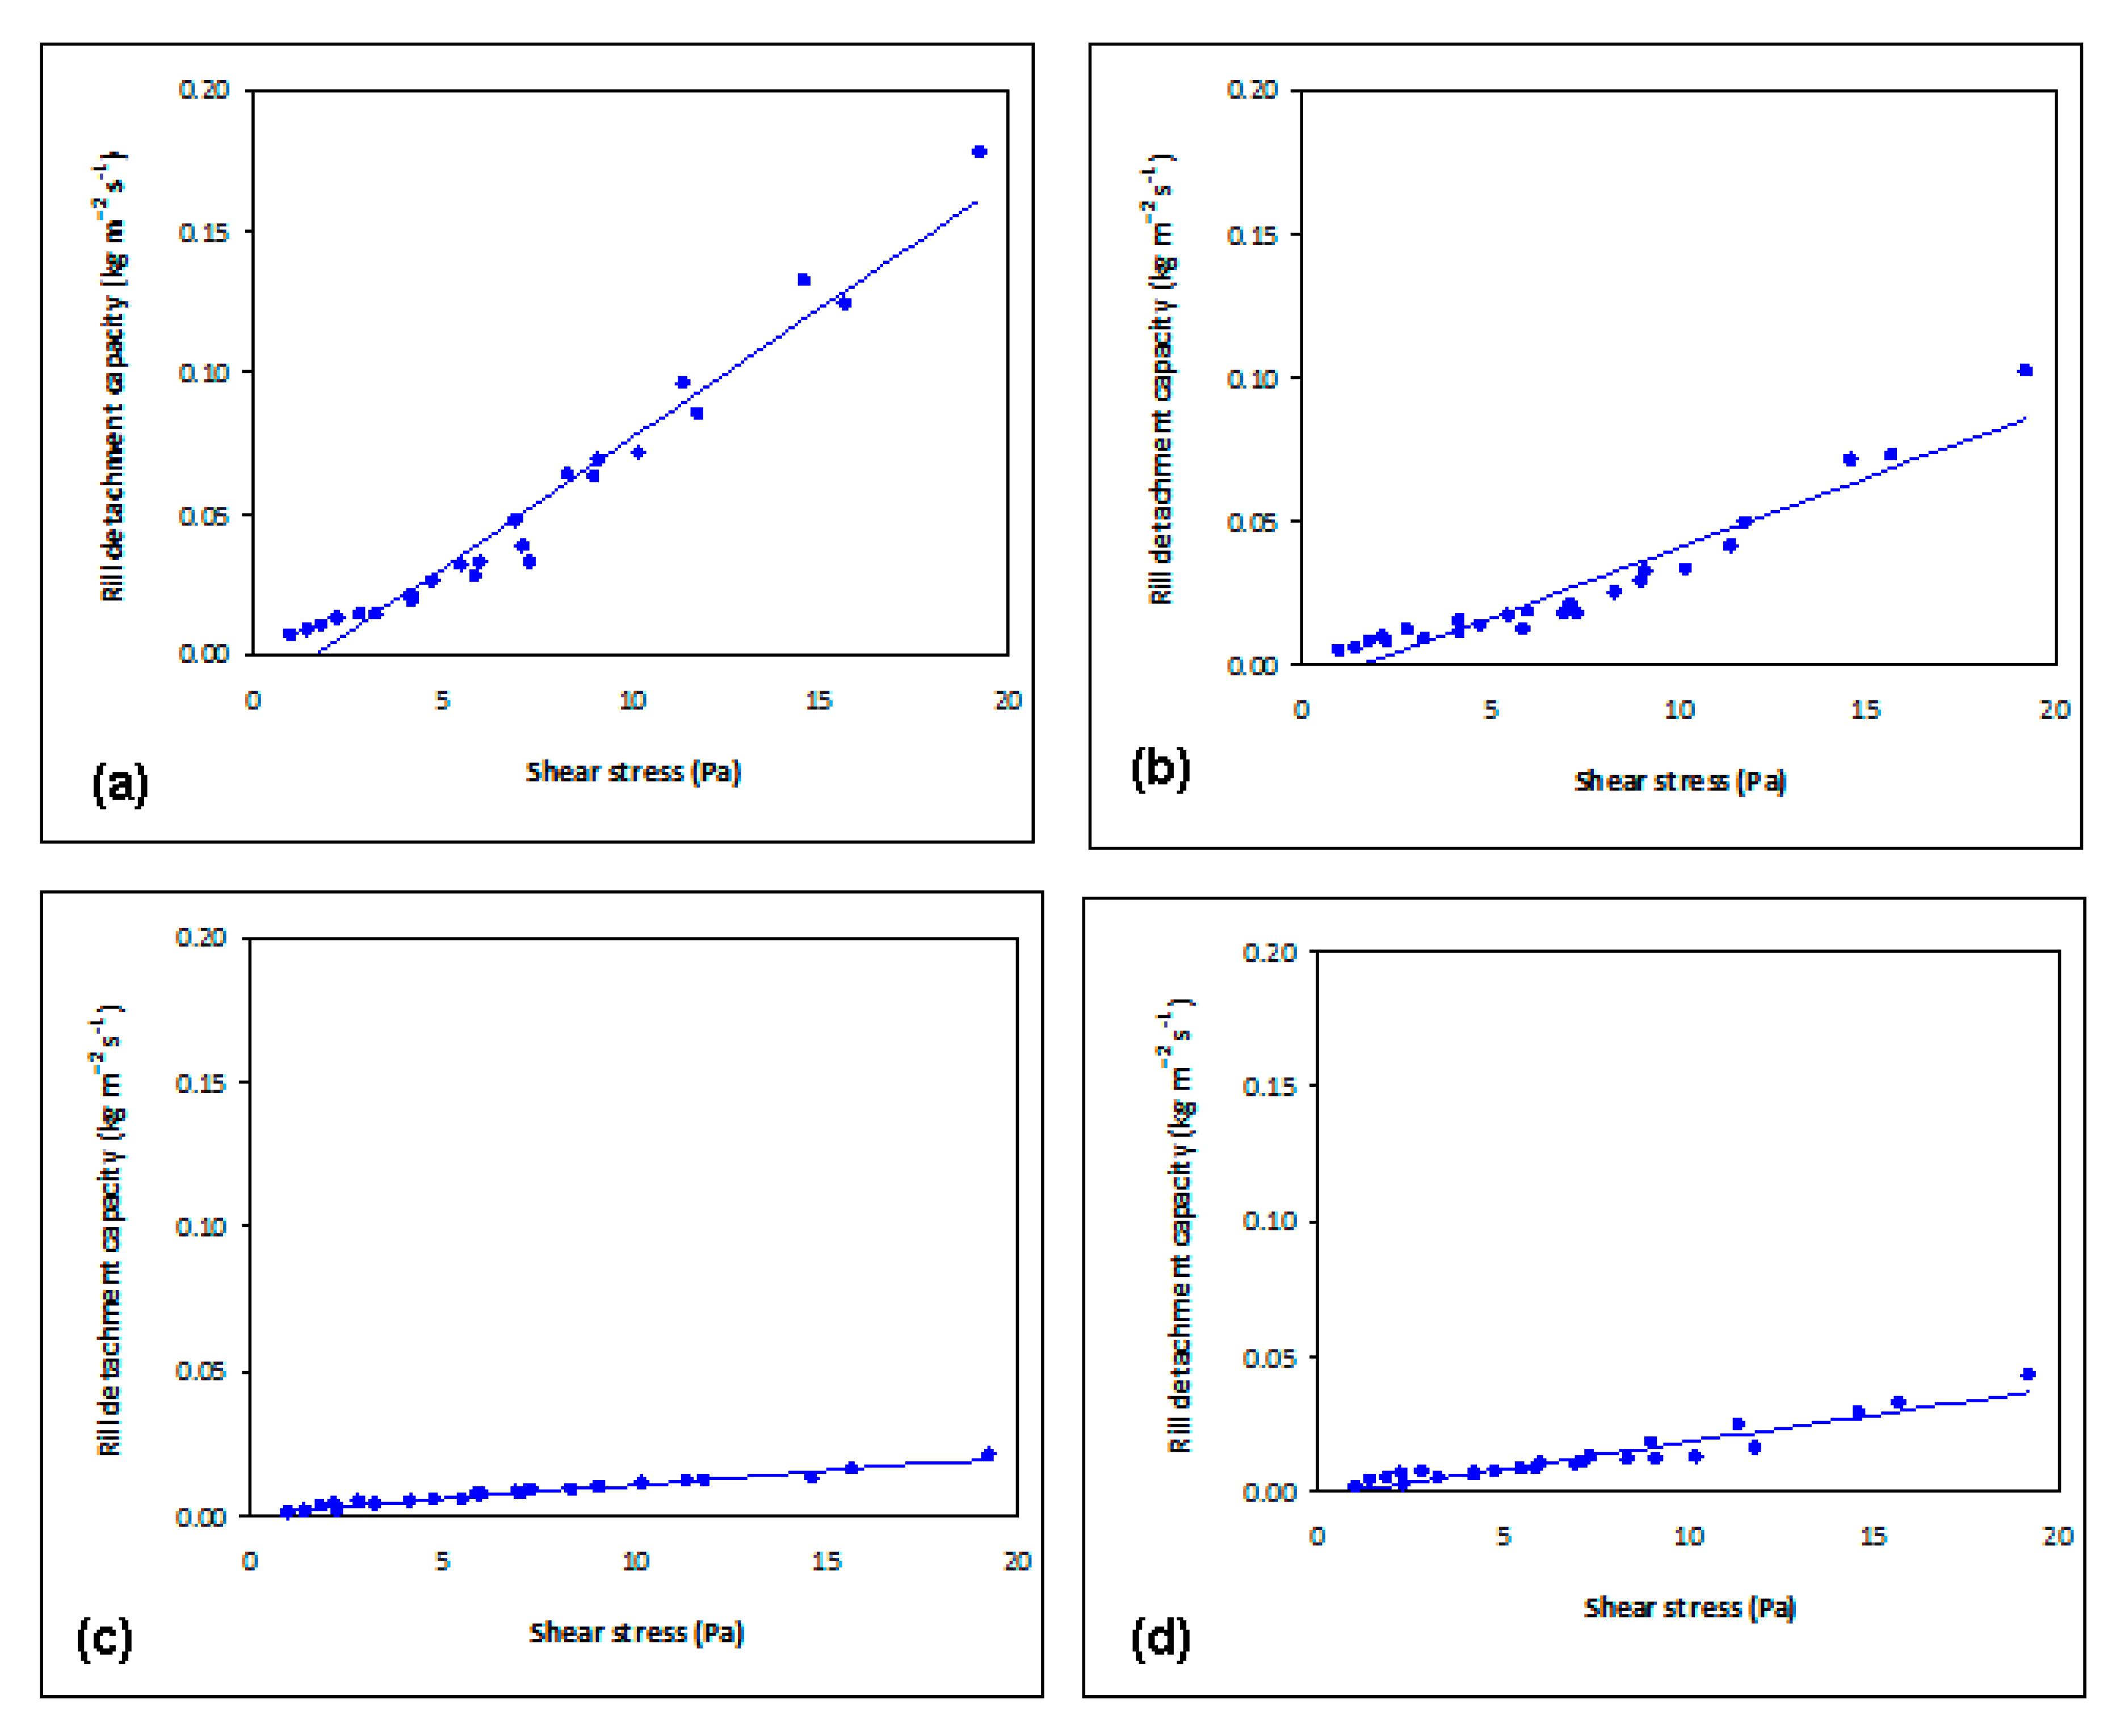
Soil detachment in rills occurs when shear stress of the water flow acting on the soil (
τ) exceeds the critical shear stress (
τc) and the sediment load is lower than sediment transport capacity [
17]. According to the WEPP model formulation, the rill erodibility (
Kr, [s m
−1]) and
τc ([Pa]) were calculated as the slope and intercept of the following regression equation interpolating
Dc and
τ (Nearing et al., 1989):
2.6. Determination of the Hydraulic Parameters
When the flow stabilized into the flume, the water depth was measured in two cross sections (placed 0.4 m and 1 m upstream of the flume outlet, respectively), using a level-probe with an accuracy of 1 mm. For each cross section, three points were considered for these measurements, of which one in the center of the flume and two others at 0.01 m from each side of the flume. Based on these six measurements, the average value of the flow depth was calculated for each experiment.
In accordance with the equations developed from several authors [
47] for streams, rivers, and open channels, a rectangular cross section was assumed for the rills and its hydraulic radius (
R, [m]) was calculated as follows:
where
h (equal to 0.2 m in this study) and
p [m] are the flow width and depth, respectively.
The flow rate per unit width (
q, [L m
−1 s
−1]) was measured five times per experiment, collecting the water into a graduated plastic cylinder. The flow velocity (
v, [m s
−1]) m was estimated using a fluorescent dye technique in ten replicated measurements. The water temperature (
T, [°C]) was also recorded in order to calculate its viscosity. Based on these data, the Reynolds number (
Re, [–]) was calculated. Furthermore, the mean water flow velocity (
V, [m s
−1]) was determined reducing the water velocity by 0.6, 0.7, or 0.8, when the flow was laminar, transitional or turbulent, respectively [
48].
The shear stress
τ [Pa]) [
9], stream power (
ω, [kg s
−3]) [
49], unit stream power (
ϕ, [m s
−1]) [
23] and unit energy (
E, [m]) [
15] were calculated using the following equations:
where:
ρ = water density [kg m−3]
g = gravity acceleration [m s−2]
S = slope gradient [m m−1]
α = kinetic energy correction (in this case assumed as one)
θ = slope gradient [°] of the flume.
Table 1 reports the values of the hydraulic parameters calculated for the different land uses, slopes, and flow rates.
2.7. Statistical Analysis
Hypothesizing that the samples were independent and the distribution was normal, the t-test was used to assess the statistical significance of the soil properties among the land uses (at p level lower than 0.05). The normal distribution hypothesis was checked using QQ-plots.
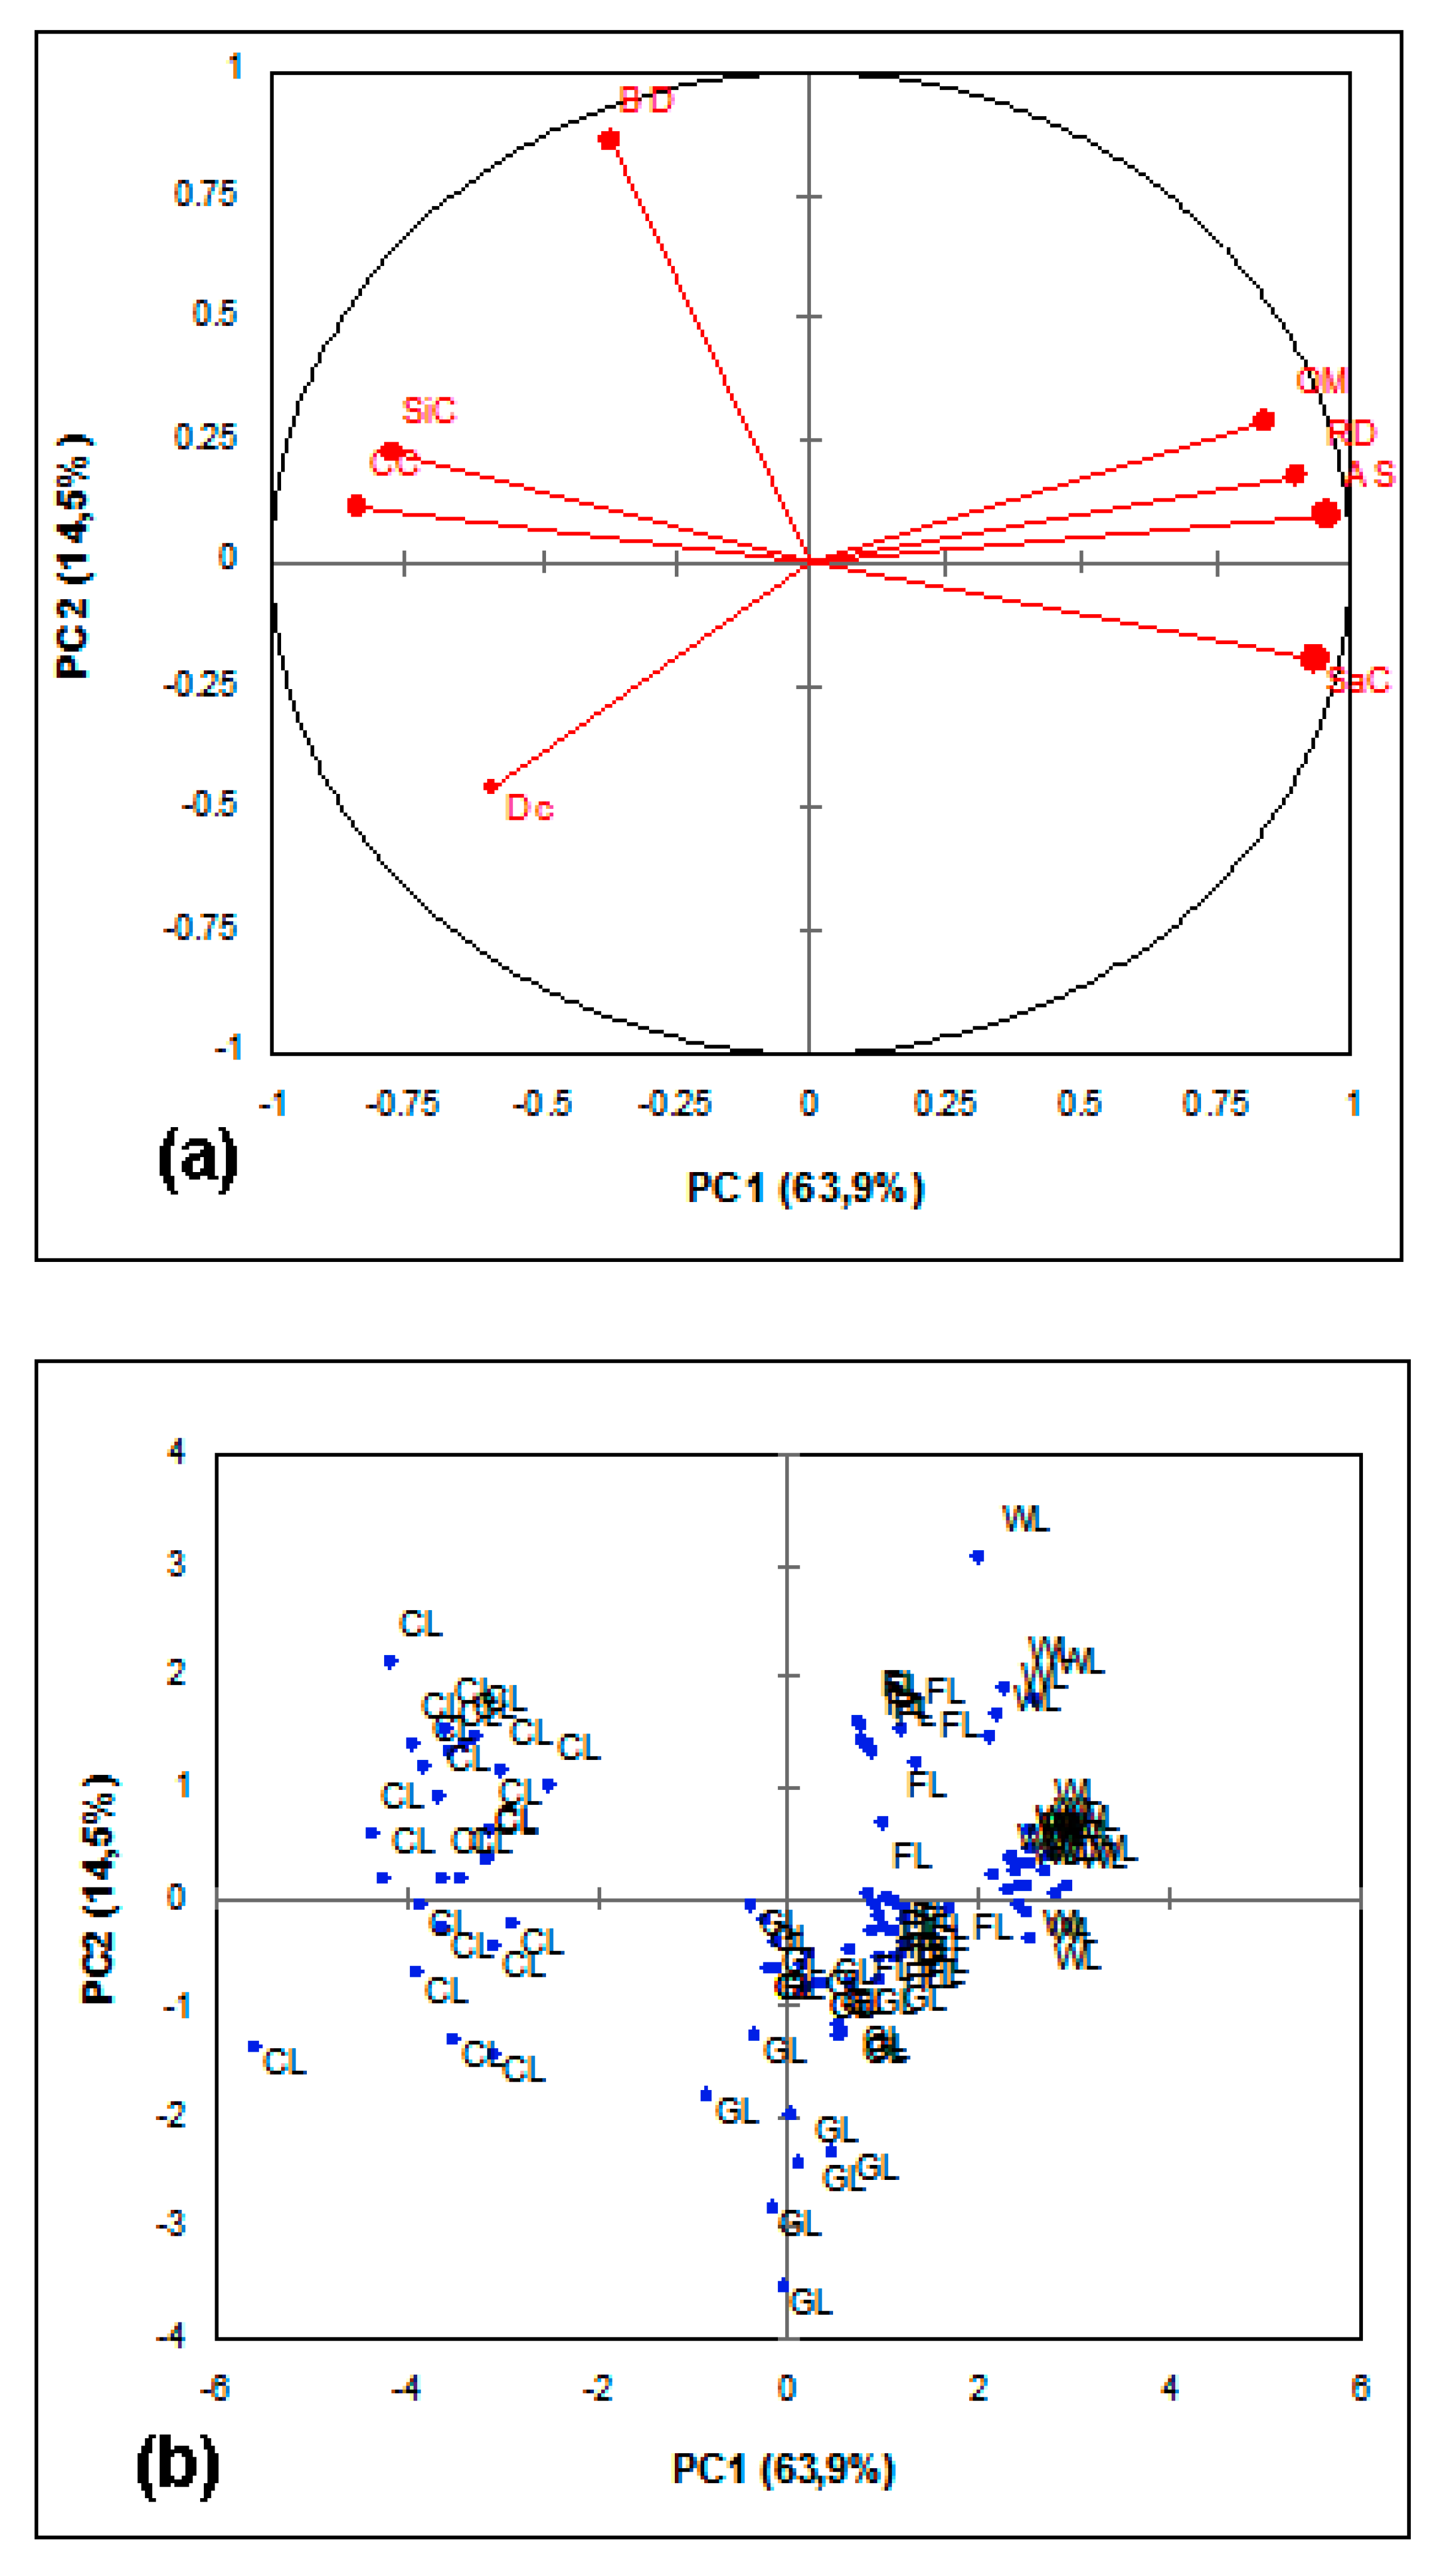
Then, a Principal Component Analysis (PCA) was applied to the soil parameters, in order to find correlations (using Pearson’s method), [
50] among the soil properties, to identify the existence of meaningful derivative variables (the Principal Components, PCs) and to group soil samples according to the investigated land uses.
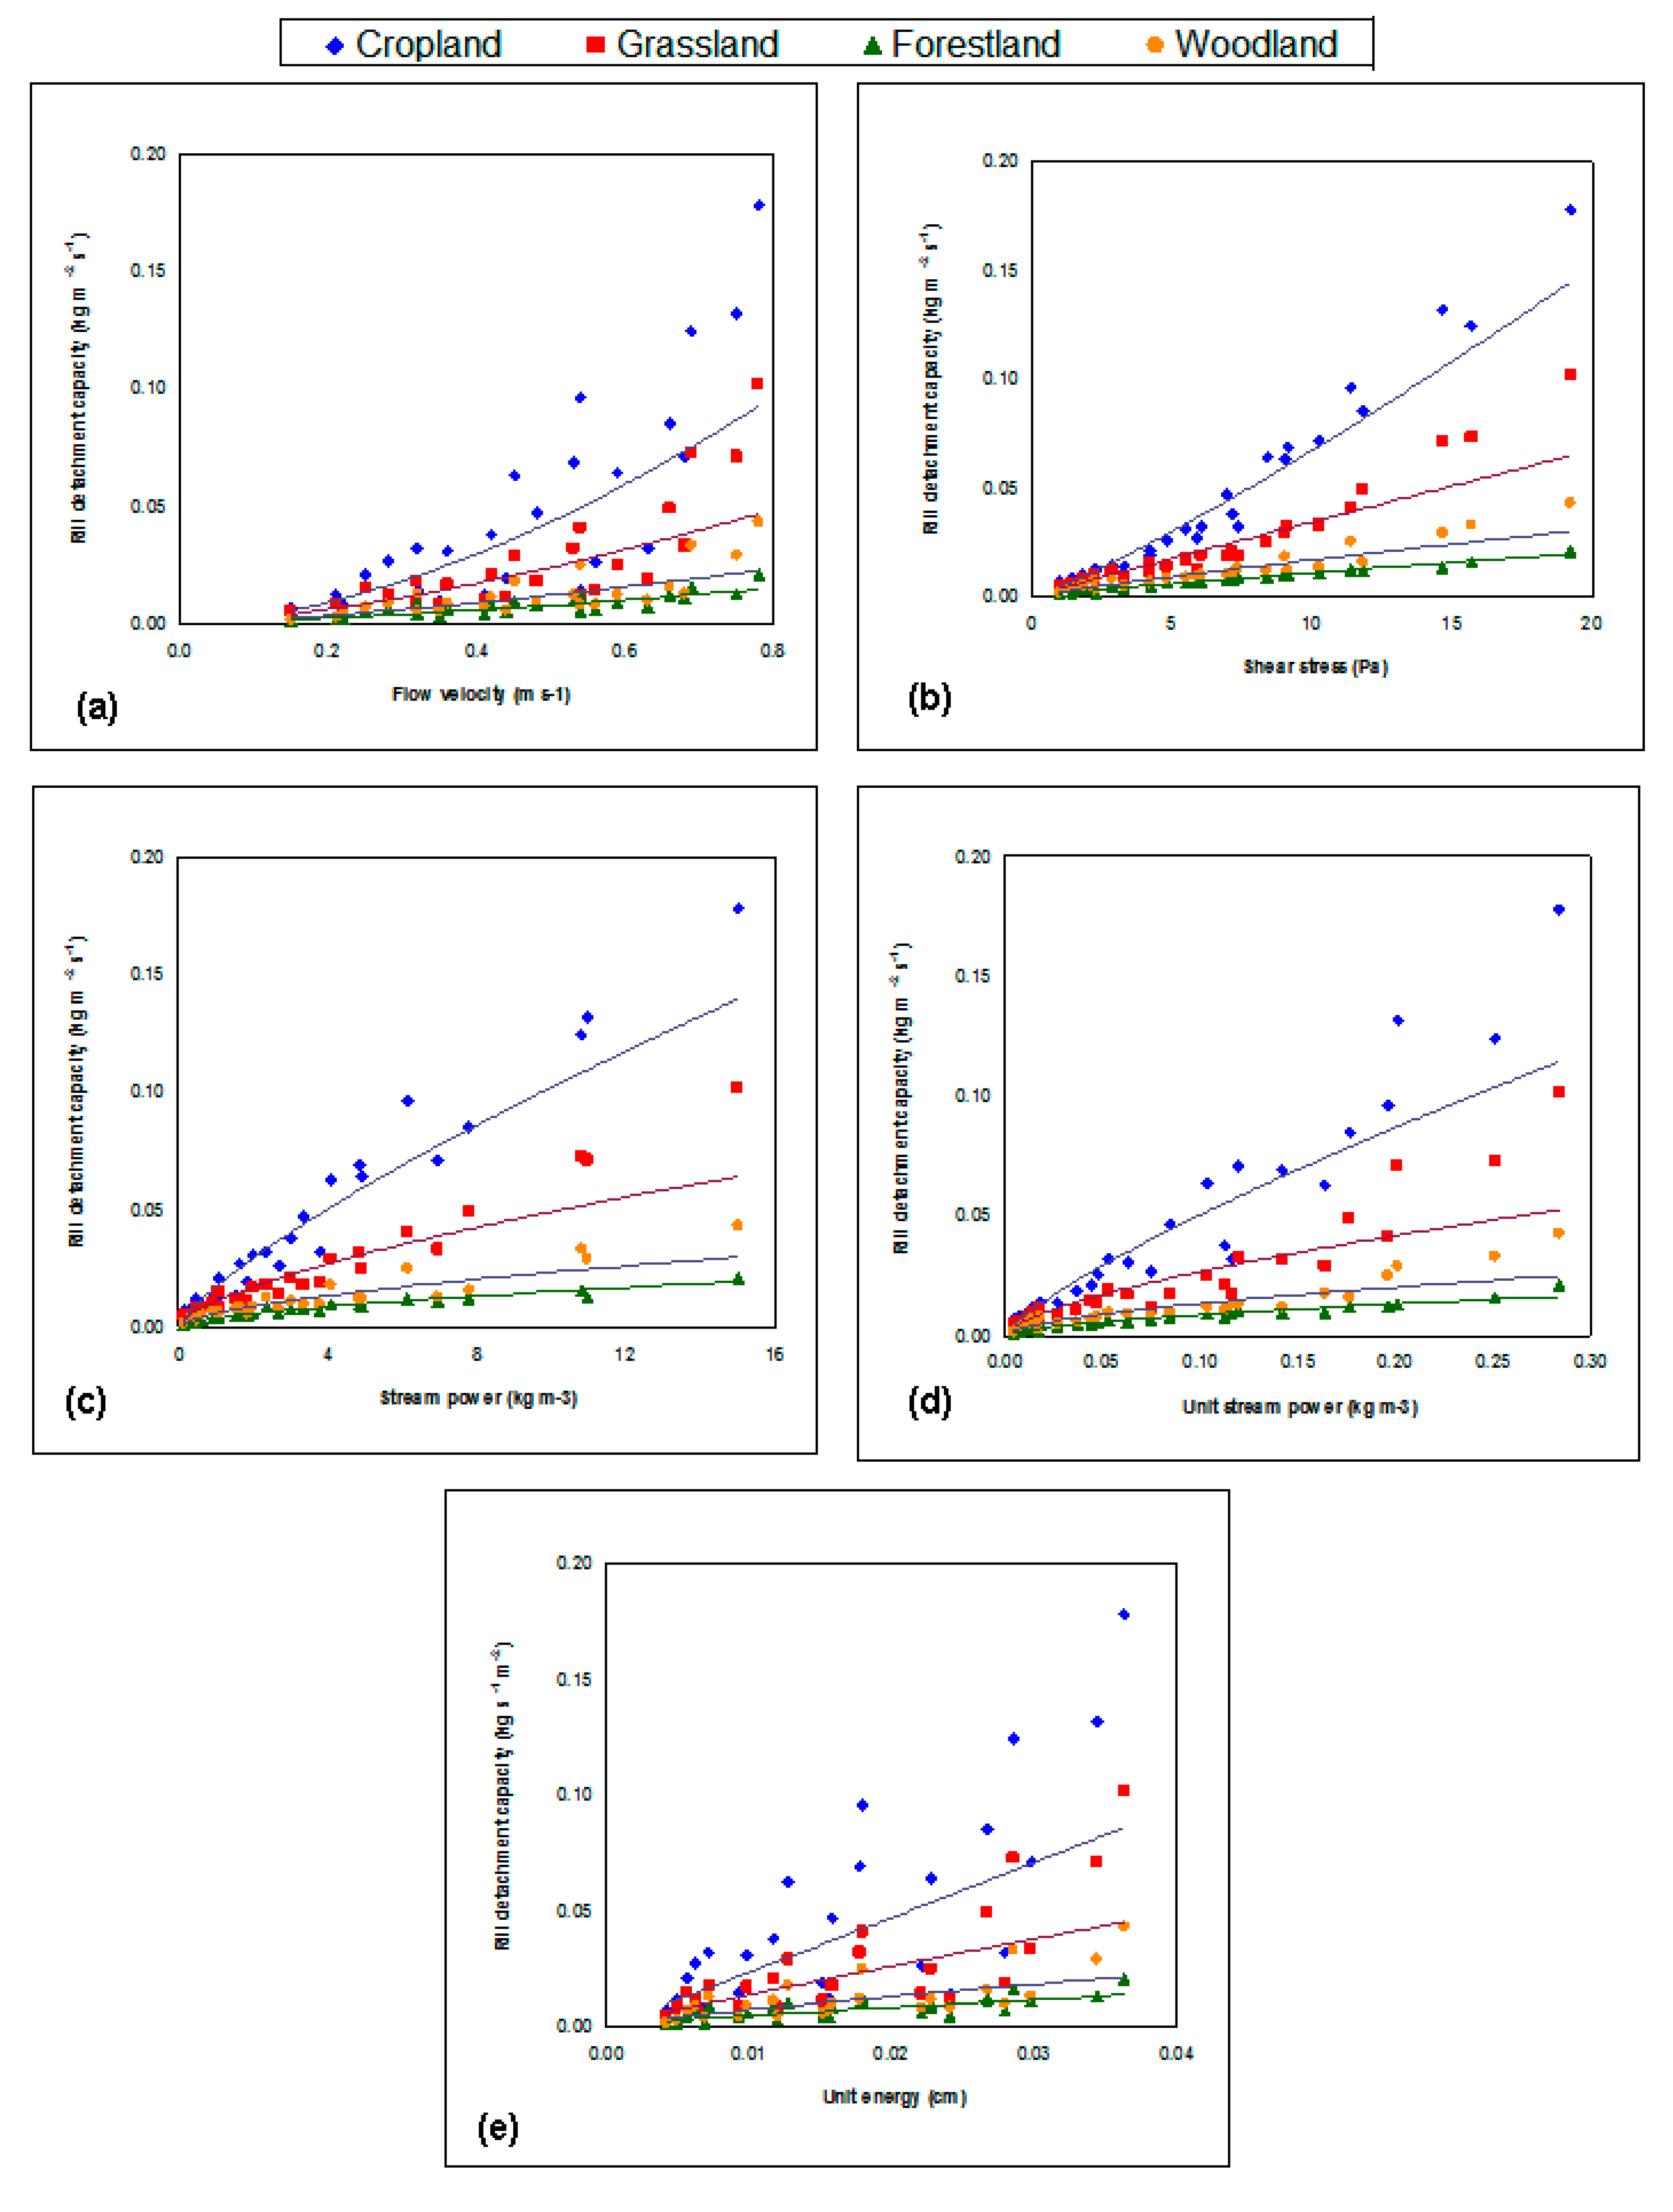
The relationships between
Dc (considered as the dependent variable) and the hydraulic parameters (i.e.,
V,
τ,
ω,
ϕ and
E, assumed as independent variables) were analyzed by a non-linear regression method based on power functions, according to the literature e.g., reference [
25]. The accuracy of the regression equations was evaluated using quantitative indexes, as the relative error (RE), the coefficient of determination (
r2) and the coefficient of efficiency (NSE) [
51]. The optimal values of these indexes are one for
r2 and
E as well as zero for RE, while the acceptance limits of
r2 and NSE are 0.50 and 0.35, respectively. The prediction capacity of a model is considered to be good when
r2 and E are higher than 0.75 [
52,
53,
54].
All statistical analyses were carried out using the software XLSTAT 9.0, Addinsoft, Paris, France, SPSS 22.0, IBM, New York, USA, Statgraphics® Plus 6.0, Statgraphics Technologies, Inc., Virginia, USA, and JMP® 7.0, SAS Institute, Milan, Italy.
5. Conclusions
Few studies have explained the quantitative relations among the soil detachment capacity due to overland flow and the properties of forest soils. Moreover, the methods for its estimation from hydraulic parameters are quite scarce in forestland and in woodland. This study has quantified the rill detachment capacity and proposed prediction equations of this parameter for woodland, forestland, grassland, and cropland. It has been demonstrated how and to what extent the rill detachment capacity is affected by the different land uses in the case study of Saravan watershed in Northern Iran. Although the textural characteristics of the investigated soils were quite similar among the four studied land uses, the hydraulic parameters and the physico-chemical properties were significantly different. The mean rill detachment capacity of soils was lower in woodland and forestland than in cropland and grassland. This outcome confirms the working hypothesis that the more developed vegetation cover and structure of woodland and forestland are able to reduce the rill detachment capacity, compared to other land uses. Rill detachment was positively correlated with clay and silt contents and negatively correlated with sand content, aggregate stability, organic matter, and root density, while no statistically significant correlations were found with bulk density.
For all land uses, a power function was used to estimate the rill detachment capacity from the hydraulic parameters and a generally good accuracy (in particular for woodland and forestland) was achieved for the proposed equations. The best predictor of rill detachment capacity was the stream power for cropland, grassland, and woodland, and the unit stream power for forestland. The use of flow velocity and unit energy should be avoided when estimating the rill detachment capacity. The rill erodibility and critical shear stress, which were the lowest in forestland and woodland out of all of the investigated land uses, were predicted with good accuracy along with the slope and intercept of linear regressions between the rill detachment capacity and shear stress.
Overall, the case study of the Saravan watershed has provided a contribution in understanding the linkages between the rill detachment capacity on one side, and the soil properties and hydraulic parameters on the other side under different land uses. It has been finally demonstrated that forestland and woodland can be suitable land uses (mainly in soils with prevalent clayey and silty content) when the soil conservation purposes are achieved by land planners and watershed managers. Therefore, afforestation in the croplands should be prioritized when possible, in order to reverse or mitigate possible erosion-degradation.


 ,
, 


