Article

Warming Effects on Topsoil Organic Carbon and C:N:P Stoichiometry in a Subtropical Forested Landscape

State Key Laboratory for Conservation and Utilization of Subtropical Agro-Bioresources (South China Agricultural University), Guangdong Key Laboratory for Innovative Development and Utilization of Forest Plant Germplasm, College of Forestry and Landscape Architecture, South China Agricultural University, Guangzhou 510642, China
*
Author to whom correspondence should be addressed.
Forests 2020, 11(1), 66; https://doi.org/10.3390/f11010066
Submission received: 5 November 2019 / Revised: 24 December 2019 / Accepted: 4 January 2020 / Published: 6 January 2020
(This article belongs to the Special Issue Forest Carbon Dynamics under Changing Climate and Disturbance Regimes)

Abstract

:
Warming effects on agricultural and forest ecosystems have been well documented at broad spatiotemporal scales but less so at stand and landscape scales. To detect the changes in soil organic carbon (SOC) and carbon:nitogen:phosphorus (C:N:P) stoichiometry in response to a short-range warming gradient, we defined an inverse elevation-dependent warming gradient and developed a novel index of warming based on a common environmental lapse rate. We associated the warming gradient and warming index with the changes in SOC and C:N:P stoichiometry and tested the independence of warming effects using partial correlation analysis. SOC content and C:N:P stoichiometric ratios significantly decreased with warming, and the effect of warming on C:N:P stoichiometric ratios were stronger than on SOC content. The relationships of SOC content and C:N:P stoichiometric ratios with warming did not change after controlling for two other energy-related variables, i.e., transmitted total radiation and potential direct incident radiation. However, the strength in the relationships of C:N:P stoichiometric ratios with vegetation-related variables significantly decreased after the warming index was controlled for. As indicated by the random forest regression model, the warming index was the most important variable for predicting SOC variability and the second most important for predicting total N variability, while vegetation-related variables were the most important for predicting C:N:P stoichiometric ratios. Our results showed that warming was responsible for the decrease in SOC content and C:N:P stoichiometric ratios and the warming index was the most important variable for predicting SOC variability. Although the most important variables for C:N:P stoichiometric ratios were related to vegetation, the relationships between C:N:P stoichiometric ratios and vegetation-related variables were significantly affected by warming. These findings demonstrate that warming is the major driver of SOC variability and the decrease in SOC content, as well as of C:N:P stoichiometry, even along a short-range warming gradient.

1. Introduction

Climate warming has had profound impacts on terrestrial ecosystems and all aspects of human society. According to the Intergovernmental Panel on Climate Change (IPCC) Fifth Assessment Report (AR5), the current global warming has reached 1.0 °C and is projected to increase by 1 °C to 3.5 °C by the end of the 21st century relative to the pre-industrial level [1], resulting in rising sea levels, diminishing Arctic sea ice, changes in plant phenology, and more extreme weather events [2,3]. Given the profound and extensive impacts of warming, the latest IPCC special report on global warming of 1.5 °C has set a new goal to limit global warming to 1.5 °C rather than a previous goal of 2 °C above the pre-industrial levels [4]. As stated in the report, limiting warming to 1.5 °C rather than 2 °C, a mere half of a degree difference, would have significant global and regional climate impacts on ecosystems and human society [5,6,7], and will make it easier to achieve the United Nations sustainable development goals.
Major effects of warming on forest ecosystems involve various limitations as well as enhancements of forest growth, production, and carbon (C) and nitrogen (N) dynamics of both biomass and soil C pool components [3,8,9,10], thus adding to the uncertainty about the effects of global warming and the occurrence of extreme climate events. This uncertainty is especially concerning for soil C pools, because soils contain the largest C pools in the terrestrial ecosystem and have the potential to counterbalance the greenhouse effects [11]. In tropical forests, warming leads to the loss of biodiversity and even the death of some non-pioneer tree species [12,13]. Warming increases soil CO2 emissions by increasing soil microbial respiration and will therefore lower soil organic carbon (SOC) stocks and change soil carbon:nitogen:phosphorus (C:N:P) stoichiometric patterns [14,15]. Predicting the effects of warming on SOC dynamics in the forest ecosystems will facilitate forest management and conservation and will help the forest sector adapt to climate change. At a small scale, however, warming effects on SOC will be altered by various biotic and abiotic factors, such as forest types, canopy structure, species composition, gap light regimes, and topography.
Studies on the effects of elevational gradient on SOC pools have provided insights into how changes in micro-climate affect SOC [16,17,18]. However, most studies used an ascending elevational gradient and failed to relate the elevational effects to warming immediately. According to an environmental temperature lapse rate, temperature decreases with elevation and thus a lower elevation in a mountain landscape has a higher temperature. If an inverse elevational gradient is conceptualized as a temporal scale of warming based on a space-for-time substitution, then the effects of climate warming on SOC and C:N:P stoichiometric ratios can be predicted in a sloping, forested landscape.
A growing number of studies have revealed the patterns and underlying mechanisms of changes in SOC and C:N:P stoichiometry across major elevational gradients [16,19,20,21]. However, for a minor elevational change, warming effects on SOC and C:N:P stoichiometry have been understudied. Conventional studies related to elevational gradient commonly focused on a wide range of elevations so as to fully reveal the responses of the ecological series. The effects resulted from a small change in temperature due to short-range elevational change may also be compensated or substituted by the interactions of biotic and abiotic site factors, such as soil physicochemical properties and changes in land cover [16,19]. According to the common environmental lapse rate of 0.65 °C/100 m [22], a 1000-m change in elevation corresponds to a 6.5 °C difference in temperature. If the elevational difference is ≥2000 m, the difference in temperature can be 13 °C or greater, which substantially exceeds the future warming scenario [1]. Therefore, to predict and test warming effects on SOC and C:N:P stoichiometry in a forest ecosystem under the global warming scenario, selecting a forested landscape with a short range of elevational difference as sample plots would be viable and practical.
Here, we used a warming gradient from a higher-to-lower elevation change in a forest census plot. We defined this inverse elevation-dependent warming gradient and developed a novel index of warming based on a common environmental lapse rate of 0.65 °C/100 m [22]. We associated the warming gradient and warming index with the changes in SOC and in C:N:P stoichiometry, and tested the independence of the warming effects against various biotic and abiotic factors using partial correlation analysis. We aimed to answer the following questions: (1) Is SOC sensitive to small changes of temperature that are due to short-range elevational difference? (2) Are the relationships of SOC and C:N:P stoichiometric ratios to the biotic and abiotic habitat factors affected by warming? (3) Relative to other biotic and abiotic factors, how important is warming for predicting SOC and C:N:P stoichiometric dynamics?

2. Materials and Methods

2.1. Study Site

Our study was carried out in a natural forested landscape in the Kanghe Nature Reserve (23°44′37″~23°52′16″ N, 115°04′27″~115°09′41″ E). This area is alongside the Dongjiang River in the eastern part of South China′s Guangdong province and has a humid subtropical monsoon climate. The mean annual temperature ranges from 20.3 °C to 21.1 °C and the mean annual precipitation is 2142 mm [23,24]. Soils are clay loamy latosols developed from granite. The area has vegetation typical of a subtropical forest, with the canopy layer dominated by the evergreen broadleaved tree species Castanopsis carlesii (Hemsl.) Hayata, Schima superba Gardner & Champ., Castanopsis fargesii Franch., and Itea chinensis Hook. & Arn. [23].

2.2. Sampling Design and Plant Census

We set up an 8-ha permanent plot on a forested slope in the nature reserve by means of surveying with a total station (Nikon DTM-310, Nikon Geotecs Co. Ltd., Tokyo, Japan). The plot was rectangular with two horizontal dimensions of 200 m × 400 m in length and width, and was divided into 200 square subplots (400 m2 per subplot), each of which contained four 10 × 10 m quadrats for the collection of field data. We used polyvinyl chloride (PVC) tubes as markers for the grid-square system at both 20-m corners and 10-m corners. Elevation at each 20-m corner was recorded by the total station during surveying and was used to calculate topography. The elevation of each subplot was calculated by averaging the elevation values at its four corners [25], while slope and aspect were calculated according to the methods described by Condit [26].
In each subplot, we tallied all trees ≥5 cm diameter at breast height (DBH) to represent the species composition of the canopy layer. Understory plant census was carried out in five 2 × 2 m sub-quadrats within a subplot, one at each center point of the four quadrats and one at the center of the subplot. Understory vegetation data from sub-quadrats were then pooled to represent the understory species composition by subplots.

2.3. Soil Sampling and Laboratory Determination

Five subsamples of mineral soils to a depth of 25 cm were collected within a subplot and were evenly mixed to yield a homogenized composite sample. The localities for collecting soil subsamples were the sub-quadrats as described for the understory plant census. Soil samples were air-dried, thoroughly ground, and passed through a 2-mm mesh sieve for the determination of total soil organic carbon (SOC), total nitrogen (TN), and total phosphorus (TP). SOC and TN contents were measured by ignition using a vario-Max N/CN elemental analyzer (Elementar Analysensysteme GmbH, Germany), and TP content was determined colorimetrically by the ammonium molybdate method [27]. C:N:P stoichiometric ratios were calculated as the ratios of SOC to TN (C:N), SOC to TP (C:P), and TN to TP (N:P).

2.4. Understory Radiation Measurements

We used hemispherical photography to measure understory radiation. Within each subplot and at the same localities as for understory plant census, we took five hemispherical photographs using a Nikon CoolPix 4500 digital camera with a Nikkor FC-E8 fisheye converter (Nikon Corporation, Tokyo, Japan). The camera was mounted on a tripod 1.65 m above the ground under the forest canopy, pointing upwards to the sky. A total of 1000 hemispherical photographs were analyzed with gap light analyzer (GLA) software version 2.0 (Simon Fraser University, Burnaby, BC, Canada, and the Institute of Ecosystem Studies, Millbrook, NY, USA) [28]. The results of image analysis included a series of canopy structure and understory radiation parameters, from which the transmitted total radiation (TransTot, MJ m−2 d−1) was used in this study. Values of TransTot from the five hemispherical photographs within a subplot were averaged to account for the gap light regime of the subplot.

2.5. Potential Direct Incident Radiation

We calculated potential direct incident radiation (PDIR, MJ m−2 d−1) using the nonparametric multiplicative regression (NPMR) method as described by McCune [29]. Using the topographic parameters as predictor variables and the model files provided by McCune (http://people.oregonstate.edu/~mccuneb/radiation.htm), we generated predictions of PDIR for every subplot with the software HyperNiche: Nonparametric multiplicative habitat modeling, version 2.28 (MjM Software, Gleneden Beach, OR, USA).

2.6. Warming Gradient and Warming Index

We defined a warming gradient as an inverse elevational gradient. As the elevation difference in the study plot was approximately 150 m, a three-level warming gradient was established, each approximately corresponding to a 0.33 °C temperature difference based on the common lapse rate of 0.65 °C/100 m [22]. To facilitate further analysis, we developed a novel index of warming as a quantitative proxy variable for an inverse elevation-dependent warming gradient. The warming index is expressed as follows:
Warming index = (Elevmax − Elevsubplot) m/100 m
where Elevmax is the elevation of the highest subplot, while Elevsubplot is the elevation of a particular subplot including the highest one, such that the elevational difference of the highest subplot equals zero. A higher warming index corresponds to a lower elevation position. For example, a warming index of 1.0 corresponds to 0.65 °C warming above the temperature level at the highest elevation of a landscape, while an inverse elevational difference of 10 m yields a warming index of 0.1 and corresponds to 0.065 °C warming when a lapse rate of 0.65 °C/100 m [22] is applied.

2.7. Statistical Analyses

Descriptive statistics, including means, maxima, minima, standard deviations, and coefficients of variation, were used to account for the spatial heterogeneity in SOC, TN, TP, and C:N:P stoichiometric ratios across subplots. We constructed subplot-by-species datasets for the understory vegetation and the canopy tree layer. These datasets were subjected to statistical analyses to calculate vegetation-related metrics. We calculated understory plant species richness (Sunder), total abundance (Nunder), and the Shannon–Wiener diversity index (H’under). We performed principal component analysis (PCA) to extract the principal components of the first two axes on both the understory plant dataset (Axis1under, Axis2under) and the canopy layer tree dataset (Axis1tree, Axis2tree). These principal components or ordination axis scores are surrogates for species composition [30]. All of the vegetation-related metrics were used as predictor variables in further analyses.
To assess whether warming had significant effects on SOC, TN, and TP contents and C:N:P stoichiometric ratios, we performed Kruskal-Wallis tests to test for significance of variations in SOC, TN, and TP contents as well as C:N:P stoichiometric ratios across an inverse elevation-dependent warming gradient. Kruskal–Wallis test is a nonparametric alternative to one-way analysis of variance (ANOVA) and is appropriate for comparing three or more independent samples of field survey data [24,31]. We also evaluated the correlation coefficients in the relationships between the warming index and SOC, TN, TP, and C:N:P stoichiometric ratios. To determine whether these relationships were independent of other energy-related factors and to avoid possible spurious correlation, we performed partial correlation analysis using PDIR and TransTot as control variables. To evaluate the effects of warming on the relationships of SOC, TN, TP, and C:N:P stoichiometric ratios with PDIR, TransTot, and vegetation-related variables, we performed a series of Pearson correlation analyses, as well as partial correlations analyses after controlling for the warming index. The corresponding coefficients from both correlation and partial correlation analyses were tested for significant difference using a difference test. Prior to the correlation and partial correlation analyses, all the variables were tested for normality using Kolmogorov–Smirnov tests. Variables that did not satisfy the normality assumptions, including SOC, TN, TP, Nunder, Sunder, and H’under, were log10-transformed to improve normality.
We used the random forest regression model to evaluate the relative importance of a series of variables for predicting SOC, TN, TP, and C:N:P stoichiometric ratios. Random forest is a type of data mining method that can handle multiple quantitative and qualitative variables in one analysis, and it does not require assumptions [32,33]. Thus, we used 10 variables as predictor variables in the random forest analysis, including PDIR, TransTot, the warming index, Nunder, Sunder, H’under, Axis1under, Axis2under, Axis1tree, and Axis2tree.
Calculation of vegetation-related metrics and principal component analysis to extract axis scores were performed using PC-ORD: Multivariate analysis of ecological data, version 7 (MjM Software, Gleneden Beach, OR, USA). Descriptive statistics, Kruskal–Wallis tests, normality tests, correlation and partial correlation analyses, difference tests, and the random forest regression model analysis were carried out using Statistica version 8 (Statsoft, Inc. Tulsa, OK, USA).

3. Results

3.1. Spatial Variability

We found medium spatial variability in the contents of topsoil organic carbon (SOC), total nitrogen (TN), total phosphorus (TP), and the C:N:P stoichiometric ratios across the sampling plots (Table 1). The coefficient of variation (CV) was higher for SOC than for TP or TN. As for the C:N:P stoichiometric ratios, the highest CV was found for the C:P ratio due to the highest standard deviation for SOC content and the lowest mean value of TP (Table 1).

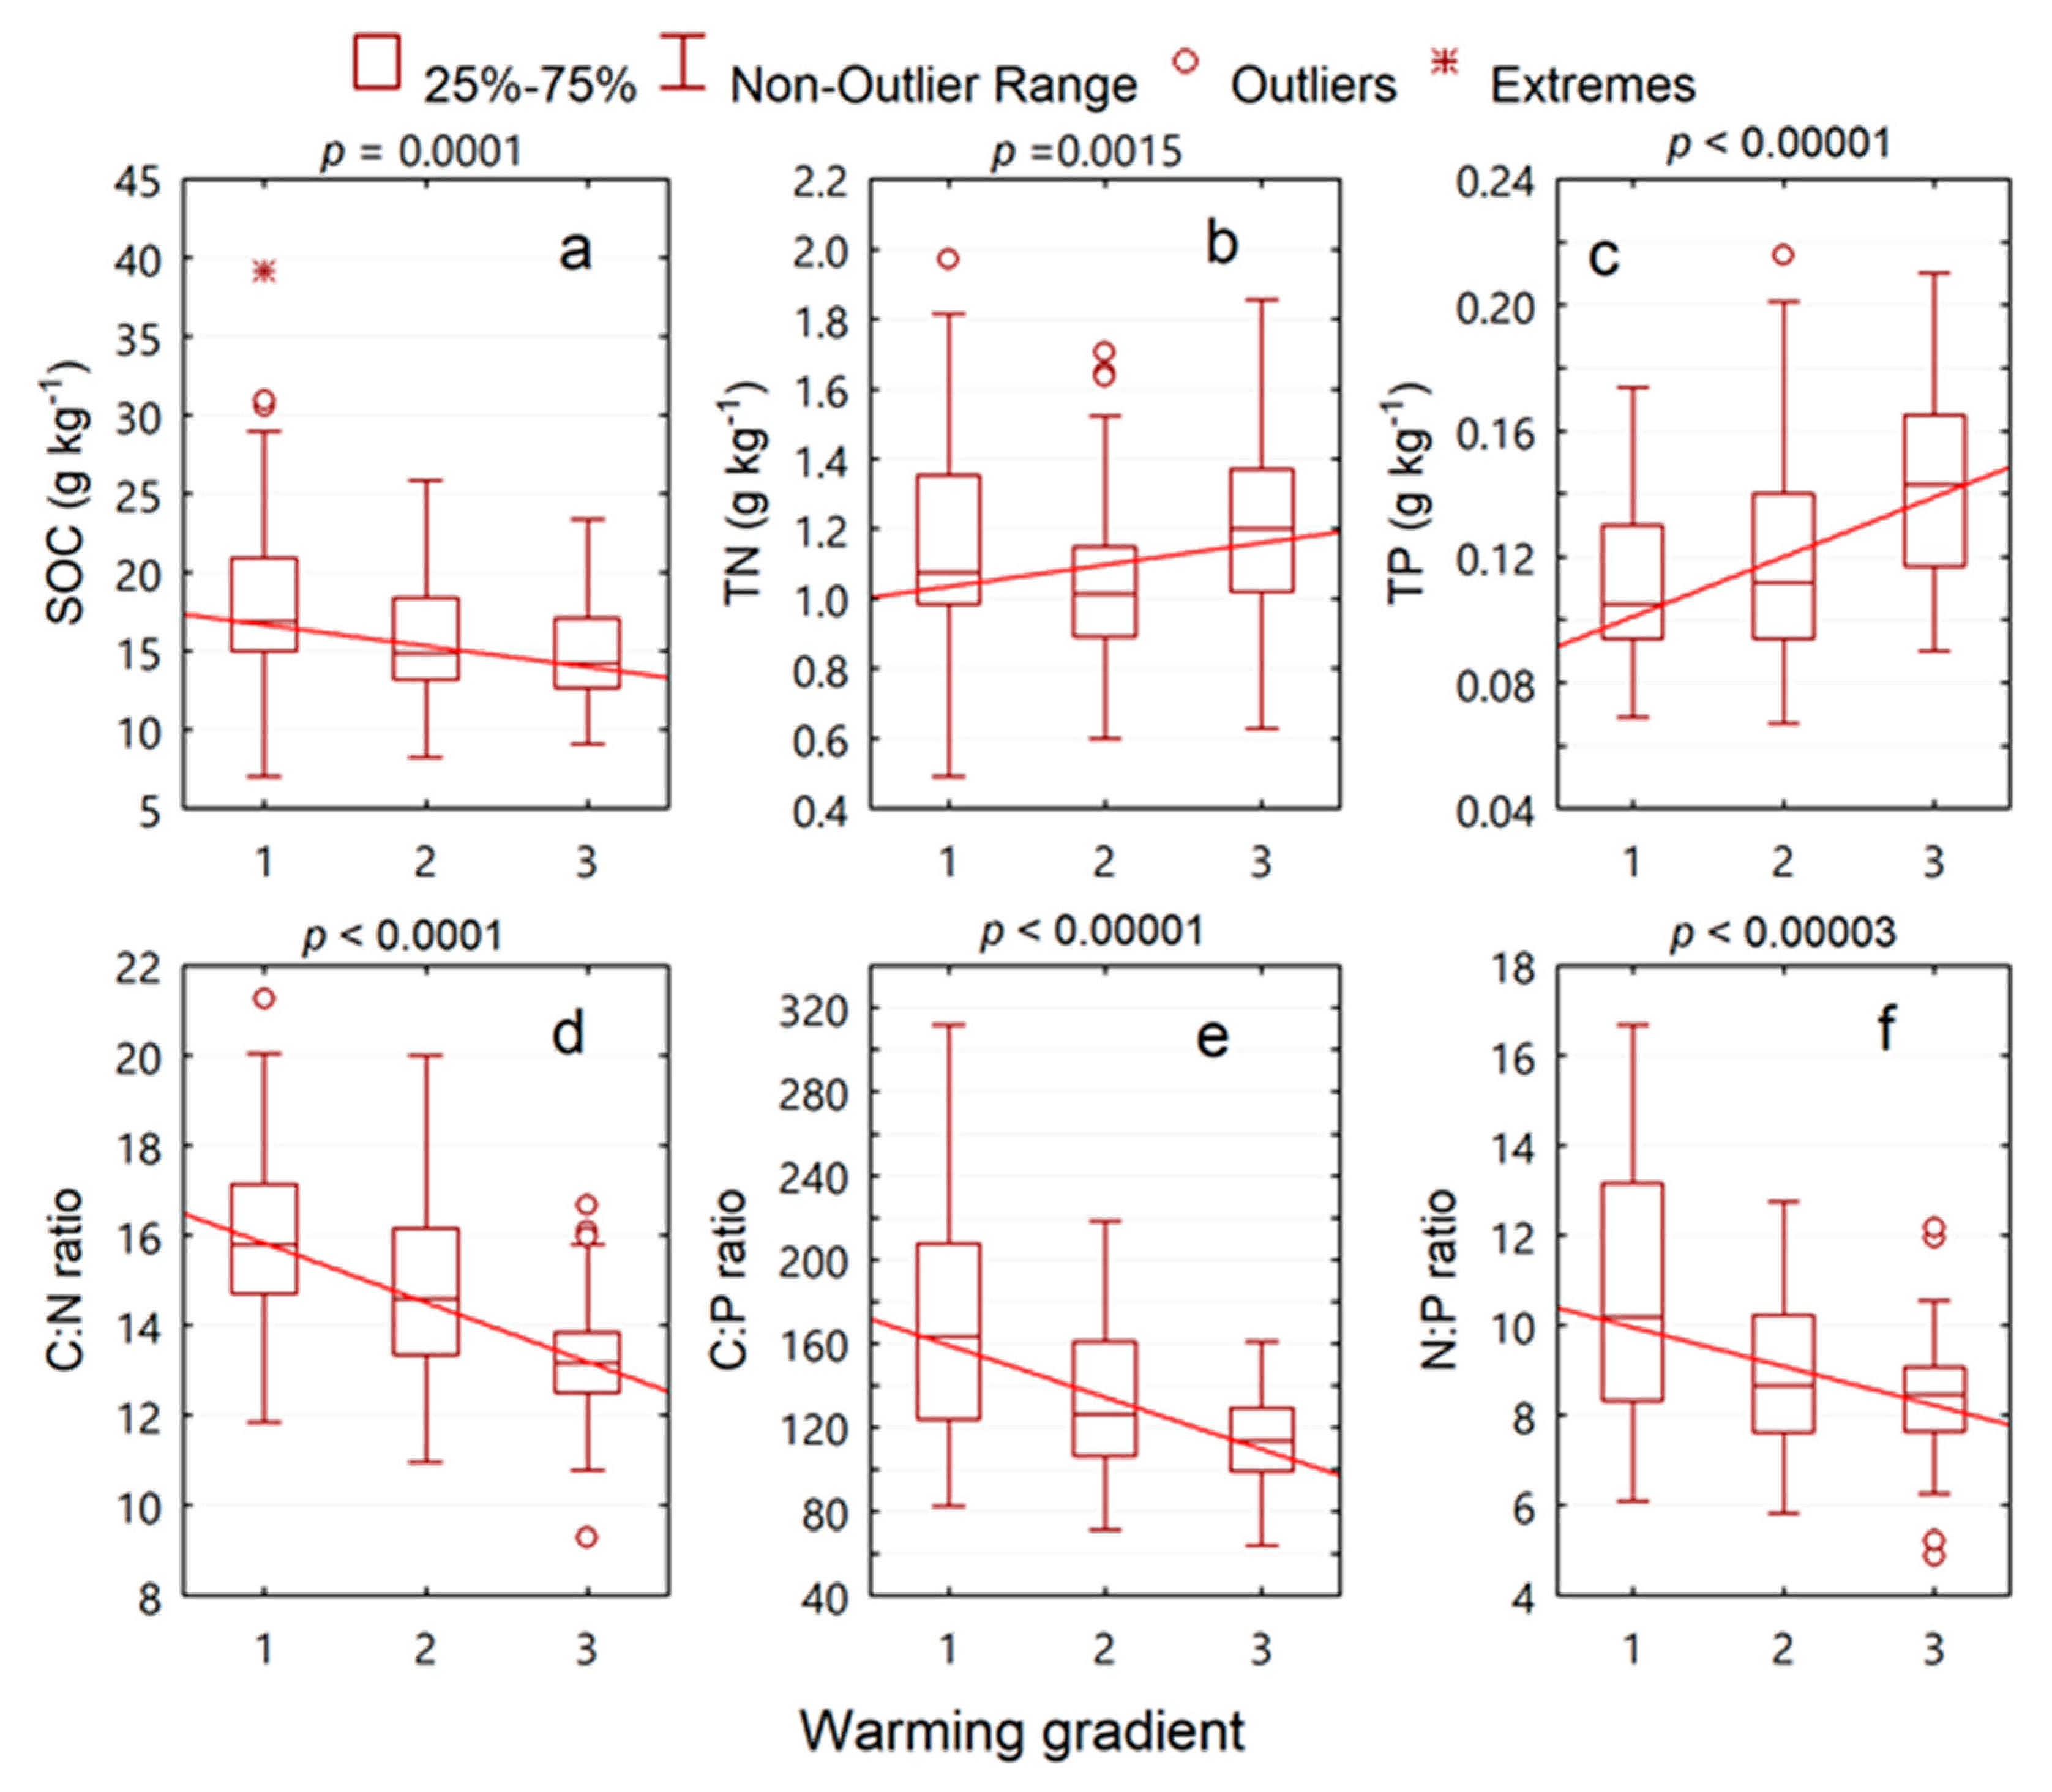
3.2. Inverse Elevation-Dependent Warming Effects

SOC significantly decreased (Figure 1a; p < 0.0001), but TN (Figure 1b; p = 0.0015) and TP (Figure 1c; p < 0.00001) significantly increased across the warming gradient. A significant decreasing trend (p < 0.0001) across the warming gradient was found for all of the C:N:P stoichiometric ratios (Figure 1d–f; p < 0.0001), indicating that the inverse relationships between C:N:P stoichiometric ratios and warming are consistent and sensitive.
SOC was negatively correlated with the warming index (Figure 2a; r = −0.27, p = 0.0001), while TP content was positively correlated with the warming index (Figure 2e; r = 0.41, p < 0.00001). We found only a very weak relationship between TN and the warming index (Figure 2c; r = 0.07, p = 0.359), but all of the C:N:P stoichiometric ratios were negatively correlated with the warming index. Among the relationships with the warming index, the correlation coefficient was the highest for the C:P ratio (Figure 2d; r = −0.50, p < 0.0001), followed by the C:N ratio (Figure 2b; r = −0.46, p < 0.0001), and the N:P ratio (Figure 2f; r = −0.42, p < 0.0001). Each of these correlations was greater than those between the warming index and SOC, TN, or TP (Figure 2).

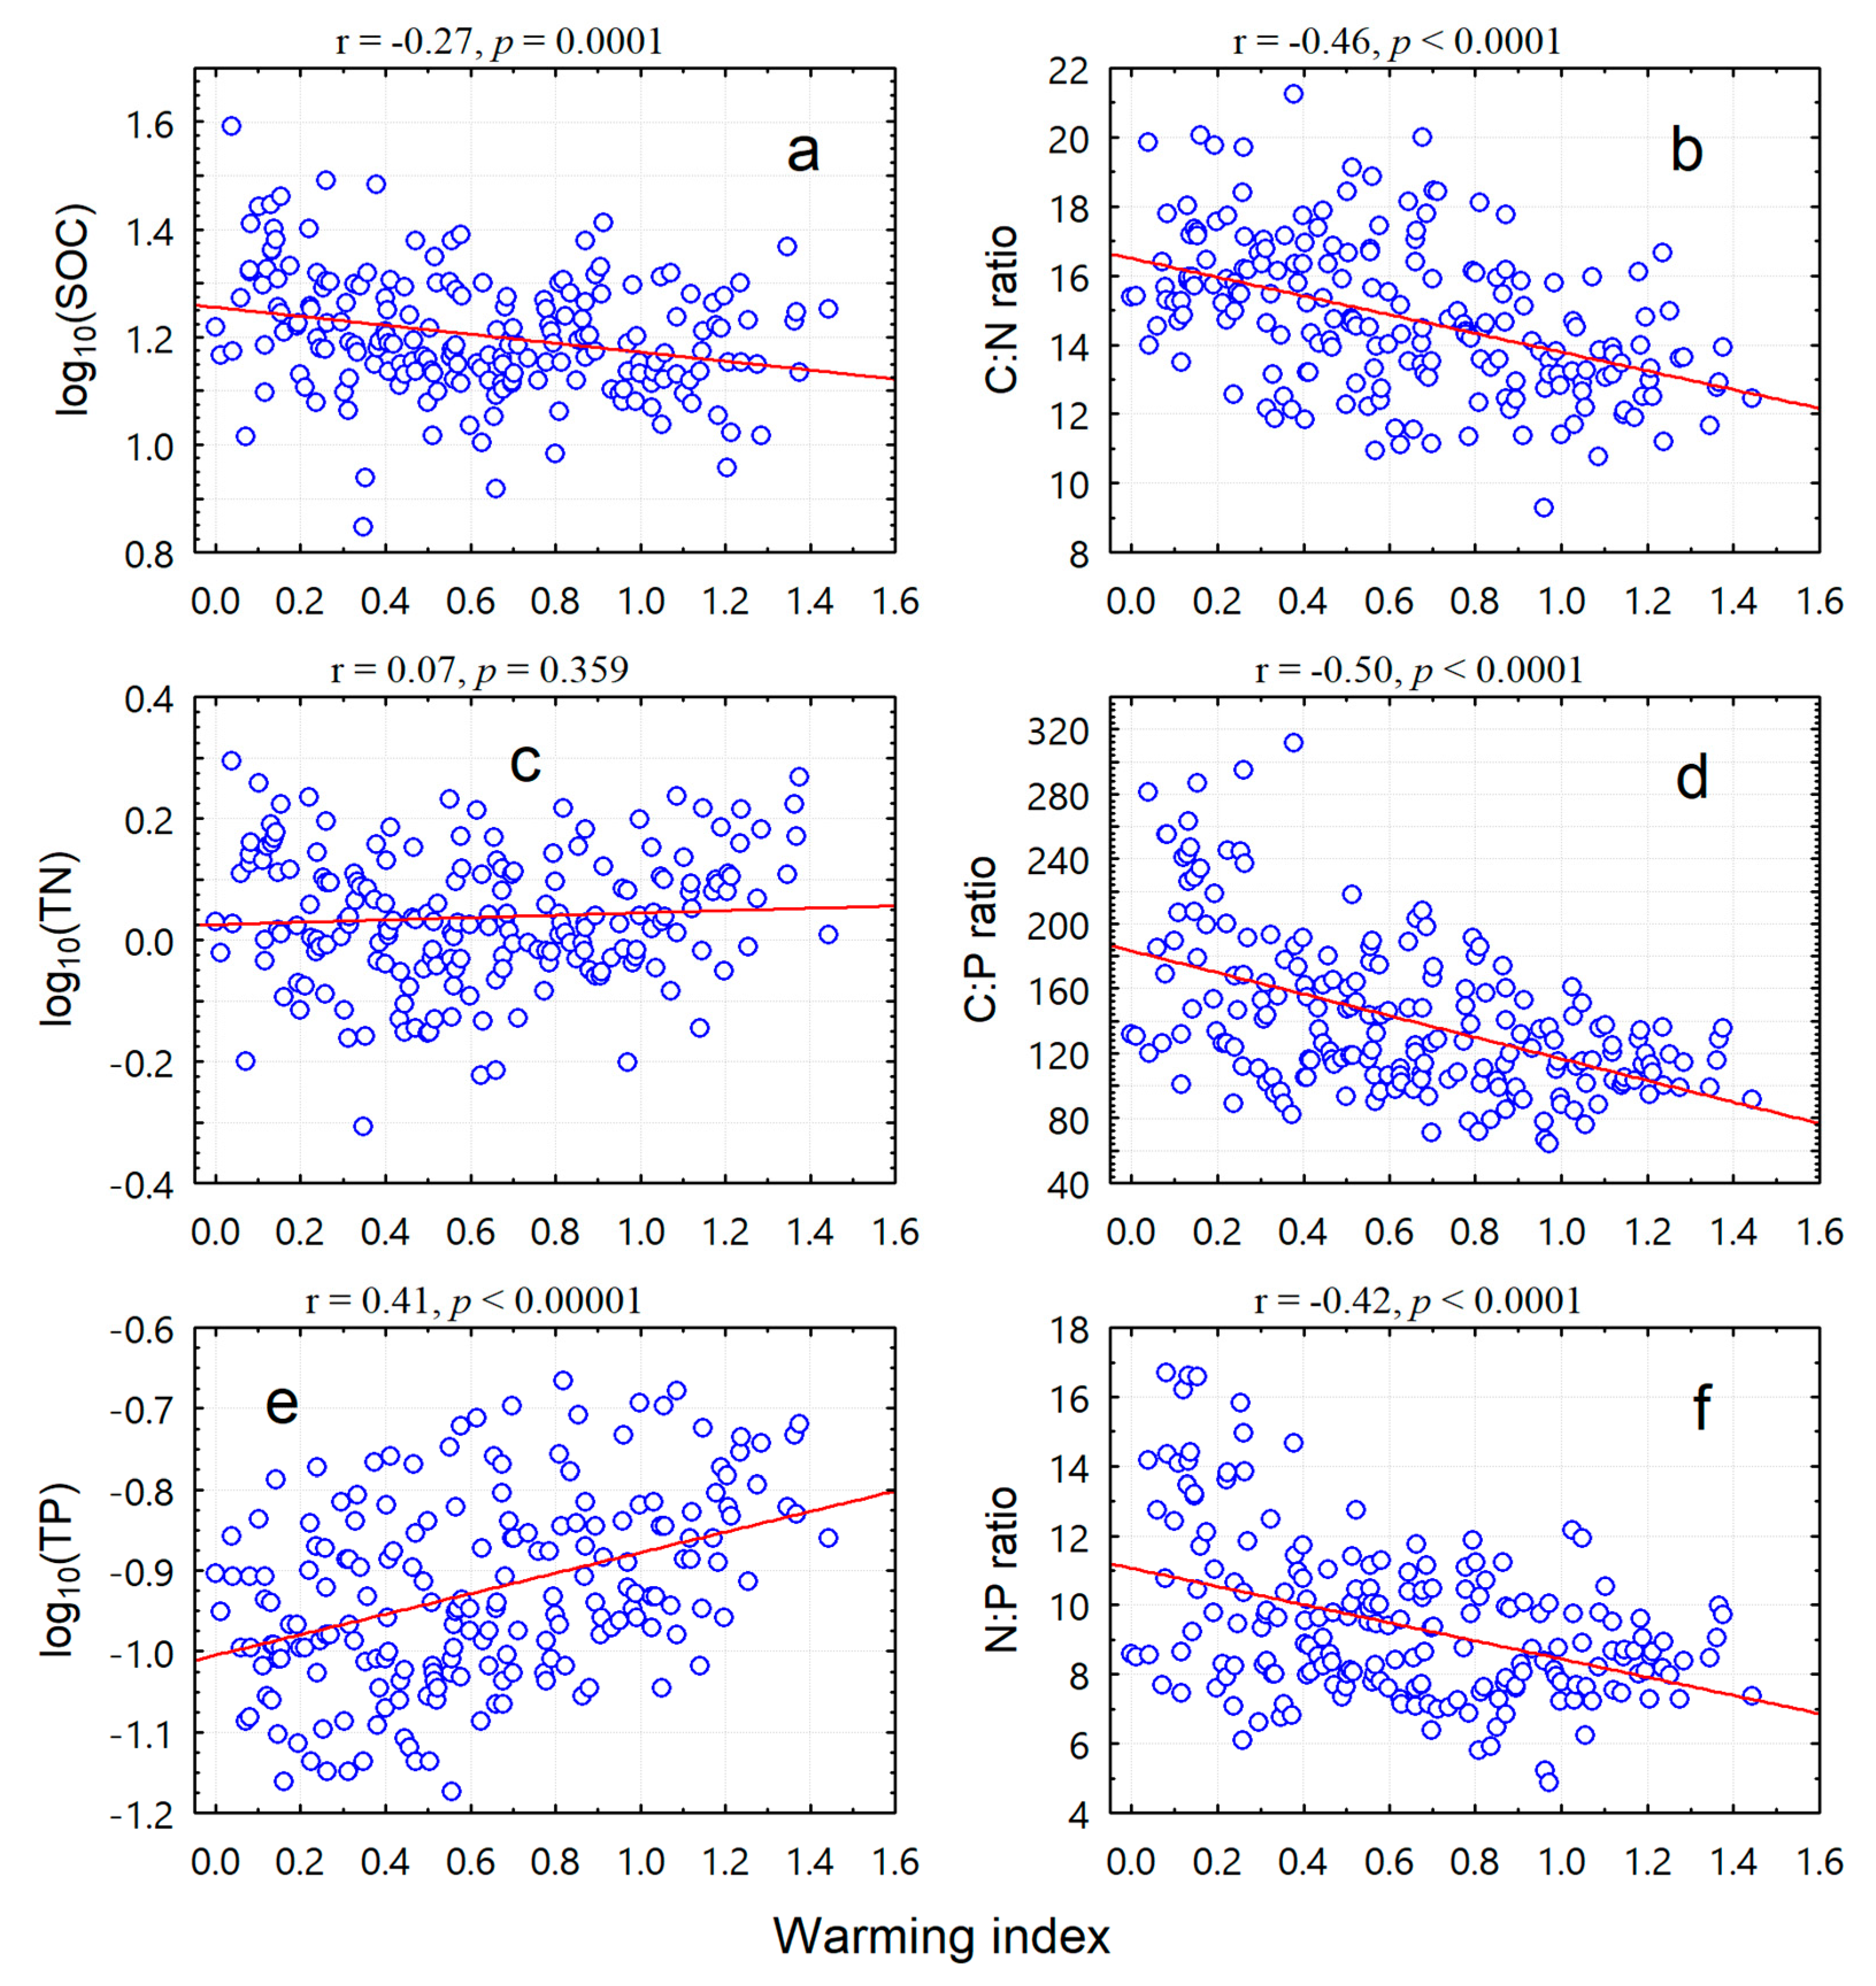
3.3. Partial Correlations

Partial correlation analyses of SOC, TN, TP, and C:N:P stoichiometric ratios with the warming index (Table 2), after controlling for two other energy variables, i.e., PDIR and/or TransTot, yielded coefficients that were similar to the corresponding Pearson coefficients (Figure 2). According to a difference test in Statistica, the corresponding coefficients were not significantly different (p > 0.05). This result indicated that the relationships of SOC, TN, TP, as well as C:N:P stoichiometric ratios with warming index (Figure 2) were the actual effects of warming derived from the inverse elevational warming gradient, and that the effects of warming were independent of two energy-related variables, PDIR and TransTot.
The coefficients from a series of correlation analyses, as well as from partial correlation analyses with the warming index as the control variable, are listed in Table 3. We found no significant difference between the correlation coefficients and partial correlation coefficients in the relationships of SOC, TN, TP, and C:N:P stoichiometric ratios with PDIR or TransTot, although partial correlations appeared to strengthen the relationships of SOC, TN, TP, and the C:N:P stoichiometric ratios in response to PDIR (Table 3). Like those in Table 2, these findings suggested that the effect of warming index was independent of PDIR or TransTot.
We found significant coefficients of SOC with Axis1tree in the correlation analysis and with Axis2tree in the partial correlation analysis, and significant coefficients of TN with Nunder, H’under, Axis1under, Axis2under, or Axis1tree in both correlation and partial correlation analyses (Table 3). The relationship of TP with PDIR, Sunder, H’under, Axis1under, or Axis2under was significant in both correlation and partial correlation analyses; the relationships of TP with Nunder in the correlation analysis and with Axis2tree in the partial correlation analysis were significant (Table 3).
The C:N:P stoichiometric ratios showed similar patterns in their relationships with some predictor variables (Table 3). According to both correlation and partial correlation analyses, the C:N:P stoichiometric ratios were positively correlated with PDIR and Axis2under, and negatively correlated with Sunder and Axis1tree (Table 3).
Significant differences were found between the correlation coefficients and partial correlation coefficients in the relationships of TP and the C:N:P stoichiometric ratios with Sunder, H’under, and Axis1tree (Table 3). The correlation coefficients and partial correlation coefficients in the relationships of C:P ratio with Axis1under were also significantly different (Table 3). These differences indicated that warming significantly influenced the relationships between the C:N:P stoichiometric ratios and vegetation-related variables, as well as the relationships between TP and the vegetation-related variables.

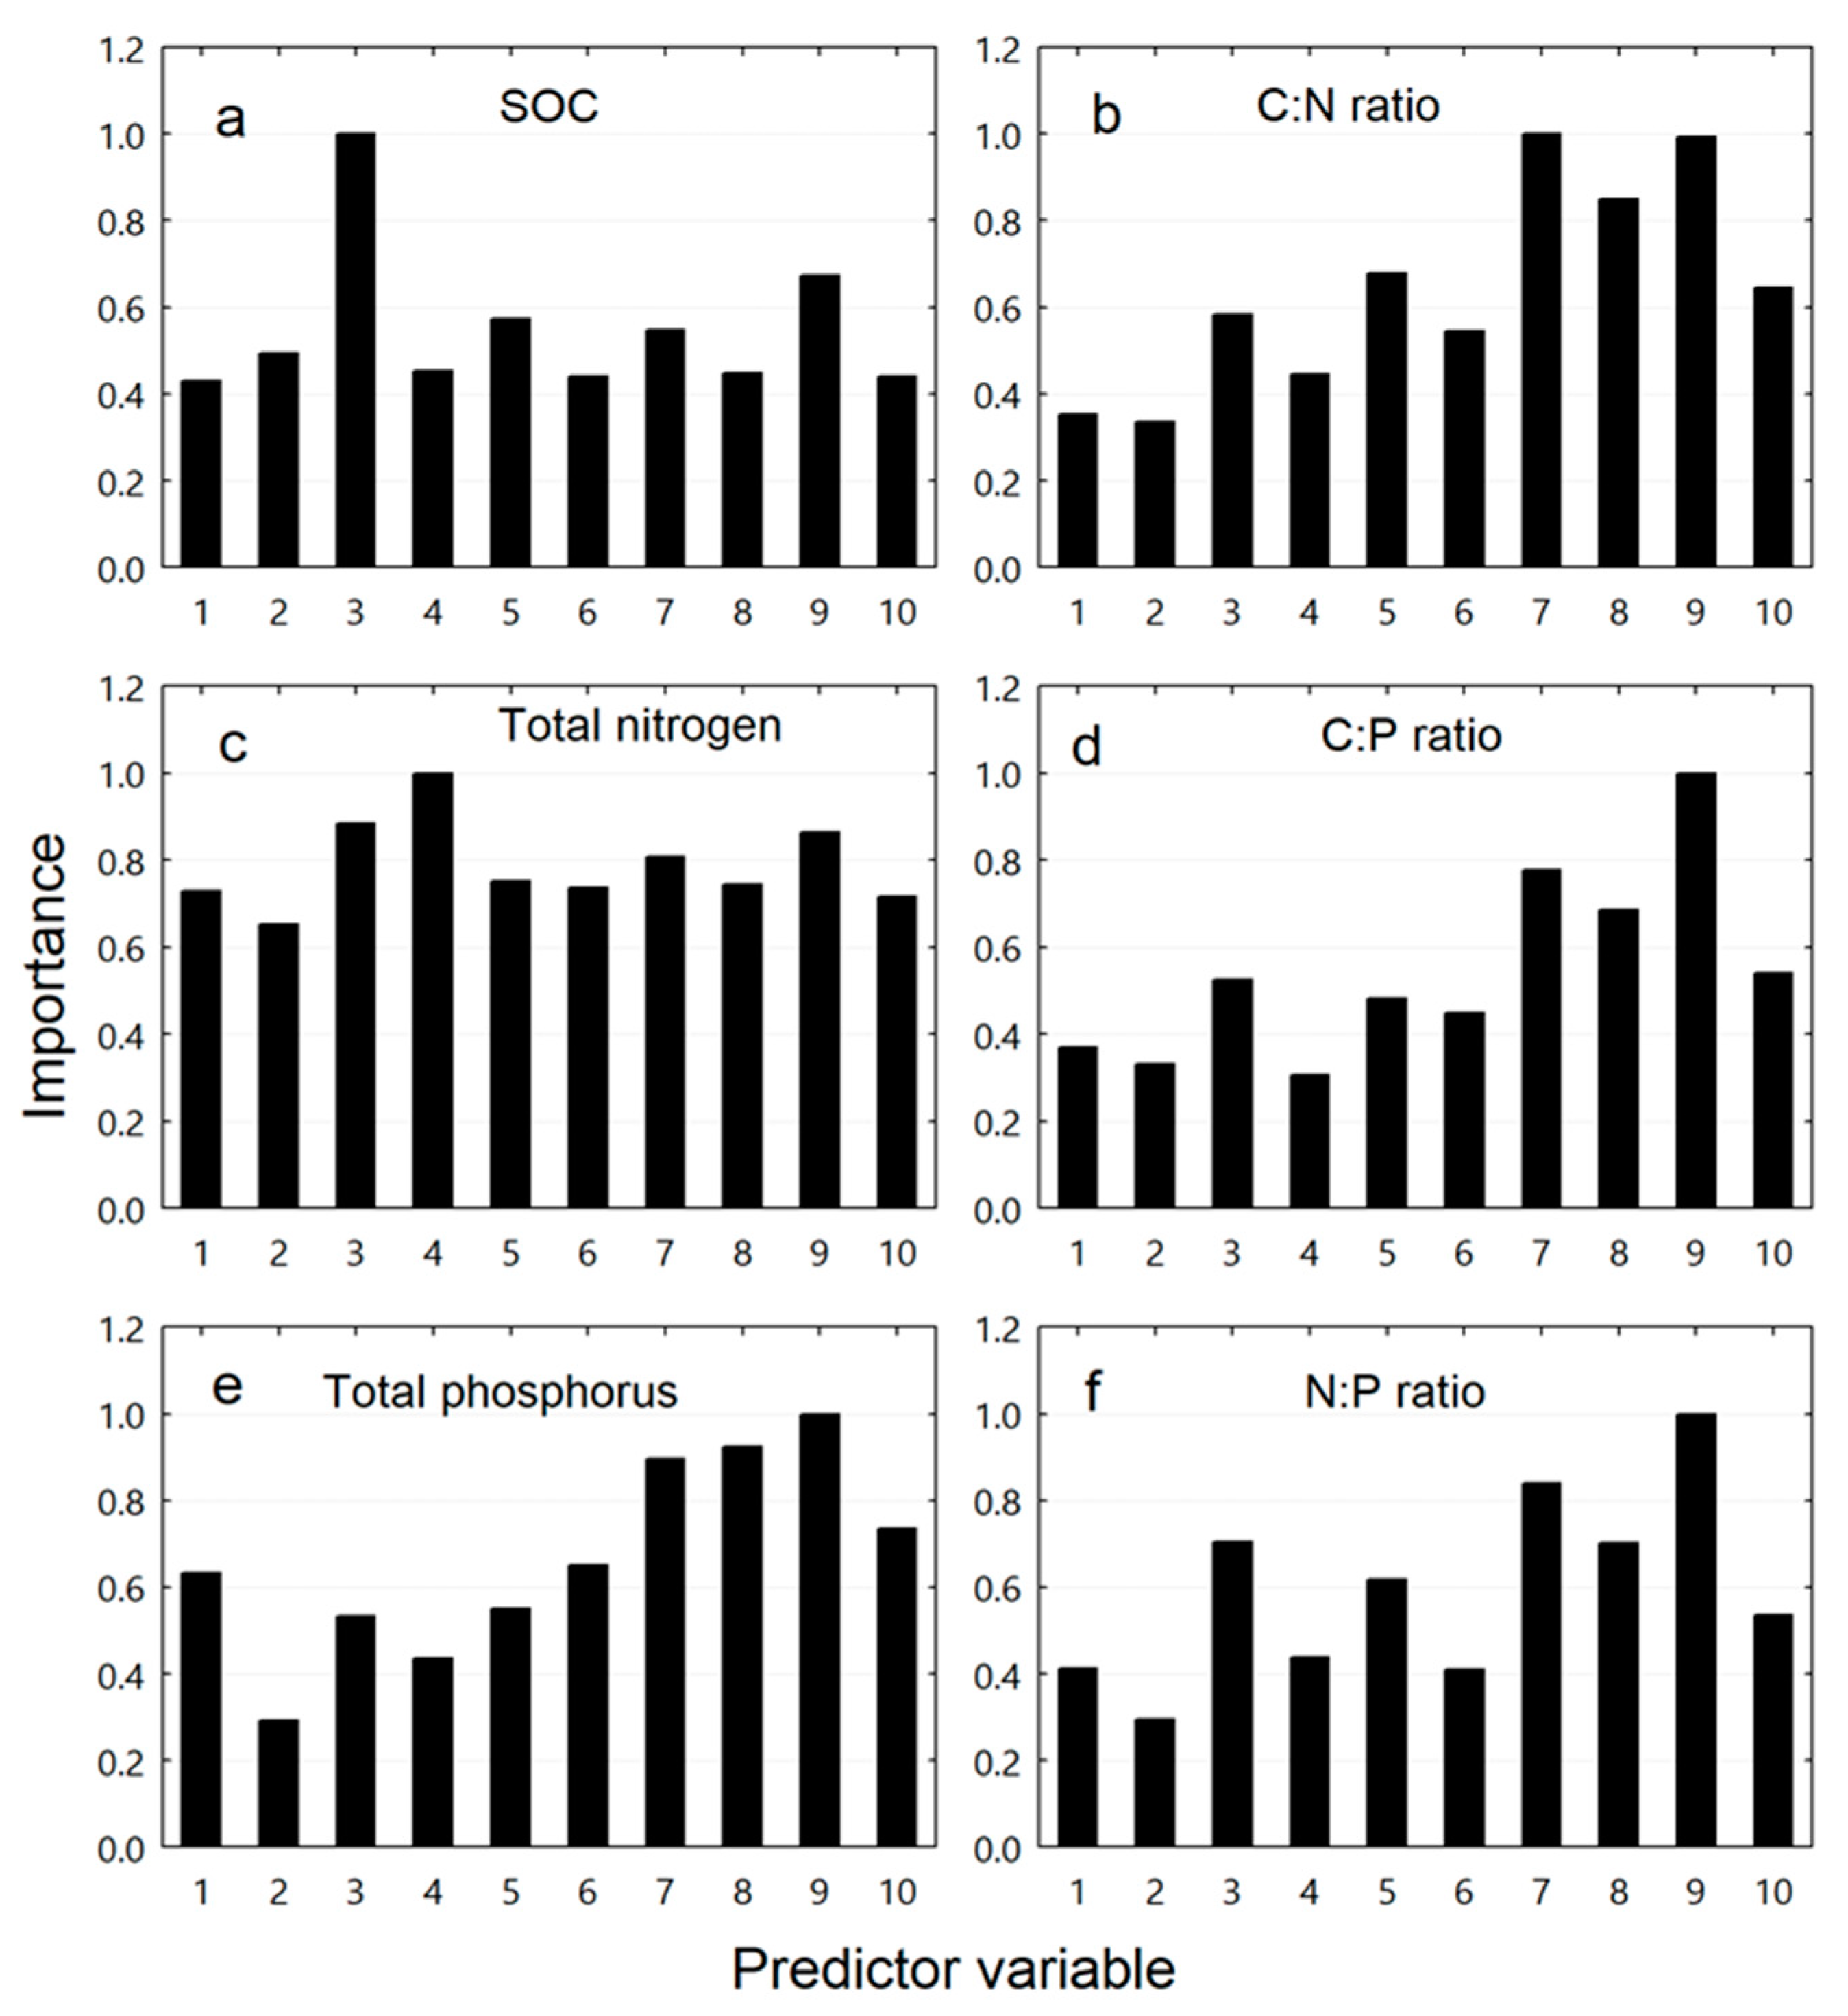
3.4. Relative Importance of Predictor Variables

Among the 10 predictor variables, warming index was the most important for predicting SOC variability (Figure 3a) and was the second most important for predicting TN variability (Figure 3c). The most important variables were Axis1under and Axis1tree for predicting the C:N ratio (Figure 3b); Nunder for predicting TN (Figure 3c); and Axis1tree for predicting TP (Figure 3e), the C:P ratio (Figure 3d), and the N:P ratio (Figure 3f). For the response variable SOC, the warming index had an importance = 1, the highest relative importance; and Axis1tree had an importance = 0.67, but other predictor variables had an importance <0.6 (Figure 3a). For the response variable of TN, the importance of most predictor variables was >0.7, which was comparable to the most important variable Nunder (Figure 3c).

4. Discussion

4.1. Warming Effects on SOC and C:N:P Stoichiometry

SOC contents decreased while TN and TP contents increased with an inverse elevation-dependent warming gradient. Different responses of SOC, TN, and TP to warming result in consistently negative relationships between C:N:P stoichiometry and warming. Warming may enhance the decomposition of SOC as well as TN and TP from the soil organic matter. According to partial correlation analysis, the warming effects on SOC and C:N:P stoichiometric ratios were independent of two other energy-related factors, the PDIR and TransTot, indicating that the actual warming effects on SOC and C:N:P stoichiometric ratios are sensitive even along a short gradient of elevation change in a mountain landscape.
SOC mainly comes from the organic matter derived from the decomposition of soil animal and their feces, microorganisms, and plant residues, which are much more abundant in the topsoil than in deeper soil layers [34]. Therefore, SOC content is much higher in the topsoil than in the deeper soil layers [35]. Because of the proximity of the topsoil to the atmosphere, much of the SOC is relatively exposed to climatic change [36,37]. Given that most active and labile components of SOC are also concentrated in the topsoil [38,39], the SOC content is more heterogeneous and variable in both space and time in the topsoil than in the deep soil layers. Furthermore, most functional roots are concentrated near the soil surface [40,41]. Higher root activity and fine root turnover increase microbial biomass and activity, further enhancing the heterogeneity of the SOC content in the topsoil. For these reasons, the topsoil is especially suitable for exploring the responses of SOC and C:N:P stoichiometry to a small difference in temperature change.
Soil C:N:P stoichiometric ratios change with climate, vegetation, and land use [15,42,43,44,45], and spatial variability is a common property of C:N:P stoichiometric ratios [45,46]. We found that both SOC and all of the C:N:P stoichiometric ratios significantly decreased with warming. The consistent patterns made C:N:P stoichiometric ratios especially good indicators for assessing warming effects on the forest ecosystem. However, these patterns may need further studies to test in broader spatiotemporal scales.

4.2. Warming Effects on the Relationships of SOC and C:N:P Stoichiometry to Habitat Factors

Although the effects of warming on forest vegetation and SOC dynamics have been well-studied [47,48,49,50,51], the effects of warming on the relationships of SOC and C:N:P stoichiometry to biotic and abiotic habitat factors remains understudied. In the current research, we conducted partial correlation analyses with warming index as a control variable and found that the relationships between vegetation-related predictors and SOC as well as C:N:P stoichiometric ratios were generally affected by warming. In most cases, warming reduced the coefficients from correlations of SOC and C:N:P stoichiometric ratios with vegetation-related variables. Although warming may improve stand productivity [24] and to some extent increase input of plant litter to the ground layer that finally adds to the topsoil organic matter pool [39,52], the loss of SOC due to increased microbial respiration under warming can exceed the additional input of organic material into the soil [53].
Warming reduced the strength of the correlations between vegetation-related variables and SOC as well as C:N:P stoichiometric ratios, but the correlations remained significant and should not be neglected in future climate warming studies. Studies have shown that the feedback of the soil microbial community to temperature is adaptive [54,55]. Soil microorganisms might adjust their own metabolism and structure to adapt to temperature change [55,56]. Both warming and vegetation-related biotic variables will affect the structure and activity of the soil microbial community, and a number of direct and indirect factors will interactively affect SOC and C:N:P stoichiometry [51,57]. Therefore, determining whether warming will reduce the correlations of vegetation-related variables with SOC and C:N:P stoichiometry in the long run will require long-term monitoring studies and new predictive models.
A number of biotic and abiotic factors are known to control soil C pools and the spatial variability of SOC and C:N:P stoichiometry [15,42,58]. Using the random forest regression model [33], we assessed the relative importance of various biotic and abiotic factors for predicting the variability of SOC and C:N:P stoichiometric ratios. We found that warming was the most important factor for predicting the change of SOC, while vegetation-related variables were most important for predicting C:N:P stoichiometric ratios. These findings indicate that C:N:P stoichiometric ratios are more sensitive than SOC to vegetation-related variables.

5. Conclusions

Our results showed that warming was responsible for the decrease in topsoil organic carbon content and C:N:P stoichiometric ratios. The warming index was the most important variable for predicting SOC variability. Although the most important variables for C:N:P stoichiometric ratios were vegetation-related variables, the relationships of C:N:P stoichiometric ratios to vegetation-related variables were significantly affected by warming. Our results also indicated that C:N:P stoichiometric ratios were more sensitive than SOC to warming. These findings demonstrate that warming is the major driver of the variability in SOC, the decrease in SOC content, and the decrease in C:N:P stoichiometric ratios, even along a short gradient of warming.

Author Contributions

Y.S. and H.C. conceived and designed the study. Y.S., Z.W., P.X., and L.Z. collected the data and discussed the results. Y.S. analyzed the data and wrote the manuscript. H.C. discussed the results and revised the manuscript for submission. All authors have read and agreed to the published version of the manuscript.

Funding

This research was supported by National Natural Science Foundation of China (31870636), the South China Agricultural University Fund for Introduced Talents (2017), and the Forestry Department of Guangdong Province, China, for non-commercial ecological forest research (B366-2018).

Acknowledgments

We thank Mingfeng Xu and Ting Liu for their help with field data collection. We are very grateful to the staff of the Kanghe Provincial Nature Reserve of Guangdong Province, China, for logistic support during field work.

Conflicts of Interest

The authors declare no conflict of interest.

References

  1. IPCC. Climate Change 2013: The Physical Science Basis. Contribution of Working Group I to the Fifth Assessment Report of the Intergovernmental Panel on Climate Change; Stocker, T.F., Qin, D., Plattner, G.-K., Tignor, M., Allen, S.K., Boschung, J., Nauels, A., Xia, Y., Bex, V., Midgley, P.M., Eds.; Cambridge University Press: New York, NY, USA, 2013. [Google Scholar]
  2. Cheesman, A.W.; Winter, K. Elevated night-time temperatures increase growth in seedlings of two tropical pioneer tree species. New Phytol. 2013, 197, 1185–1192. [Google Scholar] [CrossRef] [PubMed]
  3. Zhou, X.H.; Fu, Y.L.; Zhou, L.Y.; Li, B.; Luo, Y.Q. An imperative need for global change research in tropical forests. Tree Physiol. 2013, 33, 903–912. [Google Scholar] [CrossRef] [PubMed] [Green Version]
  4. IPCC. Global Warming of 1.5 °C. An IPCC Special Report on the Impacts of Global Warming of 1.5 °C above Pre-Industrial Levels and Related Global Greenhouse Gas Emission Pathways, in the Context of Strengthening the Global Response to the Threat of Climate Change, Sustainable Development, and Efforts to Eradicate Poverty; Masson-Delmotte, V., Zhai, P., Pörtner, H.-O., Roberts, D., Skea, J., Shukla, P.R., Pirani, A., Moufouma-Okia, W., Péan, C., Pidcock, R., et al., Eds.; Intergovernmental Panel on Climate Change: Geneva, Switzerland, 2018. [Google Scholar]
  5. Klutse, N.A.B.; Ajayi, V.O.; Gbobaniyi, E.O.; Egbebiyi, T.S.; Kouadio, K.; Nkrumah, F.; Quagraine, K.A.; Olusegun, C.; Diasso, U.; Abiodun, B.J.; et al. Potential impact of 1.5 degrees C and 2 degrees C global warming on consecutive dry and wet days over West Africa. Environ. Res. Lett. 2018, 13, 055013. [Google Scholar] [CrossRef]
  6. Mba, W.P.; Longandjo, G.N.T.; Moufouma-Okia, W.; Bell, J.P.; James, R.; Vondou, D.A.; Haensler, A.; Fotso-Nguemo, T.C.; Guenang, G.M.; Tchotchou, A.L.D.; et al. Consequences of 1.5 degrees C and 2 degrees C global warming levels for temperature and precipitation changes over Central Africa. Environ. Res. Lett. 2018, 13, 055011. [Google Scholar] [CrossRef] [Green Version]
  7. Nikulin, G.; Lennard, C.; Dosio, A.; Kjellstrom, E.; Chen, Y.M.; Hansler, A.; Kupiainen, M.; Laprise, R.; Mariotti, L.; Maule, C.F.; et al. The effects of 1.5 and 2 degrees of global warming on Africa in the CORDEX ensemble. Environ. Res. Lett. 2018, 13, 065003. [Google Scholar] [CrossRef]
  8. Li, C.L.; Cao, Z.Y.; Chang, J.J.; Zhang, Y.; Zhu, G.L.; Zong, N.; He, Y.T.; Zhang, J.J.; He, N.P. Elevational gradient affect functional fractions of soil organic carbon and aggregates stability in a Tibetan alpine meadow. Catena 2017, 156, 139–148. [Google Scholar] [CrossRef]
  9. Sierra, J.; Causeret, F. Changes in soil carbon inputs and outputs along a tropical altitudinal gradient of volcanic soils under intensive agriculture. Geoderma 2018, 320, 95–104. [Google Scholar] [CrossRef]
  10. Werner, C.; Schmidt, H.P.; Gerten, D.; Lucht, W.; Kammann, C. Biogeochemical potential of biomass pyrolysis systems for limiting global warming to 1.5 degrees C. Environ. Res. Lett. 2018, 13, 044036. [Google Scholar] [CrossRef]
  11. Scharlemann, J.P.; Tanner, E.V.; Hiederer, R.; Kapos, V.J.C.M. Global soil carbon: Understanding and managing the largest terrestrial carbon pool. Carbon Manag. 2014, 5, 81–91. [Google Scholar] [CrossRef]
  12. Bazzaz, F.A. Tropical forests in a future climate: Changes in biological diversity and impact on the global carbon cycle. Clim. Chang. 1998, 39, 317–336. [Google Scholar] [CrossRef]
  13. Miles, L.; Grainger, A.; Phillips, O. The impact of global climate change on tropical forest biodiversity in Amazonia. Glob. Ecol. Biogeogr. 2004, 13, 553–565. [Google Scholar] [CrossRef]
  14. Billings, S.A.; Ballantyne, F. How interactions between microbial resource demands, soil organic matter stoichiometry, and substrate reactivity determine the direction and magnitude of soil respiratory responses to warming. Glob. Chang. Biol. 2013, 19, 90–102. [Google Scholar] [CrossRef] [PubMed]
  15. Kirkby, C.A.; Richardson, A.E.; Wade, L.J.; BattenB, G.D.; Blanchard, C.; Kirkegaard, J.A. Carbon-nutrient stoichiometry to increase soil carbon sequestration. Soil Biol. Biochem. 2013, 60, 77–86. [Google Scholar] [CrossRef]
  16. Bojko, O.; Kabala, C. Organic carbon pools in mountain soils—Sources of variability and predicted changes in relation to climate and land use changes. Catena 2017, 149, 209–220. [Google Scholar] [CrossRef]
  17. Chen, D.F.; Yu, M.; Gonzalez, G.; Zou, X.M.; Gao, Q. Climate Impacts on soil carbon processes along an elevation gradient in the tropical Luquillo Experimental Forest. Forests 2017, 8, 90. [Google Scholar] [CrossRef] [Green Version]
  18. Simon, A.; Dhendup, K.; Rai, P.B.; Gratzer, G. Soil carbon stocks along elevational gradients in Eastern Himalayan mountain forests. Geoderma Reg. 2018, 12, 28–38. [Google Scholar] [CrossRef]
  19. Hu, C.; Li, F.; Xie, Y.H.; Deng, Z.M.; Chen, X.S. Soil carbon, nitrogen, and phosphorus stoichiometry of three dominant plant communities distributed along a small-;scale elevation gradient in the East Dongting Lake. Phys. Chem. Earth 2018, 103, 28–34. [Google Scholar] [CrossRef]
  20. Zhang, K.; Su, Y.Z.; Yang, R. Variation of soil organic carbon, nitrogen, and phosphorus stoichiometry and biogeographic factors across the desert ecosystem of Hexi Corridor, northwestern China. J. Soil Sediment 2019, 19, 49–57. [Google Scholar] [CrossRef]
  21. Hansen, K.; Butzeck, C.; Eschenbach, A.; Grongroft, A.; Jensen, K.; Pfeiffer, E.M. Factors influencing the organic carbon pools in tidal marsh soils of the Elbe estuary (Germany). J. Soil Sediment 2017, 17, 47–60. [Google Scholar] [CrossRef]
  22. Singh, P.; Bengtsson, L. Hydrological sensitivity of a large Himalayan basin to climate change. Hydrol. Process. 2004, 18, 2363–2385. [Google Scholar] [CrossRef]
  23. Hu, Y.; Su, Z.; Li, W.; Li, J.; Ke, X.J. Influence of tree species composition and community structure on carbon density in a subtropical forest. PLoS ONE 2015, 10, e0136984. [Google Scholar] [CrossRef] [PubMed]
  24. He, S.; Zhong, Y.; Sun, Y.; Su, Z.; Jia, X.; Hu, Y.; Zhou, Q. Topography-associated thermal gradient predicts warming effects on woody plant structural diversity in a subtropical forest. Sci. Rep. 2017, 7, 40387. [Google Scholar] [CrossRef] [PubMed]
  25. Lai, J.; Mi, X.; Ren, H.; Ma, K.J. Species-habitat associations change in a subtropical forest of China. J. Veg. Sci. 2009, 20, 415–423. [Google Scholar] [CrossRef]
  26. Condit, R. Tropical Forest Census Plots: Methods and Results from Barro Colorado Island, Panama and a Comparison with Other Plots; Springer: Berlin, Germany, 1998. [Google Scholar]
  27. Bao, S. Soil and Agricultural Chemistry Analysis; China Agricultural Press: Beijing, China, 2000. [Google Scholar]
  28. Frazer, G.W.; Canham, C.D.; Lertzman, K.P. Gap Light Analyzer (GLA), Version 2.0: Imaging Software to Extract Canopy Structure and Gap Light Transmission Indices from True-Colour Fisheye Photographs, Users Manual and Program Documentation; Simon Fraser University: Burnaby, BC, Canada; The Institute of Ecosystem Studies: Millbrook, NY, USA, 1999. [Google Scholar]
  29. McCune, B. Improved estimates of incident radiation and heat load using non-parametric regression against topographic variables. J. Veg. Sci. 2007, 18, 751–754. [Google Scholar] [CrossRef]
  30. Santos, R.M.; Oliveira, A.T.; Eisenlohr, P.V.; Queiroz, L.P.; Cardoso, D.B.O.S.; Rodal, M.J.N. Identity and relationships of the Arboreal Caatinga among other floristic units of seasonally dry tropical forests (SDTFs) of north-eastern and Central Brazil. Ecol. Evol. 2012, 2, 409–428. [Google Scholar] [CrossRef]
  31. Zhou, Y.; Su, Y.; Zhong, Y.; Xie, P.; Xu, M.; Su, Z. Community attributes predict the relationship between habitat invasibility and land use types in an agricultural and forest landscape. Forests 2019, 10, 867. [Google Scholar] [CrossRef] [Green Version]
  32. Breiman, L. Random forest. Mach. Learn. 2001, 45, 5–32. [Google Scholar] [CrossRef] [Green Version]
  33. Breiman, L.; Last, M.; Rice, J. Random forests: Finding quasars. In Statistical Challenges in Astronomy; Springer: New York, NY, USA, 2003; pp. 243–254. [Google Scholar]
  34. Sun, X. Soil Science; China Forestry Press: Beijing, China, 2008. [Google Scholar]
  35. Fang, Y.; Mo, J.; Sandra, B.; Zhou, G.; Zhang, Q.; Li, D.J. Storage and distribution of soil organic carbon in Dinghushan Biosphere Reserve. Acta Ecol. Sin. 2004, 24, 135–142. [Google Scholar]
  36. Rial, M.; Cortizas, A.M.; Rodriguez-Lado, L. Understanding the spatial distribution of factors controlling topsoil organic carbon content in European soils. Sci. Total. Environ. 2017, 609, 1411–1422. [Google Scholar] [CrossRef]
  37. Song, G.H.; Li, L.Q.; Pan, G.X.; Zhang, Q. Topsoil organic carbon storage of China and its loss by cultivation. Biogeochemistry 2005, 74, 47–62. [Google Scholar] [CrossRef]
  38. Boddy, E.; Hill, P.W.; Farrar, J.; Jones, D.L. Fast turnover of low molecular weight components of the dissolved organic carbon pool of temperate grassland field soils. Soil Biol. Biochem. 2007, 39, 827–835. [Google Scholar] [CrossRef]
  39. Zhang, Z.; Cai, X.; Tang, C.; Guo, J. Priming effect of dissolved organic matter in the surface soil of a Cunninghamia lanceolata plantation. Acta Ecol. Sin. 2017, 37, 7660–7667. [Google Scholar]
  40. Jobbagy, E.G.; Jackson, R.B. The vertical distribution of soil organic carbon and its relation to climate and vegetation. Ecol. Appl. 2000, 10, 423–436. [Google Scholar] [CrossRef]
  41. Chen, C.R.; Xu, Z.H.; Zhang, S.L.; Keay, P. Soluble organic nitrogen pools in forest soils of subtropical Australia. Plant Soil 2005, 277, 285–297. [Google Scholar] [CrossRef]
  42. Alberti, G.; Vicca, S.; Inglima, I.; Belelli-Marchesini, L.; Genesio, L.; Miglietta, F.; Marjanovic, H.; Martinez, C.; Matteucci, G.; D’Andrea, E.; et al. Soil C:N stoichiometry controls carbon sink partitioning between above-ground tree biomass and soil organic matter in high fertility forests. Iforest 2015, 8, 195–206. [Google Scholar] [CrossRef] [Green Version]
  43. Xu, X.; Li, D.J.; Cheng, X.L.; Ruan, H.H.; Luo, Y.Q. Carbon: Nitrogen stoichiometry following afforestation: A global synthesis. Sci. Rep. 2016, 6, 19117. [Google Scholar] [CrossRef] [Green Version]
  44. Cao, Y.; Chen, Y.M. Ecosystem C:N:P stoichiometry and carbon storage in plantations and a secondary forest on the Loess Plateau, China. Ecol. Eng. 2017, 105, 125–132. [Google Scholar] [CrossRef]
  45. Zhao, F.Z.; Kang, D.; Han, X.H.; Yang, G.H.; Yang, G.H.; Feng, Y.Z.; Ren, G.X. Soil stoichiometry and carbon storage in long-term afforestation soil affected by understory vegetation diversity. Ecol. Eng. 2015, 74, 415–422. [Google Scholar] [CrossRef]
  46. Yang, Y.; Wang, G.X.; Shen, H.H.; Yang, Y.; Cui, H.J.; Liu, Q. Dynamics of carbon and nitrogen accumulation and C:N stoichiometry in a deciduous broadleaf forest of deglaciated terrain in the eastern Tibetan Plateau. For. Ecol. Manag. 2014, 312, 10–18. [Google Scholar] [CrossRef]
  47. Gutierrez-Giron, A.; Diaz-Pines, E.; Rubio, A.; Gavilan, R.G. Both altitude and vegetation affect temperature sensitivity of soil organic matter decomposition in Mediterranean high mountain soils. Geoderma 2015, 237, 1–8. [Google Scholar] [CrossRef]
  48. Fissore, C.; Giardina, C.P.; Kolka, R.K.; Trettin, C.C.; King, G.M.; Jurgensen, M.F.; Barton, C.D.; Mcdowell, S.D. Temperature and vegetation effects on soil organic carbon quality along a forested mean annual temperature gradient in North America. Glob. Chang. Biol. 2008, 14, 193–205. [Google Scholar] [CrossRef] [Green Version]
  49. Zhang, X.M.; Johnston, E.R.; Li, L.H.; Konstantinidis, K.T.; Han, X.G. Experimental warming reveals positive feedbacks to climate change in the Eurasian Steppe. ISME J. 2017, 11, 885–895. [Google Scholar] [CrossRef] [PubMed] [Green Version]
  50. Peng, F.; You, Q.G.; Xu, M.H.; Zhou, X.H.; Wang, T.; Guo, J.; Xue, X. Effects of experimental warming on soil respiration and its components in an alpine meadow in the permafrost region of the Qinghai-Tibet Plateau. Eur. J. Soil. Sci. 2015, 66, 145–154. [Google Scholar] [CrossRef]
  51. Schindlbacher, A.; Rodler, A.; Kuffner, M.; Kitzler, B.; Sessitsch, A.; Zechmeister-Boltenstern, S. Experimental warming effects on the microbial community of a temperate mountain forest soil. Soil Biol. Biochem. 2011, 43, 1417–1425. [Google Scholar] [CrossRef] [Green Version]
  52. Mau, R.L.; Dijkstra, P.; Schwartz, E.; Koch, B.J.; Hungate, B.A. Warming induced changes in soil carbon and nitrogen influence priming responses in four ecosystems. Appl. Soil. Ecol. 2018, 124, 110–116. [Google Scholar] [CrossRef]
  53. Li, Y.Q.; Qing, Y.X.; Lyu, M.K.; Chen, S.D.; Yang, Z.J.; Lin, C.F.; Yang, Y.S. Effects of artificial warming on different soil organic carbon and nitrogen pools in a subtropical plantation. Soil Biol. Biochem. 2018, 124, 161–167. [Google Scholar] [CrossRef]
  54. Karhu, K.; Auffret, M.D.; Dungait, J.A.; Hopkins, D.W.; Prosser, J.I.; Singh, B.K.; Subke, J.A.; Wookey, P.A.; Agren, G.I.; Sebastia, M.T.; et al. Temperature sensitivity of soil respiration rates enhanced by microbial community response. Nature 2014, 513, 81–84. [Google Scholar] [CrossRef]
  55. Davidson, E.A.; Janssens, I.A. Temperature sensitivity of soil carbon decomposition and feedbacks to climate change. Nature 2006, 440, 165–173. [Google Scholar] [CrossRef]
  56. Bradford, M.A.; Davies, C.A.; Frey, S.D.; Maddox, T.R.; Melillo, J.M.; Mohan, J.E.; Reynolds, J.F.; Treseder, K.K.; Wallenstein, M.D. Thermal adaptation of soil microbial respiration to elevated temperature. Ecol. Lett. 2008, 11, 1316–1327. [Google Scholar] [CrossRef]
  57. Rustad, L.; Campbell, J.; Marion, G.; Norby, R.; Mitchell, M.; Hartley, A.; Cornelissen, J.; Gurevitch, J.; Gcte, N. A meta-analysis of the response of soil respiration, net nitrogen mineralization, and aboveground plant growth to experimental ecosystem warming. Oecologia 2001, 126, 543–562. [Google Scholar] [CrossRef]
  58. Wang, N.; Fu, F.Z.; Wang, B.T.; Wang, R.J. Carbon, nitrogen and phosphorus stoichiometry in Pinus tabulaeformis forest ecosystems in warm temperate Shanxi Province, north China. J. For. Res. 2018, 29, 1665–1673. [Google Scholar] [CrossRef]
Figure 1. Boxplots showing the effect of warming gradient on soil organic carbon (SOC; a), total nitrogen (TN; b), total phosphorus (TP; c), and C:N:P stoichiometric ratios (df) across an inverse elevational warming gradient.
Forests 11 00066 g001
Figure 2. Relationships between the warming index and soil organic carbon (SOC; a), total nitrogen (TN; c), total phosphorus (TP; e), and C:N:P stoichiometric ratios (b,d,f). Number of samples = 200.
Forests 11 00066 g002
Figure 3. Random forest analysis showing the importance of variables for predicting SOC (a), total nitrogen (c), total phosphorus (e), and C:N:P stoichiometric ratios (b,d,f). The response variable is shown in each graph panel. Code for predictor variables: 1 = potential direct incident radiation (PDIR, MJ m−2 d−1); 2 = transmitted total radiation (TransTot, MJ m−2 d−1); 3 = warming index; 4 = number of stems in the understory (Nunder); 5 = number of species in the understory (Sunder); 6 = Shannon-Wiener index of the understory community (H’under); 7 = ordination scores of axis 1 for understory plants (Axis1under); 8 = ordination scores of axis 2 for understory plants (Axis2under); 9 = ordination scores of axis 1 for trees ≥5 cm (Axis1tree); and 10 = ordination scores of axis 2 for trees ≥5 cm (Axis2tree).
Forests 11 00066 g003
Table 1. Descriptive statistics for soil organic carbon (SOC), total nitrogen (TN), total phosphorus (TP), and C:N:P stoichiometric ratios.
AttributeMeanMedianMinimumMaximumStandard DeviationCoefficient of Variation (%)
SOC (g kg−1)16.5515.467.0439.124.5527.50
TN (g kg−1)1.121.070.491.970.2824.58
TP (g kg−1)0.120.120.070.220.0326.71
C:N ratio14.8214.679.2921.252.1514.48
C:P ratio141.99129.1264.16311.6648.1033.88
N:P ratio9.448.804.8816.692.2824.15
Table 2. Descriptive statistics for soil organic carbon (SOC), total nitrogen (TN), total phosphorus (TP), and C:N:P stoichiometric ratios. PDIR: potential direct incident radiation.
Response VariableVariables to Be Controlled for
PDIR OnlyTransTot OnlyPDIR and TransTot
SOC−0.27 *−0.26 *−0.26 *
TN0.070.060.07
TP0.44 **0.40 **0.44 **
C:N ratio−0.49 **−0.45 **−0.48 **
C:P ratio−0.54 **−0.50 **−0.54 **
N:P ratio−0.45 **−0.42 **−0.44 **
* p < 0.001; ** p < 0.0001.
Table 3. Relationships of soil organic carbon (SOC), total nitrogen (TN), total phosphorus (TP), and C:N:P stoichiometric ratios with potential direct incident radiation (PDIR), transmitted total radiation (TransTot), and vegetation-related variables as indicated by correlation analysis (r) and partial correlation analysis (partial r) after controlling for the warming index.
Predictor VariableType of CoefficientResponse Variable
SOCTNTPC:N RatioC:P RatioN:P Ratio
PDIRr0.02a−0.09a−0.26 **a0.21 *a0.23 *a0.20 *a
partial r0.04a−0.10a−0.32 **a0.28 **a0.32 **a0.26 **a
TransTotr0.10a−0.05a−0.07a0.18 *a0.10a0.03a
partial r0.07a−0.04a−0.03a0.16 *a0.06a−0.01a
Nunderr−0.07a−0.37 ***a−0.20 *a0.20 *a−0.07a−0.19 *a
partial r−0.14a−0.36 ***a−0.12a0.12a−0.22 *a−0.32 **a
Sunderr−0.10a0.05a0.33 **a−0.36 ***a−0.41 ***a−0.34 **a
partial r0.04a0.02a0.17 *b−0.17 *b−0.21 *b−0.17 *b
H’underr−0.07a0.24 **a0.37 **a−0.41 ***a−0.29 **a−0.17 *a
partial r0.12a0.25 **a0.19 *b−0.19 *b0.01b0.10b
Axis1underr−0.04a0.16 *a0.32 **a−0.29 **a−0.26 **a−0.19 *a
partial r0.064a0.146 *a0.203 *a−0.159 *a−0.104b−0.053a
Axis2underr0.13a−0.18 *a−0.44 ***a0.45 ***a0.39 ***a0.30 **a
partial r0.06a−0.16 *a−0.37 ***a0.37 ***a0.29 **a0.20 *a
Axis1treer−0.23 *a0.22 *a0.54 ***a−0.57 ***a−0.50 ***a−0.38 ***a
partial r−0.10a0.22 *a0.41 ***b−0.43 ***b−0.30 **b−0.19 *b
Axis2treer0.08a0.11a0.03a0.12a0.09a0.07a
partial r0.14 *a0.10a−0.07a0.25 **a0.24 **a0.19 *a
(1) Predictor variables: PDIR = potential direct incident radiation (MJ m−2 d−1); TransTot = transmitted total radiation (MJ m−2 d−1); Nunder = number of stems in the understory; Sunder = number of species in the understory; H’under = Shannon-Wiener index of the understory community; Axis1under = ordination scores of Axis 1 for understory plants; Axis2under = ordination scores of Axis 2 for understory plants; Axis1tree = ordination scores of Axis 1 for trees ≥5 cm; Axis2tree = ordination scores of Axis 2 for trees ≥5 cm. (2) *, **, and *** indicate statistical significance at p < 0.05, < 0.001, and p < 0.0001, respectively. (3) Coefficients from Pearson correlation versus partial correlation analyses were tested for difference using the difference test facility of Statistica version 8.0 (Statsoft, Inc. Tulsa, OK, USA); different lowercase letters indicate a significant difference at p < 0.05.

