Abstract
The study is devoted to the construction of an avalanche susceptibility map based on ensemble machine learning algorithms (random forest, XGBoost, LightGBM, gradient boosting machines, AdaBoost, NGBoost) for the conditions of the East Kazakhstan region. To train these models, data were collected on avalanche path profiles, meteorological conditions, and historical avalanche events. The quality of the trained machine learning models was assessed using metrics such as accuracy, precision, true positive rate (recall), and F1-score. The obtained metrics indicated that the trained machine learning models achieved reasonably accurate forecasting performance (forecast accuracy from 67% to 73.8%). ROC curves were also constructed for each obtained model for evaluation. The resulting AUCs for these ROC curves showed acceptable levels (from 0.57 to 0.73), which also indicated that the presented models could be used to predict avalanche danger. In addition, for each machine learning model, we determined the importance of the indicators used to predict avalanche danger. Analysis of the importance of the indicators showed that the most significant indicators were meteorological data, namely temperature and snow cover level in avalanche paths. Among the indicators that characterized the avalanche paths’ profiles, the most important were the minimum and maximum slope elevations. Thus, within the framework of this study, a highly accurate model was built using geospatial and meteorological data that allows identifying potentially dangerous slope areas. These results can support territorial planning, the design of protective infrastructure, and the development of early warning systems to mitigate avalanche risks.
1. Introduction
Avalanche hazard remains one of the key natural threats in mountainous regions worldwide, including the East Kazakhstan Region, where complex terrain and intensive snowfalls create a high risk of avalanche occurrence [1]. Traditional forecasting methods based on empirical observations are often insufficiently accurate and fail to account for the nonlinear nature of factors influencing avalanche formation. Global experience demonstrates that in related fields—such as flood forecasting [2,3,4], landslide prediction [5,6], snowstorm analysis [7], and debris flow modeling [8,9]—machine learning algorithms are actively employed and have proven effective in analyzing spatial data and improving forecast accuracy [10]. The successful results achieved in these domains have encouraged the application of machine learning techniques for avalanche hazard prediction as well.
Modern machine learning (ML) methods can improve the accuracy of avalanche hazard forecasts by analyzing large volumes of spatial data and taking into account complex nonlinear relationships between natural factors [11,12,13]. Ensemble-tree-based algorithms are particularly effective in capturing the complex nonlinear relationships involved in avalanche formation.
Ensemble machine learning methods represent a strategy of combining multiple models to enhance the accuracy and robustness of predictions. For example, [14] examined various approaches to ensemble learning, including tree-based models such as random forest (RF) and gradient boosting decision tree (GBDT) as well as more advanced algorithms such as XGBoost, LightGBM, and CatBoost (Python 3.13). Research has shown that model ensembling enables the achievement of high prediction accuracy, outperforming individual algorithms through averaging and weighted combinations of base models. These findings confirm that ensemble algorithms are particularly promising for tasks related to the monitoring and forecasting of natural hazards, including avalanches.
2. Literary Review
In recent years, particular attention in the scientific literature has been given to the application of ensemble machine learning algorithms, which have proven to be powerful tools for avalanche hazard prediction. The most commonly used are tree-based models, including random forest (RF) and gradient boosting machines (GBMs), and more advanced and high-performance algorithms such as XGBoost, LightGBM, NGBoost, and CatBoost (Python 3.13). These methods enable the development of highly accurate predictive models capable of identifying avalanche-prone areas by accounting for multidimensional factors such as terrain, climate, and vegetation [15]. Their versatility has been confirmed by successful applications not only in avalanche susceptibility assessment but in modeling other slope-related hazards, such as landslides and debris flows [16,17]. For example, ensemble models such as RF and XGBoost have demonstrated high efficiency in constructing landslide susceptibility maps, highlighting their potential for integrated approaches to natural hazard assessment.
One of the most reliable and widely applied algorithms for avalanche susceptibility assessment is random forest (RF), which belongs to the family of ensemble decision tree methods.
Thus, in the study by Mayer et al. [18], the high efficiency of using random forest for assessing snow cover instability based on simulated stratigraphic data from the SNOWPACK model was demonstrated. The model, built on a sample of 742 observed and simulated snow profiles, classified the stability of snow layers with an accuracy of up to 93%, which confirmed the high applicability of RF in avalanche forecasting. This marked a key shift from expert-driven analysis to data-driven machine learning approaches.
The random forest algorithm has also attracted particular interest in a number of other studies, where it has consistently demonstrated high accuracy and robustness in models based on it. For example, Rahmati et al. [19] conducted a spatial assessment of avalanche hazard in two mountain catchments in Iran (Darwan and Zarrinerud) using four algorithms: support vector machine (SVM), random forest (RF), naïve Bayes (NB), and a generalized additive model (GAM). Fourteen geomorphometric, topographic, and hydrological factors were used as predictors. Based on the analysis results, random forest demonstrated the highest efficiency among the individual models in both Darwan (AUROC = 0.964, TSS = 0.862) and Zarrinerud (AUROC = 0.956, TSS = 0.881). These indicators confirmed the high ability of RF to identify complex spatial patterns of avalanche formation.
The effectiveness of random forest was also demonstrated in a study by Yang et al. [20], where the algorithm was used to estimate snow depth and reconstruct historical data across China. The trained model showed high accuracy (RMSE from 4.4 to 7.3 cm) for both temporal and spatiotemporal data.
The relevance of using ensemble algorithms such as random forest, XGBoost, and LightGBM was confirmed in [21], where snow depth estimation in Xinjiang was performed using passive microwave radiometry data. Among the five models tested (including GPR, SVM, RF, XGBoost, and LightGBM), LightGBM showed the highest accuracy, while RF and XGBoost also demonstrated high accuracy rates. This emphasizes that in the context of complex terrain and multisource data, RF remains an effective solution comparable to newer gradient boosting models.
Continuing to develop the topic of snow cover estimation in the Xinjiang region, ref. [22] proposed an improved model based on the use of high-resolution passive microwave radiometry data in combination with ERA5-Land reanalysis. Four machine learning algorithms were used in the study: CatBoost, LightGBM, XGBoost, and RF. Among them, the CatBoost model showed the highest accuracy, but XGBoost, LightGBM, and RF also demonstrated high performance. The obtained results highlight the potential of ensemble methods, including RF and XGBoost, to build reliable and robust snow products in complex mountain environments.
The advantages of RF and gradient tree boosting in snow cover mapping tasks were also highlighted in a study by Panda et al. [23], where CART, SVM, gradient tree boosting, and RF algorithms were tested on the Google Earth Engine platform. Among them, gradient tree boosting demonstrated the best accuracy in both spatial and temporal aspects.
Machine learning algorithms, in particular RF, CART, and SVM, were also effectively used in a study by other authors [24] devoted to the analysis of seasonal changes in snow cover in the Suttle River basin. Among the models tested, the RF algorithm demonstrated the best accuracy, with an overall classification accuracy of 98.75%, surpassing CART (98.10%) and SVM (97.15%).
The application of XGBoost in forecasting snow processes was examined in detail in a study by Wang et al. [25], where a model for predicting snow drift phenomena was constructed using the XGBoost model and the interpretable SHAP approach.
This methodology was further developed in work by Iban and Bilgilioğlu [26], where XGBoost, NGBoost, and LightGBM algorithms were used to construct avalanche susceptibility maps in the province of Sondrio (Italy) based on 1880 avalanche events and 17 input factors. Among all models, XGBoost demonstrated the highest accuracy, identifying 19.31% of the territory as highly prone to avalanche hazards. The next most effective models were gradient boosting (GB), light gradient boosting (LightGBM), natural gradient boosting (NGBoost), random forest, and adaptive boosting (AdaBoost), which highlights the advantage of XGBoost in complex geospatial tasks. To interpret the model, the authors used the SHAP (Shapley additive explanations) method, which allowed them to assess the contribution of each factor to the probability of an avalanche. As a result, it was found that the most significant factors were altitude, maximum air temperature, and slope gradient. Higher altitude and steeper slopes increased the probability of an avalanche, while higher temperatures, on the contrary, reduced it.
In addition to local and static avalanche susceptibility models, increasing attention is being paid to dynamic seasonal analysis, which takes into account temporal changes in snow cover and climatic factors. Such approaches are particularly relevant for arid–cold regions, where avalanche formation is subject to the seasonal logic of snow accumulation and melting.
For example, ref. [27] examined seasonal patterns of avalanche susceptibility in the Western Tianshan Mountains (China). The authors applied three machine learning algorithms—support vector machine (SVM), RF, and K-nearest neighbor (KNN)—to model avalanche hazard in the winter and spring periods. Particular attention was paid to multifactorial analysis, including meteorological, snow, and orographic variables. The RF algorithm proved to be the most effective, achieving AUC = 0.91 in spring and 0.88 in winter.
A serious problem in the practice of avalanche susceptibility mapping remains the limited availability of observational data, especially in remote and poorly instrumented areas. Traditional machine learning methods typically require homogeneous and well-verified spatial data, which limits their applicability in regions with complex terrain and low density of meteorological observations.
This problem is reflected in a study by Liu et al. [28], which examined the application of four tree-based algorithms—CatBoost, LightGBM, RF, and XGBoost—to construct avalanche susceptibility maps in sparsely populated and poorly studied areas of the Tianshan Mountains (China). The CatBoost algorithm showed the highest accuracy and is a reliable tool for constructing vulnerability maps even with limited data. Variables such as distance to rivers, slope exposure, relative position on the slope, and precipitation proved to be particularly important for forecasts, underscoring the importance of the topographic and climatic context. In addition, the study used the SHAP method, which allowed for a quantitative assessment of the contribution of each factor at both the global and local levels. This increased the interpretability of the model and expanded its applicability in warning and spatial planning systems. Thus, ref. [28] demonstrated that tree-based algorithms adapted to work with heterogeneous data sources are capable of generating highly accurate avalanche information even with a limited observation base. This is particularly relevant for mountainous areas of Kazakhstan, Central Asia, and other regions with similar geographical and infrastructural constraints.
Similar conclusions were drawn by Mohanty et al. [29], who studied avalanche susceptibility in the Nubra-Shioq region of the northwestern Himalayas. The study used a wide range of eleven machine learning algorithms, including both classical ones (logistic regression, SVM, RF, GBM, Ada-Boost), and modern tree-based methods (XGBoost, LightGBM, CatBoost, and NGBoost). XGBoost once again confirmed its leadership, showing an AUC of 0.987 and an accuracy of 91%, with 19.549% of the region classified as a high avalanche susceptibility zone. Particular attention was paid to the local interpretation of the model using SHAP, which allowed precipitation, slope inclination, and distance to faults (DTF) to be identified as the three most significant factors in the XGBoost model. It was found that precipitation above 7.5 mm, slopes between 20° and 45°, and proximity to tectonic structures (less than 13 km) significantly increased the probability of an avalanche. Thus, the results of Mohanty et al. [29] confirmed that XGBoost remains one of the most reliable algorithms for complex geothermal conditions and that the use of XAI methods (in particular SHAP) significantly increases the interpretability and scientific reliability of avalanche susceptibility models.
The development of machine learning algorithms is also accompanied by a growing focus on optimizing the selection of input features, since the use of an excessively large or irrelevant set of factors can lead to overfitting, a decrease in the model’s generalizability, and a loss of interpretability. This problem is particularly relevant when analyzing avalanche susceptibility in regions with heterogeneous geomorphological conditions and high spatial variability of factors.
In order to improve the accuracy and stability of the models, ref. [30] proposed integrating the sequential backward selection (SBS) algorithm with one of the most effective tree-based models, CatBoost. The study was conducted in three catchment areas in the Swiss Alps using an extended avalanche database based on satellite observations. The integrated SBS–CatBoost approach provided very high classification accuracy (from 94 to 97%), demonstrating a linear relationship between basin size and prediction accuracy. Particular attention was paid to interpreting the results using SHAP analyses, which made it possible to assess the significance of each factor and its contribution to the model result.
Despite significant progress in creating highly accurate avalanche susceptibility models based on machine learning, one of the pressing challenges remains the integration of these models into practical decision support systems, especially in highly dynamic conditions, with limited time and human factors. This challenge was the subject of a study by Sykes et al. [31], in which three decision support models for mechanized ski touring in the Canadian mountains were developed and tested. An expert Bayesian network, as well as random forest and XGBoost ensemble algorithms, were used to build the models. The latter demonstrated the highest efficiency: 93.3% accuracy and AUC = 0.98, indicating the model’s high ability to accurately predict operational decisions based on a complex set of features, including topography, weather conditions, and guide behavior patterns.
In addition to avalanche risks caused by slopes and snow accumulation in mountainous areas, snow disasters in urbanized and transport zones are no less important an aspect of spatial modeling of snow hazards. One of the most significant areas of the modern approach has been the integrative use of diverse spatial data and interpretable machine learning models to assess snow risks in populated areas and transport corridors. This approach was successfully implemented in [32], where, using the example of a major snowstorm in Fukui Prefecture (Japan) in 2018, a system for identifying and spatially assessing snow disasters was developed using multisource data. Four machine learning models were used for the analysis: decision tree, RF, multilayer perceptron (MLP), and XGBoost, with the latter showing the best prediction accuracy (accuracy = 0.8225). Of particular value was the interpretation of the model using SHAP, which revealed key nonlinear relationships and threshold values affecting the vulnerability of territories to snow disasters. It was found that factors such as altitude above sea level, slope, road density, and road width had pronounced threshold effects.
Along with assessing avalanche susceptibility and analyzing the consequences of snow disasters, early avalanche forecasting remains a key area of contemporary research. This is particularly relevant in the context of the development of machine learning technologies capable of quickly processing diverse meteorological and snow data to develop preventive solutions. This approach was demonstrated in a study by Bohini et al. [33], which attempted to develop high-precision models for early avalanche detection based on ensemble algorithms. The study conducted a comparative assessment of the performance of models such as RF, gradient boosting, XGBoost, and neural networks, using metrics of accuracy, sensitivity, completeness, F1 score, and ROC curve. The results showed that XGBoost once again demonstrated its superiority, especially in terms of gradient boosting optimization by increasing resistance to unbalanced classes and efficiency with high-dimensional data.
Thus, in the context of growing demand for accuracy and reliability of avalanche hazard forecasts, systematic comparison of various machine learning algorithms becomes particularly important for selecting the optimal model adapted to the specifics of the region and available data. Against this backdrop, there is a pressing need to develop and test ensemble models capable of taking into account multiple geospatial and meteorological parameters while ensuring the interpretability and robustness of predictions.
The aim of this study is to compare the effectiveness of various machine learning algorithms (including random forest, gradient boosting, XGBoost, LightGBM, AdaBoost, and NGBoost) for constructing avalanche susceptibility maps using spatiotemporal geodata and meteorological parameters. The work includes a qualitative assessment of model performance using a number of metrics (recall, F1-score, true positive rate (recall)), with the aim of identifying the most stable and accurate algorithm capable of effectively detecting avalanche-prone areas.
The novelty of this work lies in a comprehensive comparative analysis of the performance of six modern machine learning algorithms (random forest, gradient boosting, XGBoost, LightGBM, AdaBoost, and NGBoost) as applied to the task of avalanche hazard assessment. Unlike most previous studies, which have been limited to the use of one or two algorithms, this work implements a unified approach to modeling, evaluation, and visualization, which made it possible to identify differences in the sensitivity and specificity of models to multifactorial input data. For the first time, quantitative verification of models was carried out using a whole range of metrics (recall, F1-score, true positive rate (recall)) on a single test data set. Another novelty is that real meteorological data and spatially referenced geofactors such as slope, exposure, altitude, and snow cover were used to train the models, which increases the practical significance of the research for monitoring and forecasting avalanche risks in mountainous regions of Kazakhstan and other countries.
3. Materials and Methods
This avalanche hazard study was conducted following the workflow presented in Figure 1.
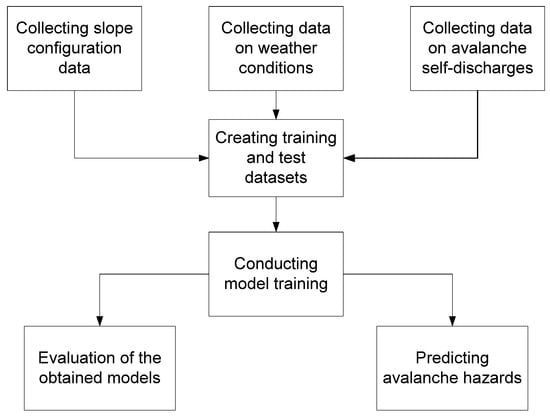
Figure 1.
Research workflow.
As illustrated in the presented workflow, our study included the following stages:
- (a)
- Data collection on slope configuration, weather conditions, and documented avalanche events.
- (b)
- Definition of training and test datasets for model development.
- (c)
- Model training using the following algorithms: XGBoost, random forest, gradient boosting, AdaBoost, LightGBM, and NGBoost.
- (d)
- Evaluation of the trained models and their subsequent application for avalanche hazard prediction.
These research stages are discussed in more detail below.
3.1. Data for Forecasting
For this study, we selected avalanche paths in the East Kazakh-stan region. Figure 2 shows a map of the locations of the avalanche paths selected for this study.
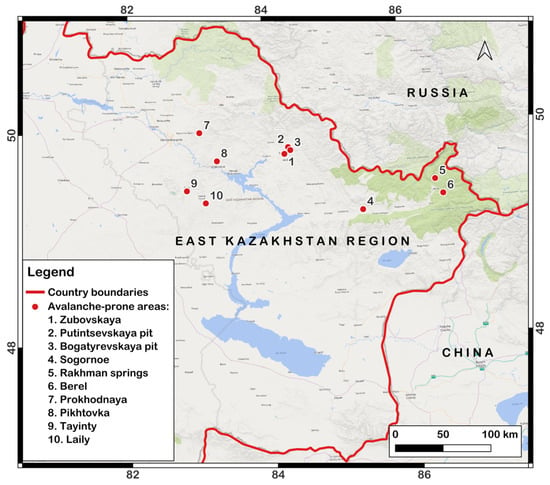
Figure 2.
Map showing the locations of avalanche barriers in the East Kazakhstan region.
Table 1 shows the characteristics of avalanche-prone areas in the East Kazakhstan region.

Table 1.
Characteristics of avalanche-prone areas.
To forecast avalanche danger in the avalanche paths of East Kazakhstan Region, we collected the following data:
- (a)
- Data on avalanche paths.
- (b)
- Temperature data for avalanche paths for the period from 2005 to 2025 [34].
- (c)
- Data on snow cover at the avalanche paths for the period from 2005 to 2025:
- -
- Average snow cover volume.
- -
- Maximum snow cover volume [34].
- (d)
- Data on rainfall volume on the avalanche paths area for the period from 2005 to 2025 [34].
- (e)
- Data on weather conditions on the avalanche paths area for the period from 2005 to 2025 [34].
- (f)
- Data on avalanche runs in the avalanche paths area for the period from 2012 to 2025 [34,35].
- (g)
- Data on slopes in the avalanche paths area (an example of slope parameters is provided in Figure S1):
- -
- Maximum and minimum elevation (height) of the slope—height of the point above sea level (or mean sea level).
- -
- Maximum and minimum slope steepness—a measure of the steepness of the slope surface in relation to the horizontal plane.
- -
- Average slope exposure in degrees—the orientation of the slope in relation to the cardinal points.
- -
- Maximum and minimum terrain ruggedness index (TRI)—an index that quantitatively describes the degree of variability in terrain elevation within a certain radius (vicinity) and shows how uneven (rugged) the surface is in a given area [36].
- -
- Maximum and minimum topographic position index (TPI)—an index that shows how much the elevation of a specific point differs from the average elevation of the points surrounding it [36].
- -
- Maximum and minimum profile curvature index—shows the curvature of the surface along the line of maximum slope.
- -
- Maximum and minimum plan curvature index—shows the curvature of the surface in the horizontal plane [36].
The initial meteorological data was obtained and processed from the official website of Kazhydromet [34].
3.2. Database for Forecasting
The aforementioned data were compiled into a database named “avalanchejournals” based on the MySQL 8.0 database management system. The following set of tables was created in the specified database:
- -
- collections—contained information about avalanche paths.
- -
- slopes—contained information about the parameters of slopes on each avalanche path.
- -
- temperatures—contained information about the temperature at the avalanche path on a specific date and time.
- -
- avg_temperatures—contained information about the average daily and ten-day temperature at the avalanche path on a specific date.
- -
- snows—contains information about the amount of snow cover at the avalanche path on a specific date and time.
- -
- rainfalls—contains information about rainfall in the avalanche path on a specific date.
- -
- weathers—contains information about weather conditions in the avalanche path on a specific date and time.
- -
- add_data—contains additional data about conditions in the avalanche path on a specific date.
Figure 3 shows a logical diagram of the created database.
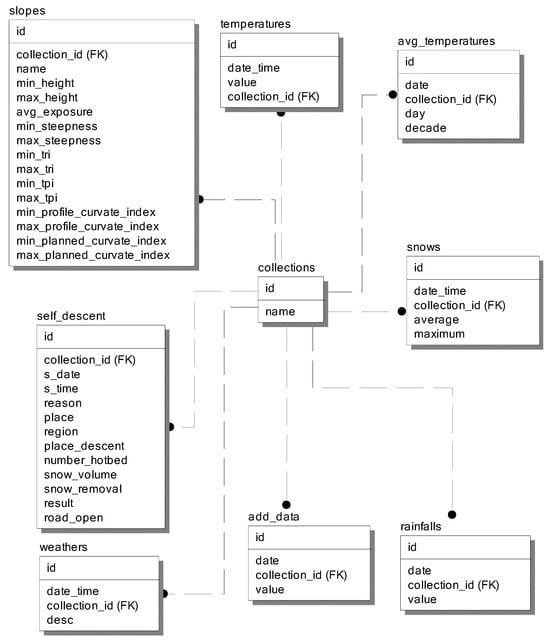
Figure 3.
Logical diagram of the database on avalanche barriers.
3.3. Avalanche Hazard Prediction Models
These machine learning algorithms were trained on data collected from the database described above.
Data sampling for the training and test sets. To obtain data for the training and test sets, we created a series of queries to the database described above.
First, we created a virtual temporary table, v_data, into which we added data on weather conditions (temperature, snow cover level, precipitation level) at avalanche paths with reference to dates. Figure S2 shows the text for creating this virtual table.
Next, we linked the weather data for avalanche paths with the slope parameters for avalanche paths. To do this, we created a virtual temporary table, v_model_data, the creation of which is shown in Figure S3.
Finally, we extracted data from the v_model_data table by date and avalanche paths where avalanches were recorded. In our case, we took data for 3 days before and 3 days after the avalanches. The listing for this query is shown in Figure S4.
As can be seen from the query in Figure S4, we extracted the following data from the database:
- -
- min_height—minimum elevation (height) of the slope.
- -
- max_height—maximum elevation (height) of the slope.
- -
- avg_exposure—average exposure of the slope.
- -
- min_steepness—minimum slope steepness.
- -
- max_steepness—maximum slope steepness.
- -
- min_tri—minimum terrain roughness index TRI.
- -
- max_tri—maximum terrain roughness index TRI.
- -
- min_tpi—minimum topographic position index TPI.
- -
- max_tpi—maximum topographic position index TPI.
- -
- min_profile_curvate_index—minimum profile curvature index.
- -
- max_profile_curvate_index—maximum profile curvature index.
- -
- min_planned_curvate_index—minimum planned curvature index.
- -
- max_planned_curvate_index—maximum planned curvature index.
- -
- rainfalls_value—rainfall volume in the avalanche path.
- -
- snow_average—average snow depth in the avalanche path.
- -
- snow_maximum—maximum snow depth in the avalanche path.
- -
- temperature_value—temperature in the avalanche path.
The dataset used for model training was subsequently divided into two subsets:
- -
- Training set—data for the period up to 2024.
- -
- Test set—data for the period from 2024 onwards.
This study used the resulting dataset to evaluate the quality of machine learning algorithms. The data were obtained from the database presented above based on queries (Figures S2–S4). The goal was to determine the relevance of indicators based on the use of decision trees as a base model and other known measures of dependence in various data configurations.
4. Results and Discussion
The selected algorithms were implemented using standard Python machine learning libraries. Table 2 presents the Python libraries that were used for model training in our study.
Table 2.
Python libraries.
Using these libraries, we trained the models on a dedicated server equipped with an eight-core processor operating at 2.3 GHz and 16 GB of RAM. The model training was performed with the following parameters (the parameter values were selected based on the highest model performance scores, which are presented in Table 3).
Table 3.
Assessment of the quality of the models obtained.
- (a)
- The following configuration was used to train the XGBoost algorithm:
XGBClassifier (objective = ‘binary:logistic’, eval_metric = ‘logloss’, n_estimators = 10,000, max_depth = 5, learning_rate = 0.05)
After training the model, a decision tree was obtained, which is presented in Figure S5.
- (b)
- The following configuration was used to train the random forest algorithm:
RandomForestClassifier (n_estimators = 1500, random_state = 42, criterion = ‘log_loss’, max_depth = 15)
After training, an ensemble of decision trees was generated, one of which is shown in Figure S6.
- (c)
- The following configuration was used to train the gradient boosting algorithm:
GradientBoostingClassifier (n_estimators = 5000, learning_rate = 0.01, max_depth = 10, random_state = 42)
After training the model, a bunch of decision trees were obtained, one of which is shown in Figure S7.
- (d)
- The following configuration was used to train the AdaBoost algorithm:
AdaBoostClassifier (estimator = DecisionTreeClassifier (max_depth = 10), n_estimators = 5000, learning_rate = 0.01, random_state = 42)
After training, an ensemble of decision trees was generated, one of which is shown in Figure S8.
- (e)
- The following configuration was used to train the LightGBM algorithm:
LGBMClassifier (objective = ‘binary’, n_estimators = 5000, learning_rate = 0.01, max_depth = −1, random_state = 42)
After training, an ensemble of decision trees was generated, one of which is shown in Figure S9.
- (f)
- The following configuration was used to train the NGBoostAdaBoost algorithm:
NGBClassifier (n_estimators = 5000, learning_rate = 0.01)
After training, an ensemble of decision trees was generated, one of which is shown in Figure S10.
Next, the quality of the models above was assessed. The following indicators were chosen to evaluate quality:
- (a)
- Accuracy—the proportion of correctly predicted classes among all samples.
- (b)
- Precision—the proportion of correctly predicted positive classes among all samples.
- (c)
- True positive rate (recall)—the proportion of correctly predicted positive classes among all positive samples.
- (d)
- F1-score—the harmonic mean between precision and true positive rate (recall).
These indicators were determined for the following categories:
- (a)
- Event: “no avalanche occurred”—to determine how accurately the event that an avalanche will not occur is predicted.
- (b)
- Event: “an avalanche occurred”—to determine how accurately the event that an avalanche will occur is predicted.
- (c)
- Macroaveraging—arithmetic mean of the metric for each class.
- (d)
- Weighted averaging—weighted mean of the metric by class weight.
The data obtained on the quality assessment of the models is presented in Table 3.
As can be seen from the table, the quality of the models obtained was mostly over 70%, with only the random forest algorithm scoring 67%. The gradient boosting algorithm showed the highest accuracy at 73.89%.
It can also be seen that the prediction accuracy for the event “no avalanche occurred” was over 70% for all models. For the event “an avalanche occurred”, the accuracy indicator was lower, at around 40%, and for the random forest algorithm, this indicator was less than 10%.
The average accuracy for both events ranged from 41 (random forest) to 63% (LGBM). The weighted average for the algorithms ranged from 57 (random forest) to 72% (LGBM).
Similarly, a ROC curve was constructed for each model to assess the quality of the models obtained (Figure 4).
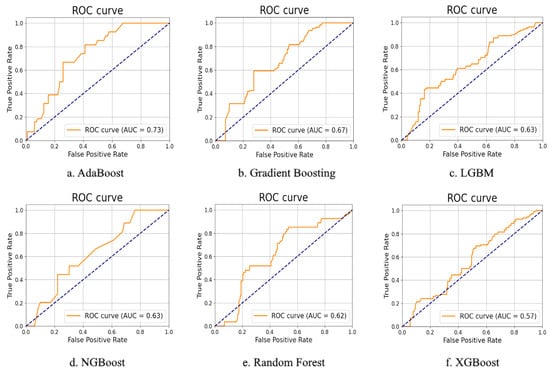
Figure 4.
ROC curve for algorithms. The blue dashed line indicates the ROC curve for random guessing. It is used to visually determine that the obtained model has predictive capabilities.
The AUC value for each algorithm was greater than 0.5, which indicates that the algorithms can be used for prediction. The highest AUC values were achieved by the AdaBoost (0.73) and gradient boosting (0.67) algorithms, and the lowest, by the XGBoost algorithm (0.57). The remaining algorithms yielded values in the range of 0.62–0.63.
Based on the trained models, we also assessed the importance of the indicators we selected for predicting avalanche danger. The importance of indicators for the decision tree model was determined based on the contribution of a certain indicator to improving the quality of the division at each node of the tree. The importance of all indicators was normalized so that the sum of all importance indicators for the model was 1.
As part of the study, we used the importance values of the indicators that were determined using the corresponding Python libraries for the specified models. As a result, we obtained the importance indicators for our models, which are presented in Table 4.
Table 4.
The importance of indicators for assessing avalanche danger.
A diagram showing the indicators is provided for each model obtained in Figure S11.
The forecasts obtained using these six decision tree algorithms show that temperature values in the range from −32 to 14 °C and snow cover height in the range from 2 to 14 m were the most significant parameters influencing avalanche spontaneity. Among the indicators that characterize the slope profile, the most significant were the minimum and maximum slope values.
To assess the impact of the features on the final output of the developed models, we employed the SHAP methodology. For this evaluation, we used the Python library shap (version 0.48.0). Using this library, we performed assessments for each model on the test dataset. The obtained results were averaged by calculating the mean absolute SHAP values for each feature. The results of these calculations are presented in Table 5.
Table 5.
Mean absolute SHAP values.
From the presented table, it can be seen that the main factors influencing the value were temperature, snow cover depth, and minimum slope elevation.
5. Conclusions
This article presents the results of applying six machine learning algorithms (XGBoost, random forest, gradient boosting, AdaBoost, LightGBM, and NGBoost) to predict avalanche danger in the avalanche paths of the East Kazakhstan region. To train these algorithms, we collected data on avalanche path profiles, meteorological data on avalanche paths, and information on avalanche runs at these basins. Based on this data, we trained the models we selected.
After training the machine learning models, we evaluated the quality of the trained models. To evaluate the quality of the models, we used the criteria of accuracy, precision, true positive rate (Recall), and F1-score. The obtained values showed that the models had sufficient prediction accuracy, on average about 60–70%. In addition, to evaluate the quality of the constructed machine learning models, we constructed ROC curves for each model. The AUCs of the constructed ROC curves (from 0.57 to 0.73) also showed that the obtained models can be used to construct avalanche hazard forecasts.
Feature importance analysis revealed that temperature and snow cover level were the most influential predictors of avalanche occurrence on avalanche formation. Among the indicators that determine the slope profile, the most significant were the minimum and maximum slope elevation indicators.
In the future, further research may focus on improving model hyperparameter tuning methods using more advanced approaches, such as Bayesian optimization or genetic algorithms, as well as on integrating the models with streaming data for real-time validation and developing interactive dashboards for avalanche hazard monitoring.
Supplementary Materials
The following supporting information can be downloaded at: https://www.mdpi.com/article/10.3390/a18080505/s1. Figure S1. Morphometric data of the slopes of the Layla site; Figure S2. Data selection for table v_data; Figure S3. Data selection for the v_model_data table; Figure S4. Request for data sampling for training purposes; Figure S5. Decision tree of XGBoost algorithm; Figure S6. Decision tree of Random Forest algorithm; Figure S7. Decision tree of Gradient Boosting algorithm; Figure S8. Decision tree of AdaBoost algorithm; Figure S9. Decision tree of LightGBM algorithm; Figure S10. Decision tree of NGBoost algorithm; Figure S11. Importance of indicators.
Author Contributions
Conceptualization, N.D. and G.D.; methodology, N.D., Y.F. and S.R.; software, Y.F.; validation, N.D., Y.F. and R.C.; formal analysis, G.D.; investigation, Y.F.; resources, N.D. and G.D.; data curation, N.D. and Y.F.; writing—original draft preparation, Y.F.; writing—review and editing, Y.F. and R.C.; visualization, Y.F. and S.R.; supervision, N.D.; project administration, N.D.; funding acquisition, N.D. All authors have read and agreed to the published version of the manuscript.
Funding
The article presents the results of scientific research obtained during the implementation of scientific and technical program of Committee of Science of the Ministry of Science and Higher Education of the Republic of Kazakhstan BR21882022 on the topic “Research of avalanche activity in the East Kazakhstan region for development of monitoring systems and scientific substantiation of their placement” within the framework of program-targeted financing.
Data Availability Statement
Data are contained within the article. The data presented in this study are available from the corresponding author upon reasonable request.
Conflicts of Interest
The authors declare no conflict of interest.
References
- Rakhymberdina, M.; Levin, E.; Daumova, G.; Denissova, N.; Bekishev, Y.; Assylkhanova, Z. Kapasov A Combined Remote Sensing and GIS Method for Detecting Avalanches in Eastern Kazakhstan. ES Energy Environ. 2024, 26, 1350. [Google Scholar] [CrossRef]
- Aydin, H.E.; Iban, M.C. Predicting and analyzing flood susceptibility using boosting-based ensemble machine learning algorithms with SHapley Additive exPlanations. Nat. Hazards 2023, 116, 2957–2991. [Google Scholar] [CrossRef]
- Hayder, I.M.; Al-Amiedy, T.A.; Ghaban, W.; Saeed, F.; Nasser, M.; Al-Ali, G.A.; Younis, H.A. An Intelligent Early Flood Forecasting and Prediction Leveraging Machine and Deep Learning Algorithms with Advanced Alert System. Processes 2023, 11, 481. [Google Scholar] [CrossRef]
- Rajab, A.; Farman, H.; Islam, N.; Syed, D.; Elmagzoub, M.A.; Shaikh, A.; Akram, M.; Alrizq, M. Flood Forecasting by Using Machine Learning: A Study Leveraging Historic Climatic Records of Bangladesh. Water 2023, 15, 3970. [Google Scholar] [CrossRef]
- Tehrani, F.S.; Calvello, M.; Liu, Z.; Zhang, L.; Lacasse, S. Machine learning and landslide studies: Recent advances and applications. Nat. Hazards 2022, 114, 1197–1245. [Google Scholar] [CrossRef]
- Liu, Y.-L.; Yin, H.-D.; Xiao, T.; Huang, L.; Cheng, Y.-M. Dynamic Prediction of Landslide Life Expectancy Using Ensemble System Incorporating Classical Prediction Models and Machine Learning. Geosci. Front. 2024, 15, 101758. [Google Scholar] [CrossRef]
- Song, M.-S.; Lee, J.-J.; Yun, H.-S.; Yum, S.-G. Projection and identification of vulnerable areas due to heavy snowfall using machine learning and K-means clustering with RCP scenarios. Clim. Serv. 2024, 33, 100440. [Google Scholar] [CrossRef]
- Lin, S.; Liang, Z.; Guo, H.; Hu, Q.; Cao, X.; Zheng, H. Application of machine learning in early warning system of geotechnical disaster: A systematic and comprehensive review. Artif. Intell. Rev. 2025, 58, 168. [Google Scholar] [CrossRef]
- Wang, Q.; Luan, S.; Jiang, J.; Chen, Y.; Liu, S. A multi-objective optimization framework for mudflow susceptibility mapping in the Yanshan Mountains: Integrating nondominated sorting genetic algorithm-II, random forest, and gradient boosting decision trees. Phys. Fluids 2025, 37, 076613. [Google Scholar] [CrossRef]
- Pugliese Viloria, A.d.J.; Folini, A.; Carrion, D.; Brovelli, M.A. Hazard Susceptibility Mapping with Machine and Deep Learning: A Literature Review. Remote Sens. 2024, 16, 3374. [Google Scholar] [CrossRef]
- Viallon-Galinier, L.; Hagenmuller, P.; Eckert, N. Combining modelled snowpack stability with machine learning to predict avalanche activity. Cryosphere 2023, 17, 2245–2260. [Google Scholar] [CrossRef]
- Kayhan, E.C.; Ekmekcioğlu, Ö. Coupling Different Machine Learning and Meta-Heuristic Optimization Techniques to Generate the Snow Avalanche Susceptibility Map in the French Alps. Water 2024, 16, 3247. [Google Scholar] [CrossRef]
- Denissova, N.; Nurakynov, S.; Petrova, O.; Chepashev, D.; Daumova, G.; Yelisseyeva, A. Remote Sensing Techniques for Assessing Snow Avalanche Formation Factors and Building Hazard Monitoring Systems. Atmosphere 2024, 15, 1343. [Google Scholar] [CrossRef]
- Park, M.-H.; Hur, J.-J.; Lee, W.-J. Prediction of diesel generator performance and emissions using minimal sensor data and analysis of advanced machine learning techniques. J. Ocean Eng. Sci. 2025, 10, 150–168. [Google Scholar] [CrossRef]
- Iordache, G.; Suciu, G.; Trufin, D.A.; Segarceanu, S.; Petrescu, G. Algorithms and parameters for avalanche prediction—A review. In Proceedings of the 13th International Conference on Electronics, Computers and Artificial Intelligence (ECAI), Pitesti, Romania, 1–3 July 2021; pp. 1–5. [Google Scholar] [CrossRef]
- Khan, D.; Akram, W.; Ullah, S. Enhancing landslide susceptibility predictions with XGBoost and SHAP: A data-driven explainable AI method. Geocarto Int. 2025, 40, 2514725. [Google Scholar] [CrossRef]
- Meena, S.R.; Hussain, M.A.; Ullah, H. Landslide susceptibility mapping using hybrid machine learning classifiers: A case study of Neelum Valley, Pakistan. Bull. Eng. Geol. Env. 2025, 84, 242. [Google Scholar] [CrossRef]
- Mayer, S.; van Herwijnen, A.; Techel, F.; Schweizer, J. A random forest model to assess snow instability from simulated snow stratigraphy. Cryosphere 2022, 16, 4593–4615. [Google Scholar] [CrossRef]
- Rahmati, O.; Ghorbanzadeh, O.; Teimurian, T.; Mohammadi, F.; Tiefenbacher, J.P.; Falah, F.; Pirasteh, S.; Ngo, P.-T.T.; Bui, D.T. Spatial Modeling of Snow Avalanche Using Machine Learning Models and Geo-Environmental Factors: Comparison of Effectiveness in Two Mountain Regions. Remote Sens. 2019, 11, 2995. [Google Scholar] [CrossRef]
- Yang, J.; Jiang, L.; Luojus, K.; Pan, J.; Lemmetyinen, J.; Takala, M.; Wu, S. Snow depth estimation and historical data reconstruction over China based on a random forest machine learning approach. Cryosphere 2020, 14, 1763–1778. [Google Scholar] [CrossRef]
- Liu, Y.; Yang, J.; Chen, X.; Yao, J.; Li, L.; Qiu, Y. Moderate-resolution snow depth product retrieval from passive microwave brightness data over Xinjiang using machine learning approach. International. J. Digit. Earth 2024, 17, 2299208. [Google Scholar] [CrossRef]
- Yan, Y.; Qin, Y.; Liu, Y.; Qiu, Y.; Liu, Y. Estimation of Moderate-Resolution Snow Depth in Xinjiang with Enhanced-Resolution Passive Microwave and Reanalysis Data by Machine Learning Methods. IEEE J. Sel. Top. Appl. Earth Obs. Remote Sens. 2025, 18, 11250–11262. [Google Scholar] [CrossRef]
- Panda, S.; Anilkumar, R.; Balabantaray, B.K.; Chutia, D.; Bharti, R. Machine Learning-Driven Snow Cover Mapping Techniques using Google Earth Engine. In Proceedings of the IEEE 19th India Council International Conference (INDICON), Kochi, India, 24–26 November 2022; pp. 1–6. [Google Scholar] [CrossRef]
- Gogineni, A.; Chintalacheruvu, M.R. Assessing temporal snow cover variation in the Sutlej river basin using google earth engine and machine learning models. Earth Sci. Inform. 2024, 17, 455–473. [Google Scholar] [CrossRef]
- Wang, F.; Wang, X.; Li, S. Explainable machine learning for predictive modeling of blowing snow detection and meteorological feature assessment using XGBoost-SHAP. PLoS ONE 2025, 20, e0318835. [Google Scholar] [CrossRef]
- Iban, M.C.; Bilgilioğlu, S.S. Snow avalanche susceptibility mapping using novel tree-based machine learning algorithms (XGBoost, NGBoost, and LightGBM) with eXplainable Artificial Intelligence (XAI) approach. Stoch. Environ. Res. Risk Assess. 2023, 37, 2243–2270. [Google Scholar] [CrossRef]
- Yang, J.; He, Q.; Liu, Y. Winter–Spring Prediction of Snow Avalanche Susceptibility Using Optimisation Multi-Source Heterogeneous Factors in the Western Tianshan Mountains, China. Remote Sens. 2022, 14, 1340. [Google Scholar] [CrossRef]
- Liu, Y.; Chen, X.; Yang, J.; Li, L.; Wang, T. Snow avalanche susceptibility mapping from tree-based machine learning approaches in ungauged or poorly-gauged regions. Catena 2023, 224, 106997. [Google Scholar] [CrossRef]
- Mohanty, A.; Srivastava, P.; Agrawal, S. Novel Tree-Based Machine Learning Algorithms for Terrain-Based Snow Avalanche Susceptibility Mapping of NW Himalaya, India; SSRN: Rochester, NY, USA, 2024. [Google Scholar] [CrossRef]
- Cetinkaya, S.; Kocaman, S. Integrating Sequential Backward Selection (SBS) and CatBoost for Snow Avalanche Susceptibility Mapping at Catchment Scale. ISPRS Int. J. Geo-Inf. 2024, 13, 312. [Google Scholar] [CrossRef]
- Sykes, J.; Haegeli, P.; Atkins, R.; Mair, P.; Bühler, Y. Development of operational decision support tools for mechanized ski guiding using avalanche terrain modeling, GPS tracking, and machine learning. Nat. Hazards Earth Syst. Sci. 2025, 25, 1255–1292. [Google Scholar] [CrossRef]
- Yang, Z.; Gokon, H.; Yu, Q. Machine learning-based identification and assessment of snow disaster risks using multi-source data: Insights from Fukui prefecture. Prog. Disaster Sci. 2025, 26, 100426. [Google Scholar] [CrossRef]
- Bohini, A.; Sreeya, B.; Sai, C.P.; Saturi, R.; Priyabhashini, K. Early Avalanche Detection Using Ensemble Learning Techniques. In Proceedings of the 2024 2nd World Conference on Communication & Computing (WCONF), Raipur, India, 12–14 July 2024; pp. 1–12. [Google Scholar] [CrossRef]
- Kazhydromet. Climate of Kazakhstan. Available online: https://www.kazhydromet.kz/en/klimat/klimat-kazahstana (accessed on 15 July 2025).
- Rakhymberdina, M.; Denissova, N.; Bekishev, Y.; Daumova, G.; Konečný, M.; Assylkhanova, Z.; Kapasov, A. Investigation of the Regularities of the Influence of Meteorological Factors on Avalanches in Eastern Kazakhstan. Atmosphere 2025, 16, 723. [Google Scholar] [CrossRef]
- Girohi, P.; Bhardwaj, A. A Neural Network-Based Fusion Approach for Improvement of SAR Interferometry-Based Digital Elevation Models in Plain and Hilly Regions of India. AI 2022, 3, 820–843. [Google Scholar] [CrossRef]
Disclaimer/Publisher’s Note: The statements, opinions and data contained in all publications are solely those of the individual author(s) and contributor(s) and not of MDPI and/or the editor(s). MDPI and/or the editor(s) disclaim responsibility for any injury to people or property resulting from any ideas, methods, instructions or products referred to in the content. |
© 2025 by the authors. Licensee MDPI, Basel, Switzerland. This article is an open access article distributed under the terms and conditions of the Creative Commons Attribution (CC BY) license (https://creativecommons.org/licenses/by/4.0/).