Abstract
Power grid infrastructures, essential to modern societies for electricity distribution, are prone to vulnerabilities due to their numerous sensitive components, necessitating a comprehensive risk assessment. Uncertainty in historical failure data often compromises accurate risk quantification, leading to the integration of expert elicitation as a solution. This study develops a Bayesian network (BN) risk assessment model integrated with fuzzy set theory (FST), referred to as the fuzzy Bayesian network (FBN). By incorporating expert insights, this model quantifies internal and external risk variables more comprehensively. Crisp probabilities (CPr), derived from regional transmission operator (RTO) failure incident data, are complemented by fuzzy probabilities (FPr) from expert elicitation. The findings indicate that equipment conditions, specifically transmission lines and circuit breakers, are critical threats to power grids. Environmental factors, particularly storms, emerge as vulnerability risks. A comparison of results using both CPr plus FPr versus FPr alone underscores the utility of expert elicitation in risk assessment. This research demonstrates the effectiveness of FBNs through expert elicitation, providing a comprehensive and accurate framework for power grid risk assessment. To improve risk evaluation in critical infrastructure, integrated data collection techniques are recommended.
1. Introduction
Electricity has a major role and significant impact on modern life activities. Various economic sectors worldwide depend heavily on the electric power industry, and generated energy is used to meet industry and domestic needs [1]. Due to large-scale urbanization and settlement, electricity demand has increased, and maintaining power is crucial for everyday life and economic vitality [2]. Critical power infrastructure, also known as the power grid, is required to generate and distribute electricity based on four fundamental functions, i.e., electricity generation, transmission, distribution, and finally, consumption by end users [3]. These critical infrastructures are susceptible to various natural and man-made risks that threaten their integrity [4]. Natural hazards include weather-related factors, such as rainfall, high winds, and extreme temperatures, and environmental factors, such as earthquakes, storms, fires, lightning, tornadoes, and vegetation [5,6]. There are numerous man-made risk factors, such as operational parameters, which include maintenance issues, disconnects, current flow, voltage level, and power factors [2]. Equipment conditions are also critical for assessing the associated risks, and commonly known equipment failures include malfunctioning capacitors, transformers, circuit breakers, generators, reactors, and transmission lines. Some specialized risk factors also threaten the reliability of power grids, including cyberattacks, unauthorized access, and the failure of the supervisory control and data acquisition (SCADA) system [7]. These potential risks are severe concerns for operating agencies and all stakeholders, potentially leading to prolonged blackouts that could have a significant impact on the country’s economy. One of the motivations for conducting this study is the recent blackout in Europe, particularly in Spain and Portugal, which underscores the importance and timeliness of power grid risk assessment and resilience. This event, which affected millions of people across the region, emphasizes the practical relevance of the proposed model, underscoring the need for enhanced infrastructure resilience in the face of such widespread failures [8,9]. Similarly to these, the blackout serves as a reminder of the vulnerabilities in power grids. Furthermore, it underscores the need for advanced risk assessment approaches, such as the fuzzy Bayesian network model proposed in this study, to more accurately predict and mitigate the effects of future failures. There are numerous techniques to quantify these risk factors and suggest mitigation measures. One of these promising methods is the quantitative risk assessment approach (QRA), which is commonly used when adequate historical data for past failure incidents are available [10]. The most commonly known QRA methods are fault tree analysis (FTA), event tree analysis (ETA), Monte Carlo simulation (MCS), and Bayesian networks (BNs) [11]. In newly developed or less-documented infrastructures, historical data may be unavailable or unreliable due to certain inherent factors, such as incomplete maintenance records [12]. Qualitative risk assessment techniques are often used in power grid risk assessment to evaluate potential risks and vulnerabilities objectively. These methods may not provide precise numerical values but offer valuable insights into risk characteristics and help prioritize future analyses [13]. A few commonly known qualitative risk assessment techniques are failure modes and effects analysis (FMEA), risk matrices, bowtie analysis, the Delphi method, and expert elicitation [14]. These techniques convert qualitative data into quantitative numbers, and risk is assessed for the facility under consideration [15]. Researchers have conducted numerous studies to assess the risks posed to power grids by suggesting mitigation strategies for the stability of power flow to end users. In the next paragraph, a few important studies are discussed, followed by the research gap and focus of this research.
Using the QRA approach, Li et al. [16] proposed a model using hierarchical Bayesian analysis (HBA) to quantify the risks associated with submarine pipelines. The methodology used accounts for uncertainty in the data and model, and an industrial case study is used to demonstrate the use of this approach. Borenius et al. [15] adopted a qualitative risk assessment approach and conducted expert interviews across Europe and the US to identify significant risks to power grids. Based on the results, it is concluded that false data injection, denial of services, and malware attacks are significant threats. Dong et al. [17] proposed a risk assessment model combining the data-driven analytical hierarchy process (D-AHP) and grey theory for smart grids. To obtain comprehensive assessment values and risk grades, 5 first-level and 13 second-level indices were combined using an empirical dataset for the Suzhou Smart Grid Demonstration Project in China. To evaluate the impact of cyber systems on power grid dispatching systems, Chen et al. [18] proposed a risk assessment model and calculated the power grid risk probabilities and consequences through risk index levels. To highlight the IT vulnerabilities and cyber threats to power grids, Canbolat et al. [19] proposed a hybrid risk assessment model using fuzzy theory. This study provides meaningful insights into ensuring power grid stability by combining linguistic and numerical analyses. Zhu et al. [20] proposed a novel approach for accessing cascading failure sequences in AC/DC hybrid power grids using a game model and quantitative indices. Although the model was validated on China’s provincial AC/DC hybrid power grid, its scalability and practical implications must be considered. By applying graph theory to identify the communities at risk of power loss due to wildfires, Jones et al. [21] proposed a novel approach. Fire probability data and betweenness centrality and minimum cut analyses highlight vulnerable areas. Potential limitations to the method include the difficulty of practical implementation and the need for further validation with larger, more complex grids. Bian et al. [22] proposed an innovative technique for assessing and mitigating risks in large-scale power grids, specifically transmission line trips caused by natural hazards. The proposed risk analysis method combines FTA and BN modeling to assess and predict tripping accidents caused by wildfires, lightning, strong winds, and ice storms. However, real-world interactions and uncertainties may be distorted by modeling simplifications. In recent years, several methodologies have been proposed to assess risks in power grid systems, such as intelligent inspection models based on edge computing (e.g., RepYOLO for power line inspection) and data collection protocols for smart grids [23]. These approaches primarily focus on improving operational efficiency and security in specific aspects of grid management, such as data integrity and defect detection. Additionally, studies like the one focusing on cascading failures through risk-graph analysis examine network vulnerabilities but fail to address the probabilistic nature of uncertainty and expert elicitation, which is critical for effective risk management [24]. Our work proposes a novel fuzzy Bayesian network approach that integrates expert opinions and weather-related risks, providing a more comprehensive model for assessing power grid vulnerabilities, including the impact of cascading failures and external disturbances.
After conducting a detailed literature review, we confidently state that while previous research has addressed significant threats to power grid systems, most studies focus primarily on a limited range of risks. In particular, cyber threats and transmission line failures are often the primary areas of concern, leaving many other potential risks underexplored. To highlight the practical significance and relevance of our proposed risk assessment model, we compare it with existing methods from the recent literature. These methods, which include power line intelligent inspection, secure data collection in smart grids, and cascading failure vulnerability analysis, focus on different aspects of infrastructure risk. Although these methods provide valuable insights, they focus on specific types of risks or heavily rely on historical data and traditional engineering models. In contrast, our proposed model offers a more comprehensive approach by integrating FBNs and expert elicitation. Our model identifies a broader range of risk factors, including equipment failure, human error, and weather-related risks such as extreme temperatures, flooding, and lightning. Including these weather-related factors, which are increasingly critical for infrastructure resilience, provides a more holistic view of risk. Through this comparison, we demonstrate that our methodology offers enhanced adaptability, precision, and reliability in assessing the risks to power grid systems, proving its practical significance and superiority over existing approaches. Additionally, the lack of historical data and the vagueness of existing datasets can lead to under- or overestimating risk assessments [25]. Furthermore, due to the unavailability of incident data for certain risk factors, such as floods or earthquakes, existing models may struggle to generate results when new threats emerge.
To bridge these gaps, this study combines fuzzy set theory (FST) through expert elicitation and the BN, commonly known as the fuzzy Bayesian network (FBN). The BN incorporates fuzzy logic because it aligns with the intricacies and uncertainties inherent to power grid systems, giving it distinct advantages [26]. Expert elicitation will provide a more comprehensive risk assessment, accounting for external and internal factors [27]. Using the BN, ongoing risk assessment will remain relevant, and the model will be updated as new evidence is acquired. Integrating an FBN in this study enables a comprehensive risk assessment of power grids by combining quantitative data and expert opinions. Due to changing environmental conditions, evolving cyber threats, and the dynamic nature of power grids, the FBN is exceptionally well suited for handling imprecise, incomplete, or uncertain information, which is common in power grid risk assessments [28]. Another novelty of this study is that it compares root causes, also known as basic events (BEs), identified through expert elicitation with those identified through historical data only.
Expert opinions gathered through surveys enhance the efficacy of this risk assessment model. These insights provide valuable complements to the quantitative data, making them essential for a comprehensive understanding of power grid risks. Applying this methodology enhances the comprehensiveness of our risk assessment and ensures that our findings benefit the stakeholders involved in ensuring power grid stability and security.
The remainder of this paper is organized as follows: Section 2 provides an overview of the fuzzy Bayesian network (FBN), introducing Bayesian networks, fuzzy set theory, and the role of expert elicitation in risk assessment. Section 3 outlines the methodology for applying the FBN to power grid risk assessment, detailing the identification of risk factors, data collection, and the construction of the FBN. Section 4 presents the model implementation using both crisp and fuzzy probabilities to assess power grid risks. Section 5 discusses the results, including a comparison of models and a sensitivity analysis. Finally, Section 6 concludes the paper, summarizing the findings and suggesting directions for future research.
2. Overview of the FBN
2.1. Bayes’ Theorem and the BN
The BN is based on the Bayes theorem presented by Thomas Bayes in the 18th century. The main concept of the Bayes theorem revolves around addressing the uncertainty encountered in daily life [29]. It can be used to determine the probability of an event based on the occurrence of a previous event. The Bayes theorem is a fundamental principle of probability theory underpinning the BN to update the probability of a variable based on evidence from its parent node, making it valuable for decision-making and machine-learning applications [22]. The Bayes theorem can be expressed using Equation (1).
In Equation (1), P(A) is the probability of event A, P(B) is the probability of event B, P(B/A) is the probability of event B given that event A has already occurred, and P(A/B) is the probability of event A given that event B has already occurred.
BNs are mathematical models representing the causal relationship for different risk variables using CPTs. In a BN, nodes are connected through directed acyclic graphs (DAGs), and edges represent causal relationships between risk variables [30]. A variable’s probability can be updated based on the new evidence that the parent’s node acquired. The BN approach is a powerful tool for modeling complex systems, decision-making, and machine-learning applications where updating probabilities in response to updated information is crucial to the model’s accuracy [31]. A simple description of the BN is shown in Figure 1. Nodes A, B, and C are parent nodes or BEs, Nodes X and Y are child nodes, also known as intermediate events (IEs), and Node Z is the top event (TE) or the outcome of this network.
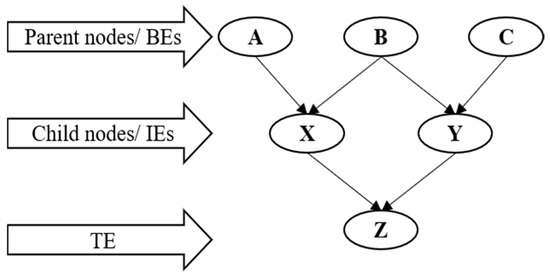
Figure 1.
A sample BN structure with a causal relationship among different risk levels.
2.2. Expert Elicitation
Expert elicitation is a crucial element in power grid risk assessment, enabling the quantification of uncertainty and imprecision associated with various factors [32]. Power grids are complex and influenced by multiple risk factors, including component reliability, environmental conditions, and external factors, which are not fully captured by historical data alone. Expert elicitation enables the incorporation of subjective judgments from individuals with extensive experience and knowledge in the power grid sector [33].
To ensure the reliability of the expert inputs and minimize potential biases, we have carefully selected domain experts based on specific attributes that are important for providing accurate insights into the risk factors associated with power grid failures. The experts selected for this study are based on position, experience, education, and age. The roles of the experts within the industry, including senior engineers, risk analysts, and safety specialists, are considered. Seniority in the field serves as a proxy for experience and depth of knowledge in power grid risk management. A higher weight is assigned to those with more experience in power grid integrity, failure modes, and risk mitigation. Educational qualification is another critical factor, as experts with advanced degrees (e.g., M.S. or Ph.D.) in relevant fields, such as risk management, are more likely to be aware of existing and emerging threats. Although age is not a direct measure of expertise, age is included as a rough indicator of career length and accumulated knowledge in the industry. Experts with a balance of practical field experience and academic grounding are more professional and give an added advantage. The scoring system ensures that all attributes are considered proportionately while minimizing subjective biases in the selection process. For position, the score varies from 1 to 5, with 5 representing the highest level of expertise (e.g., senior manager or director). The score for experience also varies from 1 to 5, with 5 indicating more than 20 years of experience in the power industry. For education, scores range from 1 to 5, with 5 representing a Ph.D. or equivalent in a relevant field. Lastly, the score for age ranges from 1 to 5, with 5 indicating 50 years of age or older. The total score for each expert was computed as the sum of the individual scores, normalized to ensure consistency across the expert pool.
2.3. Fuzzy Set Theory
Fuzzy set theory (FST) is a mathematical framework that extends traditional set theory by incorporating degrees of membership to represent uncertainty and imprecision [34]. In conventional set theory, elements are classified as binary, meaning they are either True or False or Yes or No. In contrast, FST allows elements with membership values ranging from 0 to 1, reflecting varying degrees, making it an ideal tool for modeling uncertainty in systems like power grid risk assessment [35]. Experts express their input using linguistic variables (e.g., “low”, “medium”, “high”), later converted into fuzzy numbers that represent the degree of membership of various risk factors. This fuzzy representation enables the incorporation of vagueness and uncertainty in expert knowledge, thereby making the model more flexible and robust [36].
In power grid risk assessment, FST is applied to model uncertainties in key parameters, such as component reliability, environmental conditions, and operational performance. FST, through expert elicitation, enables domain experts to provide subjective judgments about risk levels, which are then converted into fuzzy numbers [27]. The application of FST in power grid risk assessment follows a structured, three-step process to calculate fuzzy probabilities (FPr) based on expert input:
- The first step involves converting expert-provided linguistic terms (e.g., “low”, “medium”, “high”) into fuzzy numbers. These numbers represent the degree of membership of a particular risk factor within each category, allowing for a more nuanced representation of expert knowledge [37].
- In the second step, the opinions of multiple experts are aggregated into a collective membership function. This ensures that the model accounts for the diversity of expert judgments, effectively reflecting the uncertainty and variability in expert knowledge [37].
- The third step involves converting the aggregated membership function into FPr, representing the likelihood of specific risk events. These FPr consider expert input and the inherent uncertainty in the data.
This approach integrates expert knowledge by providing a more adaptive, robust, and flexible model for assessing power grid risks. Using fuzzy probabilities in the Bayesian network (BN) framework enables the more comprehensive modeling of complex, uncertain relationships within power grids, thereby enhancing the model’s ability to predict and manage risks. By integrating expert elicitation with Bayesian networks, a fuzzy Bayesian network (FBN) framework can be formed that is more adaptable for analyzing complex relationships among variables in power grids [38]. Expert judgments help the model to handle uncertainties related to environmental and operational factors, such as weather events, equipment failures, and third-party interference. The FBN methodology is more effective in modeling and managing the dynamic and uncertain nature of power grid systems, enabling more informed risk management and resilience planning decision-making [39].
2.4. Construction of the BN for Transformation to the FBN
For constructing the BN, CPTs are the foundation for representing the conditional relationships between variables. CPTs describe the probability of outcomes for a child node, given the states of its parent nodes. Traditional BNs derive these probabilities using historical data or expert opinions when data are scarce or incomplete. However, this conventional approach struggles to capture real-world data’s inherent vagueness and uncertainty, particularly in complex systems such as power grids [39]. To address these challenges, FBNs extend BNs by integrating fuzzy logic, which provides a robust mechanism to handle vague or uncertain data [40]. The following steps outline the process of constructing a BN and transforming it into an FBN:
- Development of the BN. The initial step involves creating the BN by identifying critical variables influencing the system, such as environmental factors, external interferences, and operational parameters. The second step establishes dependencies among nodes based on the literature and expert knowledge. The last step is constructing CPTs to represent conditional probabilities derived from historical data and expert elicitation. The general structure of the BN is shown in Figure 1.
- Integration of fuzzy logic into BNs. The transition to an FBN begins by integrating fuzzy logic principles to handle the uncertainties in node relationships. The variables in the BN are transformed into fuzzy variables characterized by linguistic terms such as “Low”, “Medium”, or “High”. These terms are represented using fuzzy sets with defined membership functions (e.g., triangular or trapezoidal functions) [41]. For all nodes without CPTs through historical data, traditional CPTs are replaced with FPr due to the unattainability of CPr. These values reflect the degree of possibility for each outcome under uncertain conditions.
- Aggregation of expert opinions using fuzzy logic. As discussed, expert opinions are critical in constructing CPTs when historical data are scarce. To address inconsistencies or subjective biases among experts, each input is assigned a weighting factor based on their expertise level and the relevance of their knowledge to the variable in question. Expert opinions, provided as linguistic terms, are aggregated using fuzzy operations such as weighted averages or fuzzy intersections. This ensures a complete and unbiased representation of the underlying uncertainties.
- Probabilistic inference in FBNs. Inference in FBNs is carried out through probabilistic and fuzzy reasoning. The process involves propagating evidence across the network and updating node probabilities as fuzzy values, allowing dynamic model adjustment in response to new information. When precise numerical values are required for decision-making, defuzzification techniques are applied to convert fuzzy results into crisp outputs.
- Validation and Sensitivity Analysis. The last steps are validation and sensitivity analyses to ensure the reliability of the FBN. The impact of variations in input fuzzy sets on output probabilities is assessed, identifying the critical factors influencing system behavior. The model is tested using real-world scenarios to confirm its predictive accuracy and robustness.
3. Methodology
Figure 2 shows the proposed framework for power grid risk assessment using the FBN. The proposed framework can be explained in three steps. Step I includes consultation with experts from the power grid industry/academia and a related literature review to identify the risk factors or BEs. After identifying the BEs, cause-and-effect relations are established using nodes and edges to show the relationships of all variables leading to the TE of the power grid shutdown. Step II involves two key activities: cleaning historical failure incident data and formulating a survey questionnaire for experts. The questionnaire aimed to gather opinions on identified risk variables expressed in linguistic terms. Once the data are analyzed, they are utilized to calculate CPTs. In Step III, the processed data from Step II are fed to the FBN to obtain the failure probability of the TE, and SA is performed to identify the most influential risk factors. Diagnosis inference is also conducted to check the FBN’s validity and the proposed model’s failure propagation. In the same step, the developed framework is compared with the FBN constructed using FPr only, and conclusions are drawn. In subsequent paragraphs, all steps are explained in detail.
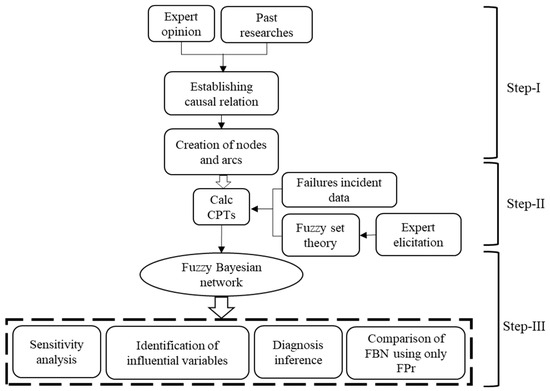
Figure 2.
A framework of FBN application for power grid risk assessment.
3.1. Step I: Identification and Establishment of Causal Relationships Among Risk Factors
3.1.1. Identification of Risk Factors
In this step, the most influential BEs are identified, leading to the likelihood of TE. The identification of BEs is performed in two phases. During the first phase, two experts were consulted, one with more than 30 years of experience in academia with extensive research on power grids and a second expert with more than ten years of experience working in the power grid industry. Second, based on past research through a comprehensive literature review [2,22,40,41,42,43,44,45,46,47,48], twenty-six BEs were identified as the root cause of the most critical risk factors, as shown in Figure 3. The focus of this research study, with “power grid shutdown” as TE, is intended to capture the overall system failure, aggregating the contributing factors into a single analysis for clarity. However, examining how shutdowns at specific generating stations and their associated load curtailments influence the grid’s resilience is pertinent. In interconnected networks, the failure of a particular generating station can cascade across the power grid. For instance, the inability of a high-capacity station in a critical location could disproportionately impact the grid compared to a smaller, less strategically located station. When a generating station shuts down, the load it previously supplied is redistributed to other operational stations or transmission lines. This redistribution may exceed the operational limits of certain lines or transformers, creating system-wide imbalances, triggering additional outages, propagating through the network, and escalating the risk of a complete grid shutdown. Similarly, load curtailments also serve as a critical operational measure to mitigate the impact of generating station outages. By reducing demand on the grid during a station’s failure, operators can maintain system balance and prevent cascading failures. This study uses historical incident failure data from an RTO to calculate CPr. The provided RTO data contain only sixteen BEs; the remaining ten BEs were identified by consulting experts and a literature review.
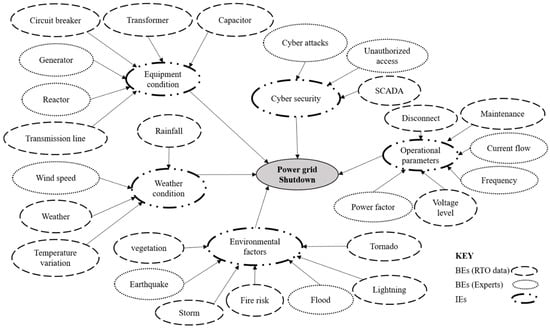
Figure 3.
BEs and their causal relation to intermediate events.
3.1.2. Determination of Causal Relationships Among Risk Factors
Past research and experts have assisted in establishing the causal relationships among BEs. Based on a literature review and discussion with experts, five IEs are identified: equipment conditions, weather conditions, environmental factors, operational parameters, and cybersecurity. These IEs are the child nodes directly influenced by the parent nodes or BEs, leading to TEs.
3.1.3. Creation of Nodes and Edges
After identifying BEs and establishing causal relationships, the next step is to connect BEs and IEs to TEs using edges. Figure 3 explains the creation of nodes and edges, showing the cause-and-effect relationships of all BEs leading to IEs. For instance, transmission line tripping is a BE related to equipment condition failure leading to TE (power grid shutdown). Similarly, the voltage level and current flow are operational parameters leading to the TE.
3.2. Step II: Data Collection
3.2.1. Application of Expert Elicitation
For this study, a survey questionnaire was formulated using Qualtrics and sent for approval by the Institutional Review Board (IRB). Figure 4 describes the process employed to obtain the expert elicitation.
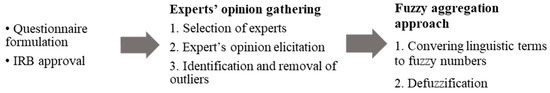
Figure 4.
Application of FST for the calculation of FPr.
The selection process for the experts remained very strict. They were selected based on their professional position (PP), experience (Exp), education (EdU), and age. The weights given to the experts based on their PP, EdU, Exp, and age are shown in Table 1.

Table 1.
Expert selection criterion and related scores [49].
The weighting score for each expert is calculated using Equation (2) [37].
Here, is the weight score of expert i based on PP, EdU, Exp, and age.
For this study, a seven-point fuzzy membership function is used, with very low (VL), low (L), fairly low (FL), medium (M), fairly high (FH), high (H), and very high (VH) remaining the highest scores used to quantify the BEs. The descriptions of the scores, along with a description of the linguistic variables, are shown in Figure 5.
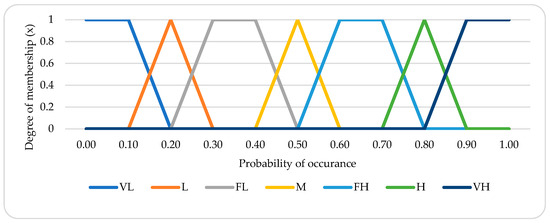
Figure 5.
Linguistic terms with corresponding fuzzy membership functions [50].
3.2.2. Calculating Fuzzy Possibilities
Calculating FPs involves converting linguistic terms into FPs by incorporating expert weights. Many techniques exist for calculating FPs, but for this study, a fuzzy linear opinion pool (FLOP), an effective and simple method, is employed [51]. Equation (4) explains the aggregation of FPs.
where FPs are the fuzzy possibilities for BEi, and Wij is the expert’s weighting factor for expert j for BEi. Aij represents the linguistic opinion provided by expert j for the BE i. These linguistic terms are expressed as fuzzy sets to capture the expert opinions’ inherent uncertainty and vagueness. To compute Aij, the experts provide their opinions using predefined linguistic terms such as “Low”, “Medium”, “High”, etc. Each linguistic term corresponds to a fuzzy set defined by a membership function (e.g., triangular or trapezoidal fuzzy numbers). The fuzzy numbers associated with these linguistic terms are directly used in the calculation as Aij. These fuzzy sets provide a numerical representation of linguistic terms, enabling their inclusion in the fuzzy possibility computation.
3.2.3. Calculating Fuzzy Probabilities
Defuzzification plays a crucial role in converting FPs into FPr, facilitating an effective decision-making process for risk assessment in power grid systems [48]. For this study, we employ the widely used Center of Area (CoA) technique, which extracts a crisp value from fuzzy sets by calculating the center of the area under the membership function curve. The formula for the defuzzified output X is
where
- X is the defuzzification output of i;
- x is the output variable;
- i(x) is the aggregated membership function representing the degree of membership for each value of x.
In our model, converting FPs to FPr is essential for assessing risks such as equipment failure, human error, and environmental factors. We utilize trapezoidal and triangular membership functions to represent fuzzy sets, as these functions effectively capture the imprecision inherent in expert judgments and uncertain data [27]. The trapezoidal function is beneficial for risk factors with well-defined thresholds, while the triangular function is more suited for risks that exhibit gradual transitions. Trapezoidal and triangular membership functions can be calculated using Equation (6).
where
- μA(x) is the membership function for fuzzy set A;
- x is the output variable;
- a1, a2, a3, and a4 are the parameters defining the trapezoidal membership function.
Figure 6 illustrates the shapes of these membership functions. These functions map expert inputs, represented as linguistic variables, to a numerical scale, integrating subjective expert opinions with FPr. This provides a robust framework for risk assessment.
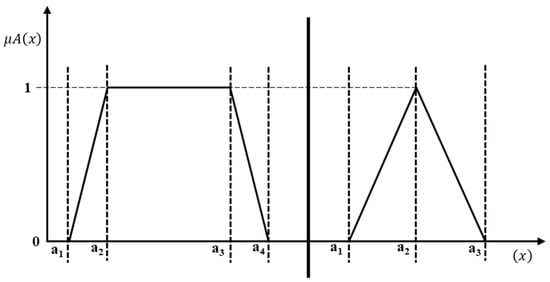
Figure 6.
Trapezoidal and triangular membership functions.
In this study, FPs are defuzzified using the CoA method to obtain FPr, ensuring that fuzzy outputs from expert elicitation and fuzzy membership functions are translated into actionable, precise values. Additionally, FPr are not static and can be dynamically adjusted, allowing for flexibility as new risks emerge in power grid systems.
To enhance the precision and adaptability of the model, hyperparameters such as the fuzzy membership function ranges (e.g., VL range) can be manually adjusted or optimized using methods like Bayesian optimization. This optimization enables the continuous refinement of the fuzzy sets, ensuring that the model accurately captures relevant risk factors and expert insights, resulting in more precise predictions of power grid failures.
3.2.4. Determination of FPr
FPr represent the expert’s opinion on the final outcome for BEs that are either vague or for which no historical data are available. It can be substituted for nodes instead of CPr. For this study, a simple method proposed by Osinawa in 1998 was employed [52].
where
The FPs calculated through Equation (7) are used to determine FPr. Here, K is the Onisawa constant, and this function uses the exponent 1/3 to introduce nonlinearity, which is desirable for some applications and demonstrates direct one-to-one mappings between possibility and probability. A constant of 2.301 is selected based on empirical rules for specific scaling or normalization.
3.3. Step III: Construction of the FBN and Failure Predictions
Following the calculation of CPr and FPr in Step II, this step explains the construction of the FBN using CPTs as input to the model. The primary purpose of this step is to estimate the likelihood of TEs, checking the chances of failure using prior probabilities. Using the prior probabilities, different scenarios can be created to check the influence of different BEs on the entire network. Diagnosis inference is performed to determine the most critical parent nodes by taking the TE with a confirmed 100% failure case. The last part of this step compares the FBN constructed through CPr plus FPr and the model constructed exclusively using FPr.
4. Model Implementation
4.1. Determination of CPr Using RTO Data
CPr depict the likelihood of a BE based on historical failure data. The historical failure incident data obtained from the RTO are utilized for this study. The data are divided into different categories based on the BE distribution explained in Section 3.1. After categorization, the data were reviewed carefully to ensure preprocessing, including cleansing and filling in the missing values. At this stage, the consistency of the values is also verified. The RTO data consist of power grid failure data from 14 states, which include Arkansas, Colorado, Iowa, Kansas, Louisiana, Minnesota, Missouri, Montana, Nebraska, New Mexico, North Dakota, Oklahoma, South Dakota, Texas, and Wyoming. Table 2 shows the calculations for CPr based on the RTO data.
Table 2.
CPr based on historical RTO data.
4.2. Weighting Score for Expert Elicitation
The CPr calculated through the RTO data are validated by assessing their coherence with domain expert knowledge. After IRB approval, the survey questionnaire was sent to at least 45 experts. These experts are from academia and the power industry and have vast experience with research in power grid systems. The selection of these experts was based on consultation with a panel of researchers assisting the authors of this study. After two reminders in one month of surveying, twenty-one responses were received, with only eighteen being completed in all aspects. These eighteen responses were analyzed using statistical techniques for completeness and coherence. Three responses were declared outliers due to inconsistent points outside the σ ± 1. To ensure a comprehensive analysis that incorporates diverse perspectives and expertise on power grid failures, only fifteen responses were selected for a final evaluation. Outliers were excluded using the interquartile range (IQR) technique to maintain the integrity and reliability of the data. These responses were chosen from a group of experts with varied backgrounds in industry and academia, each bringing unique knowledge and experience to the power grid failure mechanism. This selection process ensures that the analysis reflects a broad range of viewpoints, addressing the complex nature of power grid failures and enhancing the overall depth of the findings.
The weight for each variable received in linguistic terms was added to the total weight using Equation (2), and the weighted values were calculated using Equation (3). The results of expert elicitation from experts showing their PP, Exp, EdU, and age are shown in Table 3.
Table 3.
The weighting scores of fifteen experts.
4.3. Discussion on Calculated FPr
This section addresses the results generated using the calculated crisp and fuzzy probabilities. CPr measure the risk level based on historical failure incident data, and FPr measure the risk frequency and impact by adjusting for uncertainty and ambiguity via expert elicitation. The risk profile can be enhanced significantly by integrating FPr and CPr through a comprehensive analysis of identified risk factors and failure modes. Table 4 shows FPr calculations for all BEs, and the corresponding CPr are in the last column. It is evident from the calculations that FPr values vary from CPr. The reasons for these variations can be explained by the fact that, because of objective and subjective uncertainties, real-world scenarios are rarely crisp and deterministic in risk analysis, and insufficient and vague data may result in an under- or overestimation of process risk. Another reason is that the RTO databases present constant failure data over time and do not reflect recent component reliability improvements. For these reasons, the results obtained using FPr for BEs were expected to differ from those obtained using CPr. It is pertinent to mention here that the calculated probabilities are intended to be dynamic in the proposed fuzzy-aggregation approach, reflecting the evolving condition of the risk factors associated with the power grid. As power grid infrastructure degrades or new environmental risks emerge (such as extreme weather), these probabilities will be periodically recalculated using updated data, including expert opinions, maintenance records, and real-time data. The updated probabilities ensure that the model remains accurate and relevant to the current state of the power grid and its vulnerabilities. Moreover, the calculated probabilities are region-specific, as we recognize that the risks faced by power grids can differ significantly depending on geographical location. Our expert survey questionnaire asked respondents to consider regional risk factors, such as wildfires in California, snowstorms in the Midwest, and flooding risks in coastal regions. This approach ensures that the probabilities are tailored to the local environmental conditions and are not generalized across different regions. The model reflects the specific risks associated with each region by incorporating region-specific inputs.
Table 4.
FST is applied to obtain FPr through expert elicitation.
5. Results and Discussion
5.1. Calculation of CPTs and Construction of the FBN
Once CPr and FPr have been quantified, the next step is to calculate the CPTs. For this study, CPr calculated from RTO data are used for sixteen BEs, and for the remaining ten BEs, FPr are used (refer to Figure 3). For the second case (C-2), CPT calculations are based on FPr for all twenty-six BEs, and the results are compared to determine the effects of using expert elicitation. Table 5 shows the two cases developed to compare the FBN using CPr and FPr. It is important to highlight that this comparison excludes cases where only historical data are utilized. This exclusion is due to limitations in the availability of historical data for all basic events; only 16 out of 26 BEs have historical records. It is also crucial to recognize that using incomplete data for this analysis may lead to unreliable risk assessment results.
Table 5.
Comparison of the FBN using CPr and FPr.
5.2. C-1: Construction of the FBN Using CPr Plus FPr
To develop the FBN, a cause-and-effect relation was established, and CPr and FPr were fed to the GiNIe software 5.0 [53], as shown in Figure 7. Using this innovative approach, the model delineates accident scenario modeling based on CPr from RTO data and FPr calculated by experts. All twenty-six BEs lead to TEs through IEs, showing the likelihood of a power grid shutdown as a TE. Here, it is evident that the significant factors leading to power grid shutdown are external factors, which include the tripping of transmission lines with a 30% failure probability, faults due to circuit breakers with a 19% failure probability, and generators with a 7% failure probability. Weather conditions and wind speeds are also disruptions caused by prior probabilities of 6% and 4%, respectively. Internal factors, i.e., cybersecurity and operational parameters, significantly lead to TE. Operating parameters such as frequency fluctuation and current flow may lead to disruptions in the power grid system. In addition, cybersecurity vulnerabilities, such as unauthorized access, increase the likelihood of TE occurrence. Although prior probabilities of transmission line tripping and malfunctioning circuit breakers are the major contributors, the simulation results show that the chances of TE occurrence are very low, with a failure probability of only 3%. However, the likelihood of equipment conditions being affected is 36%, and the likelihood of environmental factors being affected is 11%, much greater than that of BEs. The lower likelihood of a TE of 3% can be attributed to good safety and maintenance practices that maintain a smooth electricity supply to users. External risk factors must be considered and mitigated to maintain a resilient and robust power grid system.
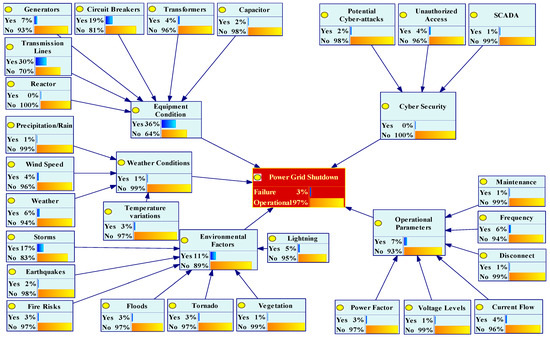
Figure 7.
Power grid shutdown scenario modeled using the FBN.
5.3. C-2: Construction of the FBN Using Expert Elicitation (FPr) Only
This subsection addresses the construction of the FBN for the likelihood of TEs using the FPr for all twenty-six BEs. Figure 8 shows the results obtained using FPr.
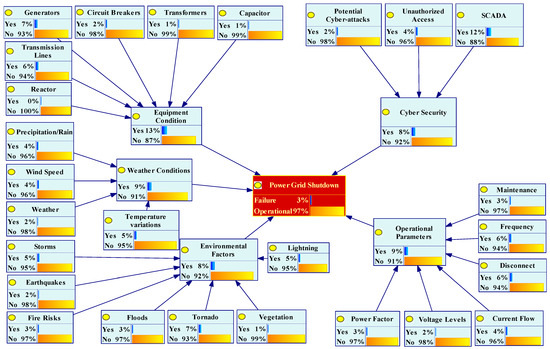
Figure 8.
Modeled FBN using expert elicitation (FPr) only.
The IEs have low failure probabilities compared to case C-1. Figure 9 compares the failure probabilities for cases C-1 and C-2. By comparing risk variables, notable differences emerge between CPr and FPr. Specifically, the failure probabilities for the equipment conditions and environmental factors are 23% and 3% greater, respectively, for CPr than for FPr. Conversely, the failure probabilities for weather conditions, operational parameters, and cybersecurity are 8%, 2%, and 8% lower for CPr than for FPr. Despite the difference in CPr and FPr IEs, the failure probability for TE remains the same for both cases. It is crucial to carefully distinguish that the failure of the power grid remains consistent regardless of whether historical failure data are used or expert elicitation is employed.
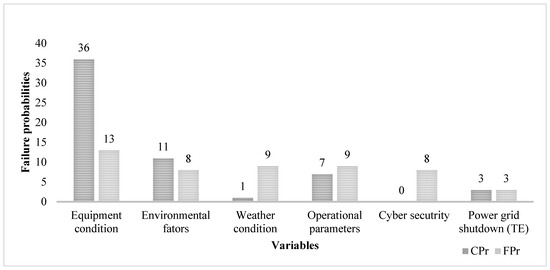
Figure 9.
Comparison of failure probabilities of the IEs using CPr and FPr.
CPr are based on historical failure data, which may lack important updates or safety and maintenance measures compared to expert elicitation. For instance, the probability of failure in cybersecurity is 0% when historical data are used. This finding seems implausible in real-world scenarios, given the increasing likelihood of cyberattacks due to technological advancements. Similarly, the significance of SCADA failure is given 12% weight when assessed by experts, compared to 1% extracted from RTO data, a critical BE that threatens the integrity of power grids. Such discrepancies highlight the importance of incorporating expert insights to capture nuanced risk factors and potential threats more accurately. The results of our fuzzy-aggregation approach offer valuable insights for informed maintenance and design decisions in power grid infrastructure. By identifying areas at higher risk of failure due to weather-related events, aging infrastructure, or environmental threats, the model helps prioritize maintenance resources and targeted interventions. For instance, regions prone to wildfires or extreme storms can benefit from strengthening grid infrastructure, while regions with aging equipment may require upgrades or replacement. The model’s output can also enhance design strategies for new power grids, ensuring their resilience in the face of local environmental risks.
5.4. Sensitivity Analysis
Performing a sensitivity analysis (SA) is crucial in the BN framework. This approach provides a valuable technique for scrutinizing uncertainty by observing how alterations in influencing factors represented by parent nodes impact the child nodes. The key influencing elements are revealed by identifying the most sensitive factors. Consequently, this information establishes pertinent emergency plans, preventive measures, and regulatory actions. For this study, following the construction of the FBN, SA is performed to check whether the probabilities in the FBN impact the overall TE outcomes.
Figure 10a shows the sensitivity of BEs. Environmental factors are the most crucial root causes for the occurrence of TEs, with storms being the most sensitive factor (0.019), followed by lightning and earthquakes (0.015), and tornadoes and floods (0.014). The sensitivity to equipment conditions is also a significant factor for the likelihood of TEs, with significant values of 0.005 and 0.004 for transmission lines and earthquakes, respectively. For the remaining BEs related to the equipment conditions of the capacitor, transformer, and generator, the sensitivity is 0.003, which is relatively less sensitive to the occurrence of TEs.
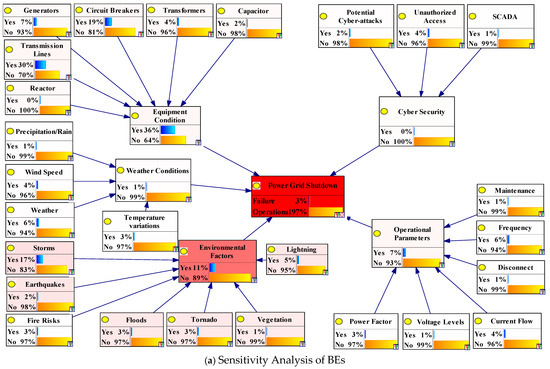
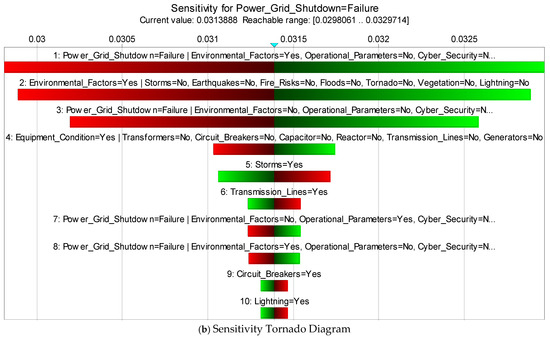
Figure 10.
(a) Sensitivity analysis to identify the most critical variables, and (b) sensitivity tornado diagram.
Sensitivity tornado diagrams are used in risk analysis to determine the most significant risks associated with an infrastructure due to the potential impact of different variables. It is easier to visualize how various factors influence the success or failure of a system when information is organized in a digestible manner. Figure 10b shows the sensitivity tornado diagram of the power grid risk assessment. Environmental factors are the most sensitive factors for a power grid to shut down as a TE. Storms are the most crucial variable environmental factors, and transmission lines are the most sensitive variable for equipment conditions.
5.5. Diagnosis Inference
In FBNs, diagnosis inference is a valuable technique for determining posterior probabilities based on new, updated information. When new evidence is available, it can be applied to the model to trigger the IEs and root causes to determine the effect on the entire network. It begins by assessing the impact of the evidence provided for the power grid failure node on its parent nodes. It is possible to propagate the impact of such evidence backward and forward to determine which parent nodes affect the likelihood of TE. In this study, the evidence has been propagated—a confirmed power grid shutdown (assuming a failure probability of 100%)—illustrating the FBN model with the failure evidence inserted. There was a significant increase in the probable occurrence of environmental factors from a baseline probability of 11% to 59%, and the significant BE fire risk increased from 3% to 35%. Similarly, the posterior probabilities of equipment conditions decreased from 36% to 22% with BE circuit breakers, generators, and transmission lines, with new probabilities of 19%, 20%, and 24%, respectively. The results from the diagnosis inference are shown in Figure 11, with a TE failure probability of 100%.
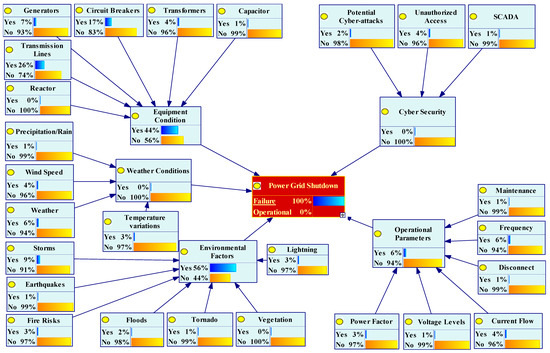
Figure 11.
Diagnosis inference using 100% failure probability as TE.
The results indicate a significant increase in the likelihood of environmental factors and equipment conditions for the parent nodes. The baseline probabilities of 11% and 36% for these variables increased to 56% and 44%, respectively. The posterior probabilities primarily affected two parent nodes: storms and transmission lines. This highlights these nodes as the most influential factors, emphasizing the need to implement mitigation strategies to address external influences in power grid risk assessment.
6. Conclusions
This study presents an FBN for the risk assessment of power grids based on historical failure incident data and expert elicitation. RTO data are utilized for calculating CPr, and experts from the power industry and academia are consulted for calculating FPr. The main contributions of this research are summarized below.
- This study identifies twenty-six external and internal critical risk variables responsible for power grid shutdowns by presenting a comprehensive risk level spectrum. To offset the vagueness and uncertainty in historical data, the FST using expert elicitation is integrated with a BN to present a more nuanced risk assessment approach.
- The initial risk assessment with sixteen BEs using CPr and ten BEs using FPr shows that the probability of TE (power grid shutdown) is 3%. Environmental factors account for 11% of TE failure rates, followed by equipment conditions, which account for 36%. A higher failure probability from equipment conditions confirmed that the root causes are the tripping of transmission lines and circuit breakers. A failure probability of 11% from environmental factors endorsed the increased risk of the likelihood of TEs because of storms and weather conditions.
- Expert elicitation is endorsed as a nuanced approach to integrating a BN and FST. For instance, based on RTO historical data, SCADA is less likely to disrupt the power grid’s functionality, with a failure probability of only 1%. However, results from expert opinion confirmed it as a serious threat with a 12% probability of failure.
- Diagnosis inference with 100% confirmation of TE highlights the most critical IEs as environmental factors and equipment conditions, with 59% and 22% failure probabilities, respectively. Environmental factors remain the most significant IE, with the root cause of fire risk as the most influential BE, with a failure rate of 35%, followed by storms (13%). Equipment conditions are also a critical IE with root causes of transmission lines (24%), generators (20%), and circuit breakers (19%). Diagnosis inference confirmed the authenticity of the FBN for cybersecurity and operational parameters, with leading root causes for the likelihood of TEs being unauthorized access (10%) and frequency changes (9%).
- A comparison of an FBN constructed through CPr plus FPr versus FBN (FPr only) yields similar results for the likelihood of TEs (3%). Still, significant variations exist in the failure probabilities of BEs and IEs. Expert elicitation confirmed that the equipment condition is the most critical IE (13%), followed by weather conditions and operational parameters with a failure probability of 9%, and cybersecurity and environmental factors with 8%.
- The expert’s opinions yielded different results than historical failure data since the latest safety and maintenance strategies altered the threat levels, which can be captured through expert elicitation, as historical data remained constant over time. Moreover, due to improved mitigation strategies, there are fewer chances of failure incidents of the same type in the future, making CPr less relevant than expert opinions.
Integrating FBNs using expert elicitation is an effective risk assessment technique for evaluating these viable assets. However, certain limitations when using an expert’s opinion, such as long distances and unpredictable environmental conditions, may lead to the under- or overestimation of risk levels. To counter these challenges, robotic inspection and intelligent perception may be incorporated to complement the proposed approach for future studies.
Author Contributions
Y.M.: Methodology, Investigation, Writing—Original Draft, Visualization, Validation, Software, Resources, Formal Analysis, Data Curation, Conceptualization. N.Y. (Nof Yasir): Validation, Software, Resources, Formal Analysis, Data Curation. N.Y. (Nita Yodo): Writing—Review and Editing, Visualization, Validation, Methodology, Investigation, Formal Analysis. Y.H.: Supervision, Writing—Review and Editing, Validation, Supervision, Resources, Project Administration, Funding Acquisition, Conceptualization. D.W.: Writing—Review and Editing. R.A.M.: Writing—Review and Editing. All authors have read and agreed to the published version of the manuscript.
Funding
This research was funded by National Science Foundation (NSF) EPSCoR-RII Track-2 Program under NSF award No. OIA-2119691, U. S. Department of Transportation PHMSA under Grant No. 693JK3250009CAAP, and the APC was funded by MDPI. The findings and opinions presented in this manuscript are those of the authors only and do not necessarily reflect the sponsors’ perspective.
Data Availability Statement
The data that have been used are confidential.
Conflicts of Interest
The authors declare no conflicts of interest.
Abbreviations
The following abbreviations are used in this manuscript:
| BN | Bayesian Network |
| FST | Fuzzy Set Theory |
| FBN | Fuzzy Bayesian Network |
| CPr | Crisp Probabilities |
| RTO | Regional Transmission Operator |
| FPr | Fuzzy Probabilities |
| SCADA | Supervisory Control And Data Acquisition |
| QRA | Quantitative Risk Assessment |
| FTA | Fault Tree Analysis |
| ETA | Event Tree Analysis |
| MCS | Monte Carlo Simulation |
| FMEA | Failure Modes and Effects Analysis |
| HBA | Hierarchical Bayesian Analysis |
| D-AHP | Data-Driven Analytical Hierarchy Process |
| BEs | Basic Events |
| CPTs | Conditional Probability Tables |
| IEs | Intermediate Events |
| TE | Top Event |
| SA | Sensitivity Analysis |
| FLOP | Fuzzy Linear Opinion Pool |
References
- Hossain, N.U.I.; Jaradat, R.; Hosseini, S.; Marufuzzaman, M.; Buchanan, R.K. A framework for modeling and assessing system resilience using a Bayesian network: A case study of an interdependent electrical infrastructure system. Int. J. Crit. Infrastruct. Prot. 2019, 25, 62–83. [Google Scholar] [CrossRef]
- Zhang, J.; Bian, H.F.; Zhao, H.H.; Wang, X.X.; Zhang, L.L.; Bai, Y.P. Bayesian Network-Based Risk Assessment of Single-Phase Grounding Accidents of Power Transmission Lines. Int. J. Environ. Res. Public Health 2020, 17, 1841. [Google Scholar] [CrossRef]
- energy.gov. The Flow of Electrical Power. Available online: https://www.energy.gov/electric-power (accessed on 23 February 2025).
- Lin, Y.; Bie, Z.; Qiu, A. A review of key strategies in realizing power system resilience. Glob. Energy Interconnect. 2018, 1, 9. [Google Scholar] [CrossRef]
- Xu, Y.H.; Xing, Y.K.; Huang, Q.H.; Li, J.; Zhang, G.D.; Bamisile, O.; Huang, Q. A review of resilience enhancement strategies in renewable power system under HILP events. Energy Rep. 2023, 9, 200–209. [Google Scholar] [CrossRef]
- Ji, C.Y.; Wei, Y.; Mei, H.; Calzada, J.; Carey, M.; Church, S.; Hayes, T.; Nugent, B.; Stella, G.; Wallace, M.; et al. Large-scale data analysis of power grid resilience across multiple US service regions. Nat. Energy 2016, 1, 16052. [Google Scholar] [CrossRef]
- Wang, J.; Zuo, W.D.; Rhode-Barbarigos, L.; Lu, X.; Wang, J.H.; Lin, Y.L. Literature review on modeling and simulation of energy infrastructures from a resilience perspective. Reliab. Eng. Syst. Saf. 2019, 183, 360–373. [Google Scholar] [CrossRef]
- Reed, B. What caused the blackout in Spain and Portugal and did renewable energy play a part? The Guardian, 29 April 2025. [Google Scholar]
- @Reuters. Spain, Portugal switch back on, seek answers after biggest ever blackout. Reuters, 30 April 2025. [Google Scholar]
- Jufri, F.H.; Widiputra, V.; Jung, J. State-of-the-art review on power grid resilience to extreme weather events: Definitions, frameworks, quantitative assessment methodologies, and enhancement strategies. Appl. Energy 2019, 239, 1049–1065. [Google Scholar] [CrossRef]
- He, R.; Li, X.H.; Chen, G.M.; Wang, Y.C.; Jiang, S.Y.; Zhi, C.X. A quantitative risk analysis model considering uncertain information. Process Saf. Environ. Prot. 2018, 118, 361–370. [Google Scholar] [CrossRef]
- Lin, S.S.; Shen, S.L.; Zhou, A.; Xu, Y.S. Risk assessment and management of excavation system based on fuzzy set theory and machine learning methods. Autom. Constr. 2021, 122, 103490. [Google Scholar] [CrossRef]
- Rahman, M. The Advantages and Disadvantages of Using Qualitative and Quantitative Approaches and Methods in Language “Testing and Assessment” Research: A Literature Review. J. Educ. Learn. 2020, 6, 10. [Google Scholar] [CrossRef]
- Park, S.J.; Seo, H.J.; Park, S.M.; Park, S.H. Establishment of a Risk-Assessment System for Coastal Activities Based on Statistical Data. J. Coast. Res. 2024, 1, 458–462. [Google Scholar] [CrossRef]
- Zúñiga, A.A.; Fernandes, J.F.P.; Branco, P.J.C. Fuzzy-Based Failure Modes, Effects, and Criticality Analysis Applied to Cyber-Power Grids. Energies 2023, 16, 3346. [Google Scholar] [CrossRef]
- Li, X.H.; Chen, G.M.; Khan, F.; Xu, C.H. Dynamic risk assessment of subsea pipelines leak using precursor data. Ocean Eng. 2019, 178, 156–169. [Google Scholar] [CrossRef]
- Dong, H.; Zhao, J.; Yang, X.Y.; Yang, K. Combination of D-AHP and Grey Theory for the Assessment of the Information Security Risks of Smart Grids. Math. Probl. Eng. 2020, 2020, 3517104. [Google Scholar] [CrossRef]
- Chen, B.Y.; Chen, H.Y.; Zhang, Y.Y.; Zhao, J.H.; Manlab, E. Risk Assessment for the Power Grid Dispatching Process Considering the Impact of Cyber Systems. Energies 2019, 12, 1084. [Google Scholar] [CrossRef]
- Canbolat, S.; Elbez, G.; Hagenmeyer, V. A new hybrid risk assessment process for cyber security design of smart grids using fuzzy analytic hierarchy processes. Automatisierungstechnik 2023, 71, 779–788. [Google Scholar] [CrossRef]
- Zhu, D.R.; Cheng, W.J.; Duan, J.D.; Wang, H.F.; Bai, J. Identifying and assessing risk of cascading failure sequence in AC/DC hybrid power grid based on non-cooperative game theory. Reliab. Eng. Syst. Saf. 2023, 237, 109359. [Google Scholar] [CrossRef]
- Jones, C.B.; Bresloff, C.J.; Darbali-Zamora, R. Electric Grid Vulnerability Analysis to Identify Communities Prone to Wildfires. IEEE Access 2023, 11, 35630–35638. [Google Scholar] [CrossRef]
- Bian, H.F.; Zhang, J.; Li, R.X.; Zhao, H.H.; Wang, X.X.; Bai, Y.P. Risk analysis of tripping accidents of power grid caused by typical natural hazards based on FTA-BN model. Nat. Hazards 2021, 106, 1771–1795. [Google Scholar] [CrossRef]
- Liu, M.; Li, Z.; Li, Y.; Liu, Y. A Fast and Accurate Method of Power Line Intelligent Inspection Based on Edge Computing. IEEE Trans. Instrum. Meas. 2022, 71, 1–12. [Google Scholar] [CrossRef]
- Jin, H.; Uludag, S.; Lui, K.-S.; Nahrstedt, K. Secure data collection in constrained tree-based Smart Grid environments. In Proceedings of the 2014 IEEE International Conference on Smart Grid Communications (SmartGridComm), Venice, Italy, 3–6 November 2014. [Google Scholar] [CrossRef]
- Kumari, P.; Halim, S.Z.; Kwon, J.S.I.; Quddus, N. An integrated risk prediction model for corrosion-induced pipeline incidents using artificial neural network and Bayesian analysis. Process Saf. Environ. Prot. 2022, 167, 34–44. [Google Scholar] [CrossRef]
- De Iuliis, M.; Kammouh, O.; Cimellaro, G.P.; Tesfamariam, S. Quantifying restoration time of pipelines after earthquakes: Comparison of Bayesian belief networks and fuzzy models. Int. J. Disaster Risk Reduct. 2021, 64, 102491. [Google Scholar] [CrossRef]
- Zarei, E.; Khakzad, N.; Cozzani, V.; Reniers, G. Safety analysis of process systems using Fuzzy Bayesian Network (FBN). J. Loss Prev. Process Ind. 2019, 57, 7–16. [Google Scholar] [CrossRef]
- Zhang, L.M.; Wu, X.G.; Skibniewski, M.J.; Zhong, J.B.; Lu, Y.J. Bayesian-network-based safety risk analysis in construction projects. Reliab. Eng. Syst. Saf. 2014, 131, 29–39. [Google Scholar] [CrossRef]
- Ding, Y.; Ye, X.W.; Guo, Y.; Zhang, R.; Ma, Z. Probabilistic method for wind speed prediction and statistics distribution inference based on SHM data-driven. Probabilistic Eng. Mech. 2023, 73, 103475. [Google Scholar] [CrossRef]
- MacLeod, J.; Tan, S.; Moinuddin, K. Reliability of fire (point) detection system in office buildings in Australia-A fault tree analysis. Fire Saf. J. 2020, 115, 103150. [Google Scholar] [CrossRef]
- Davila-Frias, A.; Yodo, N.; Le, T.; Yadav, O.P. A deep neural network and Bayesian method-based framework for all-terminal network reliability estimation considering degradation. Reliab. Eng. Syst. Saf. 2023, 229, 108881. [Google Scholar] [CrossRef]
- Mahmood, Y.; Afrin, T.; Huang, Y.; Yodo, N. Sustainable Development for Oil and Gas Infrastructure from Risk, Reliability, and Resilience Perspectives. Sustainability 2023, 15, 4953. [Google Scholar] [CrossRef]
- Landquist, H.; Norrman, J.; Lindhe, A.; Norberg, T.; Hassellöv, I.M.; Lindgren, J.F.; Rosén, L. Expert elicitation for deriving input data for probabilistic risk assessment of shipwrecks. Mar. Pollut. Bull. 2017, 125, 399–415. [Google Scholar] [CrossRef]
- Moein Younesi Heravi, A.Y.S.B.R. Using Fuzzy Approach in Determining Critical Parameters for Optimum Safety Functions in Mega Projects. Front. Nat.-Inspired Ind. Optim. 2023, 1, 183–200. [Google Scholar] [CrossRef]
- Zhang, D.B.; Chu, Z.W.; Gui, Q.J.; Wu, F.; Yang, H.J.; Ma, Y.H.; Tao, W.Q. Transformer maintenance decision based on condition monitoring and fuzzy probability hybrid reliability assessment. IET Gener. Transm. Distrib. 2023, 17, 976–992. [Google Scholar] [CrossRef]
- Weng, Z.X.; Shi, L.B.; Xu, Z.; Lu, Q.; Yao, L.Z.; Ni, Y.X. Fuzzy power flow solution considering wind power variability and uncertainty. Int. Trans. Electr. Energy Syst. 2015, 25, 547–572. [Google Scholar] [CrossRef]
- Suh, Y.A.; Song, K.; Cho, J. Fuzzy-technique-based expert elicitation on the occurrence probability of severe accident phenomena in nuclear power plants. Nucl. Eng. Technol. 2021, 53, 3298–3313. [Google Scholar] [CrossRef]
- Guan, L.; Liu, Q.; Abbasi, A.; Ryan, M.J. Developing a Comprehensive Risk Assessment Model Based on Fuzzy Bayesian Belief Network (FBBN). J. Civ. Eng. Manag. 2020, 26, 614–634. [Google Scholar] [CrossRef]
- Sun, H.; Yang, Z.L.; Wang, L.C.; Xie, J. Leakage failure probability assessment of submarine pipelines using a novel pythagorean fuzzy bayesian network methodology. Ocean Eng. 2023, 288, 115954. [Google Scholar] [CrossRef]
- Lu, Q.; Zhang, W. Integrating dynamic Bayesian network and physics-based modeling for risk analysis of a time-dependent power distribution system during hurricanes. Reliab. Eng. Syst. Saf. 2022, 220, 108290. [Google Scholar] [CrossRef]
- Liu, H.; Li, Y.; Cao, Y.J.; Zeng, Z.L.; Sidorov, D. Operational Risk Assessment of Electric-Gas Integrated Energy Systems Considering N-1 Accidents. Energies 2020, 13, 1208. [Google Scholar] [CrossRef]
- Mensah, A.F.; Dueñas-Osorio, L. Efficient Resilience Assessment Framework for Electric Power Systems Affected by Hurricane Events. J. Struct. Eng. 2016, 10, 142. [Google Scholar] [CrossRef]
- Wang, M.Z.; Li, C.; Wang, X.H.; Piao, Z.Y.; Yang, Y.S.; Dai, W.T.; Zhang, Q. Research on Comprehensive Evaluation and Early Warning of Transmission Lines’ Operation Status Based on Dynamic Cloud Computing. Sensors 2023, 23, 1469. [Google Scholar] [CrossRef]
- Abedi, A.; Gaudard, L.; Romerio, F. Review of major approaches to analyze vulnerability in power system. Reliab. Eng. Syst. Saf. 2019, 183, 153–172. [Google Scholar] [CrossRef]
- Yu, S.; Wang, C.; Geng, H.; Fan, H. Review on Risk Assessment of Power System. Procedia Comput. Sci. 2017, 109, 6. [Google Scholar] [CrossRef]
- Machado, P.G.; Ribeiro, C.D.; do Nascimento, C.A.O. Risk analysis in energy projects using Bayesian networks: A systematic review. Energy Strategy Rev. 2023, 47, 101097. [Google Scholar] [CrossRef]
- AlMajali, A.; Wadhawan, Y.; Saadeh, M.S.; Shalalfeh, L.; Neuman, C. Risk assessment of smart grids under cyber-physical attacks using Bayesian networks. Int. J. Electron. Secur. Digit. Forensics 2020, 12, 357–385. [Google Scholar] [CrossRef]
- Mo, L.G.; Wei, L. Risk assessment method for power grid communication link failure based on fuzzy comprehensive assessment. Int. J. Internet Protoc. Technol. 2022, 15, 69–75. [Google Scholar] [CrossRef]
- Ramzali, N.; Lavasani, M.R.M.; Ghodousi, J. Safety barriers analysis of offshore drilling system by employing Fuzzy Event Tree Analysis. Saf. Sci. 2015, 78, 49–59. [Google Scholar] [CrossRef]
- Guo, X.X.; Jie, J.; Khan, F.; Ding, L. Fuzzy Bayesian network based on an improved similarity aggregation method for risk assessment of storage tank accident (vol 144, pg 242, 2020). Process Saf. Environ. Prot. 2021, 149, 1031. [Google Scholar] [CrossRef]
- Fatemi, S.A.; Kuh, A.; Fripp, M. Parametric methods for probabilistic forecasting of solar irradiance. Renew. Energy 2018, 129, 666–676. [Google Scholar] [CrossRef]
- Onisawa, T. An Approach to Human Reliability in Man-Machine Systems Using Error Possibility. Fuzzy Sets Syst. 1988, 27, 87–103. [Google Scholar] [CrossRef]
- BayesFusion, L. BayesFusion Artificial Intelligence Modeling and Machine Learning Software. Available online: https://www.bayesfusion.com/contact/ (accessed on 14 February 2025).
Disclaimer/Publisher’s Note: The statements, opinions and data contained in all publications are solely those of the individual author(s) and contributor(s) and not of MDPI and/or the editor(s). MDPI and/or the editor(s) disclaim responsibility for any injury to people or property resulting from any ideas, methods, instructions or products referred to in the content. |
© 2025 by the authors. Licensee MDPI, Basel, Switzerland. This article is an open access article distributed under the terms and conditions of the Creative Commons Attribution (CC BY) license (https://creativecommons.org/licenses/by/4.0/).