Abstract
Decision-making is a fundamental challenge in science and engineering, mainly when subjective factors influence the process. This paper introduces a decision support model based on the Analytic Hierarchy Process (AHP) that was specifically adapted for binary decisions and we term Binary AHP. The model facilitates structured decision-making when evaluating two opposing alternatives, such as yes/no scenarios. To demonstrate its applicability, we applied the Binary AHP model to a real-world case in the Brazilian public sector, where agencies must determine whether a technological solution qualifies as an Information and Communication Technology (ICT) solution. This classification is crucial since it directly impacts procurement policies and regulatory compliance. Our results show that Binary AHP enhanced the decision consistency, transparency, and reproducibility, and reduced the subjective discrepancies between the evaluators. Additionally, by inverting the priority vectors, the model allowed for a comparative analysis of both decision alternatives, thus offering more profound insights into the classification process. This study highlights the flexibility of AHP-based decision support methodologies and proposes a structured approach to refining binary decision frameworks in complex, multi-criteria environments.
1. Introduction
Decision-making has constituted a fundamental challenge throughout human history, influencing domains as diverse as science, engineering, governance, and management. In ancient civilizations, people often sought guidance from priests, kings, and oracles [1]. For instance, rulers and high priests in ancient Egypt were regarded as possessing the most effective solutions, whereas in classical Greece, oracles fulfilled this advisory role [1]. In contemporary contexts, decision-making increasingly relies on scientific methodologies and computational tools. Disciplines such as operations research, statistics, and computer science contribute to structuring and optimizing decisions by applying theories including linear programming, queueing system optimization, and multi-criteria decision-making [2].
In recent years, organizations have increasingly integrated multi-criteria decision analysis (MCDA) methods to balance tangible and intangible factors in complex decision processes [3]. Researchers and practitioners apply these methodologies across diverse fields, including public policy, economics, engineering, and business, to ensure rationality, transparency, and the incorporation of multiple perspectives [4]. Among these methodologies, the Analytic Hierarchy Process (AHP) provides a structured framework that enables decision-makers to compare alternatives based on predefined criteria [5].
Despite its widespread application, the AHP presents a notable limitation: it typically requires the evaluation of multiple alternatives, which complicates its direct use in binary decisions (i.e., yes/no choices) [6]. Many real-world decision-making scenarios, especially in public administration and regulatory frameworks, involve precisely these binary classifications. Researchers actively investigate binary decision models, particularly in economics, the social sciences, and financial markets [7,8,9]. Kirman [10] explored collective decision-making in ants through a simple binary choice model, and Sano [11] analyzed the fat-tailed distribution in stock markets and its relation to binary decisions.
Researchers have proposed several multi-criteria decision-making (MCDM) approaches to address decision challenges in various domains. TOPSIS (Technique for Order of Preference by Similarity to Ideal Solution) evaluates alternatives by measuring their distances from positive and negative ideal solutions [12]. A recent contribution, the Full Consistency Method (FUCOM), determines the criteria weights by minimizing the deviation from complete consistency in pairwise comparisons. In FUCOM, decision-makers rank criteria by importance and compare only the adjacent criteria, increasing the process’s efficiency and consistency [13].
Jafar Rezaei introduced the Best-Worst Method (BWM) in 2015 to streamline criteria weighting by requiring decision-makers to identify the most and least important criteria and then perform pairwise comparisons between these and all other criteria [14,15]. The Best-Worst Method (BWM) reduces the number of pairwise comparisons and improves the consistency by focusing on the most and least important criteria. However, certain limitations of BWM led to the decision not to adopt it in this study.
One key drawback arises when decision-makers provide judgments that lack complete consistency, particularly when more than three criteria exist; in such cases, the original non-linear BWM model sometimes yields multiple optimal solutions rather than a unique set of weights. Additionally, BWM requires experts to reach a consensus on the best and worst criteria. This process often challenges participants and sometimes fails to capture the diversity of expert opinions in complex environments [16].
Nevertheless, many researchers and practitioners continue to adopt the AHP as a leading decision support methodology because its structured pairwise comparison process effectively incorporates subjective preferences into decision-making [17]. Boucher et al. [18] emphasized that AHP requires at least two alternatives, which creates a challenge when decision-makers must choose between only two opposing options.
To address this gap, we introduce Binary AHP, an adaptation of the traditional AHP methodology explicitly designed for binary decision-making scenarios. This model retains the structured, hierarchical approach of the AHP and enables decision-makers to systematically evaluate two opposing alternatives, such as yes/no choices. We demonstrate the practical application of Binary AHP in the Brazilian public sector, where agencies must determine whether a technological solution qualifies as an Information and Communication Technology (ICT) solution. This classification is critical in shaping the procurement processes, funding allocation, and regulatory compliance. The proposed model increases the consistency, transparency, and comparability in such classifications; reduces the subjective biases; and improves the decision reliability.
The remainder of this article follows this structure: In Section 2, we present the foundations of the AHP method, addressing its hierarchical structure, the pairwise comparison process, and the mechanisms for evaluating the consistency of expert opinions. Section 3 describes the proposed Binary AHP model in detail, including the mechanism for inverting comparison matrices and the calculation of global priority vectors for both alternatives. Section 4 applies the case study to the Brazilian public administration context, covering the model structuring, issuance of expert opinions, analysis of inverted priority vectors, and the final classification of technological solutions. In Section 5, we offer a comparative analysis between Binary AHP and other multi-criteria methods, highlighting the advantages and limitations of the proposed model. Finally, Section 6 presents our conclusions, discusses the identified limitations, and suggests directions for future research.
2. The AHP Method
Decision-makers often analyze complex systems with multiple interdependent components, such as resources, objectives, people, or organizations. Thomas Saaty developed the Analytic Hierarchy Process (AHP) in 1980, which provides a structured approach for evaluating multiple criteria in decision-making scenarios [19]. This method allows decision-makers to decompose complex problems into hierarchical structures, enhancing the clarity and facilitating comparisons. Researchers widely apply the AHP in engineering, economics, healthcare, and public policy because it integrates qualitative and quantitative criteria into a logical decision-making framework [20].
A more detailed explanation of the AHP begins by structuring the decision problem into a hierarchy, which typically includes three levels: the overall goal at the top, the criteria and subcriteria that define decision parameters in the middle, and the alternatives at the bottom. This hierarchical breakdown enables decision-makers to systematically analyze each problem component, enhancing the transparency and understanding [21]. Next, decision-makers perform pairwise comparisons, assessing the relative importance of each pair of elements within the same level (for example, comparing two criteria or two alternatives) using Saaty’s scale, which ranges from 1 (equal importance) to 9 (extreme importance) [22].
These comparisons form a pairwise comparison matrix, and mathematical methods, such as the principal eigenvector approach, derive the priority vectors (weights). The process culminates by synthesizing priorities via combining the weights of criteria and alternatives to identify the most suitable option. A sensitivity analysis also assesses the robustness of the decision [21].
At its core, the AHP relies on hierarchical structuring, where decision-makers divide a problem into three levels: the goal (or objective), the criteria and subcriteria, and the alternatives under comparison. Decision-makers perform pairwise comparisons of these elements using Saaty’s numerical scale, which ranges from 1 to 9 to indicate the relative importance of one aspect over another, as detailed in Table 1 [23]. Figure 1 shows the hierarchical structure of the AHP and the logical arrangement of objectives, criteria, and decision alternatives.
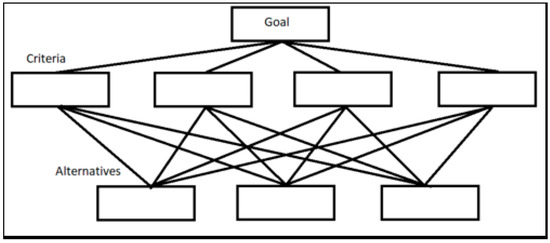
Figure 1.
A visual representation of the AHP method showing the hierarchical relationship between the decision goal, criteria, and alternatives (adapted from [24]).

Table 1.
Saaty’s pairwise comparison scale. Numerical scale used for pairwise comparisons in the AHP, providing a structured way to assign importance levels [25].
Table 1.
Saaty’s pairwise comparison scale. Numerical scale used for pairwise comparisons in the AHP, providing a structured way to assign importance levels [25].
| Intensity of Importance | Definition | Explanation |
|---|---|---|
| 1 | Equal importance | Both elements contribute equally. |
| 3 | Moderate importance | Experience and opinion favor one element over the other. |
| 5 | Strong importance | One element is strongly favored. |
| 7 | Very strong importance | One element is very strongly favored over the other. |
| 9 | Extreme importance | One element is overwhelmingly more important. |
| 2, 4, 6, 8 | Intermediate values | Used when a compromise between two judgments is needed. |
A key strength of the AHP lies in its ability to systematically handle subjectivity, as it allows experts to express preferences with a structured methodology. After performing pairwise comparisons, experts calculate the Consistency Ratio (CR) to assess whether the judgments remain logically coherent.
In group decision-making contexts, researchers primarily aggregate individual pairwise comparisons into a group comparison using the Aggregation of Individual Judgments (AIJ) and Aggregation of Individual Priorities (AIP). In the AIJ method, researchers compute the geometric mean of the individual judgments for each pairwise comparison, which produces a combined comparison matrix that preserves the reciprocal property of AHP matrices. Researchers then use this aggregated matrix to derive group priorities. In the AIP method, each participant calculates their priority vector, and the group priority results from averaging these vectors, usually using the arithmetic mean [26].
The criteria in the AHP model play a critical role, so decision-makers should carefully define them according to the decision context. Typical criteria include financial factors (e.g., cost, return on investment), strategic factors (e.g., alignment with organizational goals), risk-related factors (e.g., operational, regulatory, reputational risks), stakeholder-centric factors (e.g., customer satisfaction, employee engagement), and technical factors (e.g., feasibility, resource availability). Decision-makers can further break down these criteria into subcriteria to enable a more granular and customized analysis, which ensures that they systematically consider all relevant aspects of the decision problem. The process of selecting and structuring criteria and subcriteria fundamentally supports the robustness and clarity of the AHP decision model [27].
Analyze the Consistency of Opinions
In decision-making processes based on the AHP, evaluators may introduce inconsistencies in pairwise comparisons because of uncertainties, cognitive biases, or subjective judgment variations. Decision-makers need to assess the Consistency Ratio (CR) to ensure the reliability and coherence of expert evaluations. Saaty defines this ratio as a measure of logically consistent comparisons [5,6].
Inconsistency occurs when comparisons contradict each other. For example, if an evaluator assigns A > B and B > C, but then assigns C > A, this sequence introduces a logical inconsistency. Decision-makers must review and adjust their responses when the calculated CR exceeds 0.10 to mitigate such inconsistencies [5,6]. Decision-makers calculate the CR by multiplying each row of the comparison matrix by the corresponding priority vector to generate a weighted sum vector.
- λmax calculation—According to Saaty, one can estimate λmax, the principal eigenvalue of the matrix, by dividing the values in the weighted sum vector by the respective priority vector values [28].
- Consistency Index (CI) calculation—Saaty computes the Consistency Index using the following formula [28]:where n is the number of criteria or subcriteria in the comparison matrix.
- CR calculation—Saaty defines the Consistency Ratio (CR) as the result of dividing the Consistency Index (CI) by the Average Random Index (ARI), a predefined constant that varies depending on the matrix size [27]:
If the resulting CR is less than or equal to 0.10, the evaluators consider the judgments as consistent and make no adjustments. However, if the CR exceeds 0.10, the evaluators reassess their pairwise comparisons to improve the logical coherence [29].
Table 2 shows an example of a pairwise comparison matrix that evaluates the consistency of expert opinions, while Table 3 illustrates the corresponding weighted sum vector calculations. The evaluators calculate the Consistency Index (CI) using the λmax estimate, which they obtain by averaging the weighted sum values divided by their respective priority vector values (see Table 4).
Table 2.
Pairwise comparison matrix (between criteria) with a consistency check. An example of a pairwise comparison matrix used in a consistency analysis.
Table 3.
Weighted sum vector calculation. Calculation of the weighted sum vector to determine the principal eigenvalue.
Table 4.
λmax calculation and Consistency Index (CI). Determination of λmax and CI for consistency verification.
The method computes the Consistency Index (CI) as follows:
Researchers finalize the consistency verification by calculating the Consistency Ratio (CR). They divide the Consistency Index (CI) by the Average Random Inconsistency Index (ARI) for a 3 × 3 matrix, which equals 0.52, as shown in Table 5.
Table 5.
Average Random Inconsistency Index (ARI) by matrix dimension. Predefined ARI values based on matrix size for consistency evaluation.
The literature clarifies that the Average Random Index (ARI) does not represent a predefined constant. Instead, researchers calculate the ARI as the mean Consistency Index (CI) obtained from numerous randomly generated pairwise comparison matrices of the same order. Thus, the ARI reflects the expected level of inconsistency in random judgments and serves as a benchmark for evaluating the consistency of actual judgments in the AHP [30].
3. The Proposed Binary AHP
3.1. Mechanism and Logic of the Binary AHP
The Binary Analytic Hierarchy Process (Binary AHP) represents the main theoretical contribution of this work, as it adapts the classical AHP framework to address decision problems involving two mutually exclusive alternatives. While maintaining the hierarchical structure of goal, criteria, subcriteria, and alternatives, Binary AHP introduces a streamlined methodology focused on binary classification tasks, such as answering a yes/no question.
In this approach, experts perform pairwise comparisons for each criterion and subcriterion, systematically evaluating which of the two alternatives better fulfills the decision objective. They quantify these judgments using Saaty’s fundamental scale, which ensures consistency and transparency in the evaluation process. Experts construct pairwise comparison matrices for each level of the hierarchy and verify their consistency to maintain logical coherence in the expert judgments.
After confirming the consistency of the pairwise comparisons, experts calculate local priority vectors for both criteria and subcriteria. They then synthesize these vectors to form the global priority vector (VPG), which quantitatively represents the influence of each subcriterion on the final decision. Experts obtain the VPG by multiplying the priority vector of the criteria (VPC) by the priority vector of the subcriteria (VPS):
This global priority vector is computed separately for each alternative, providing a structured and objective basis for comparison.
3.2. Use of the Transposed Pairwise Comparison Matrix
The proposed Binary AHP introduces a distinctive feature: experts use the transposed pairwise comparison matrix to enhance the decision robustness and impartiality. When experts recalculate the priority vectors from the perspective of the opposite alternative by transposing the original comparison matrix, they achieve several benefits:
- They validate the consistency and symmetry of the assigned weights, ensuring the model does not unintentionally favor one alternative.
- They facilitate direct and transparent comparisons between the alternatives, strengthening the decision process’s reliability.
- They avoid the need to reconstruct the entire model for each alternative, thereby optimizing the workflow.
- They help identify and correct inconsistencies in expert judgments, increasing the decision quality.
This dual-perspective analysis is particularly valuable in binary decision contexts, where fairness and methodological rigor are paramount.
3.3. Development of the Global Priority Vector
After experts establish consistent pairwise comparisons, they synthesize the local priorities into a global priority vector for each alternative. This global priority vector quantifies the overall influence of each subcriterion and provides a clear, objective metric for decision-making.
For each alternative (e.g., ICT and non-ICT), experts sum the priority scores assigned to each subcriterion to yield the final score:
The alternative with the highest total score is selected, ensuring a quantitative, structured, and unbiased classification.
3.4. Methodological Steps: Flowchart Summary
To facilitate understanding and implementation, the steps for summarizing the proposed Binary AHP method are presented below:
Step 1: Define the objective and alternatives.
↓
Step 2: Structure hierarchy: criteria and subcriteria.
↓
Step 3: Pairwise comparisons by experts.
↓
Step 4: Check the consistency of the judgments.
↓
Step 5: Calculate the priority vectors (criteria and subcriteria).
↓
Step 6: Compute the global priority vector (VPG = VPC × VPS).
↓
Step 7: Use the transposed matrix for opposite alternative.
↓
Step 8: Calculate the priority vectors (criteria and subcriteria) for opposite alternative.
↓
Step 9: Compute the global priority vector (VPG = VPC × VPS) for opposite alternative.
↓
Step 10: Sum the priority scores for each alternative.
↓
Step 11: Make the final classification decision.
4. Case Study
To demonstrate the applicability of the proposed Binary AHP model, its application addressed a real-world decision-making challenge encountered by a Brazilian public agency linked to the Executive Branch, specifically in the justice and public security sector. The core issue involved determining whether specific technological solutions qualified as Information and Communication Technology (ICT) solutions. This classification is crucial because it directly impacts procurement policies, regulatory compliance, and the allocation of financial and technological resources.
The lack of transparent and standardized criteria for this classification process led to inconsistencies in decision-making, which created operational inefficiencies and administrative challenges. Different sectors within the agency often interpreted the classification differently, resulting in subjective and sometimes conflicting decisions. For example, some departments considered items such as UPS devices or multimedia kits as non-ICT solutions, while others included them under the ICT category. This variability in interpretation caused delays, increased the bureaucratic complexity, and undermined the transparency of procurement decisions.
Currently, decision-makers in the agency rely primarily on individual judgment for ICT classification without using a structured decision support tool. As a result, the process remains susceptible to inconsistencies, inefficiencies, and potential legal uncertainties. The Binary AHP model provides a systematic and transparent framework to address these challenges by structuring decision-making criteria and reducing subjectivity in the classification process.
We followed a structured methodology in this case study to apply the Binary AHP model. First, we defined the two opposing alternatives ”YES” (qualifies as ICT) and “NO” (does not qualify as ICT) as the decision options. Next, we established the decision criteria and subcriteria based on official documents and expert consultation. We conducted pairwise comparisons using Saaty’s numerical scale and calculated the priority vectors for each alternative. We then inverted the process to enhance the comparability by generating priority vectors for the alternative classification (“NO”). This approach allowed us to compare the decision scenarios directly and ensure a more structured and objective analysis. The following subsections detail the hierarchical structuring of the model, the pairwise comparison process, and the results obtained from the Binary AHP application.
4.1. Structuring the Hierarchical Model
We developed a hierarchical decision model based on the Binary AHP framework to ensure a structured and objective classification process. This model systematically assessed whether a given technological solution qualified as an ICT solution according to predefined criteria. The hierarchical structure consisted of three levels: (1) Decision determining whether a given solution qualified as ICT; (2) evaluation criteria and subcriteria factors used to assess the solution’s relevance to ICT; and (3) decision alternatives, i.e., the two possible classification outcomes: yes (ICT solution) and no (non-ICT solution).
We began structuring the model by conducting a document content analysis and reviewing official regulations, policies, and procurement guidelines related to ICT classification. This analysis identified the key criteria and subcriteria that justify an ICT classification. Additionally, input from subject matter experts ensured that the model captured relevant decision factors and aligned with existing administrative and legal frameworks. Based on these findings, the decision criteria were established to reflect the essential characteristics of ICT solutions, such as data-processing requirements, software and hardware dependencies, cybersecurity implications, and technological functionalities. Each criterion was then divided into subcriteria to provide a more detailed evaluation framework.
Figure 2 presents the resulting hierarchical structure of the decision model and illustrates how the decision goal, criteria, subcriteria, and classification alternatives interrelate. This structured approach enables decision-makers to systematically compare alternatives using pairwise comparisons, ensuring greater transparency and consistency in ICT classification. This hierarchical model forms the foundation for applying the Binary AHP methodology, which we elaborate on in the subsequent sections, including the pairwise comparison process, consistency evaluation, and final classification results.
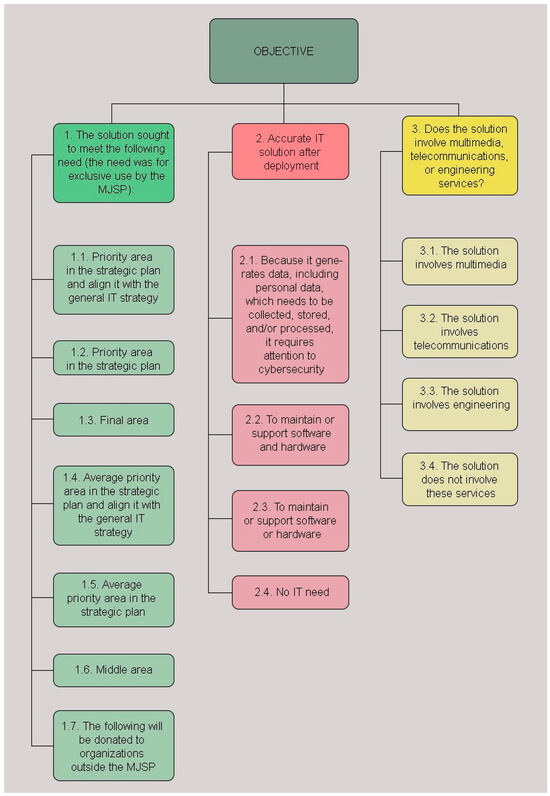
Figure 2.
A representation of the decision hierarchy, showing the relationship between the classification goal, criteria, subcriteria, and decision alternatives.
4.2. Issuance of Opinions and Evaluations
The Binary AHP method required us to conduct pairwise comparisons to evaluate the relative importance of each criterion and subcriterion. In this process, we collected expert opinions from five professionals with expertise in ICT classification, public procurement, and decision analysis. We used the experts’ assessments to construct comparison matrices, which served as the basis for prioritizing the decision factors.
To ensure the consistency and reliability in the evaluation process, each expert provided pairwise comparisons for the criteria and subcriteria using Saaty’s numerical scale. This scale, ranging from 1 to 9, enabled the experts to express their judgments regarding the relative importance of two elements at a time. We structured the comparisons to assess the influence of each criterion on the ICT classification decision by considering aspects such as data-processing requirements, cybersecurity implications, technological integration, and operational dependencies.
After collecting the pairwise comparisons, we aggregated and normalized the results to generate priority vectors for each criterion and subcriterion. These priority vectors represented the relative weights assigned to each decision factor, which ensured that the most critical elements exerted a greater influence on the final classification. Table 6 presents an example of a pairwise comparison matrix for one of the main criteria and illustrates the structure and evaluation of the comparisons.
Table 6.
Example of pairwise comparison matrix (between criteria). A sample matrix illustrating the relative importance assigned to different criteria in the ICT classification process.
After we completed the pairwise comparisons, we normalized the comparison matrix to ensure all the values appeared on a consistent scale. Table 7 presents the normalized pairwise comparison matrix, where each value resulted from dividing the original matrix elements by the sum of their respective columns. This step ensured that the weight distribution between the criteria remained proportionally adjusted.
Table 7.
Normalized pairwise comparison matrix (between criteria). The normalized version of the pairwise comparison matrix, which ensured values were expressed on a proportional scale.
After constructing the comparison matrices, we calculated the Consistency Ratio (CR) to ensure the logical coherence of the expert evaluations. A CR below 0.10 indicates that the judgments remain consistent and support reliable decision-making. If the CR exceeded this threshold, experts reviewed and refined their assessments to improve the consistency. Following the normalization process, the analysis computed the priority vector for each criterion by calculating the arithmetic mean of each row in the normalized matrix. Table 8 presents the priority vector matrix, which shows the relative importance of each criterion in the classification decision.
Table 8.
Priority vector matrix (between criteria). The priority vector for each decision criterion, calculated as the arithmetic mean of the normalized matrix values.
After completing this process, we obtained normalized priority vectors, which served as the input for the final decision analysis. These values were then applied in the Binary AHP framework to enable a structured comparison of the yes and no classification alternatives. The following sections detail the results of this evaluation and analyze the global priority vectors for both options. With the criteria priority weights established, pairwise comparisons were conducted for the subcriteria under each main criterion. At this level, the process applied the same pairwise comparison, normalization, and priority vector calculation steps. Table 9 presents an example of a pairwise comparison matrix for the subcriteria under Criterion 1.
Table 9.
Pairwise comparison matrix (alternatives of Criterion 1). Comparison of the subcriteria under Criterion 1, showing the relative importance assigned to each factor.
The same procedure was repeated for the other criteria and subcriteria, generating the corresponding pairwise comparison matrices and priority vectors. Table 10 and Table 11 provide additional examples of these comparisons for Criteria 2 and 3. After finalizing all the pairwise comparisons, we calculated the Consistency Ratio (CR) to verify the logical coherence. The results were then used in the Binary AHP framework, enabling a structured comparison between the yes and no alternatives.
Table 10.
Pairwise comparison matrix (alternatives of Criterion 2). Comparison matrix for the subcriteria under Criterion 2, reflecting their relative importance.
Table 11.
Pairwise comparison matrix (alternatives of Criterion 3). Comparison matrix for the subcriteria under Criterion 3, establishing relative priorities.
Table 12 presents the computed VPG values, demonstrating the weight distribution across all the subcriteria.
Table 12.
Computation of the global priority vector (VPG) based on the AHP weights. The global priority vector values obtained by multiplying the criterion and subcriterion priority vectors.
This priority ranking determined the relative influence of each subcriterion and ensured that more significant factors received higher weights. The decision-makers used these weights to determine whether a solution qualifies as ICT or non-ICT by applying a defined threshold to guide the classification. The global priority vector was crucial in enhancing the transparency and consistency in the decision-making. By relying on quantitative, evidence-based comparisons rather than subjective judgment alone, the decision-makers ensured that each evaluation remained objective. By structuring the decision hierarchy this way, the Binary AHP framework helped standardize the ICT classification across the public agencies and reduced the discrepancies in procurement decisions.
As discussed in the next section, we refined the classification process by developing an inverse priority vector, which enabled a direct comparison between the ICT and non-ICT classifications. This procedure provided comprehensive validation of the decision framework and further strengthened the reliability of the proposed model.
4.3. Definition of Priority Vectors Opposed to ICT
We conducted an inverse analysis to validate the decision-making framework by defining priority vectors for the alternative classification (i.e., non-ICT). This step ensured that the Binary AHP methodology remained consistent when we applied it to opposing alternatives—ICT and non-ICT classifications—without requiring an entirely new evaluation process. The inverse priority vector approach enabled the decision-makers to analyze how the classification changed when considering the same evaluation criteria from the opposite perspective. This methodology ensured that the decision framework remained balanced, unbiased, and adaptable to different classification contexts.
In the reversal process, we maintained the original decision hierarchy and inverted the weight distribution so that the criteria that favored the ICT classification now supported the non-ICT classification, while the criteria that previously weakened the ICT classification now strengthened the non-ICT alternative. This approach eliminated redundancy because it prevented the need for a separate decision model and allowed for a comprehensive evaluation of both possibilities.
Table 13 displays the inverted pairwise comparison matrix between the main criteria, which was recalculated for the non-ICT classification alternative. This table also presents the updated priority vector and consistency ratio for the criteria in the non-ICT scenario. In contrast, Table 14 provides the recalculated pairwise comparison matrix for the subcriteria under Criterion 1, specifically for the non-ICT classification. This table details the priority vectors for each subcriterion and the corresponding consistency ratio, reflecting the evaluation of alternatives within this specific criterion.
Table 13.
Inverted pairwise comparison matrix (between criteria). Comparison matrix recalculated for the non-ICT classification alternative.
Table 14.
Inverted pairwise comparison matrix (alternatives of Criterion 1). Recalculated pairwise comparisons for the subcriteria under Criterion 1 in the non-ICT classification.
This process ensured the robustness of the decision-making model, as the priority weights remained consistent when classifying a solution as either ICT or non-ICT. Directly comparing the two sets of priority vectors increased the transparency, reliability, and applicability of the Binary AHP model. By using inverted priority vectors, we strengthened the validation process and confirmed that the classification logic remained sound from both perspectives. This method provided a structured approach to verify the classification decisions, which ensured that the outcomes did not favor a particular alternative and that the model remained fair and objective across different classification contexts.
Following the same procedure, we recalculated pairwise comparisons for the subcriteria of each criterion under the non-ICT classification. Table 15 and Table 16 present the results for Criteria 2 and 3, respectively, illustrating the inverse weight distributions. Table 17 summarizes the criteria values after the inversion, as determined by applying the AHP methodology.
Table 15.
Inverted pairwise comparison matrix (alternatives of Criterion 2). Recalculated pairwise comparisons for the subcriteria under Criterion 2 in the non-ICT classification.
Table 16.
Inverted pairwise comparison matrix (alternatives of Criterion 3). Recalculated pairwise comparisons for the subcriteria under Criterion 3 in the non-ICT classification.
Table 17.
Values of the criteria after the inversion, as defined by the application of the AHP.
This inverse prioritization process validated the Binary AHP model because it confirmed that the classification logic remained consistent when we applied it to both ICT and non-ICT alternatives. We have already established and presented the priority weights for the ICT scenario (see Table 12). In the following section, we focus on a direct comparison between the computed weights for both classifications.
4.4. Final Classification
The final classification results (Table 18) show that the Binary AHP model successfully differentiated the ICT and non-ICT solutions based on the assigned priority scores. When the ICT score exceeded the non-ICT score, the solution was classified as ICT; when the non-ICT score was higher, the solution was classified as non-ICT. The solutions with strong technological dependencies, such as cloud computing, software, and digital certificates, consistently received higher ICT scores. In contrast, peripherals, accessories, and services that did not directly contribute to the ICT infrastructure obtained higher non-ICT scores.
Table 18.
Final classification of ICT and non-ICT solutions. Comparison of ICT and non-ICT priority scores to determine the final classification of technological solutions.
This quantitative classification approach removed the ambiguity and subjective inconsistencies, which ensured that the procurement decisions followed a structured and transparent evaluation framework. The results confirmed that the Binary AHP methodology effectively classified the technological solutions and provided an objective basis for public sector procurement process decision-making.
5. Comparative Analysis
A comparative analysis of the Binary AHP method with traditional AHP and other multi-criteria decision-making (MCDM) approaches revealed significant advantages in binary decision contexts. Conventional AHP requires the comparison of multiple alternatives, which creates a structural limitation when we apply it to purely binary (yes/no) decision scenarios. In contrast, Binary AHP addresses this limitation while retaining the core strengths of traditional AHP, such as clear hierarchical structuring and systematic pairwise comparison, by adapting its implementation to dichotomous choices.
Unlike TOPSIS, which evaluates alternatives by measuring their distances from ideal solutions, Binary AHP directly incorporates two opposing alternatives within a single, coherent decision framework, eliminating the need to assess multiple intermediate options. When comparing Binary AHP with the Best-Worst Method (BWM), which requires consensus between experts on the best and worst criteria, Binary AHP offers greater flexibility to accommodate divergent expert opinions on critical aspects in complex decision environments, such as the public sector. Furthermore, while the FUCOM method streamlines the weighting process by minimizing the total deviation from consistency in the pairwise comparisons, Binary AHP provides the additional advantage of validating decision robustness through the transposed comparison matrix. This feature enables cross-verification and significantly enhances the confidence in the outcome.
By allowing the evaluation of the decision from both perspectives (yes/no), Binary AHP ensures a more balanced and impartial analysis than traditional methods typically provide. By enabling a direct comparison of two mutually exclusive alternatives and incorporating mechanisms for verifying consistency and symmetry, Binary AHP offers a transparent and reproducible framework for binary classification problems.
6. Conclusions
This paper introduces a Binary AHP-based decision support model for binary classification in the context of ICT procurement in the public sector. We adapted the Analytic Hierarchy Process (AHP) to enable a structured and reproducible classification of technological solutions as ICT or non-ICT. The Binary AHP framework organizes the decision process through a hierarchical structure, pairwise comparisons, and consistency analysis, that aim to reduce subjectivity and increase logical consistency.
We resolved inconsistencies in ICT classification by applying the model to a case from a Brazilian public agency. The global priority vector, which was derived from expert evaluations, provided the basis for classification. The analysis with the inverse priority vector supported the robustness of the model by confirming a balanced weight distribution between alternatives. The results show that solutions dependent on software, data processing, and security received classifications as ICT, while accessories, peripherals, and services unrelated to technology received classifications as non-ICT.
Public administrators can incorporate the Binary AHP model to support ICT classification decisions. Its use may contribute to greater uniformity and transparency in procurement and regulatory activities. The model also provides a documented decision trail that supports audits and reviews. Its structure enables integration with existing ICT governance and procurement systems.
This study had some limitations. The case study was restricted to a single public sector context, which may limit the direct transferability of the model to other domains without adaptation. Although structured and validated for consistency, the model relies on expert judgments, which may still introduce some subjectivity. Another limitation is the requirement that all questions be binary since the model explicitly targets dichotomous decision problems. This constraint may restrict its applicability in scenarios where the decision criteria or alternatives do not naturally conform to a binary structure.
Future research could extend the Binary AHP model to other binary classification contexts, such as policy decisions, project approvals, or risk assessments. Researchers could also explore integrating Binary AHP with other decision-making methodologies or with machine learning techniques to automate parts of the process and enable real-time decision support. Comparative analyses in different organizational and regulatory environments would help evaluate the model’s adaptability and identify necessary modifications. Longitudinal studies could examine the stability of the model’s classifications as technological and regulatory landscapes evolve.
Author Contributions
Conceptualization, F.R.M., M.A.C.G. and R.R.N.; methodology, R.R.N. and F.R.M.; software, M.A.C.G.; validation, R.R.N., R.R.d.S. and E.G.d.S.; formal analysis, R.R.d.S.; investigation, R.R.N.; resources, R.R.N. and R.R.d.S.; data curation, F.R.M. and M.A.C.G.; writing—original draft preparation, E.G.d.S., F.R.M. and L.A.R.J.; writing—review and editing, E.G.d.S., M.A.C.G., L.A.R.J. and R.R.d.S.; visualization, E.G.d.S. and L.A.R.J.; supervision, R.R.N.; project administration, R.R.N. All authors have read and agreed to the published version of the manuscript.
Funding
This research received no external funding.
Data Availability Statement
The data are contained within this article.
Acknowledgments
Project “TED 33/2023–APPLIED RESEARCH IN PRIVACY AND INFORMATION SECURITY AT THE DIRECTORATE OF PRIVACY AND INFORMATION SECURITY OF THE SECRETARIAT FOR DIGITAL GOVERNMENT” partially funded this study. Thanks to the Directorate of Privacy and Information Security (DEPSI)/Center of Excellence in Privacy and Security (CEPS)/Secretariat for Digital Government (SGD) of the Ministry of Management and Innovation in Public Services of the Federal Government (MGI).
Conflicts of Interest
The authors declare no conflicts of interest.
References
- Triantaphyllou, E.; Triantaphyllou, E. Multi-Criteria Decision Making Methods, 3rd ed.; Springer: New York, NY, USA, 2000; pp. 5–21. [Google Scholar]
- Keiko, L.; Shimizu, T.; Jansen, U. Uma análise de investimentos considerando fatores intangíveis. In Proceedings of the XXIV Encontro Nacional de Engenharia de Produção, Florianópolis, Brazil, 3–6 November 2004. [Google Scholar]
- Campos, V.R.; Castillo, L.A.M.; Cazarini, E.W. Modelagem do apoio à decisão multicritério utilizando a metodologia EKD. In XXX Encontro Nacional de Engenharia de Produção; Abepro: São Paulo, Brazil, 2010; pp. 1–13. Available online: https://www.academia.edu/download/46077654/enegep2010_TN_STO_118_770_15289.pdf (accessed on 17 December 2024).
- Belton, V.; Stewart, T. Multiple Criteria Decision Analysis: An Integrated Approach, 3rd ed.; Springer: London, UK, 2002; pp. 1–372. [Google Scholar]
- D’Apuzzo, L.; Marcarelli, G.; Squillante, M. Analysis of Qualitative and Quantitative Rankings in Multicriteria Decision Making. In Proceedings of the International Advances in Economic Research, Sorrento, Italy, 2009; Available online: https://link.springer.com/chapter/10.1007/978-88-470-1083-3_10 (accessed on 17 December 2024).
- Junior, C.A.; Piratelli, C.L.; Pacheco, B.C.S. Métodos de apoio à decisão multicritério: Uma revisão sobre aplicações em avaliação da educação. Braz. J. Dev. 2022, 8, 6129–6143. [Google Scholar] [CrossRef]
- Moran, J.; Fosset, A.; Kirman, A.; Benzaquen, M. From ants to fishing vessels: A simple model for herding and exploitation of finite resources. J. Econ. Dyn. Control 2021, 129, 104169. [Google Scholar] [CrossRef]
- Holehouse, J.; Pollitt, H. Non-equilibrium time-dependent solution to discrete choice with social interactions. arXiv 2021, arXiv:2109.09633. [Google Scholar] [CrossRef] [PubMed]
- Holehouse, J.; Moran, J. Exact time-dependent dynamics of discrete binary choice models. arXiv 2022, arXiv:2201.09573. [Google Scholar]
- Kirman, A. Ants, rationality, and recruitment. Q. J. Econ. 1993, 108, 137–156. [Google Scholar] [CrossRef]
- Sano, K. Binary Decision Model and Fat Tails in Financial Market. Appl. Sci. 2022, 12, 7019. [Google Scholar] [CrossRef]
- Kabassi, K.; Virvou, M. A Technique for Preference Ordering for Advice Generation in an Intelligent Help System. In Proceedings of the International Conference on Systems, Man and Cybernetics, The Hague, The Netherlands, 10–13 October 2004. [Google Scholar]
- Božanić, D.; Tešić, D.; Milić, A. Multicriteria decision making model with Z-numbers based on FUCOM and MABAC model. Decis. Mak. Appl. Manag. Eng. 2020, 3, 19–36. [Google Scholar] [CrossRef]
- Rezaei, J. Best-worst multi-criteria decision-making method. Omega 2015, 53, 49–57. [Google Scholar] [CrossRef]
- Wan, S.P.; Dong, J.Y.; Chen, S.M. A novel intuitionistic fuzzy best-worst method for group decision making with intuitionistic fuzzy preference relations. Inf. Sci. 2024, 666, 120404. [Google Scholar] [CrossRef]
- Rezaei, J. A concentration ratio for nonlinear best worst method. Int. J. Inf. Technol. Decis. Mak. 2020, 19, 891–907. [Google Scholar] [CrossRef]
- Ayala, N.F.; Frank, A.G. Métodos de análise multicriterial: Uma revisão das forças e fraquezas. In Anais da 13ª Semana de Engenharia de Produção Sul Americana; FEEng: Porto Alegre, Brasil, 2013; pp. 1–10. [Google Scholar]
- Boucher, T.; Gogus, O.; Wicks, E. A Comparison Between Two Multiattribute Decision Methodologies Used in Capital Investment Decision Analysis. Eng. Econ. 1997, 42, 179. [Google Scholar] [CrossRef]
- Angeloni, M.T. Elementos intervenientes na tomada de decisão. Ciência Da Informação 2003, 32, 17–22. [Google Scholar] [CrossRef]
- Saaty, T.L. The Analytic Hierarchy Process, 2nd ed.; McGraw-Hill: New York, NY, USA, 1980; pp. 1–287. [Google Scholar]
- Kriswardhana, W.; Toaza, B.; Esztergár-Kiss, D.; Duleba, S. Analytic hierarchy process in transportation decision-making: A two-staged review on the themes and trends of two decades. Expert Syst. Appl. 2024, 261, 125491. [Google Scholar] [CrossRef]
- Testoni, P.S.; Tramarico, C.L.; Rodríguez, E.C.A.; Marins, F.A.S. Analytic hierarchy process applied in the prioritization of third-party logistics providers in banking services. Production 2024, 34, e20230108. [Google Scholar] [CrossRef]
- Mu, E.; Pereyra-Rojas, M. Practical Decision Making. In SpringerBriefs in Operations Research; Springer: Cham, Switzerland, 2017. [Google Scholar] [CrossRef]
- Saaty, T.L. Fundamentals of Decision Making and Priority Theory with the Analytic Hierarchy Process, 2nd ed.; RWS Publications: Pittsburgh, PA, USA, 2013. [Google Scholar]
- Roche, H.; Vejo, C. Analisis multicriterio en la toma de decisiones. In Métodos Cuantitativos Aplicados a la Administración: Analisis Multicritério–AHP; Material de Apoio AHP; 2004; pp. 1–11. Available online: https://feparunsa.wordpress.com/wp-content/uploads/2012/07/amc_aplicado_administracion.pdf (accessed on 7 May 2025).
- Wu, W.H.; Chiang, C.T.; Lin, C.T. Comparing the aggregation methods in the analytic hierarchy process when uniform distribution. WSEAS Trans. Bus. Econ. 2008, 5, 82–87. [Google Scholar]
- SIXSIGMA.us. Comprehensive Guide to Analytic Hierarchy Process (AHP). Available online: https://www.6sigma.us/six-sigma-in-focus/analytic-hierarchy-process-ahp/ (accessed on 22 April 2025).
- Saaty, T.L. Decision Making for Leaders: The Analytic Hierarchy Process for Decisions in a Complex World, 3rd ed.; RWS Publications: Pittsburgh, PA, USA, 2012. [Google Scholar]
- Cheng, E.W.; Li, H. Information priority-setting for better resource allocation using analytic hierarchy process (AHP). Inf. Manag. Comput. Secur. 2001, 9, 61–70. [Google Scholar] [CrossRef]
- Pant, S.; Kumar, A.; Ram, M.; Klochkov, Y.; Sharma, H.K. Consistency indices in analytic hierarchy process: A review. Mathematics 2022, 10, 1206. [Google Scholar] [CrossRef]
Disclaimer/Publisher’s Note: The statements, opinions and data contained in all publications are solely those of the individual author(s) and contributor(s) and not of MDPI and/or the editor(s). MDPI and/or the editor(s) disclaim responsibility for any injury to people or property resulting from any ideas, methods, instructions or products referred to in the content. |
© 2025 by the authors. Licensee MDPI, Basel, Switzerland. This article is an open access article distributed under the terms and conditions of the Creative Commons Attribution (CC BY) license (https://creativecommons.org/licenses/by/4.0/).