
Fracture Toughness Behaviour of Nickel Alloy Steel 1.5662


Abstract
1. Introduction
2. Experimental Investigation
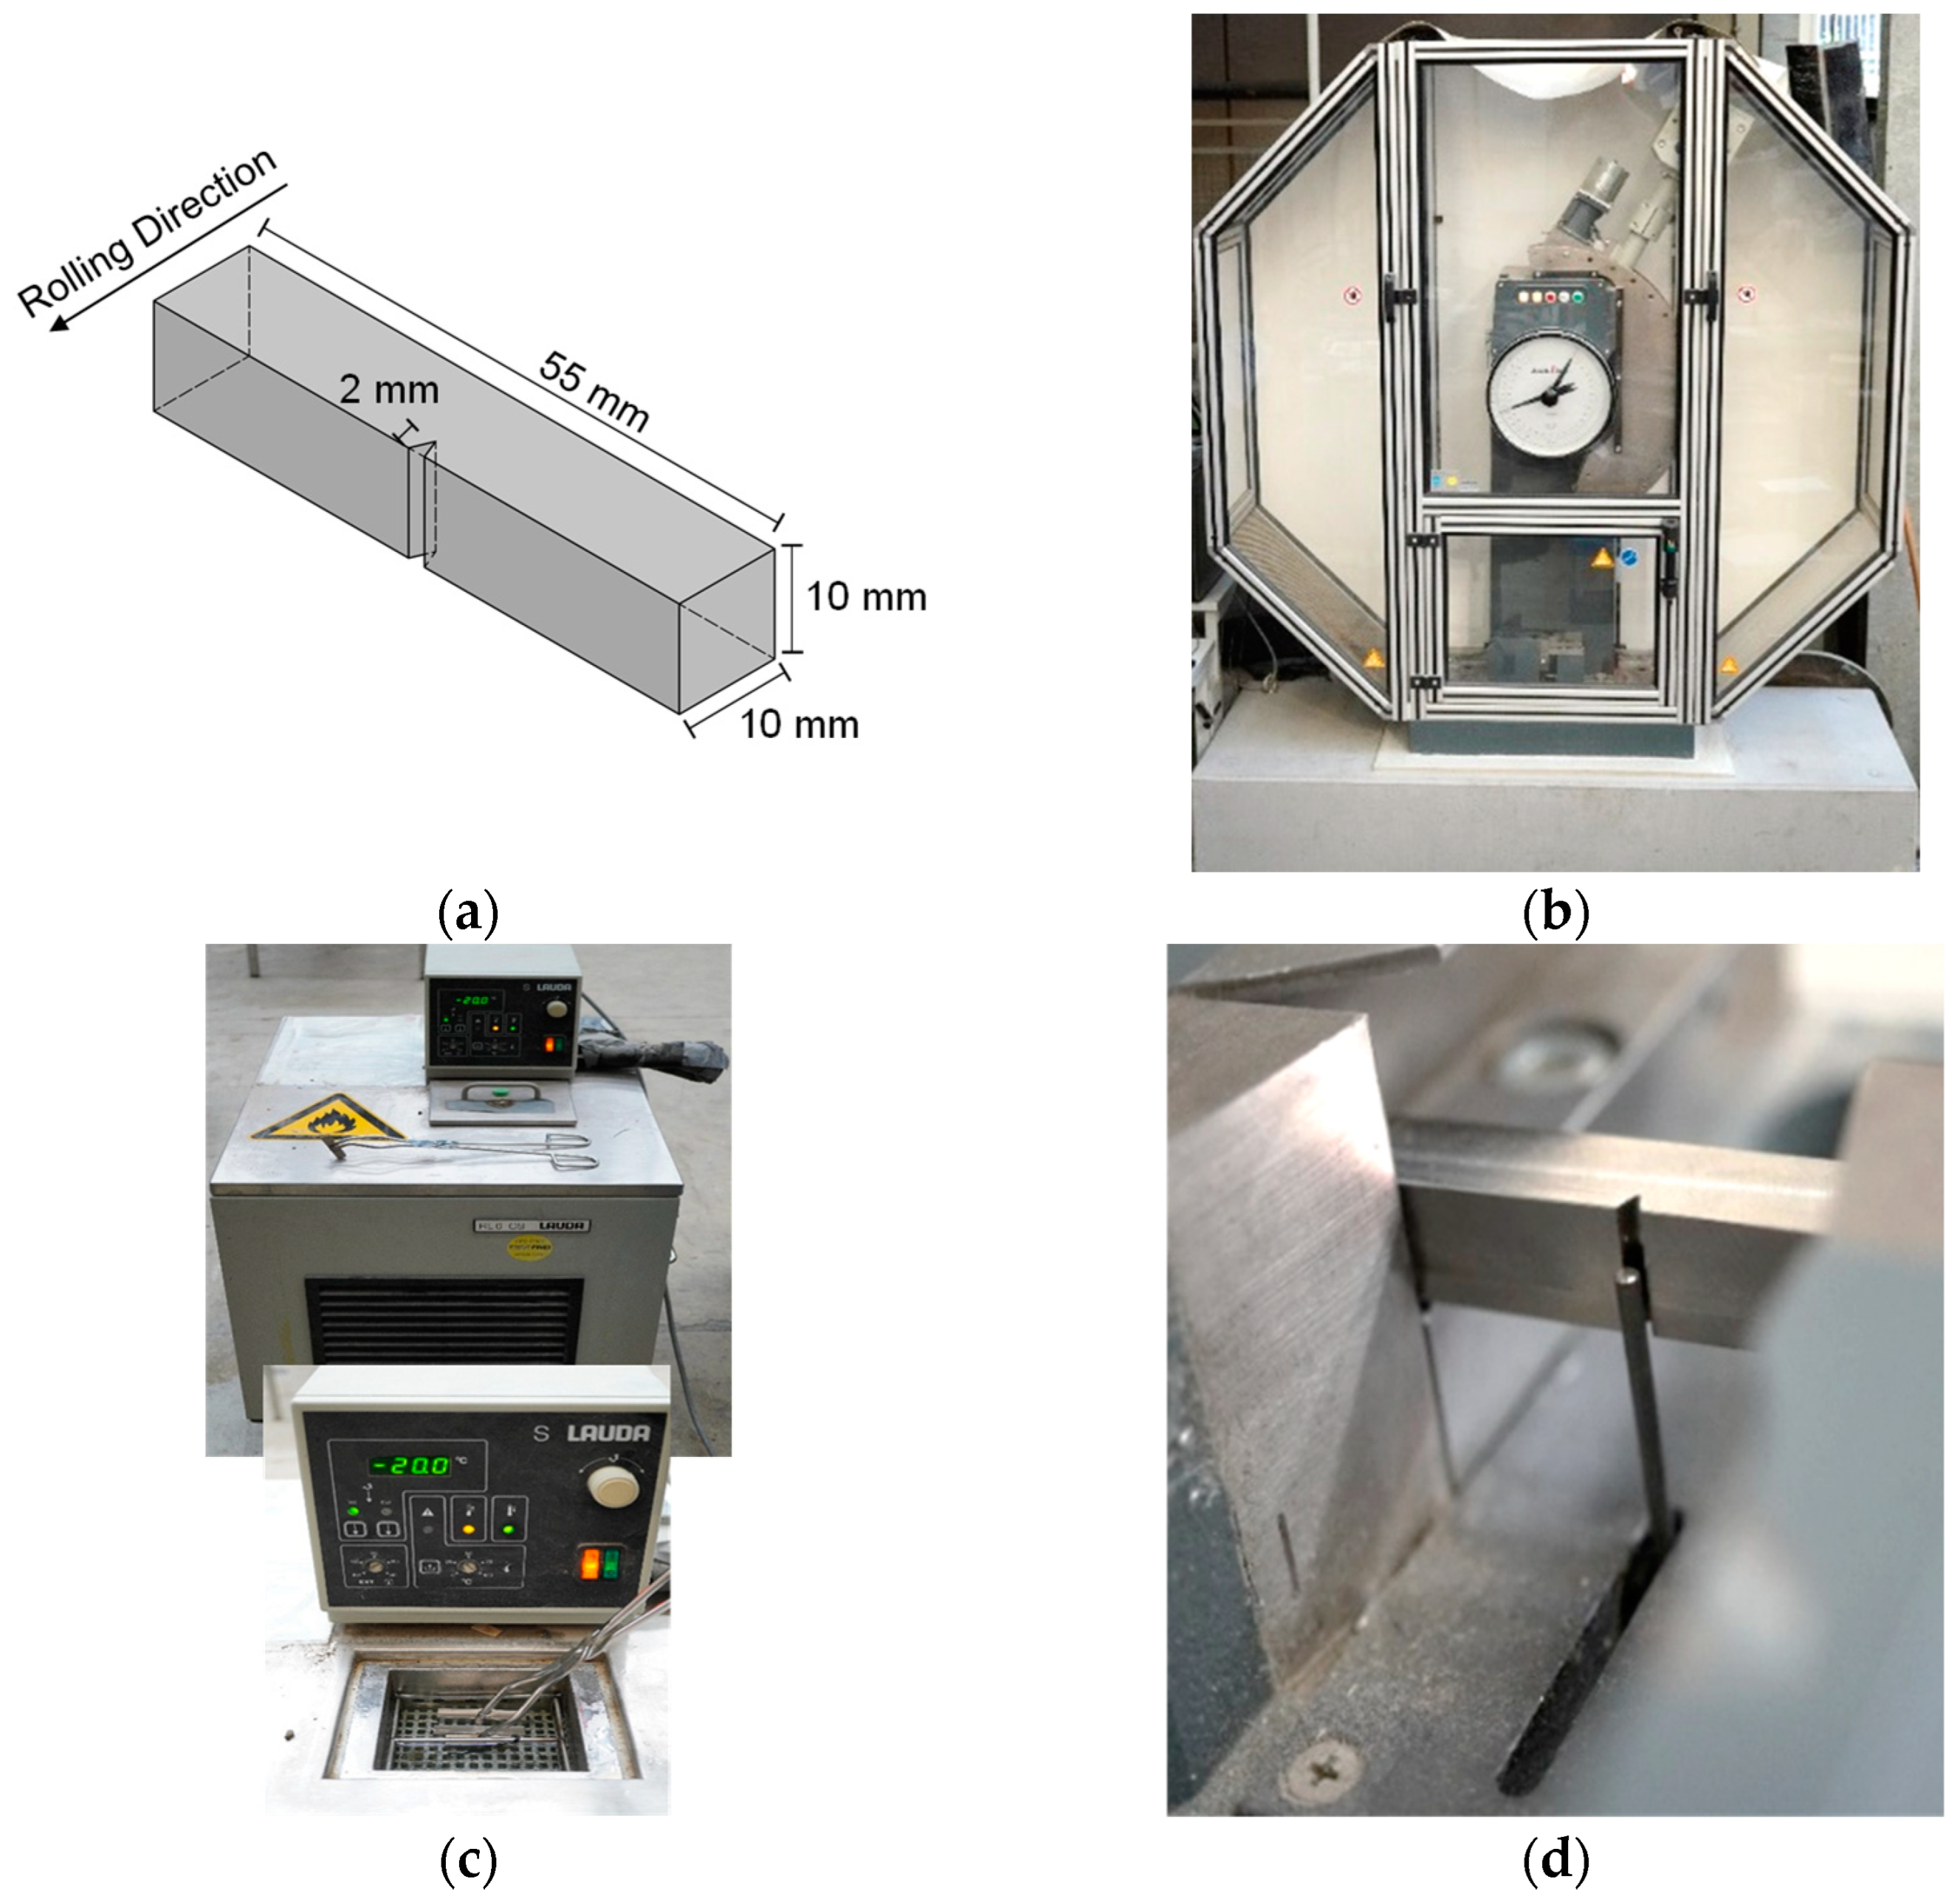
2.1. Charpy-V Impact Tests
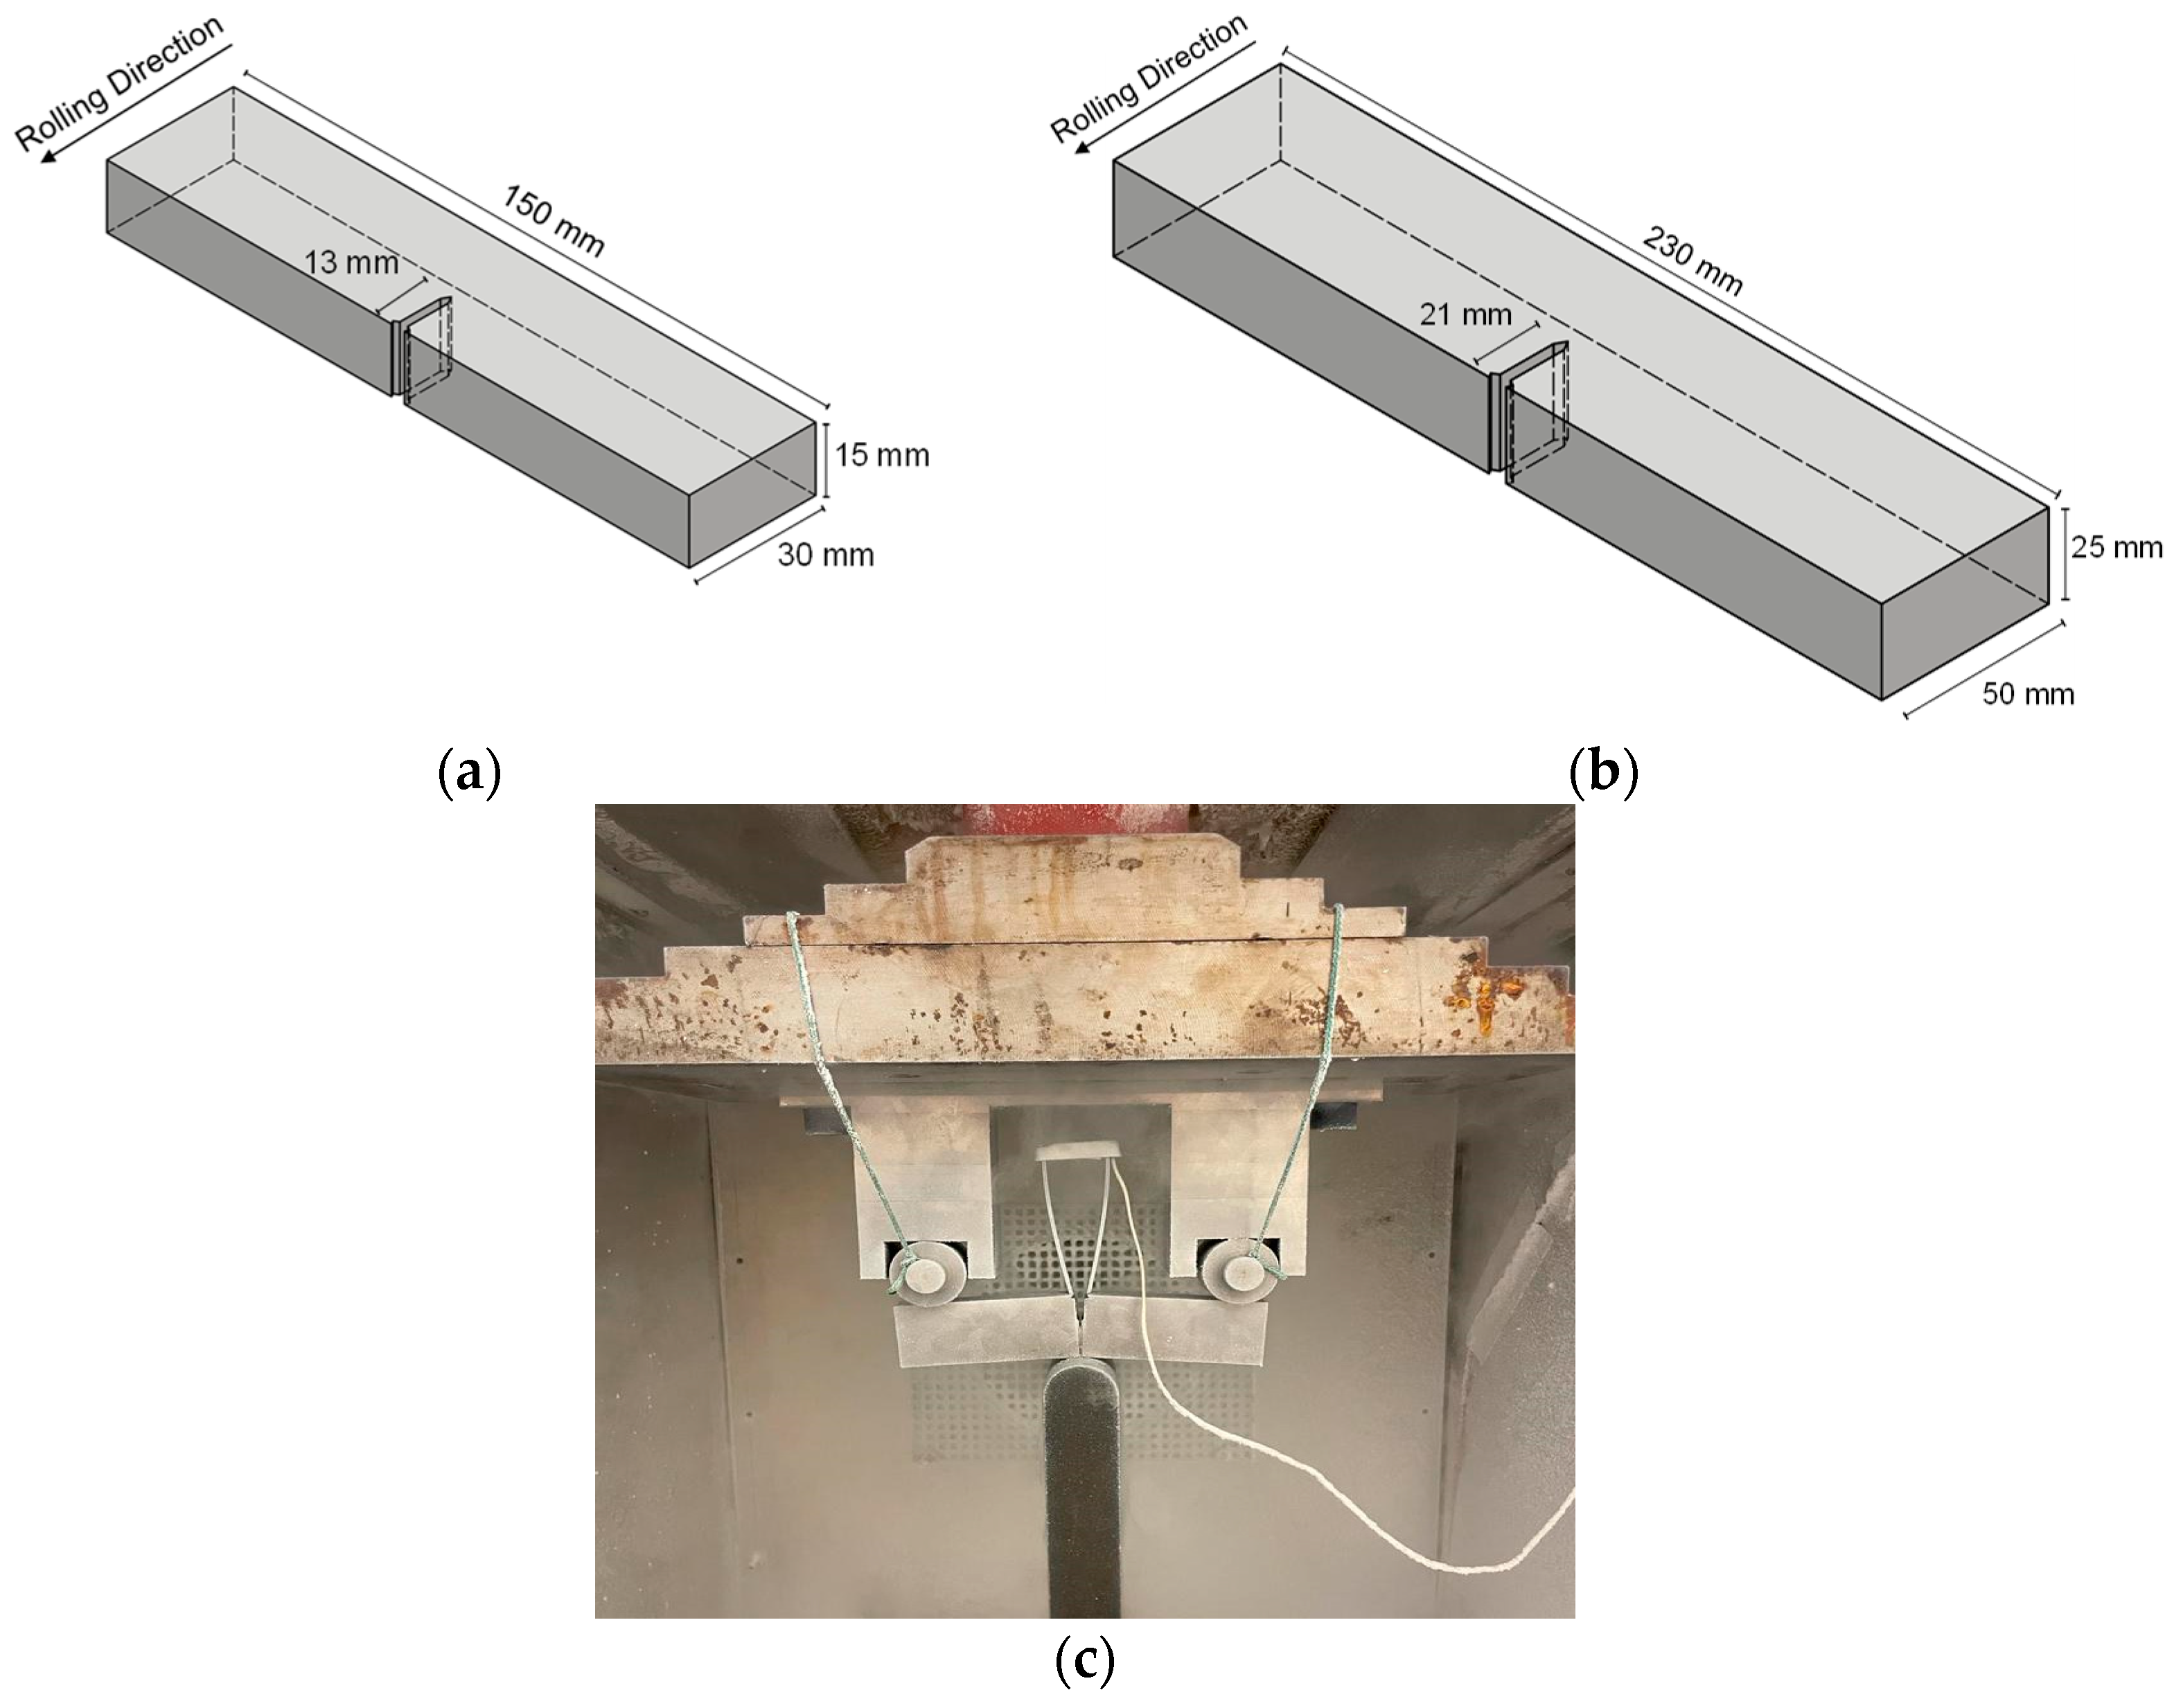
2.2. Fracture Toughness Tests
3. Conclusions
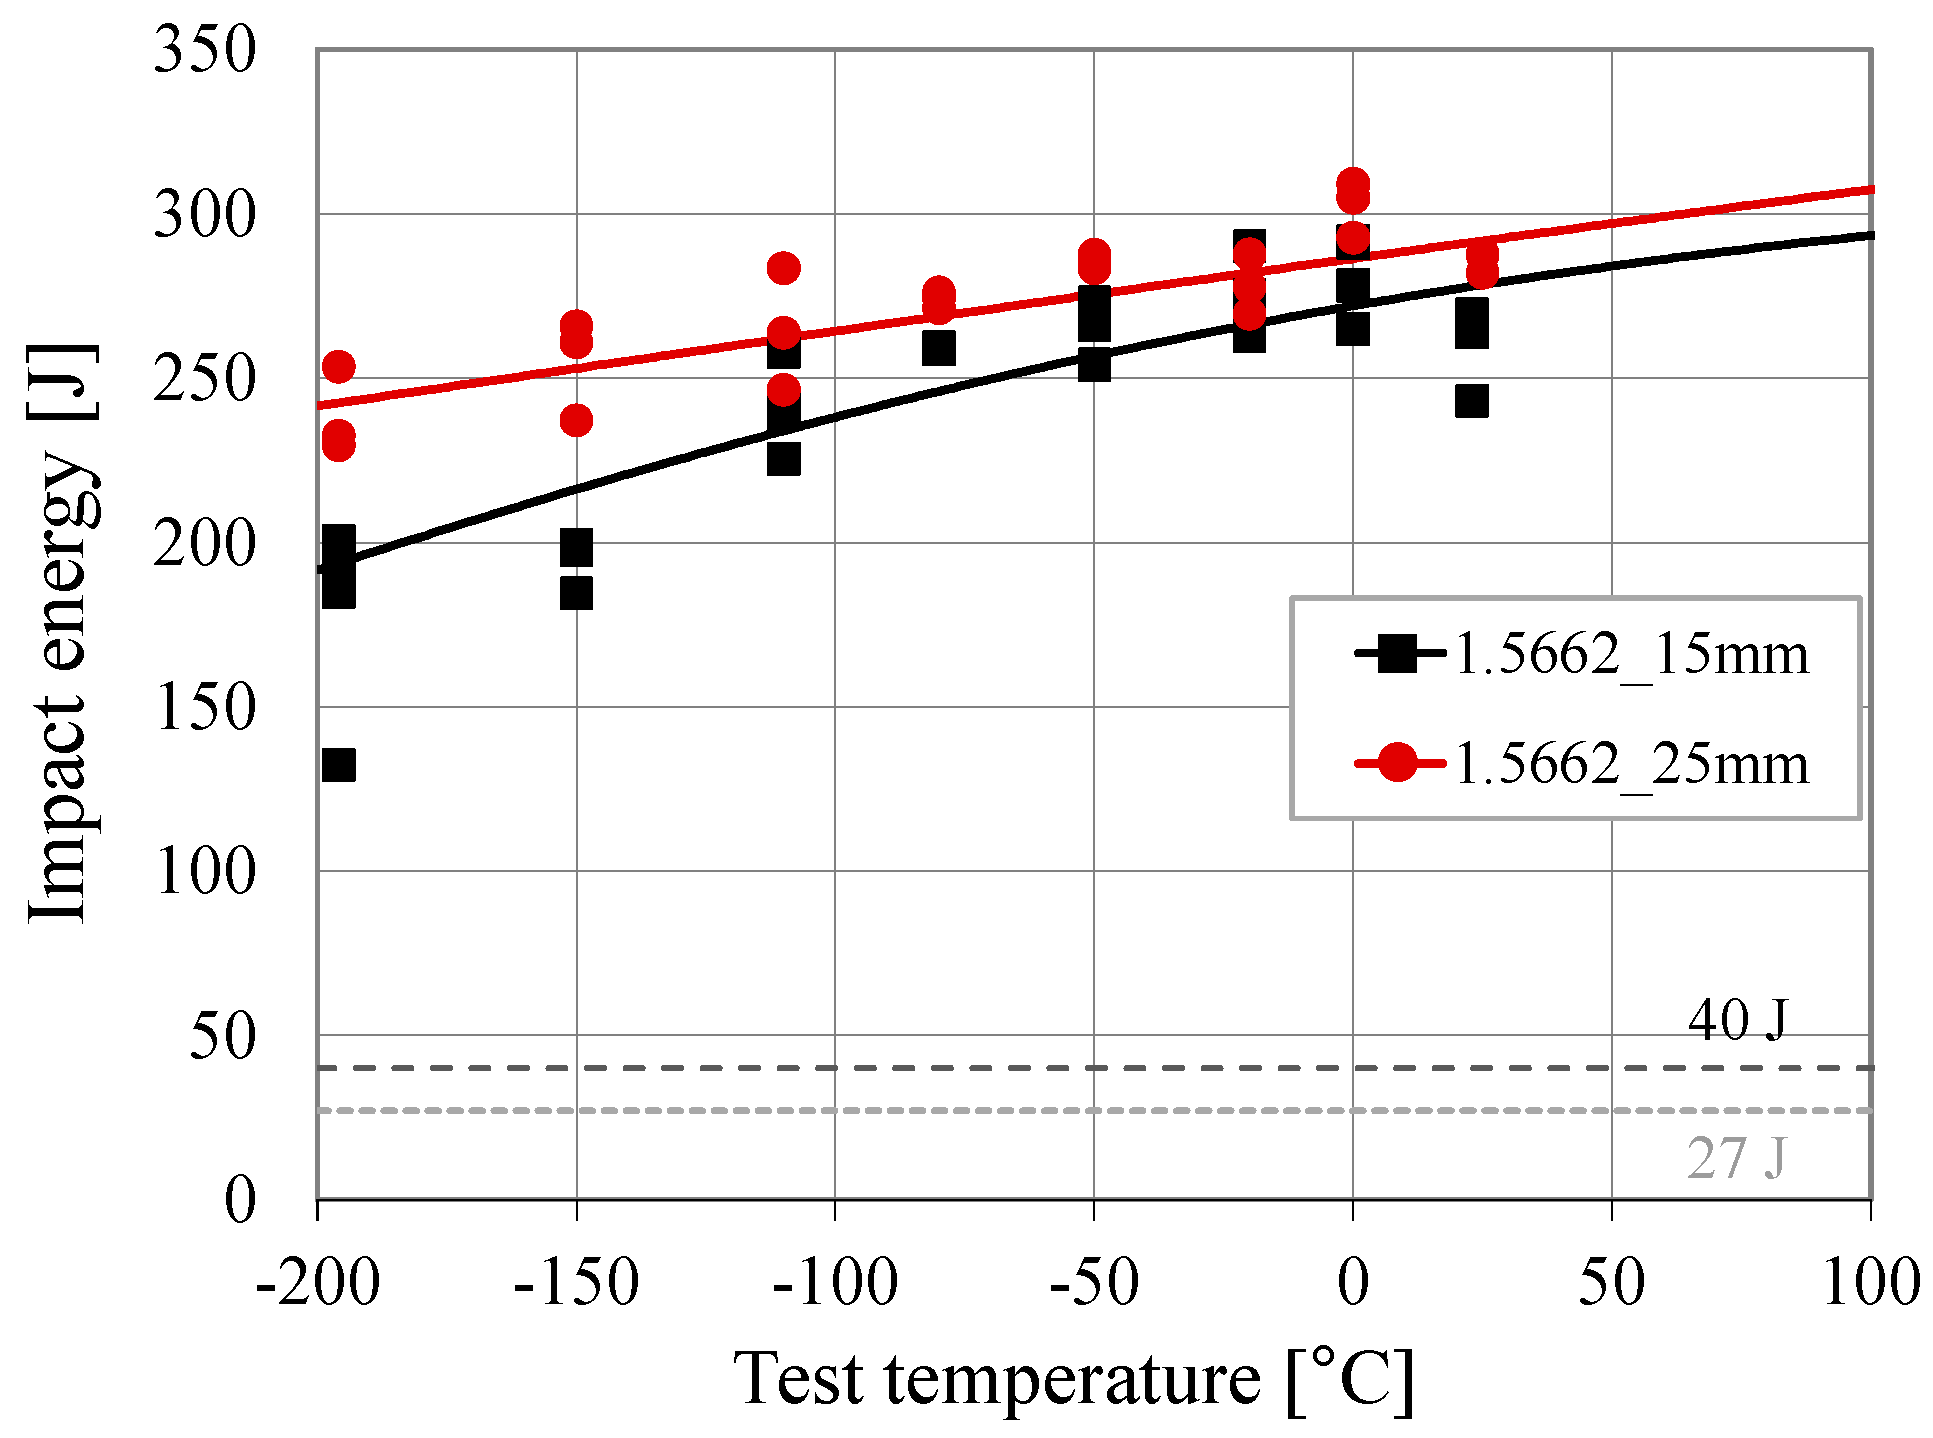
- All tested specimens exhibited ductile fracture, even at the extremely low temperature of −196 °C, so that it was not possible to determine the known transition temperature criteria for ferritic steels such as T27J or T40J.
- However, a slight decrease in the absorbed energy could be observed with decreasing temperature.
- At room temperature, the specimens of both plate thicknesses showed approximately the same amount of absorbed energy, but, at the lowest tested temperature of −196 °C, they showed a rather clear difference with slightly higher absorbed energies for the thicker plate thickness of 25 mm. This difference may be due to potential variations in the plate production process, such as differences in rolling or heat treatment, which may result in subtle microstructural differences between the two production lots.
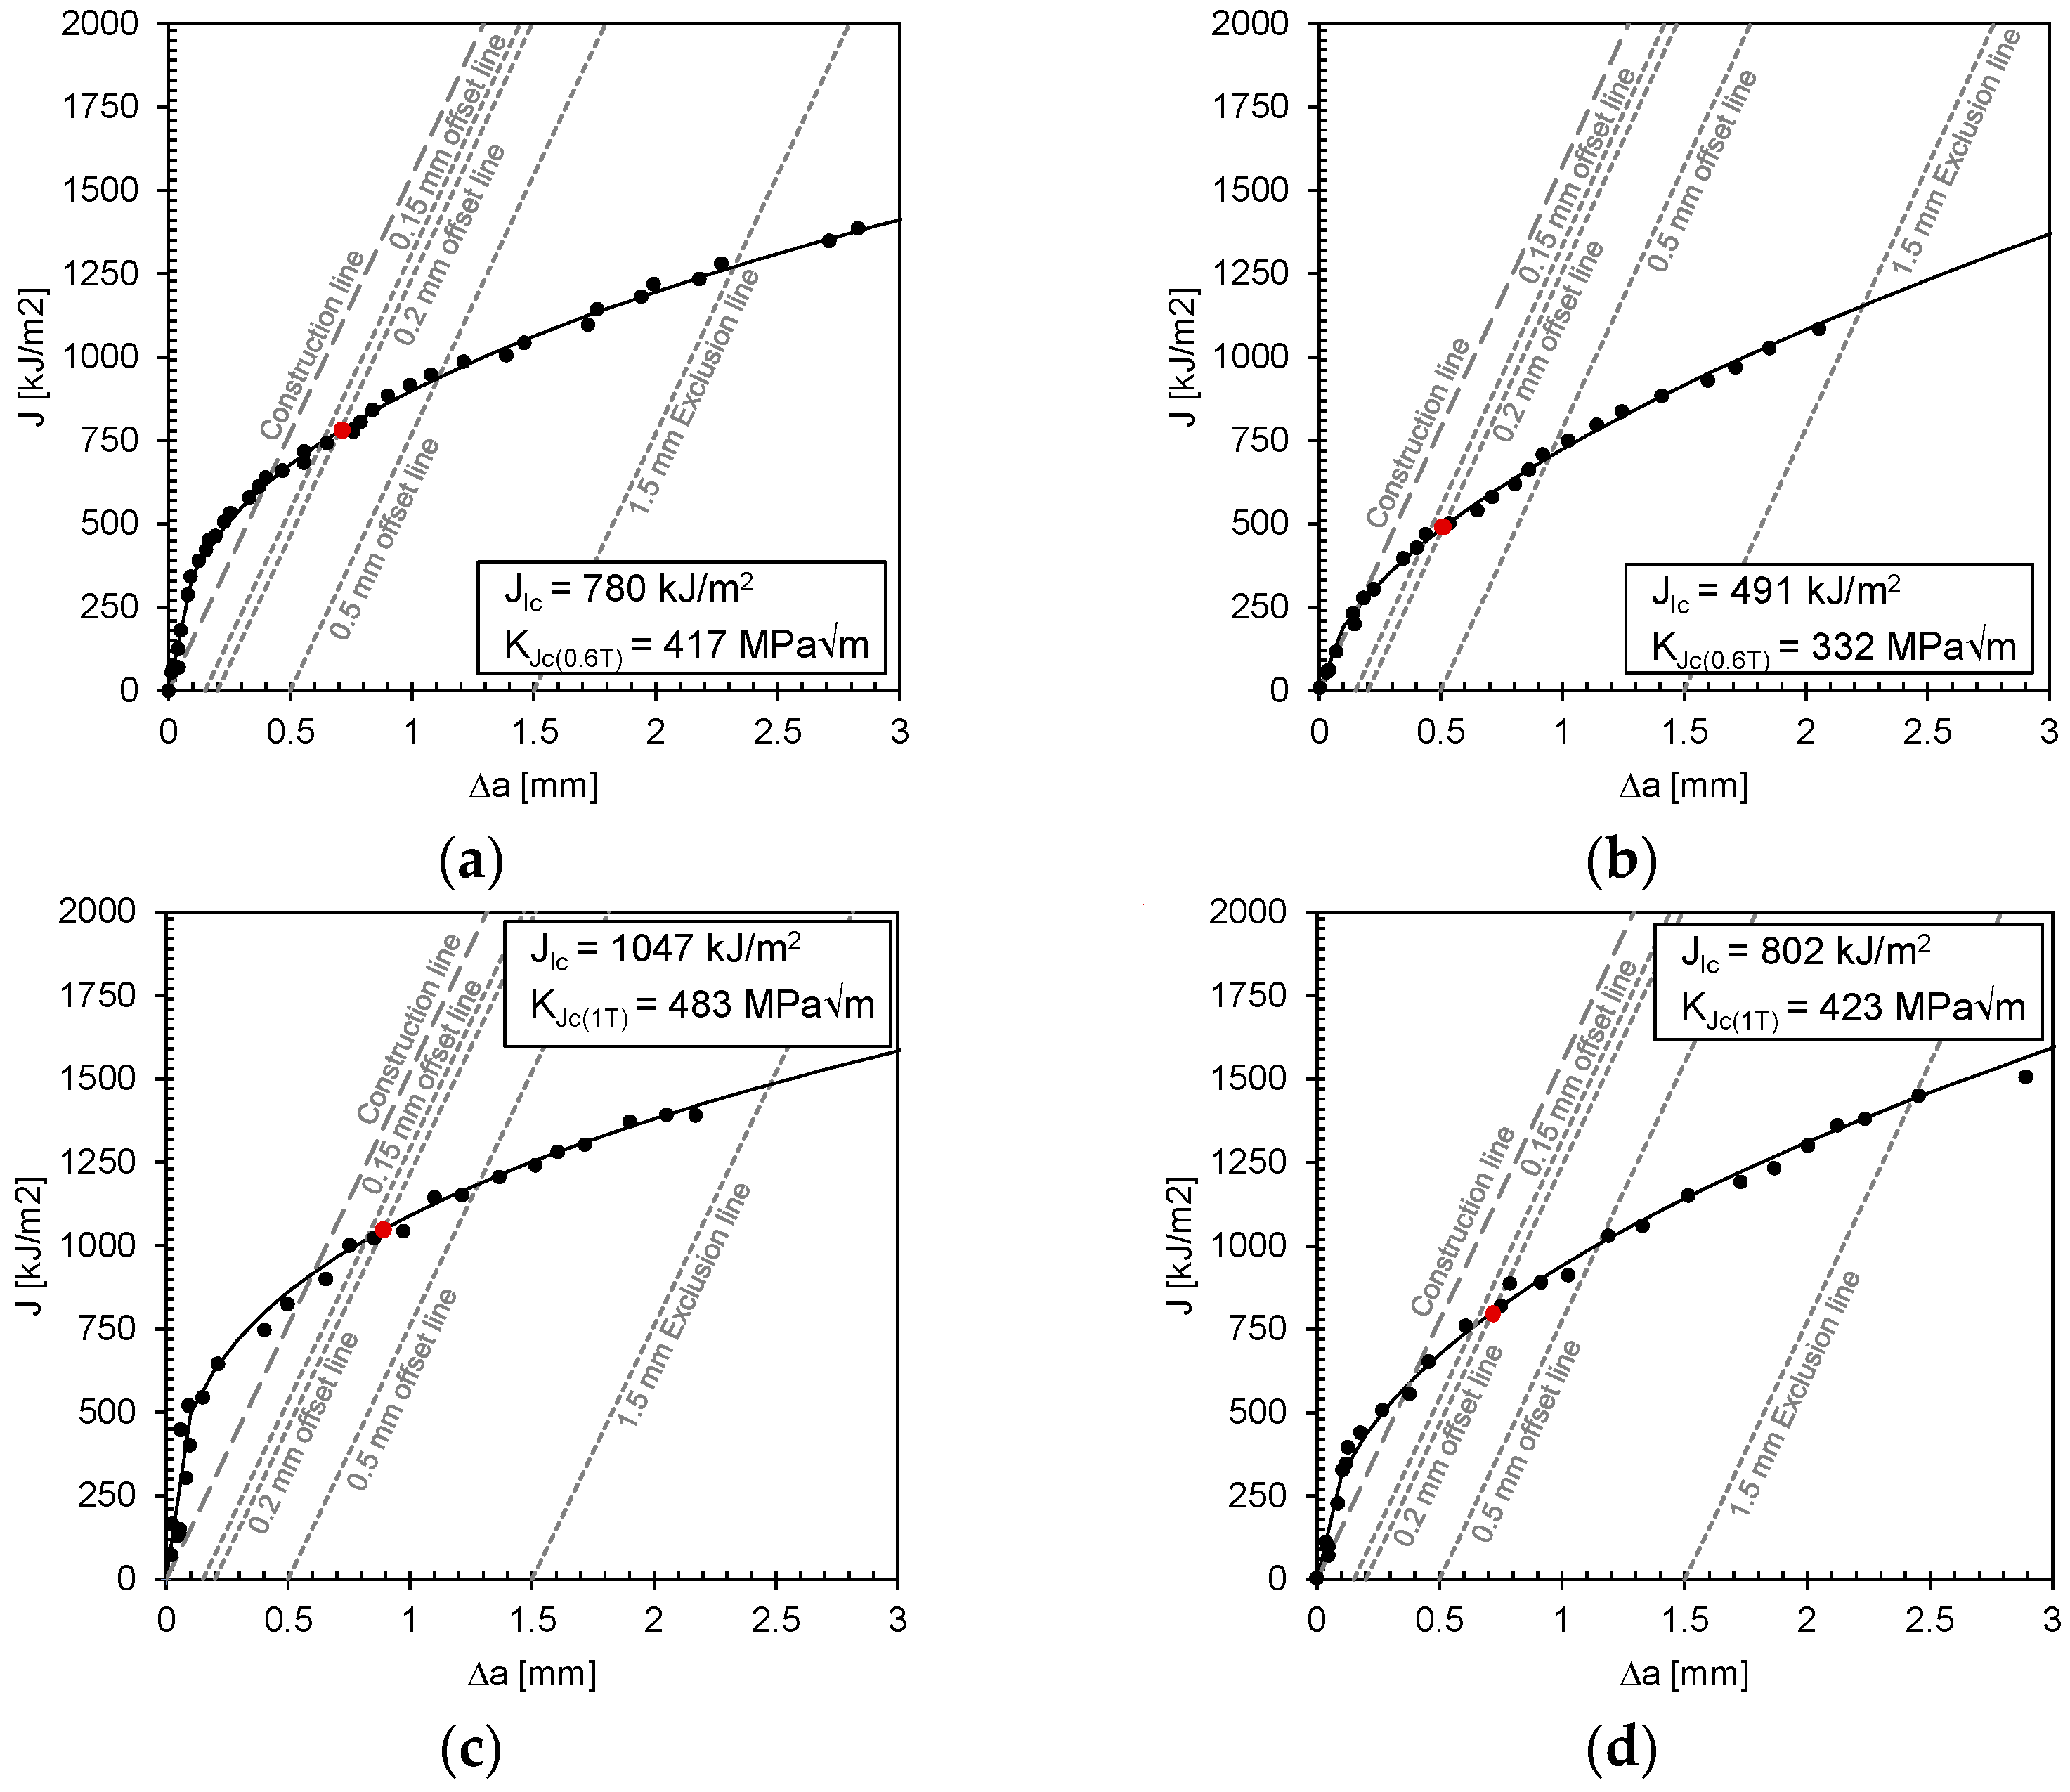
- It appears that the SENB specimens made from 25 mm plates show slightly higher fracture toughness values than those made from 15 mm plates. This difference may be due to the different conditions under which the two plate thicknesses were produced and cannot be interpreted as a general trend.
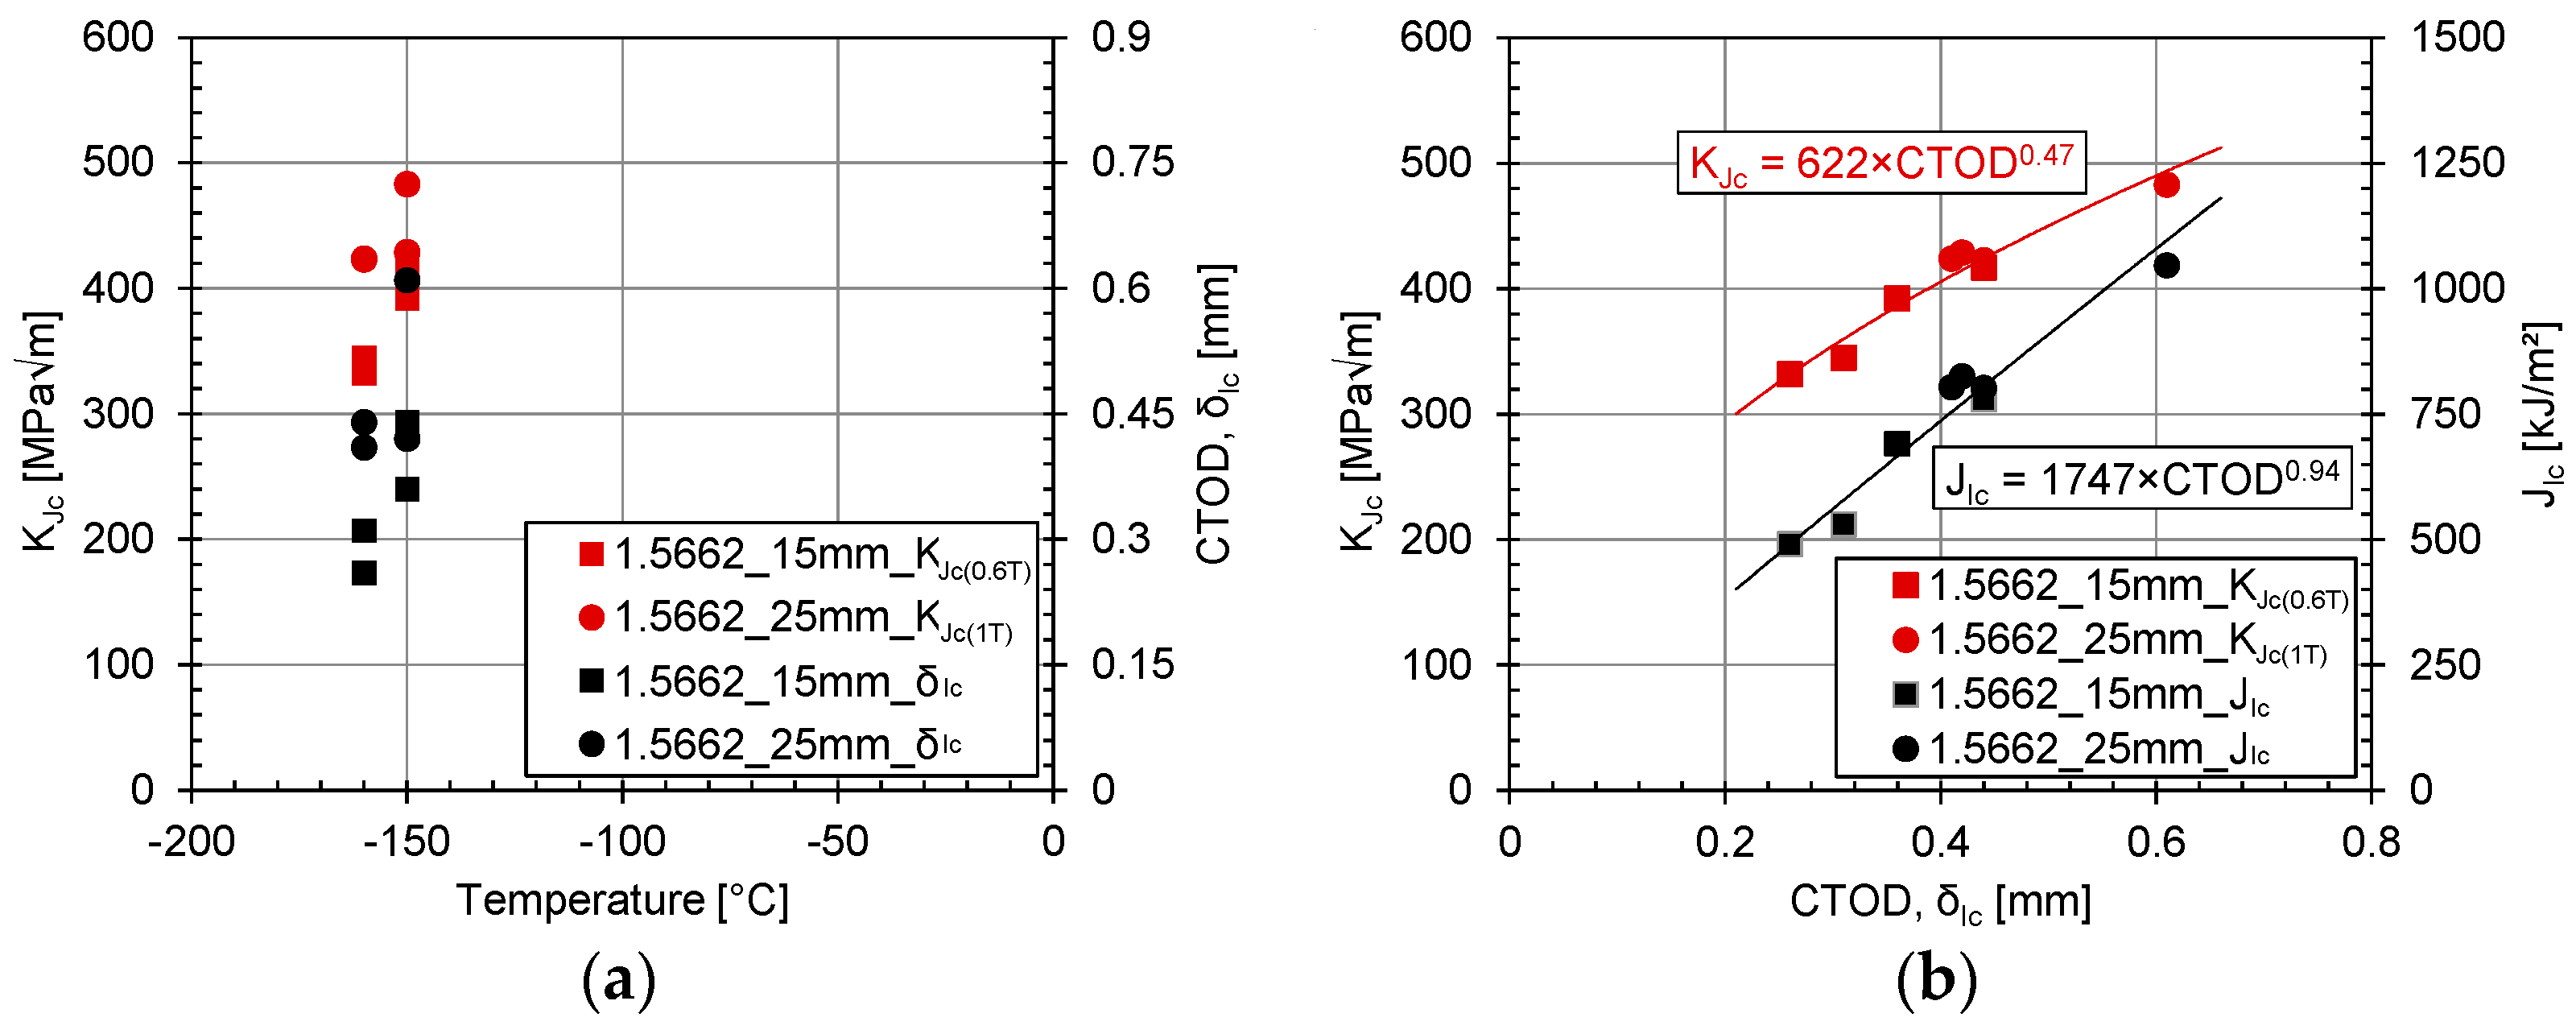
- As one result, two correlation equations could be derived from the fracture toughness test data for the tested nickel alloy steel 1.5662+QT640 to link CTOD and KJc values and CTOD and JIc values.
- It could be shown that, in the absence of the usually applied transition temperatures T27J or T40J and the reference temperature T100, the master curve concept as the basis of EN 1993-1-10 cannot be applied to nickel alloy steel 1.5662+QT640 due to its extremely good low-temperature fracture toughness behaviour.
Author Contributions
Funding
Institutional Review Board Statement
Informed Consent Statement
Data Availability Statement
Acknowledgments
Conflicts of Interest
References
- Saitoh, N.; Yamaba, R.; Muraoka, H.; Saeki, O. Development of Heavy 9% Nickel Steel Plates with Superior Low-Temperature Toughness for LNG Storage Tanks; Nippon Steel Technical Report; Nippon Steel: Tokyo, Japan, 1993; pp. 9–16. [Google Scholar]
- Kubo, T.; Ohmori, A.; Tanigawa, O. Properties of High Toughness 9% Ni Heavy Section Steel Plate and Its Applicability to 200 000 kL LNG Storage Tank; Kawasaki Steel Technical Report; Nippon Steel: Tokyo, Japan, 1999; pp. 72–79. [Google Scholar]
- Chun, M.S.; Kim, M.H.; Kim, W.S.; Kim, S.H.; Lee, J.M. Experimental investigation on the impact behavior of membrane-type LNG carrier insulation system. J. Loss Prev. Process Ind. 2009, 22, 901–907. [Google Scholar] [CrossRef]
- Park, J.Y.; Lee, J.M.; Kim, M.H. An investigation of the mechanical properties of a weldment of 7% nickel alloy steels. Metals 2016, 6, 285. [Google Scholar] [CrossRef]
- Muttaqie, T.; Lee, S.G.; Cho, S.R.; Sohn, J.M. Structural assessment review of type-c independent tank in LNG bunkering ship. In Proceedings of the 6th international Conference and Exhibition on Sustainable Energy and Advanced Materials, Surakarta, Indonesia, 16–17 October 2019; pp. 97–108. [Google Scholar]
- Paik, J.K.; Lee, D.H.; Noh, S.H.; Park, D.K.; Ringsberg, J.W. Full-scale collapse testing of a steel stiffened plate structure under axial compressive loading triggered by brittle fracture at cryogenic condition. Ships Offshore Struct. 2020, 15, 1–17. [Google Scholar] [CrossRef]
- Avery, R.E.; Parsons, D. Welding stainless and 9% nickel steel cryogenic vessels. Weld. J. 1995, 74, 45–50. [Google Scholar]
- Wang, Z.Q.; Wang, X.L.; Nan, Y.R.; Shang, C.J.; Wang, X.M.; Liu, K.; Chen, B. Effect of Ni content on the microstructure and mechanical properties of weld metal with both-side submerged arc welding technique. Mater. Charact. 2018, 138, 67–77. [Google Scholar] [CrossRef]
- Liu, J.; Sun, J.; Wei, S.; Lu, S. The effect of nickel contents on the microstructure evolution and toughness of 800 MPa grade low carbon bainite deposited metal. Crystals 2021, 11, 709. [Google Scholar] [CrossRef]
- EN 10028-4: 2017-10; Flat Products Made of Steels for Pressure Purposes—Part 4: Nickel Alloy Steels with Specified Low Temperature Properties. German version EN 10028-4:2017; European Committee for Standardization: Brussels, Belgium, 2017.
- SEP 1325: 1982-12; Falling Weight Test According to W. S. Pellini. Stahlinstitut VDEh: Düsseldorf, Germany, 1982.
- ASTM E208-20: 2023-02; Standard Test Method for Conducting Drop-Weight Test to Determine Nil-Ductility Transition Temperature of Ferritic Steels. American Society for Testing and Materials (ASTM): West Conshohocken, PA, USA, 2023.
- EN 1993-1-10: 2010-12; Eurocode 3: Design of Steel Structures—Part 1-10: Material Toughness and Through-Thickness Properties. German version EN 1993-1-10:2005 + AC:2009; European Committee for Standardization: Brussels, Belgium, 2010.
- EN 13445-2: 2023-12; Unfired Pressure Vessels—Part 2: Materials. German version EN 13445-2:2021+A1:2023; European Committee for Standardization: Brussels, Belgium, 2023 .
- EN 13480-2: 2017-12; Metallic Industrial Piping—Part 2: Materials. German version EN 13480-2:2017; European Committee for Standardization: Brussels, Belgium, 2017.
- Wallin, K. Fracture Toughness of Engineering Materials: Estimation and Application; EMAS Publishing: Nottingham, UK, 2011; ISBN 978-0-955299-4-6-9. [Google Scholar]
- EN ISO 148-1: 2017-05; Metallic Materials—Charpy Pendulum Impact Test—Part 1: Test Method (ISO 148-1:2016). German version EN ISO 148-1:2016; European Committee for Standardization: Brussels, Belgium, 2017.
- Oldfield, W. Fitting curves to toughness data. J. Test. Eval. 1979, 7, 326–333. [Google Scholar] [CrossRef]
- Afzali, N.; Jabour, G.; Stranghöner, N.; Langenberg, P. Influence of the plate thickness on fracture and impact toughness of duplex stainless steels. In Proceedings of the Eurosteel Conference 2023, Amsterdam, The Netherlands, 12–14 September 2023; ce/papers. Volume 6, pp. 607–613. [Google Scholar]
- ASTM E1820-20b: 2022-03; Standard Test Method for Measurement of Fracture Toughness. American Society for Testing and Materials (ASTM): West Conshohocken, PA, USA, 2022.
- Afzali, N.; Jabour, G.; Stranghöner, N.; Langenberg, P. A comparative study into the fracture toughness properties of duplex stainless steels. J. Constr. Steel Res. 2024, 212, 108283. [Google Scholar] [CrossRef]
- Anoop, C.R.; Singh, R.K.; Kumar, R.R.; Jayalakshmi, M.; Prabhu, T.A.; Tharian, K.T.; Narayana Murty, S.V.S. A review on steels for cryogenic applications. Mater. Perform. Charact. 2021, 10, 16–88. [Google Scholar] [CrossRef]
- ASTM E1921-19: 2019-06; Standard Test Method for Determination of Reference Temperature, T0, for Ferritic Steels in the Transition Range. American Society for Testing and Materials (ASTM): West Conshohocken, PA, USA, 2019.
- Wang, Y.Q.; Liu, X.Y.; Hu, Z.W.; Shi, Y.J. Experimental study on mechanical properties and fracture toughness of structural thick plate and its butt weld along thickness and at low temperatures. Fatigue Fract. Eng. Mater. Struct. 2013, 36, 1258–1273. [Google Scholar] [CrossRef]
- Wallin, K. Methodology for Selecting Charpy Toughness Criteria for Thin High Strength Steels: Part I: Determining the Fracture Toughness; Jernkontorets Forskning D; Jernkontoret: Stockholm, Sweden, 1994; Volume 733, 34p. [Google Scholar]
- Wallin, K. Methodology for Selecting Charpy Toughness Criteria for Thin High Strength Steels: Part II: Comparison with Other Models; Jernkontorets Forskning D; Jernkontoret: Stockholm, Sweden, 1994; Volume 734, 34p. [Google Scholar]
- Wallin, K. Methodology for Selecting Charpy Toughness Criteria for Thin High Strength Steels: Part III: Verification; Jernkontorets Forskning D; Jernkontoret: Stockholm, Sweden, 1994; Volume 735, 61p. [Google Scholar]


| Material | Plate Thickness | Element | ||||||
|---|---|---|---|---|---|---|---|---|
| C | Si | Mn | P | Cr | Mo | Ni | ||
| 1.5662+QT640 | 15 mm | 0.04 | 0.24 | 0.53 | 0.009 | 0.06 | 0.004 | 8.95 |
| 25 mm | 0.04 | 0.23 | 0.51 | 0.006 | 0.04 | 0.01 | 9.05 | |
| - | ≤ 0.10 1 | ≤ 0.35 1 | 0.30–0.80 1 | ≤ 0.020 1 | - | ≤0.10 1 | 8.5–10 1 | |
| Material | Plate Thickness [mm] | Temperature [°C] | |||||||
|---|---|---|---|---|---|---|---|---|---|
| RT | 0 | −20 | −50 | −80 | −110 | −150 | −196 | ||
| Impact Energy [J] (Mean Values) | |||||||||
| 1.5662+QT640 | 15 | 261 | 281 | 275 | 267 | 259 | 241 | 194 | 178 |
| 25 | 285 | 302 | 278 | 285 | 274 | 264 | 245 | 238 | |
| 5 to 70 1 | 70 1 | 70 1 | 70 1 | 70 1 | 70 1 | - | 50 1 | 40 1 | |
| Material | Plate Thickness | Temperature [°C] | fy [MPa] | fu [MPa] | E [MPa] |
|---|---|---|---|---|---|
| 1.5662+QT640 | 15 mm | RT 1 | 696 2 | 738 2 | 180.716 2 |
| −150 | 787 | 970 | 202.724 | ||
| −160 | 798 | 986 | 203.037 | ||
| 25 mm | RT 1 | 670 2 | 712 2 | 195.296 2 | |
| −150 | 761 | 944 | 188.814 | ||
| −160 | 772 | 960 | 189.146 |
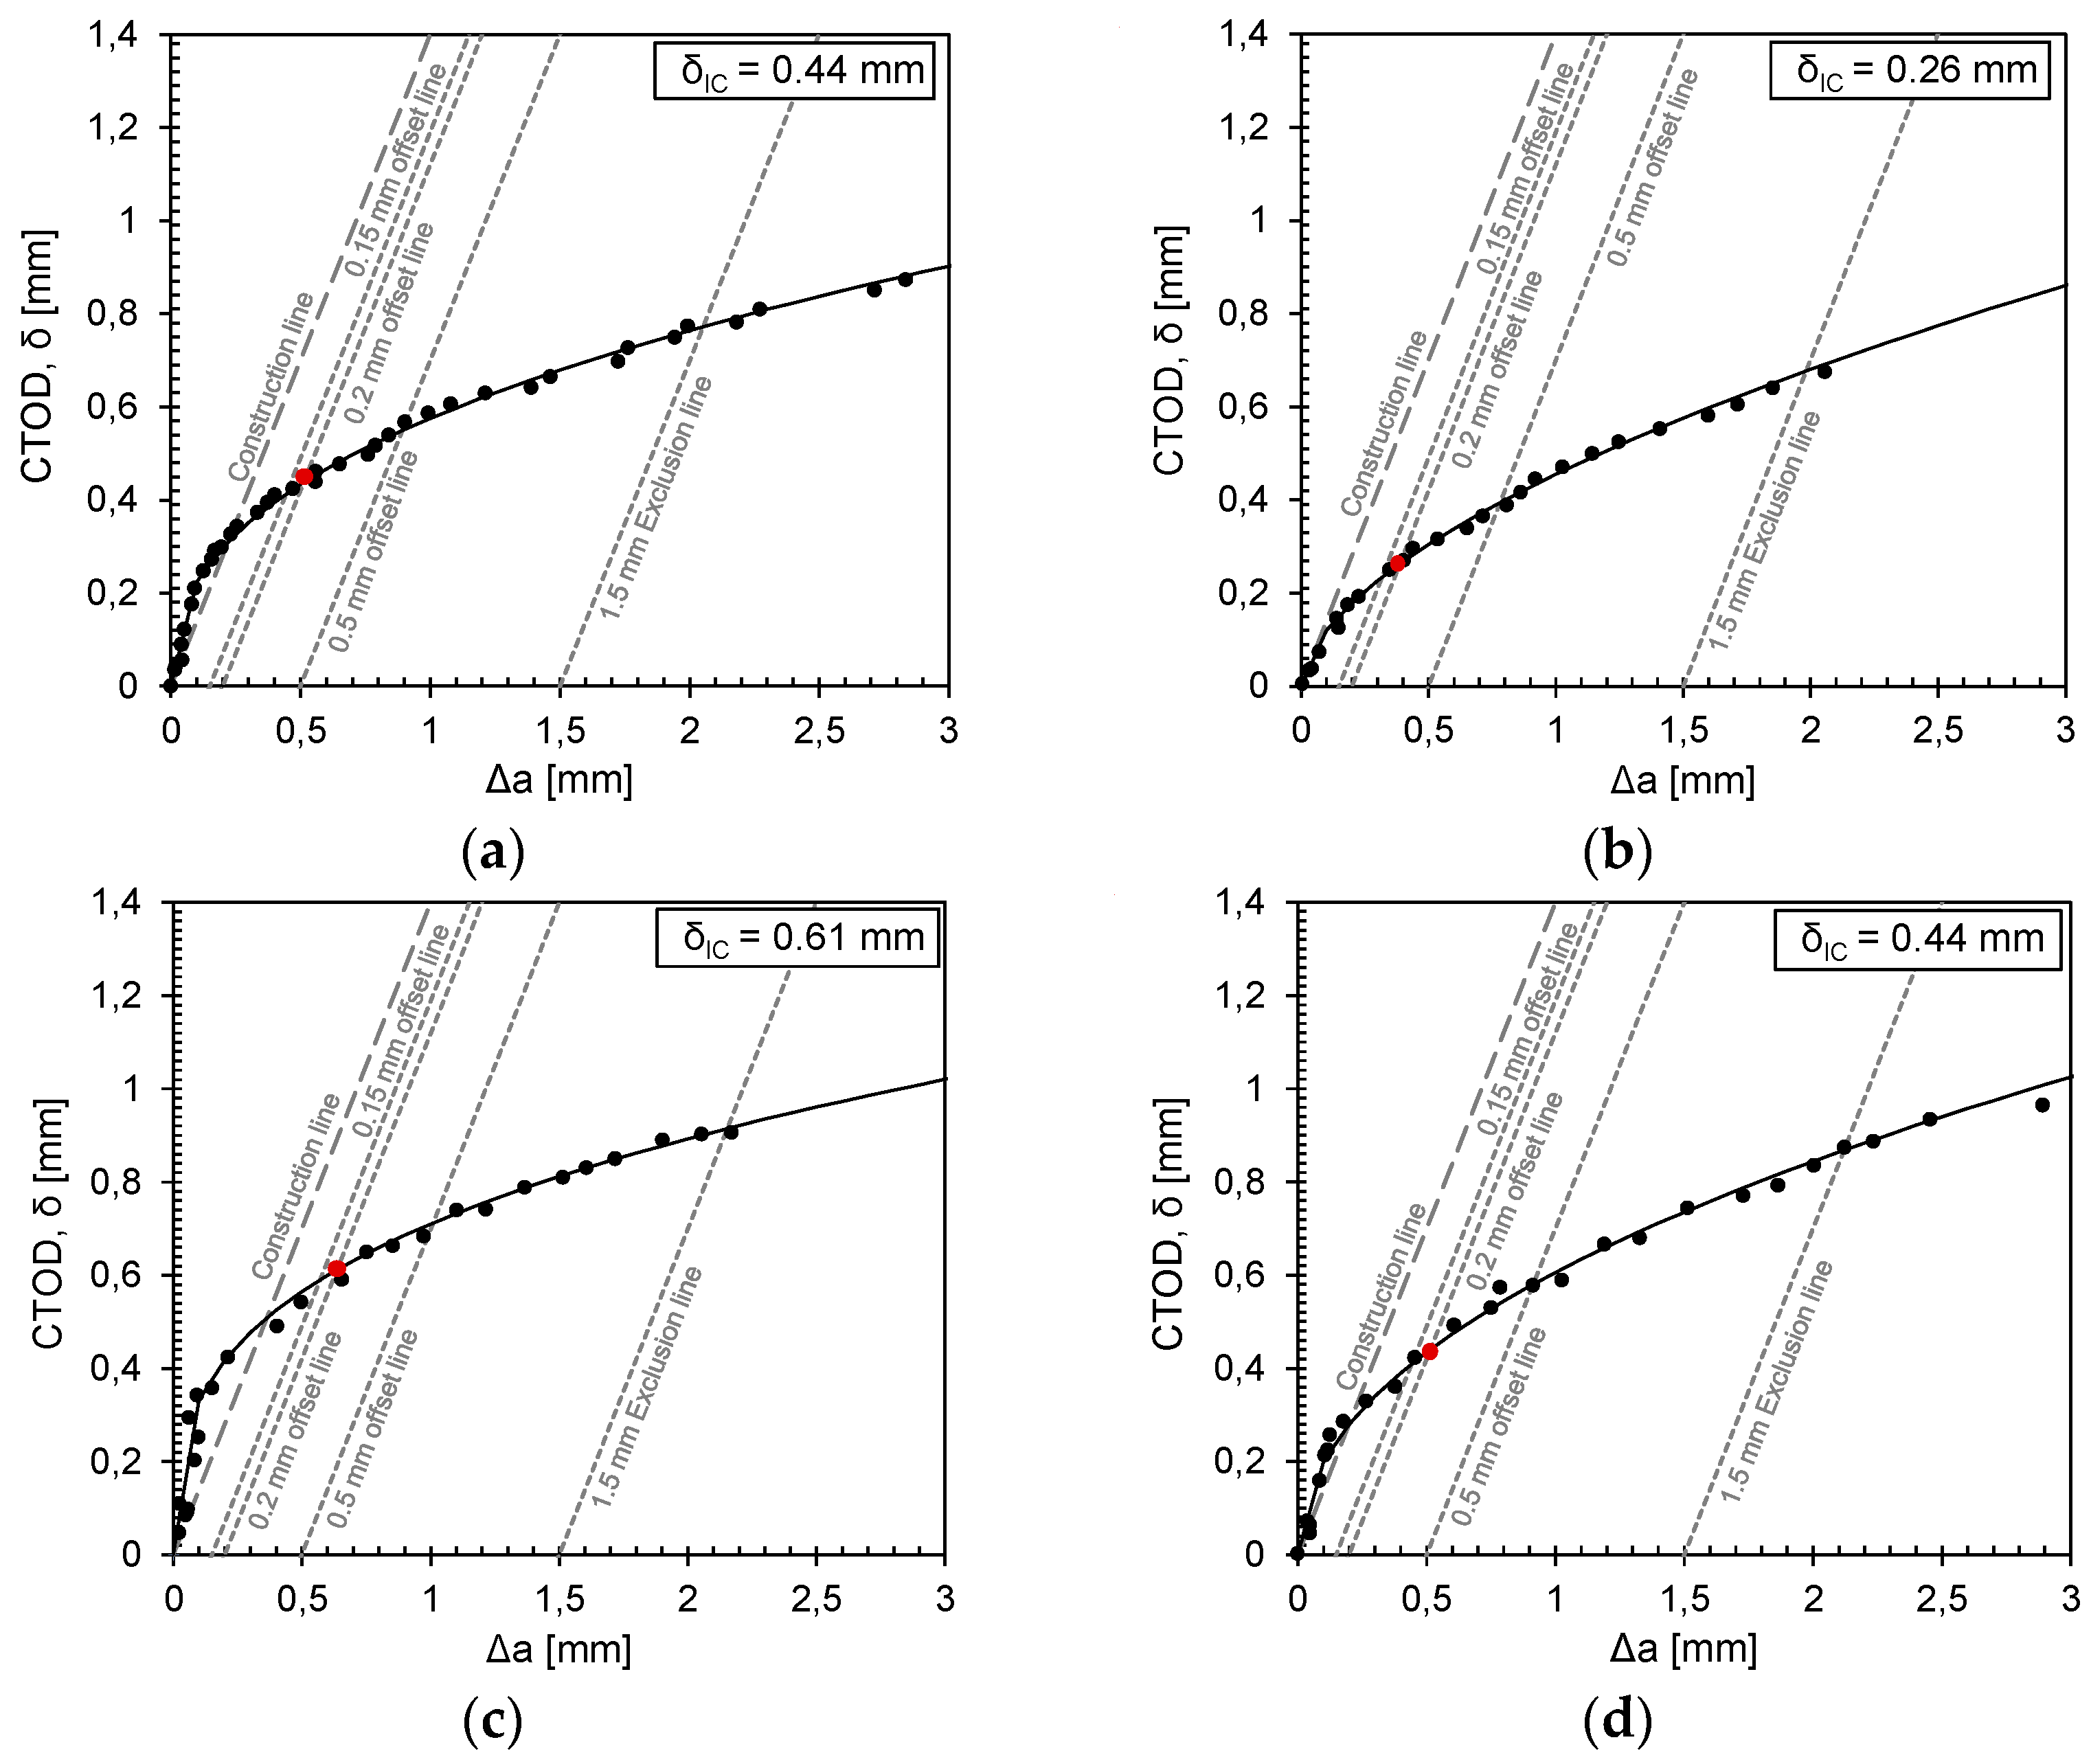
| Material | Plate Thickness | Temperature [°C] | JIc [kJ/mm²] | KJc(1T)/ KJc(0.6T) [MPa√m] | CTOD, δ 1 [mm] |
|---|---|---|---|---|---|
| 1.5662+QT640 | 15 mm | −150 | 691 | 347/392 | 0.36 |
| 780 | 369/417 | 0.44 | |||
| −160 | 491 | 295/332 | 0.26 | ||
| 531 | 306/345 | 0.31 | |||
| 25 mm | −150 | 1047 | 483/- | 0.61 | |
| 826 | 429/- | 0.42 | |||
| −160 | 802 | 423/- | 0.44 | ||
| 804 | 424/- | 0.41 |
Disclaimer/Publisher’s Note: The statements, opinions and data contained in all publications are solely those of the individual author(s) and contributor(s) and not of MDPI and/or the editor(s). MDPI and/or the editor(s) disclaim responsibility for any injury to people or property resulting from any ideas, methods, instructions or products referred to in the content. |
© 2024 by the authors. Licensee MDPI, Basel, Switzerland. This article is an open access article distributed under the terms and conditions of the Creative Commons Attribution (CC BY) license (https://creativecommons.org/licenses/by/4.0/).
Share and Cite
Afzali, N.; Stranghöner, N.; Langenberg, P. Fracture Toughness Behaviour of Nickel Alloy Steel 1.5662. Materials 2024, 17, 6117. https://doi.org/10.3390/ma17246117
Afzali N, Stranghöner N, Langenberg P. Fracture Toughness Behaviour of Nickel Alloy Steel 1.5662. Materials. 2024; 17(24):6117. https://doi.org/10.3390/ma17246117
Chicago/Turabian StyleAfzali, Nariman, Natalie Stranghöner, and Peter Langenberg. 2024. "Fracture Toughness Behaviour of Nickel Alloy Steel 1.5662" Materials 17, no. 24: 6117. https://doi.org/10.3390/ma17246117
APA StyleAfzali, N., Stranghöner, N., & Langenberg, P. (2024). Fracture Toughness Behaviour of Nickel Alloy Steel 1.5662. Materials, 17(24), 6117. https://doi.org/10.3390/ma17246117