
Notch Effect in Acrylonitrile Styrene Acrylate (ASA) Single-Edge-Notch Bending Specimens Manufactured by Fused Filament Fabrication

 ,
,  , , and
Abstract
1. Introduction
2. Materials and Methods
3. Results
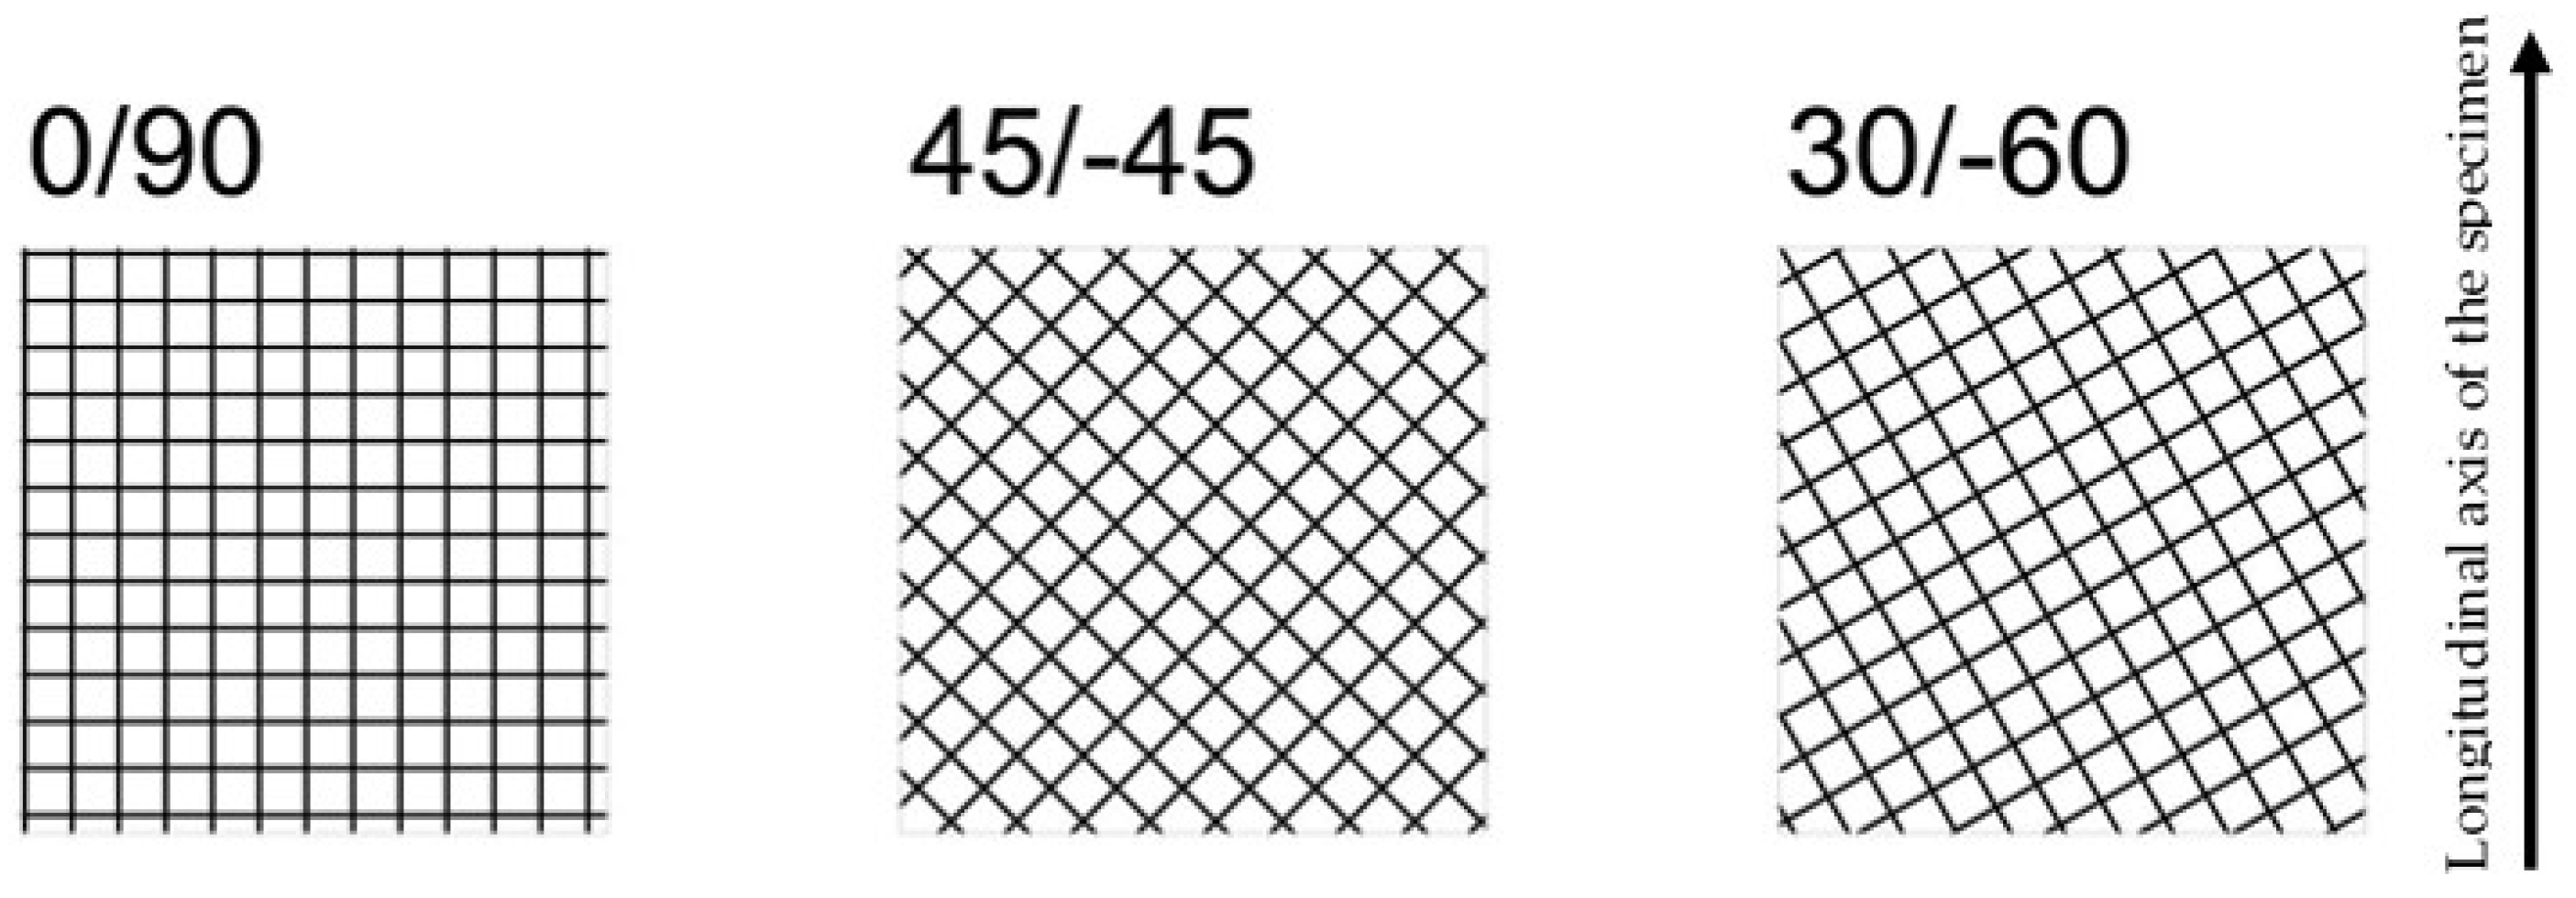
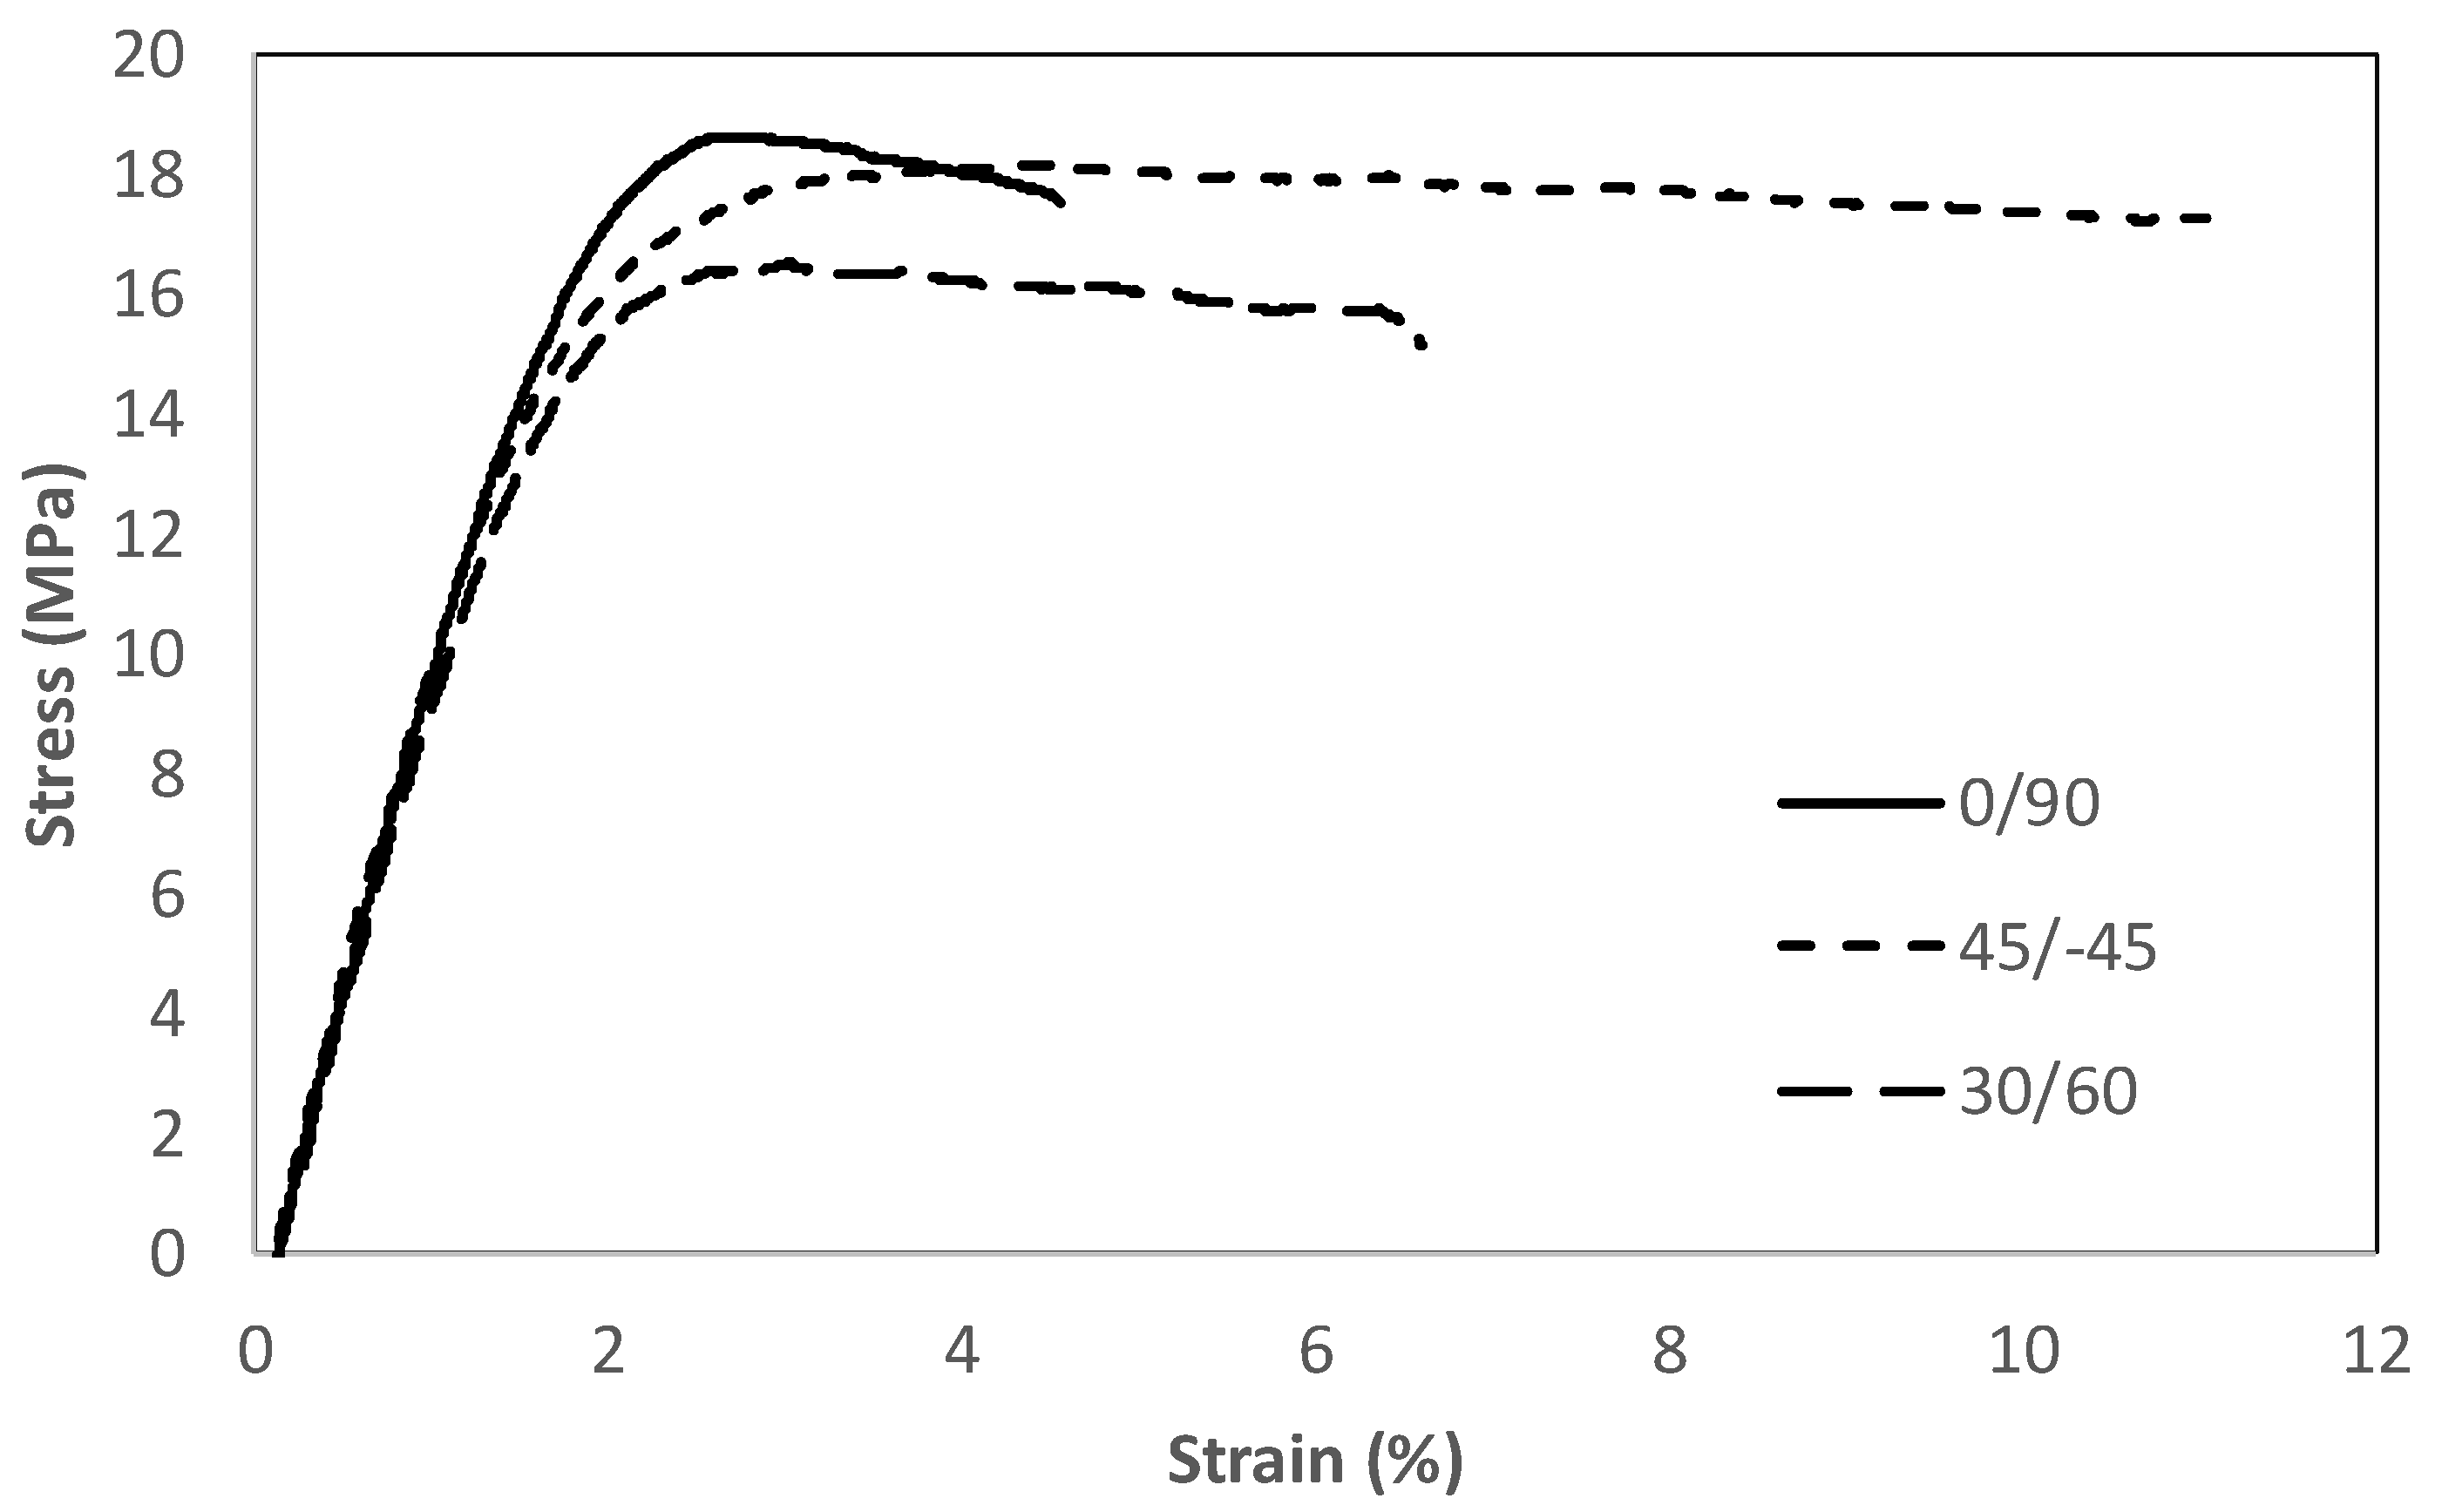
3.1. Tensile Tests
3.2. Fracture Tests
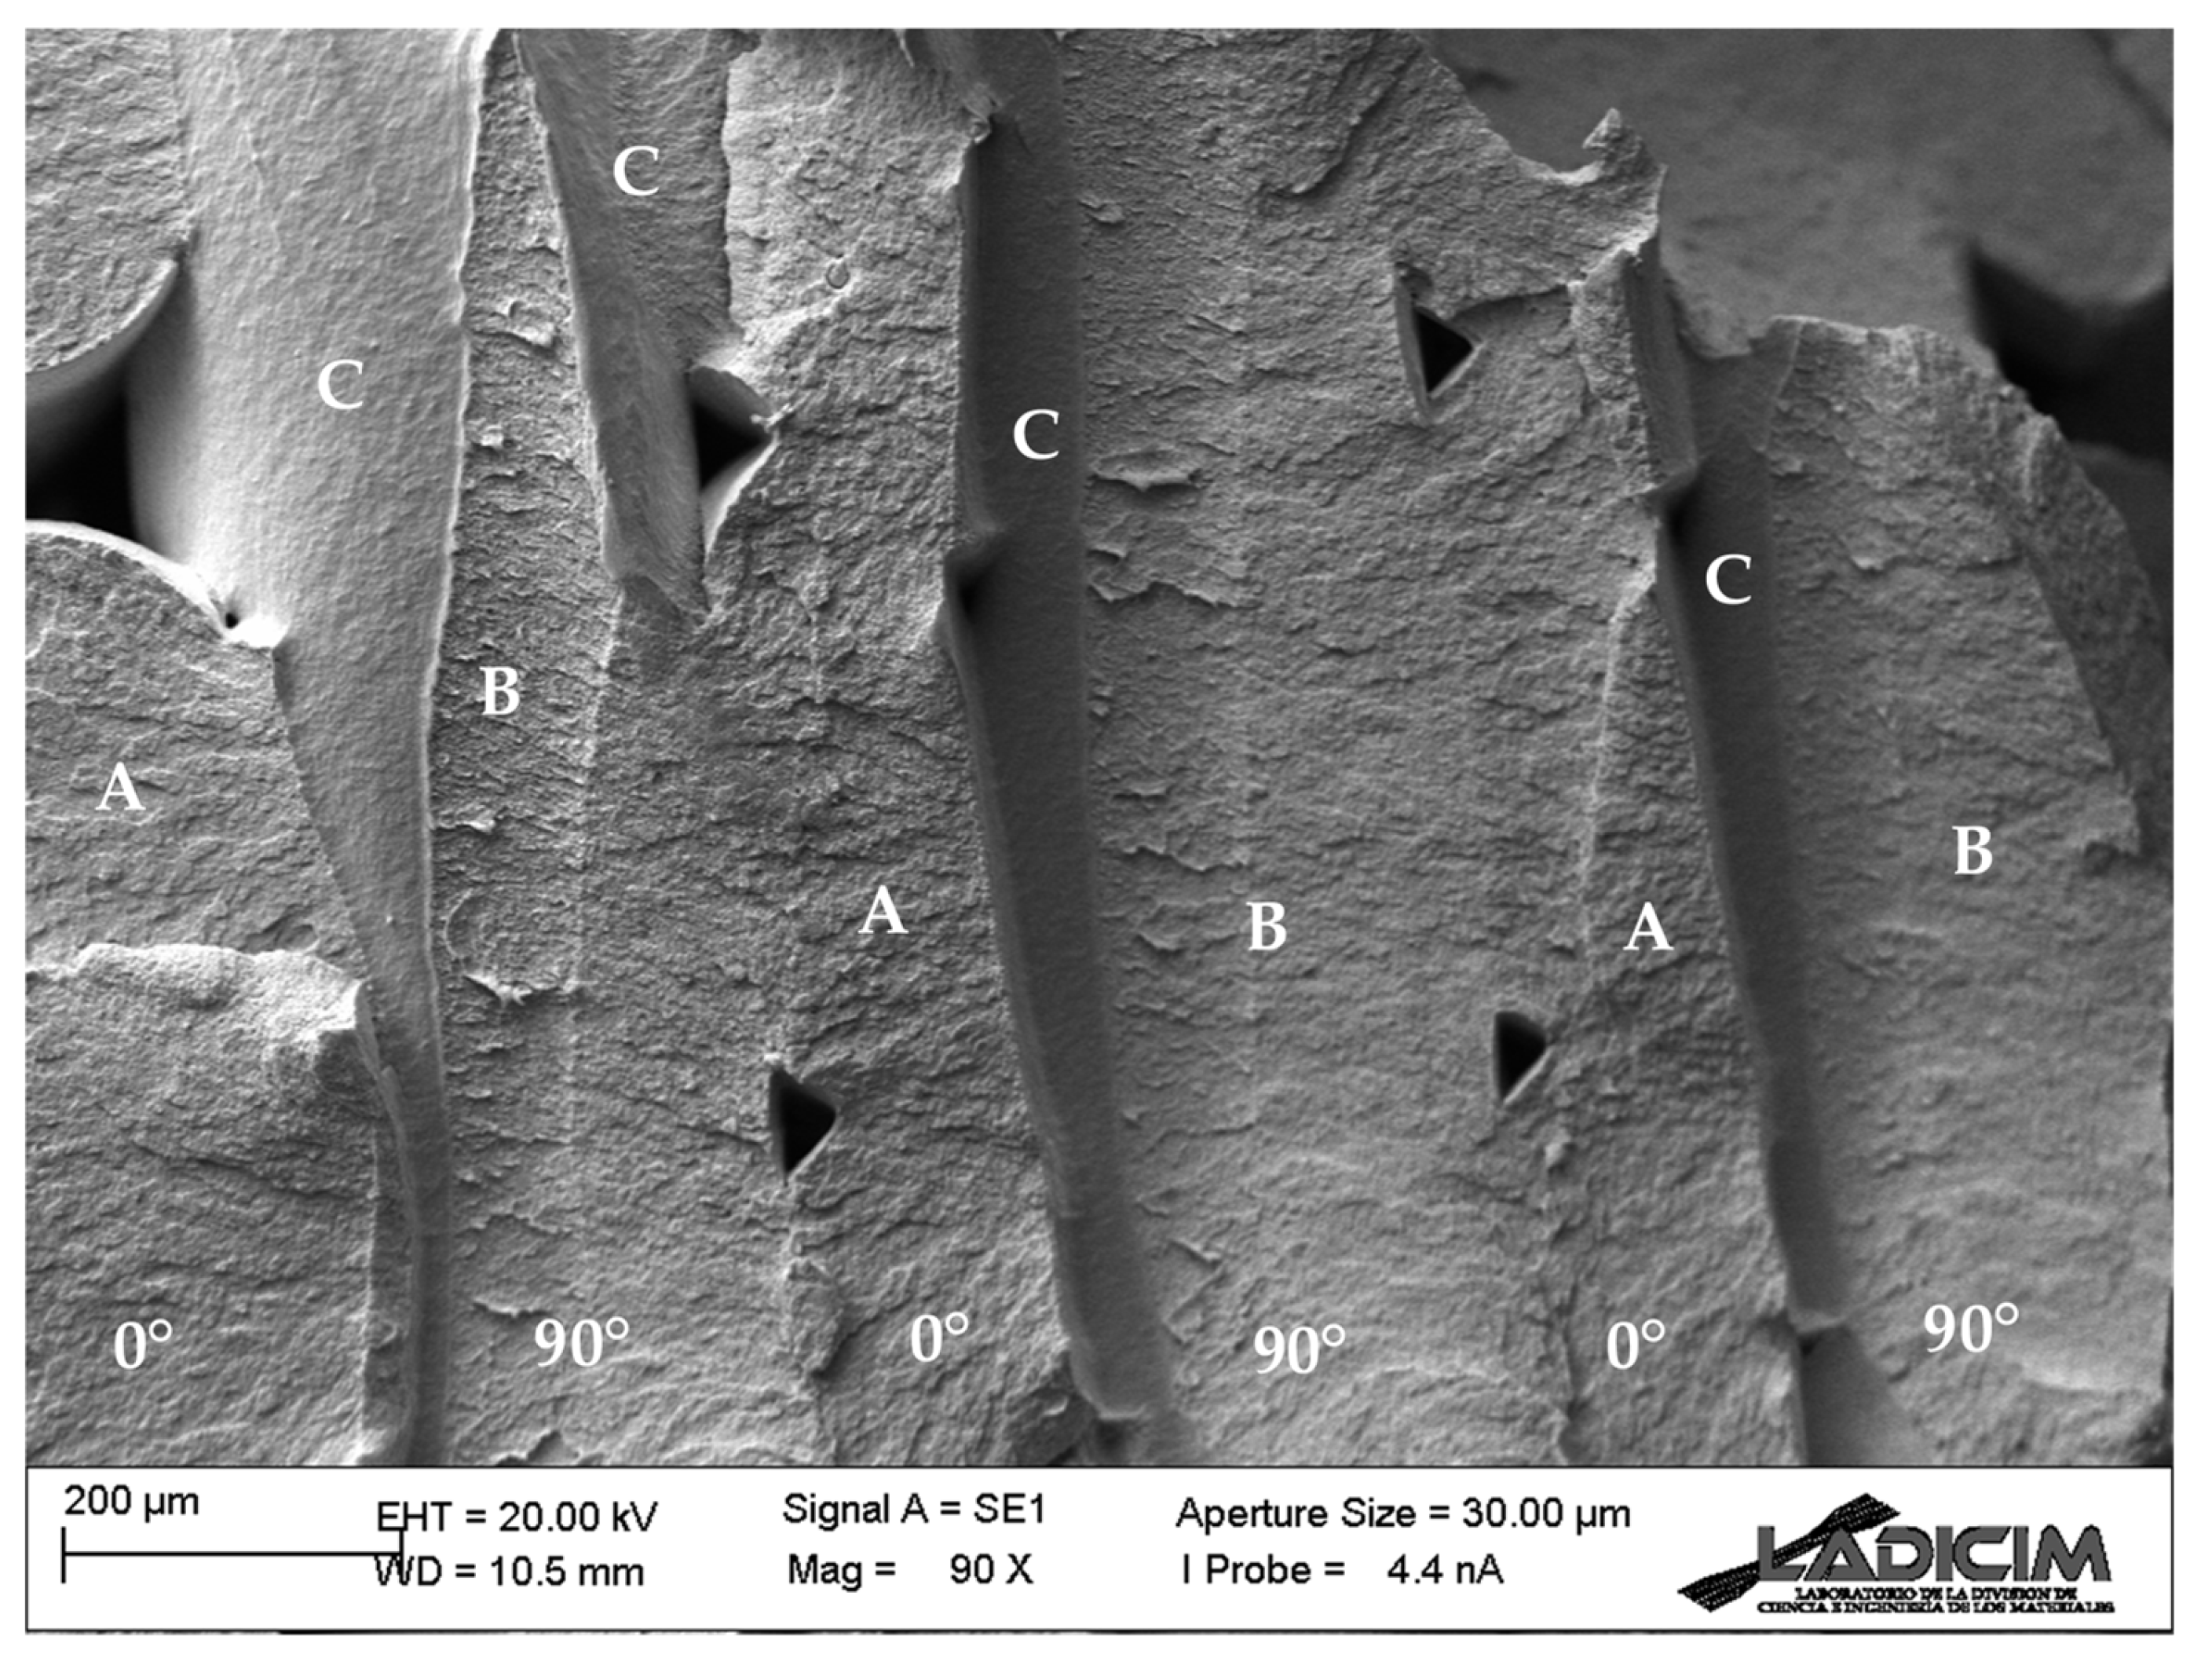
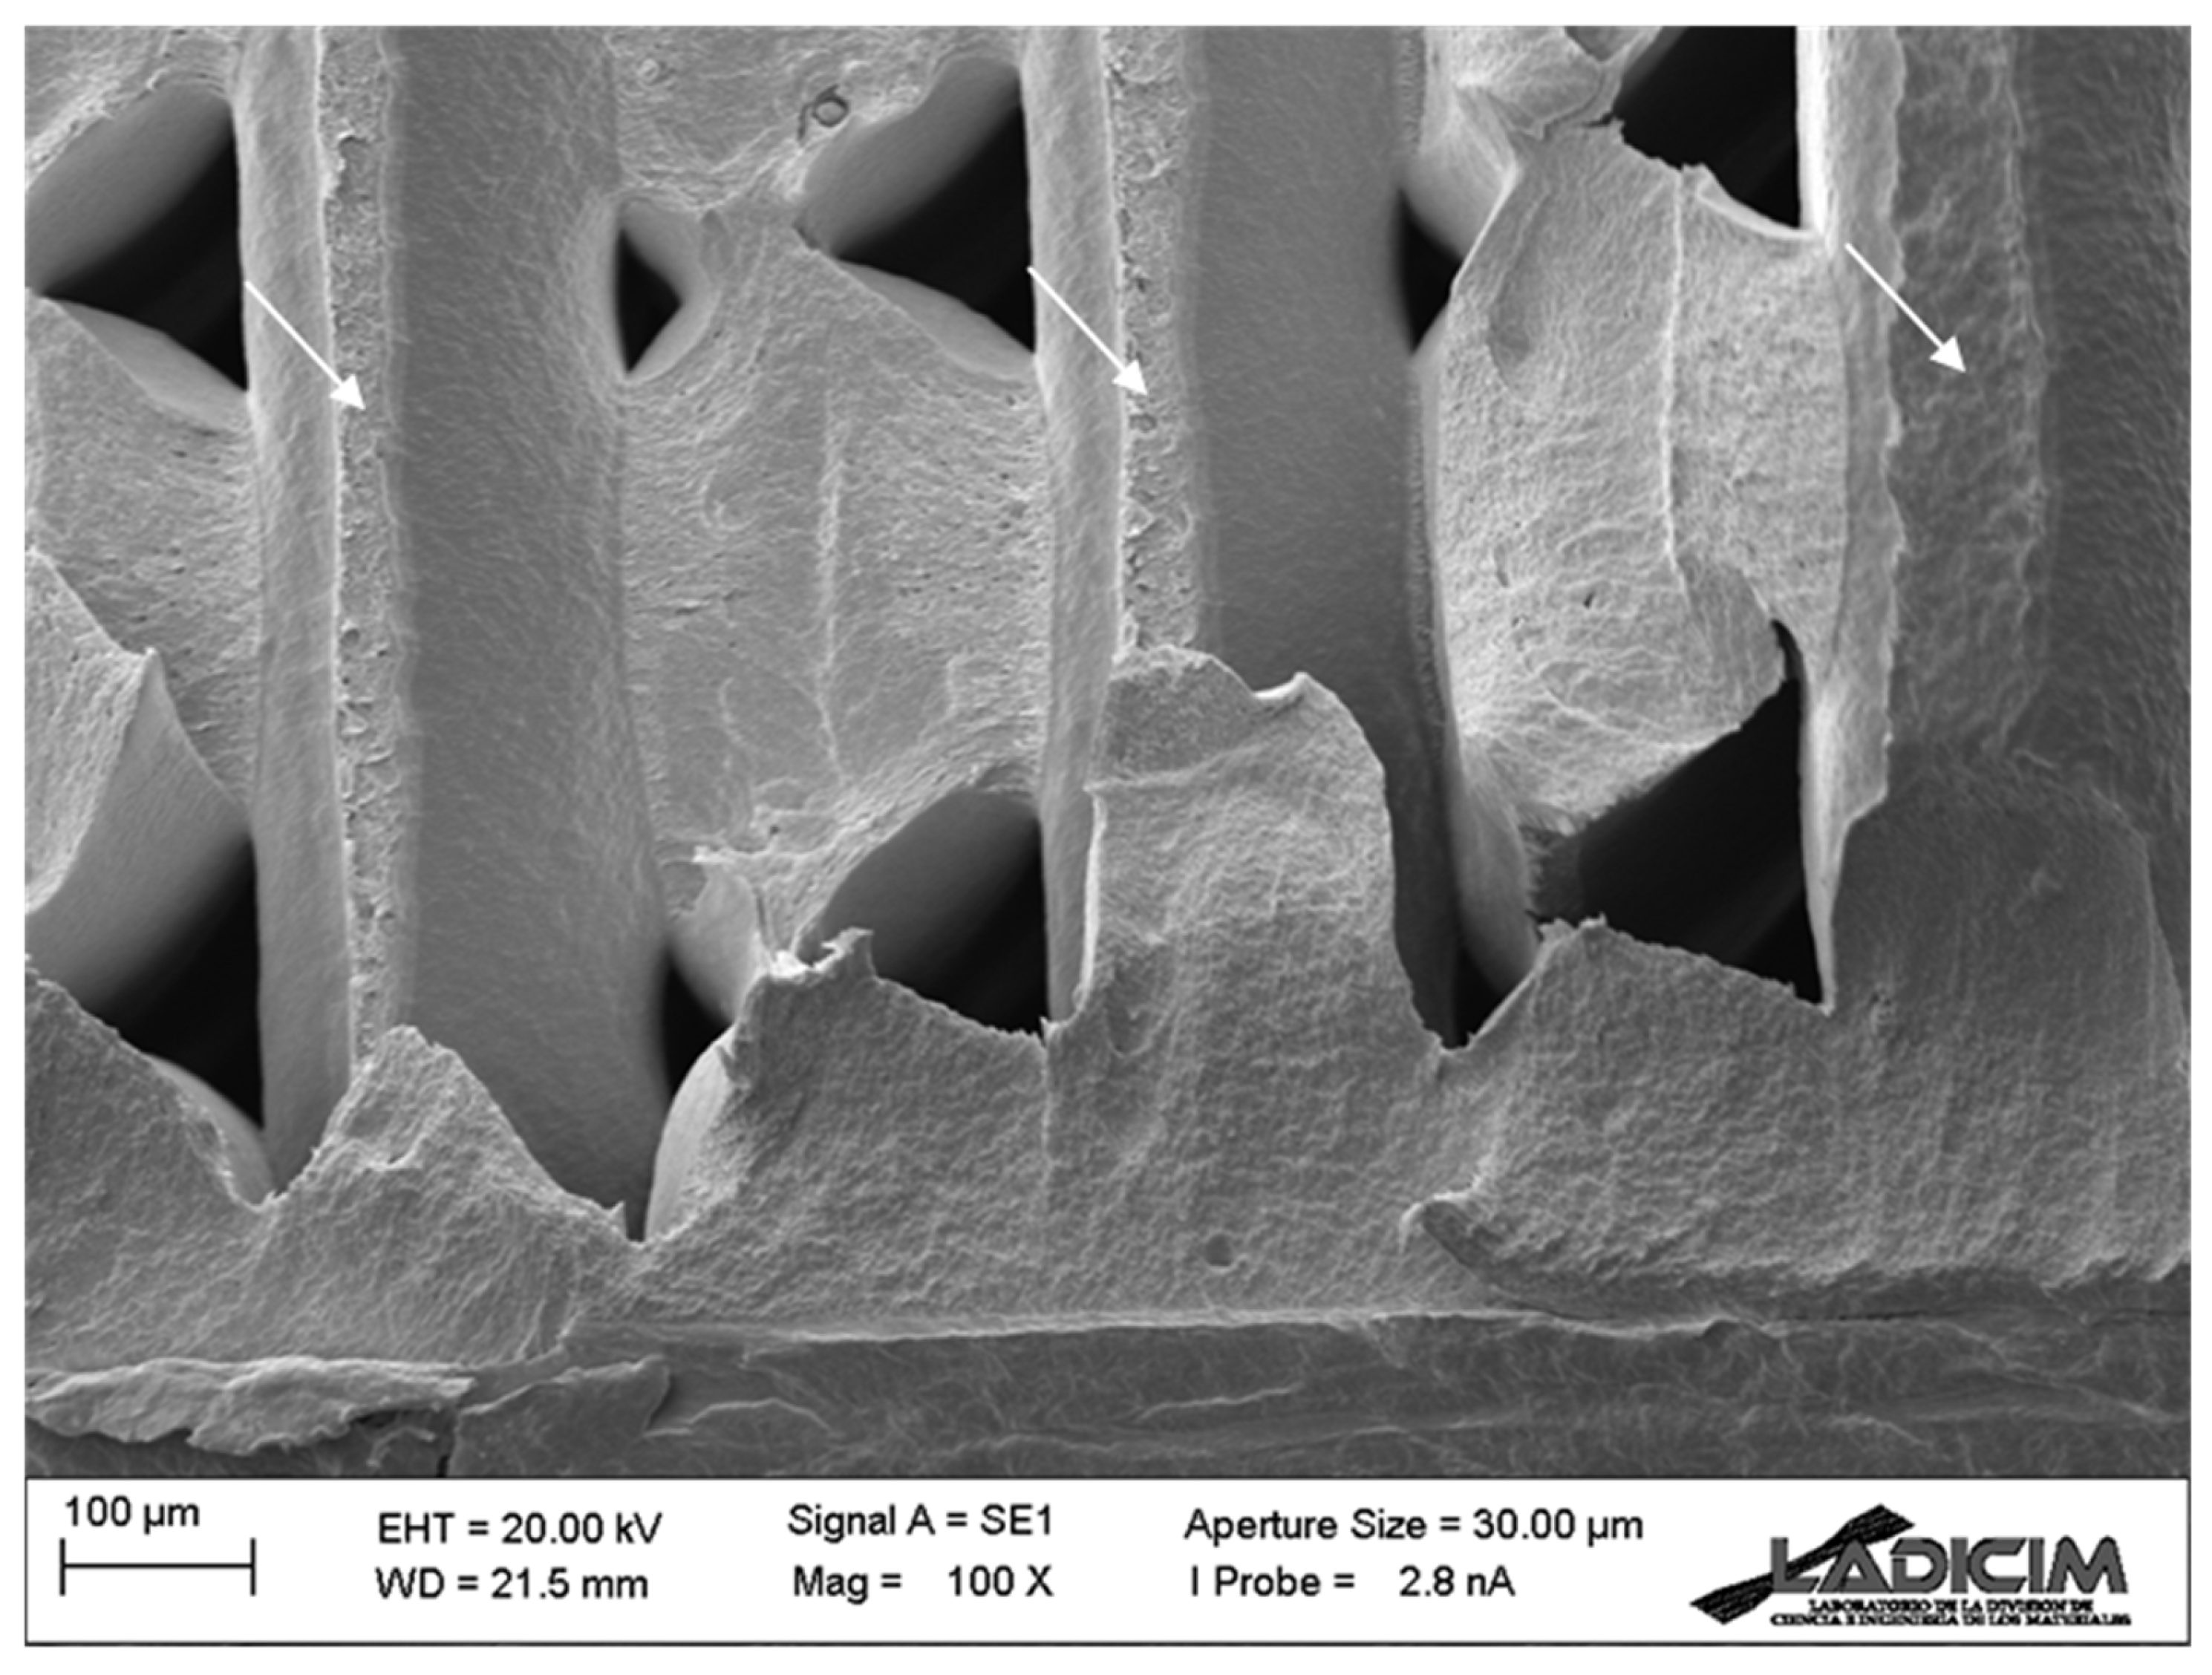
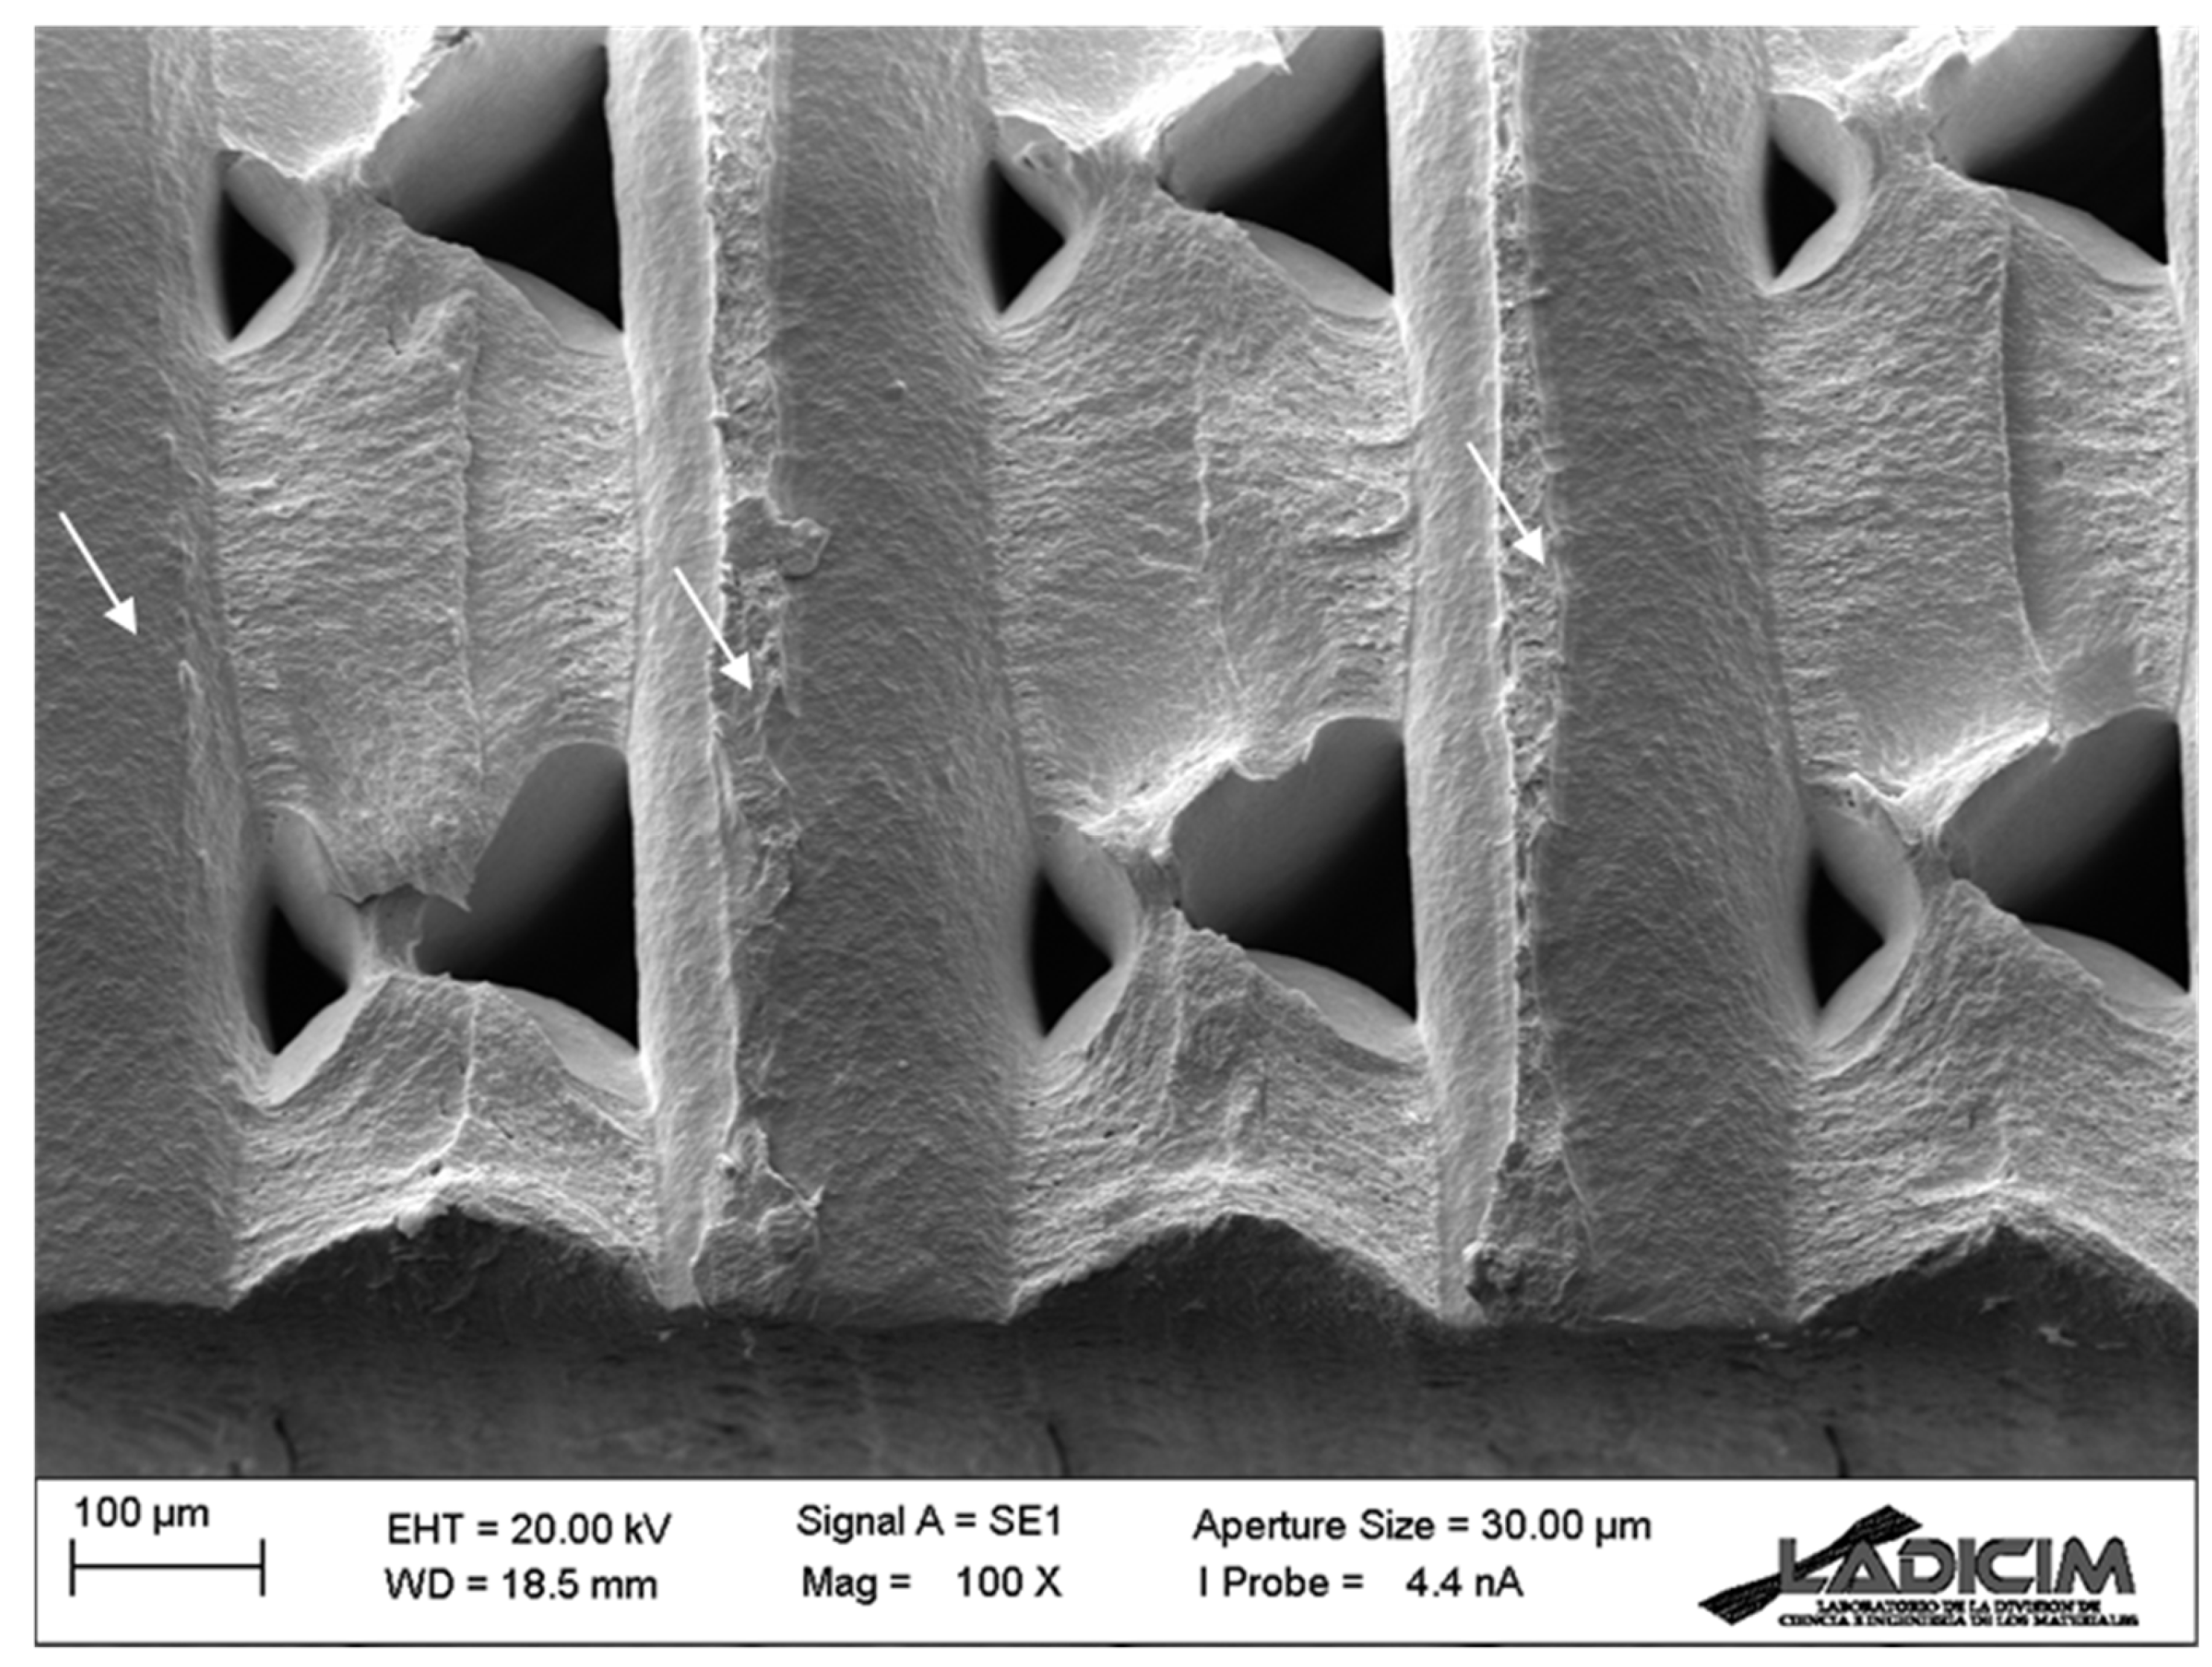
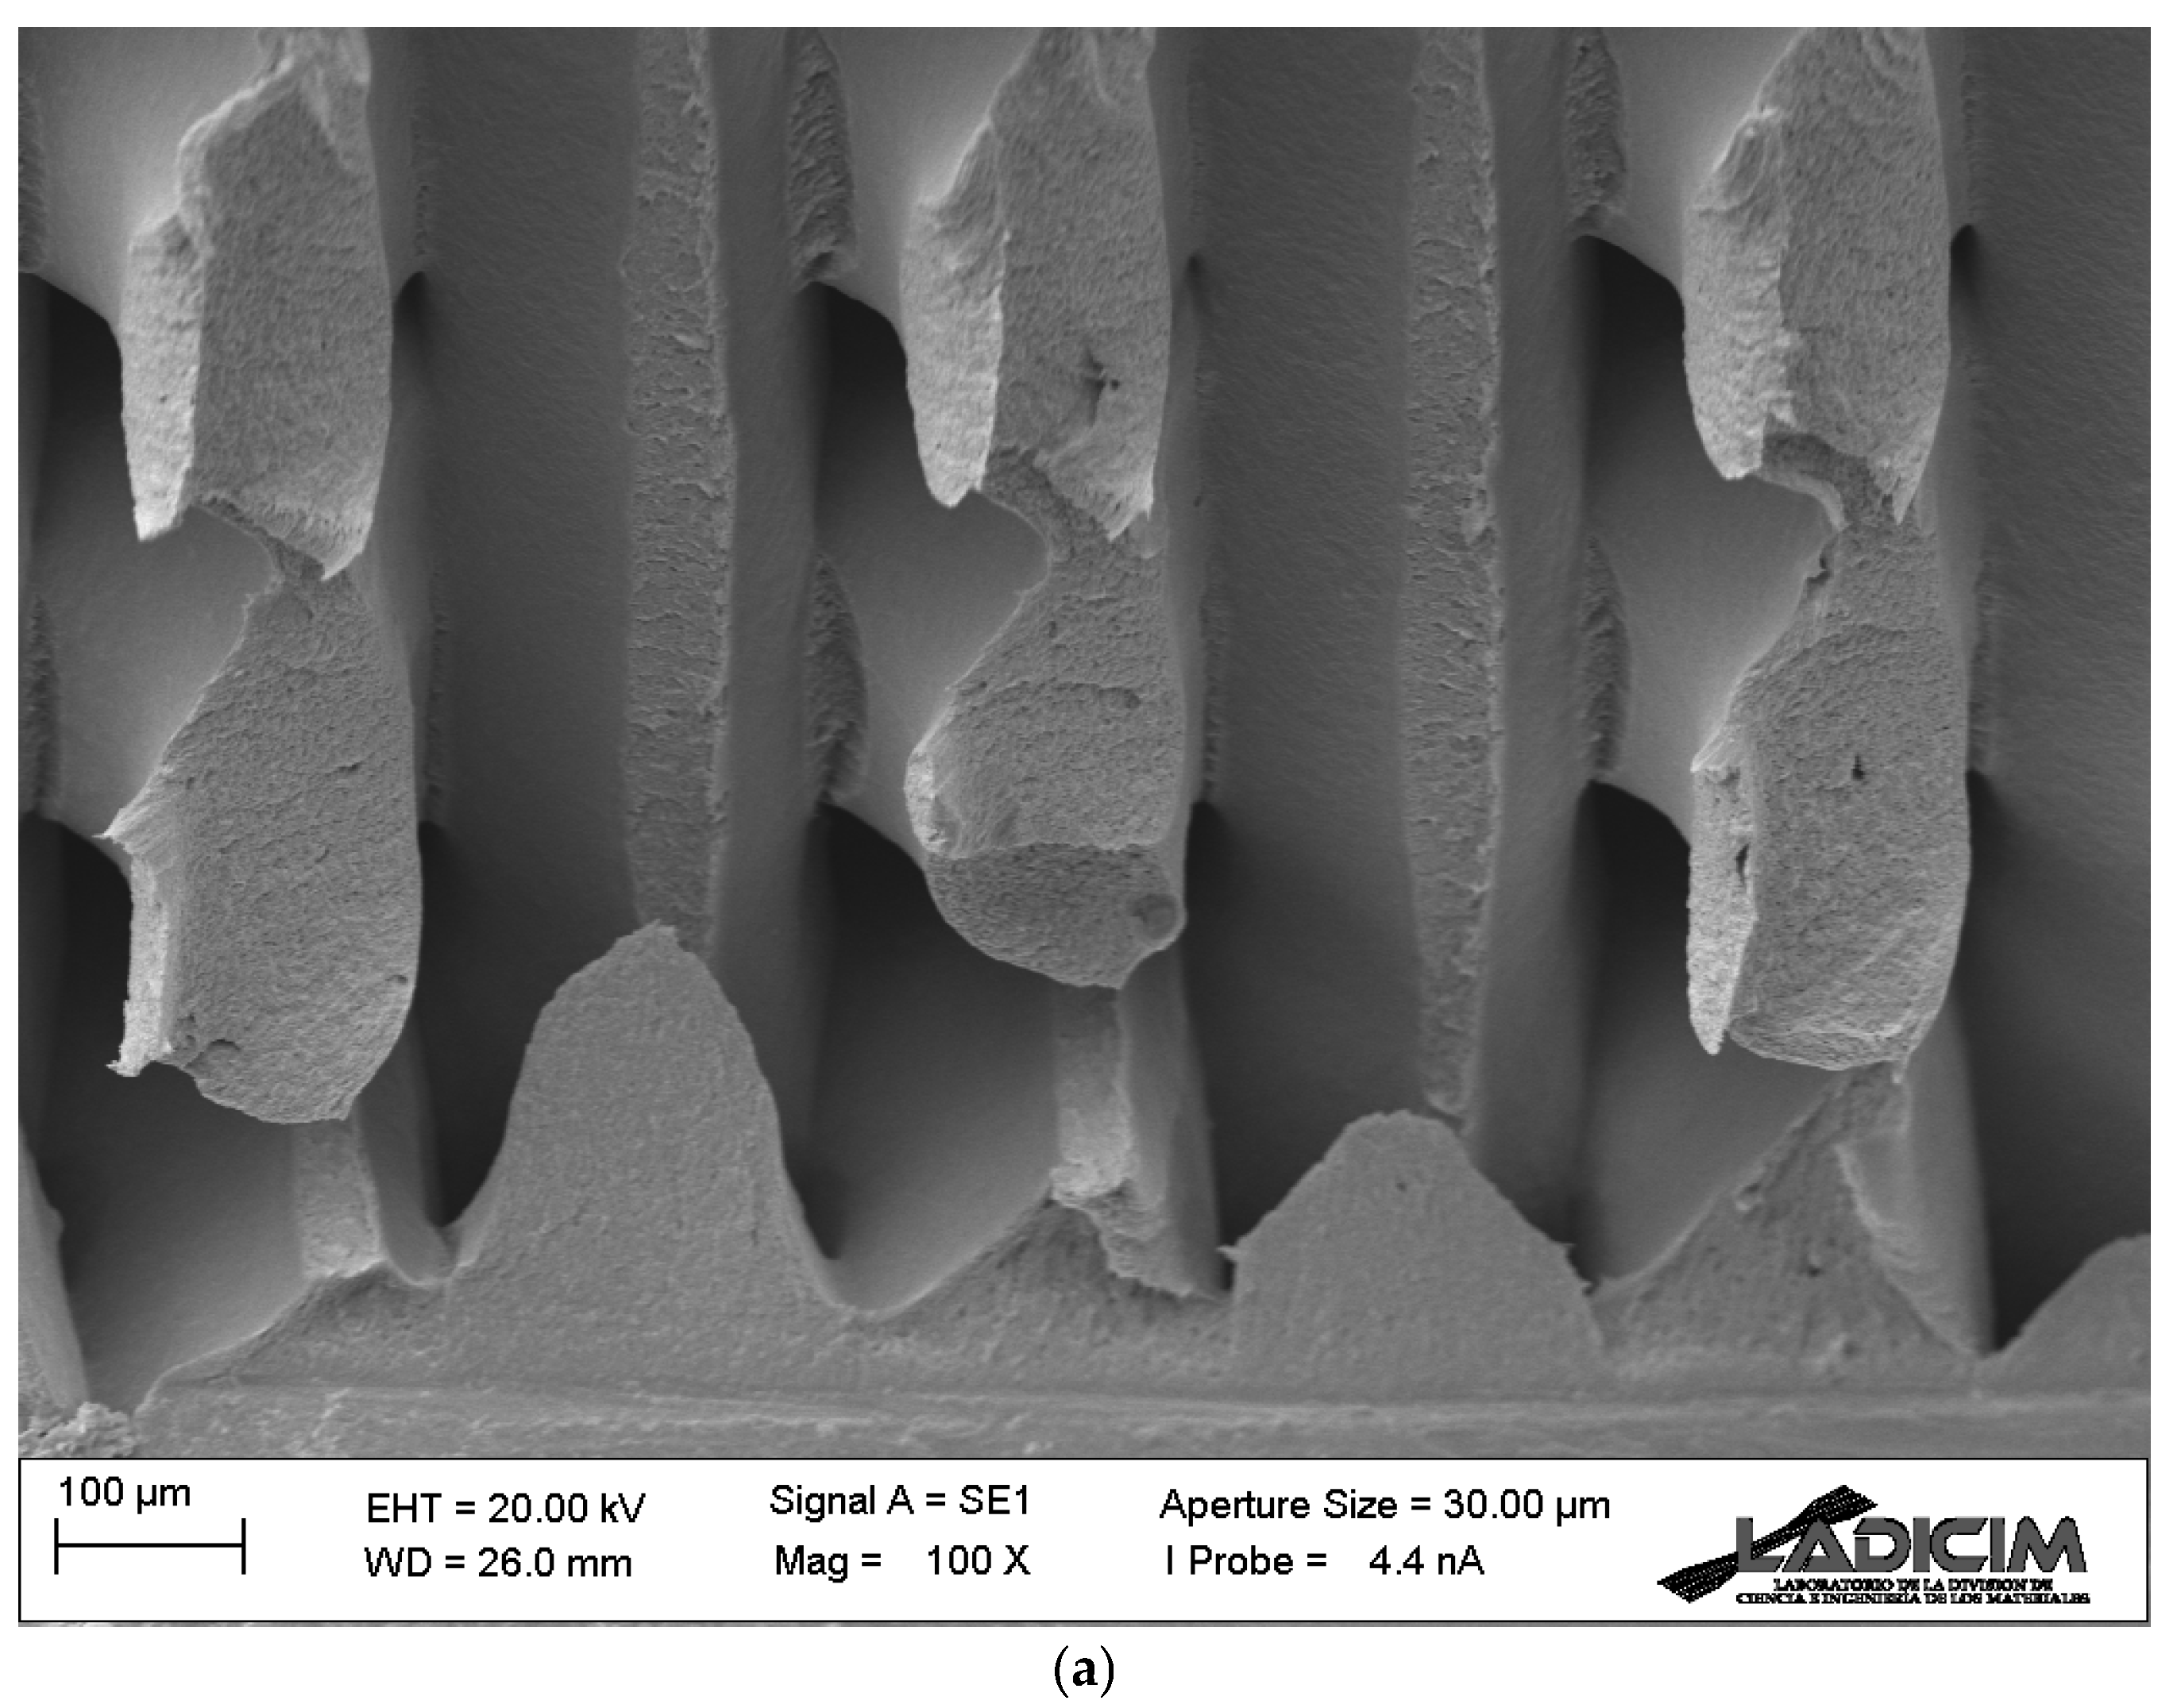
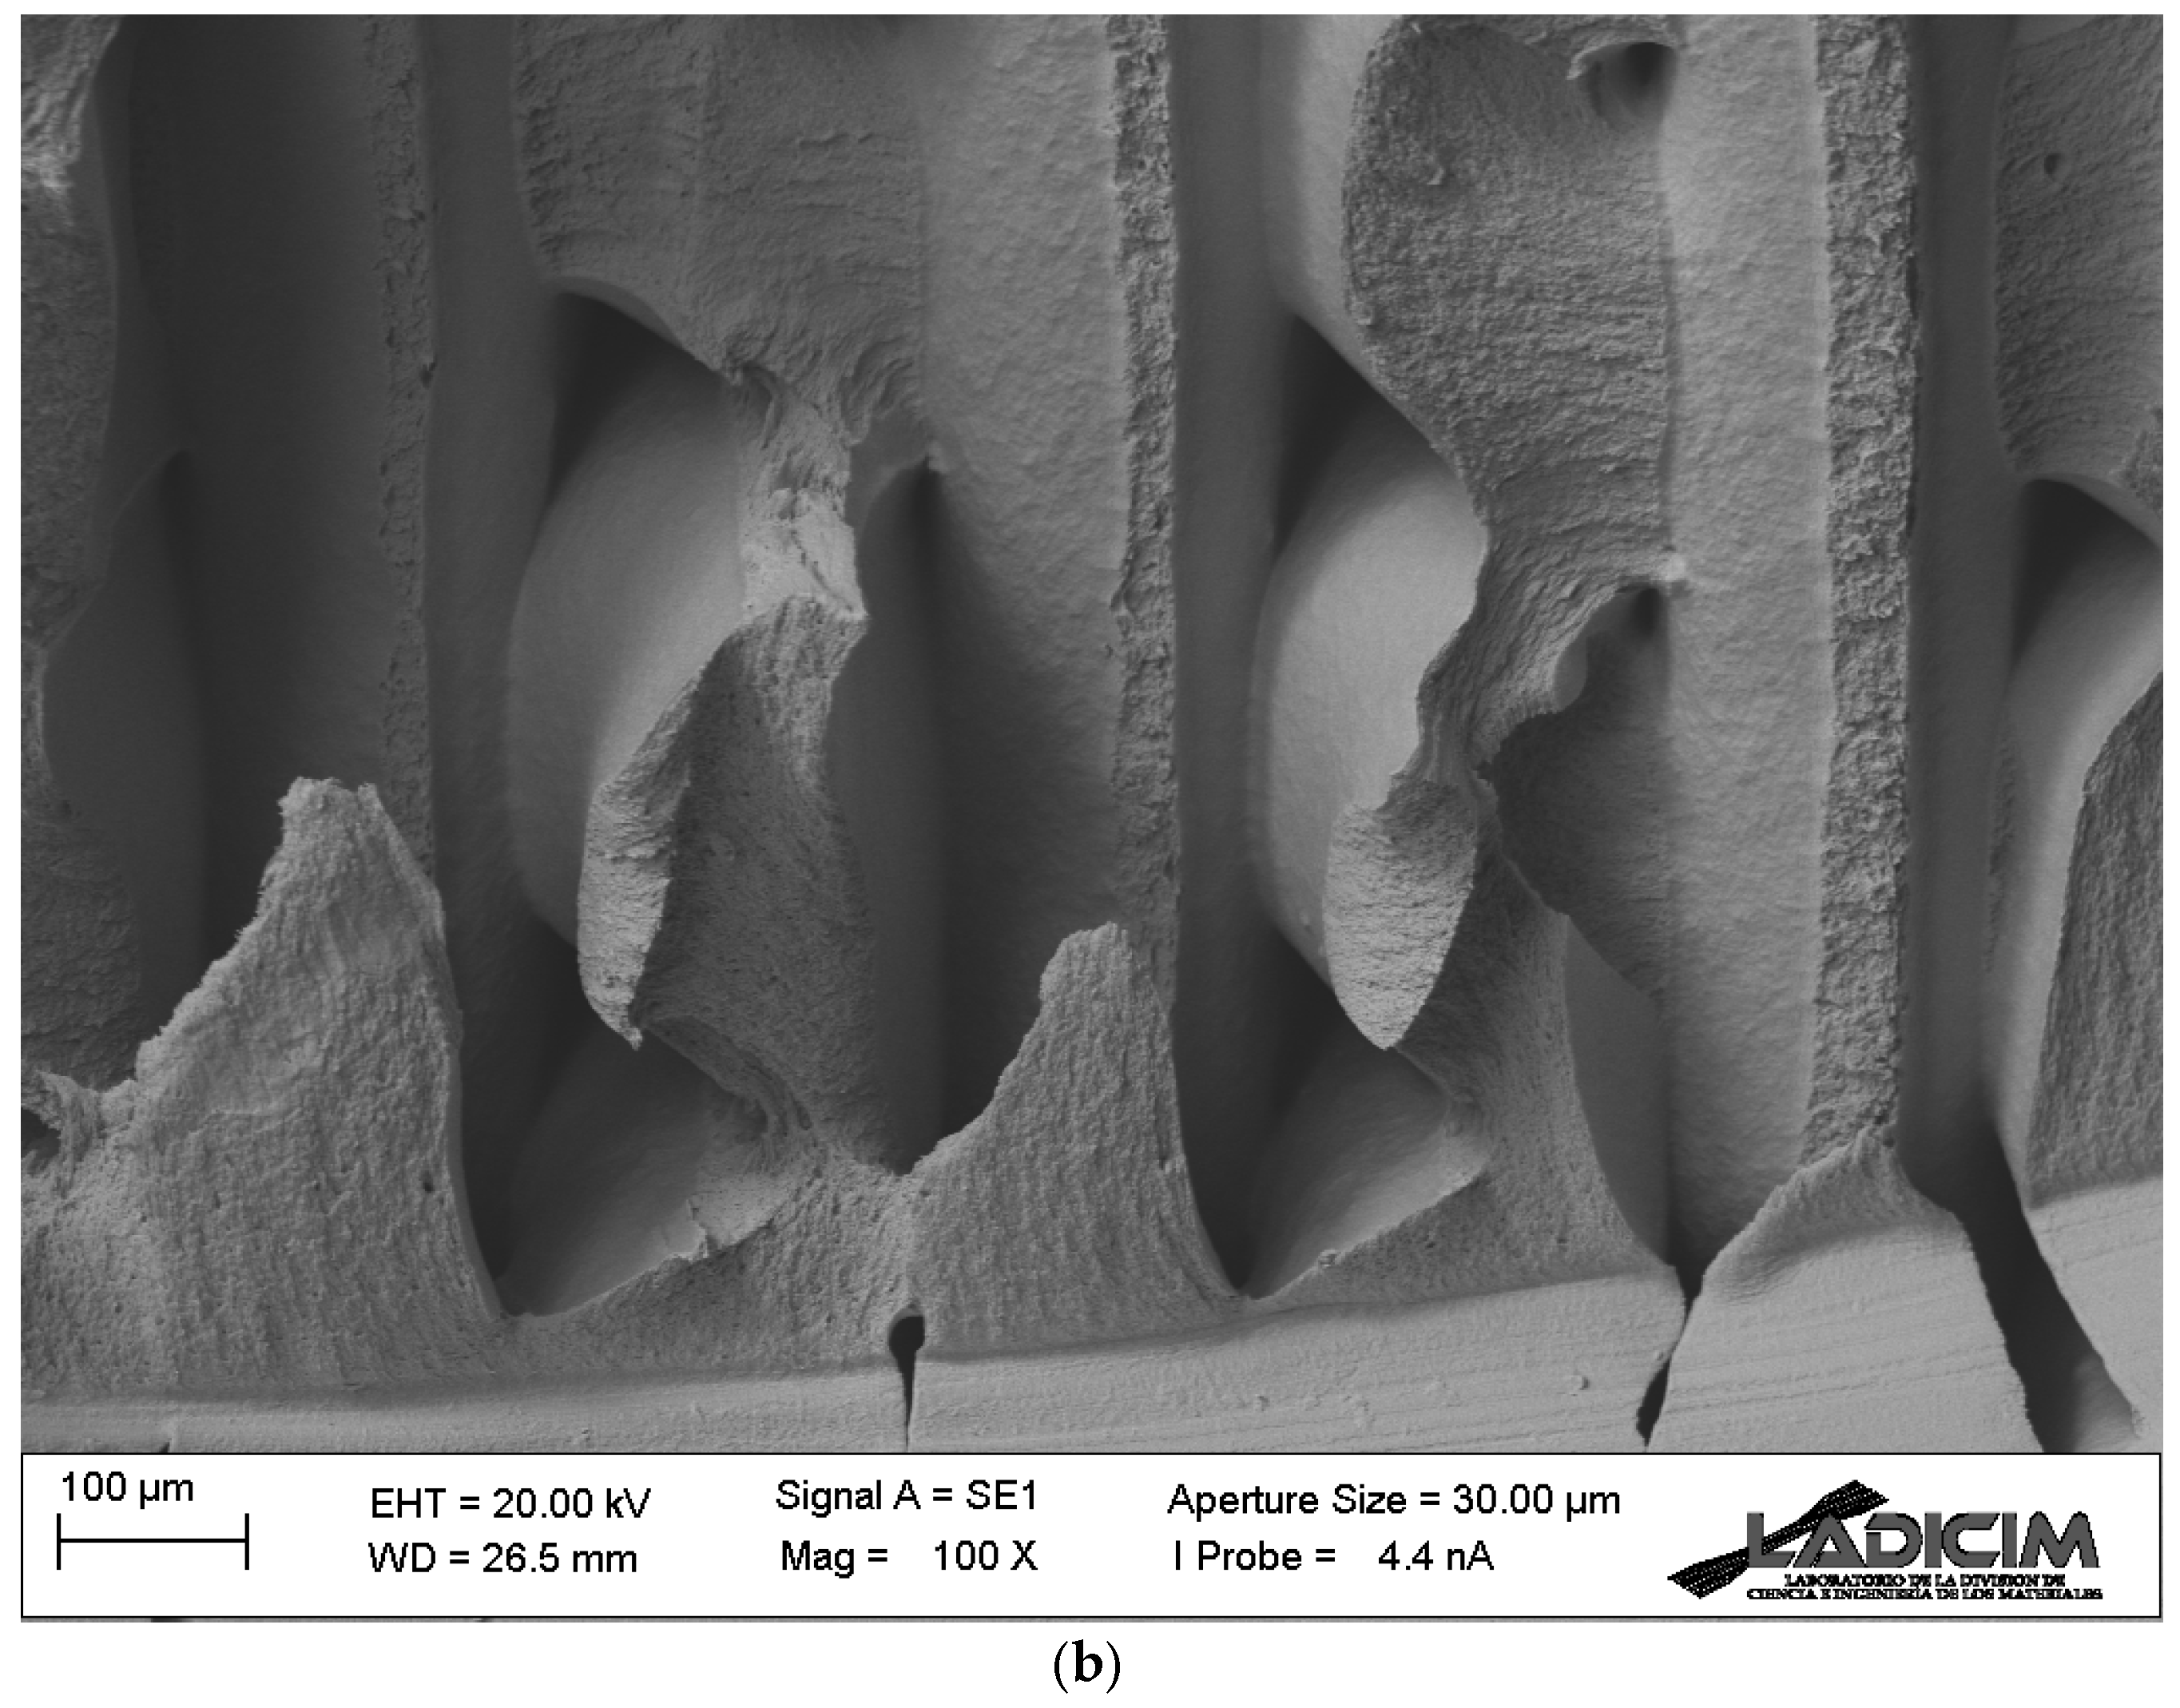
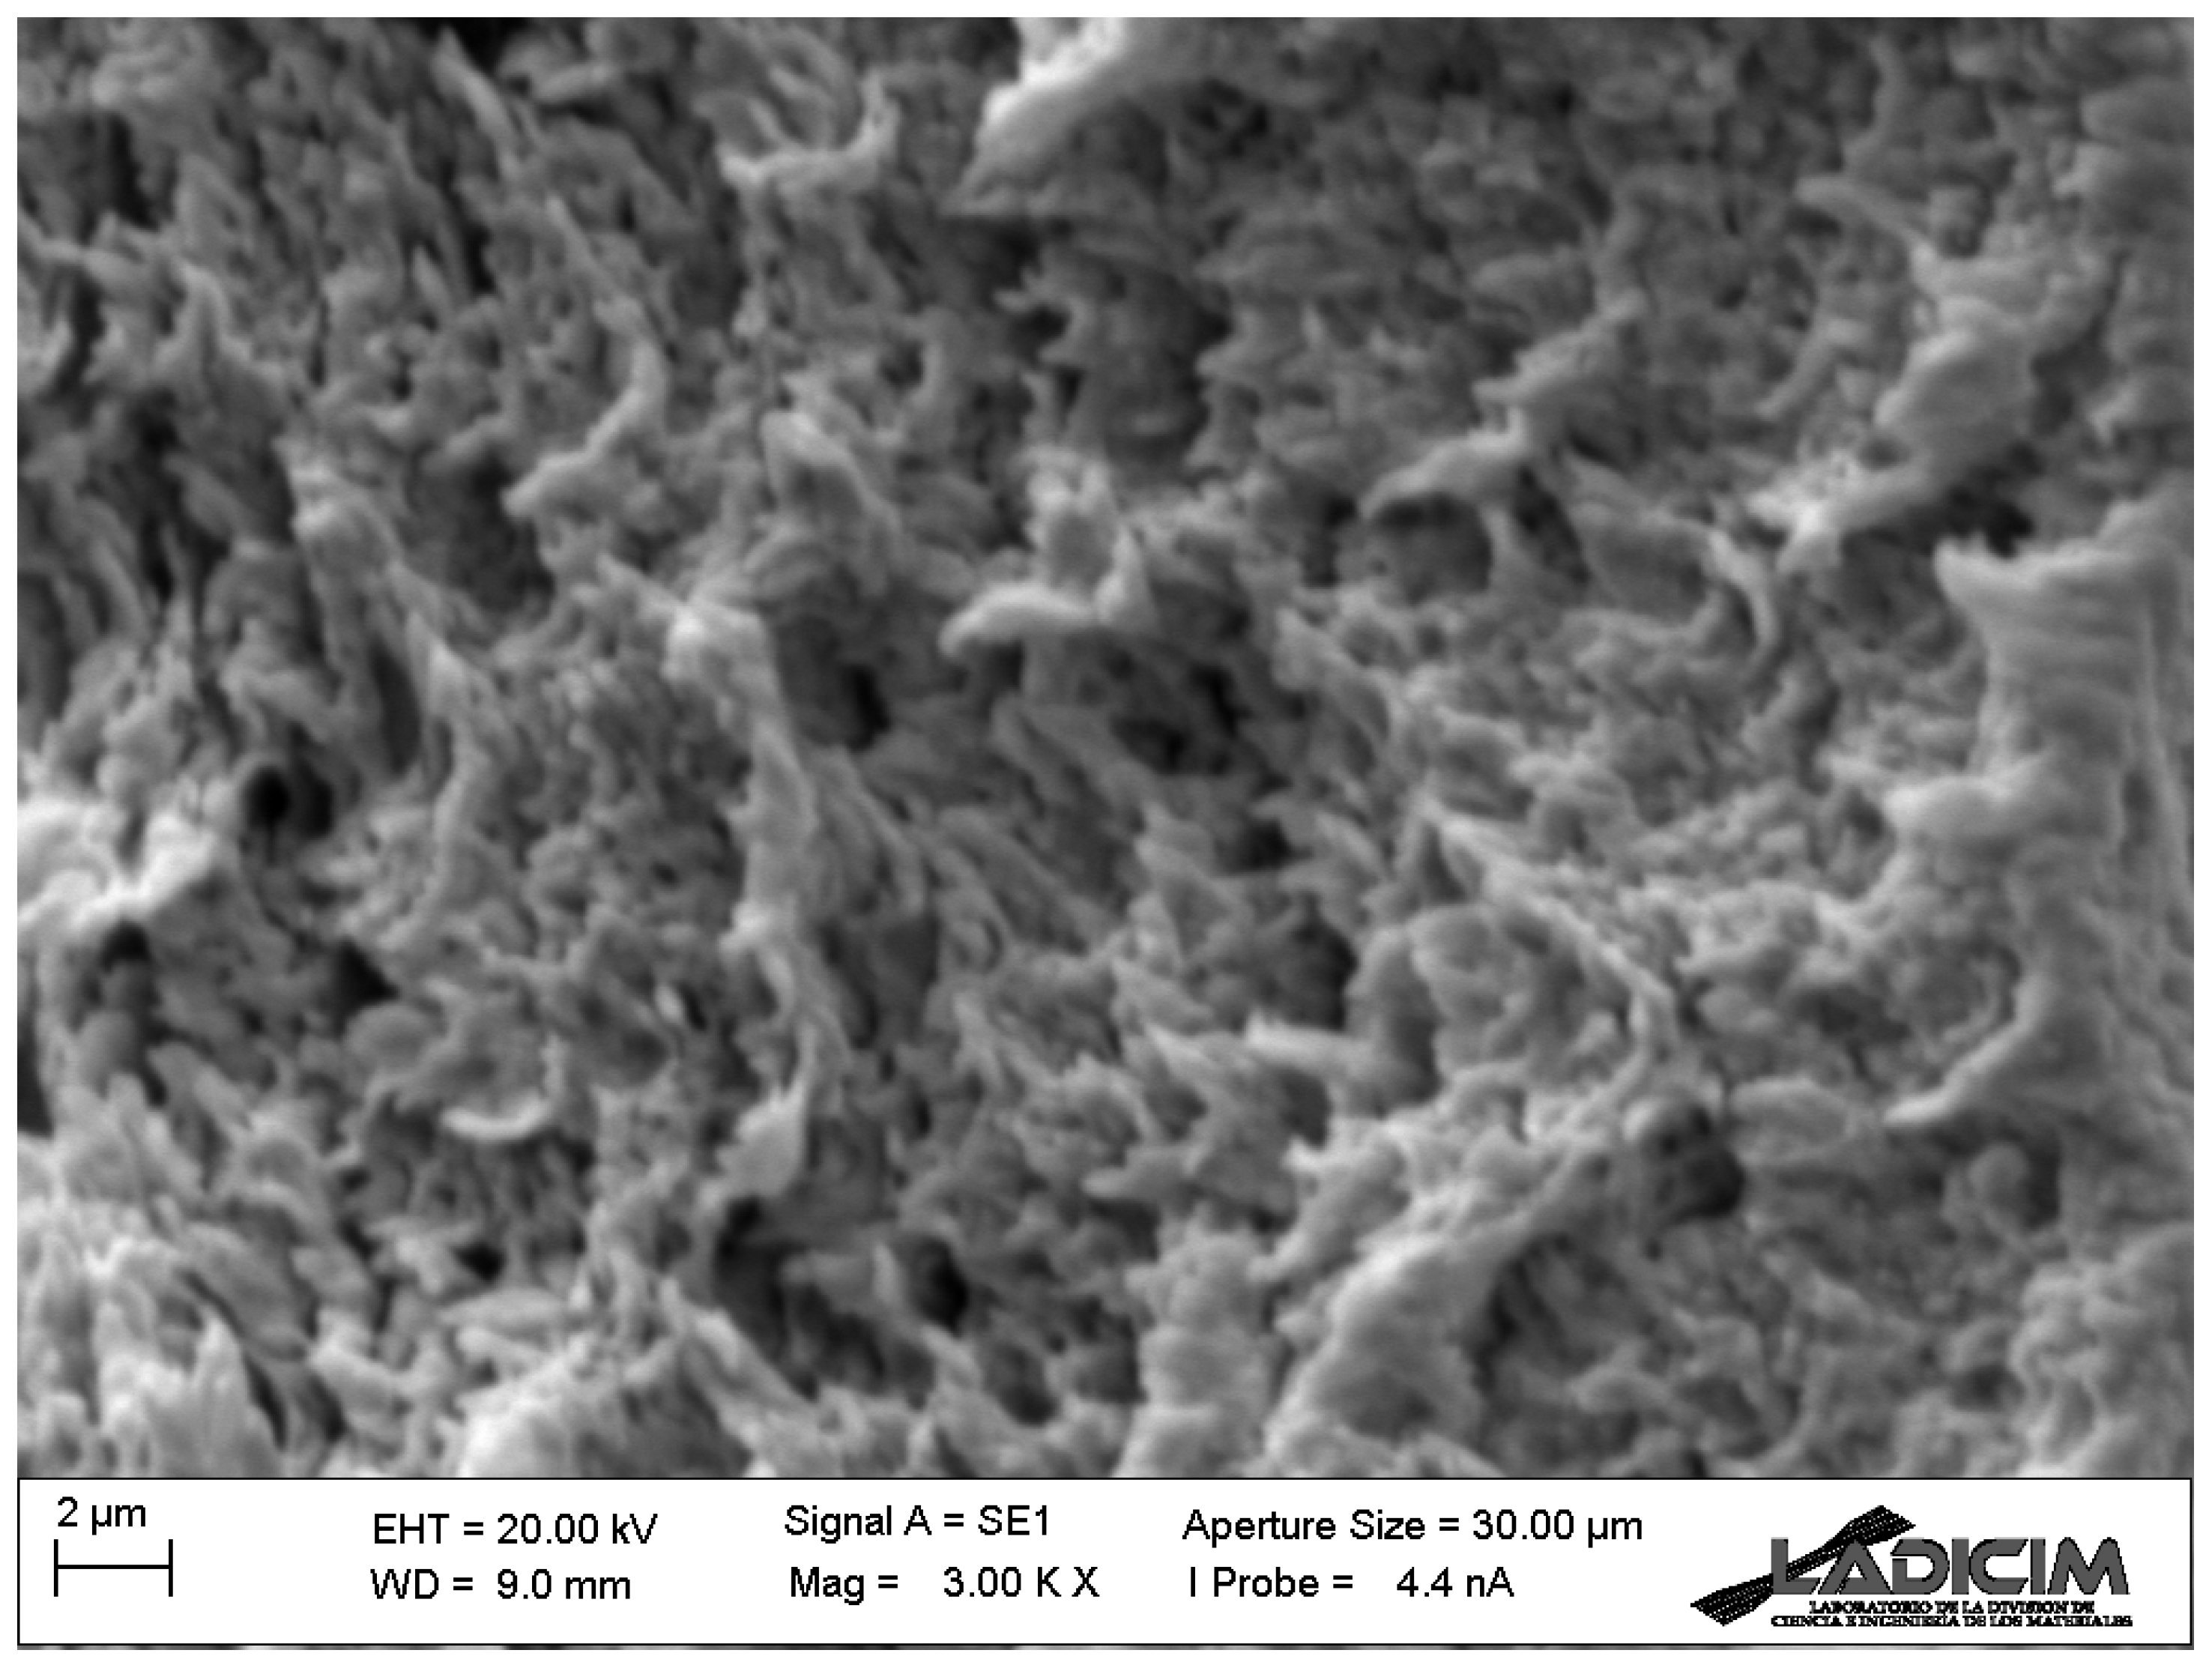
3.3. SEM Analysis
4. Conclusions
Author Contributions
Funding
Institutional Review Board Statement
Informed Consent Statement
Data Availability Statement
Acknowledgments
Conflicts of Interest
References
- Godina, R.; Ribeiro, I.; Matos, F.; Ferreira, B.T.; Carvalho, H.; Peças, P. Impact Assessment of Additive Manufacturing on Sustainable Business Models in Industry 4.0 Context. Sustainability 2020, 12, 7066. [Google Scholar] [CrossRef]
- D’Aveni, R.A. The Pan-Industrial Revolution: How New Manufacturing Titans Will Transform the World; Houghton Mifflin Harcourt: Boston, MA, USA, 2018. [Google Scholar]
- ISO/ASTM 52900:2021; Additive Manufacturing. General Principles. Fundamentals and Vocabulary. International Organization for Standardization/ASTM International: Geneva, Switzerland, 2021.
- Gibson, I.; Rosen, D.; Stucker, B.; Khorasani, M. Additive Manufacturing Technologies; Springer: Cham, Switzerland, 2021. [Google Scholar]
- Crump, S.S.; Muir, A.E.P.D. Creating Three-Dimensional Objects. U.S. Patent 005121329A, 8 June 1992. [Google Scholar]
- Duty, C.E.; Drye, T.; Franc, A. Material Development for Tooling Applications Using Big Area Additive Manufacturing (BAAM) (No. ORNL/TM-2015/78, 1209207); U.S. Department of Energy, Office of Scientific and Technical Information: Oak Ridge, TN, USA, 2015. [Google Scholar]
- Moreno Nieto, D.; Casal López, V.; Molina, S.I. Large-format polymeric pellet-based additive manufacturing for the naval industry. Addit. Manuf. 2018, 23, 79–85. [Google Scholar] [CrossRef]
- Huang, T.; Wang, S.; He, K. Quality control for fused deposition modeling based additive manufacturing: Current research and future trends. In Proceedings of the 2015 First International Conference on Reliability Systems Engineering (ICRSE), Beijing, China, 21–23 October 2015; pp. 1–6. [Google Scholar]
- Rinaldi, M.; Ghidini, T.; Cecchini, F.; Brandao, A.; Nanni, F. Additive layer manufacturing of poly (ether ether ketone) via FDM. Compos. B Eng. 2018, 145, 162–172. [Google Scholar] [CrossRef]
- Cicero, S.; Martínez-Mata, V.; Castanon-Jano, L.; Alonso-Estebanez, A.; Arroyo, B. Analysis of notch effect in the fracture behaviour of additively manufactured PLA and graphene reinforced PLA. Theor. Appl. Fract. Mech. 2021, 114, 103032. [Google Scholar] [CrossRef]
- Cicero, S.; Martínez-Mata, V.; Alonso-Estebanez, A.; Castanon-Jano, L.; Arroyo, B. Analysis of notch effect in 3D-printed ABS fracture specimens containing U-notches. Materials 2020, 13, 4716. [Google Scholar] [CrossRef]
- Love, L.J.; Kunc, V.; Rios, O.; Duty, C.E.; Elliott, A.M.; Post, B.K.; Smith, R.J.; Blue, C.A. The importance of carbon fiber to polymer additive manufacturing. J. Mater. Res. 2014, 29, 1893–1898. [Google Scholar] [CrossRef]
- Shofner, M.; Rodriguez-Macias, F.; Vaidyanathan, R.; Barrera, E.V. Single wall nanotube and vapor grown carbon fiber reinforced polymers processed by extrusion freeform fabrication. Compos. Part A Appl. Sci. Manuf. 2003, 34, 1207–1217. [Google Scholar] [CrossRef]
- Dorigato, A.; Moretti, V.; Dul, S.; Unterberger, S.H.; Pegoretti, A. Electrically conductive nanocomposites for fused deposition modelling. Synth. Met. 2017, 226, 7–14. [Google Scholar] [CrossRef]
- Dul, S.; Fambri, L.; Merlini, C.; Barra, G.M.O.; Bersani, M.; Vanzetti, L.; Pegoretti, A. Effect of graphene nanoplatelets structure on the properties of acrylonitrile-butadiene-styrene composites. Polym. Compos. 2017, 40, E285–E300. [Google Scholar] [CrossRef]
- Coppola, B.; Cappetti, N.; Di Maio, L.; Scarfato, P.; Incarnato, L. 3D printing of PLA/clay nanocomposites: Influence of printing temperature on printed samples properties. Materials 2018, 11, 1947. [Google Scholar] [CrossRef]
- El Magri, A.; Vanaei, S.; Vaudreuil, S. An overview on the influence of process parameters through the characteristic of 3D-printed PEEK and PEI parts. High Perform. Polym. 2021, 33, 862–880. [Google Scholar] [CrossRef]
- El Magri, A.; Vaudreuil, S.; Mabrouk, K.E.; Touhami, M.E. Printing temperature effects on the structural and mechanical performances of 3D printed Poly-(phenylene sulfide) material. IOP Conf. Ser. Mater. Sci. Eng. 2020, 783, 012001. [Google Scholar] [CrossRef]
- Hsueh, M.-H.; Lai, C.-J.; Liu, K.-Y.; Chung, C.-F.; Wang, S.-H.; Pan, C.-Y.; Huang, W.-C.; Hsieh, C.-H.; Zeng, Y.-S. Effects of printing temperature and filling percentage on the mechanical behavior of fused deposition molding technology components for 3D printing. Polymers 2021, 13, 2910. [Google Scholar] [CrossRef] [PubMed]
- Ziemian, S.; Okwara, M.; Ziemian, C.W. Tensile and fatigue behavior of layered acrylonitrile butadiene styrene. Rapid Prototyp. J. 2015, 21, 270–278. [Google Scholar] [CrossRef]
- Liang, Y.-L.; Moghbelli, E.; Sue, H.-J.; Minkwitz, R.; Stark, R. Effect of high temperature annealing on scratch behavior of acrylonitrile styrene acrylate copolymers. Polymer 2012, 53, 604–612. [Google Scholar] [CrossRef]
- Xiang, B.; Yin, X.; Zhang, J. A novel cool material: ASA (acrylonitrile-styrene-acrylate) matrix composites with solar reflective inorganic particles. Compos. Sci. Technol. 2017, 145, 149–156. [Google Scholar] [CrossRef]
- Ramteke, A.A.; Maiti, S.N. Mechanical properties of polycarbonate/modified acrylonitrile-styrene-acrylate terpolymer blend. J. Appl. Polym. Sci. 2010, 116, 486–492. [Google Scholar] [CrossRef]
- Hameed, A.Z.; Aravind Raj, S.; Kandasamy, J.; Shahzad, M.A.; Baghdadi, M.A. 3D printing parameter optimization using Taguchi approach to examine Acrylonitrile Styrene Acrylate (ASA) mechanical properties. Polymers 2022, 14, 3256. [Google Scholar] [CrossRef]
- Cahyadi, W. Mechanical properties of 3D printed Acrylonitrile Styrene Acrylate. Master’s Thesis, South Dakota State University, Brookings, SD, USA, 2019. [Google Scholar]
- Meyer, T.K.; Tanikella, N.G.; Reich, M.J.; Pearce, J.M. Potential of distributed recycling from hybrid manufacturing of 3-D printing and injection molding of stamp sand and acrylonitrile styrene acrylate waste composite. Sustain. Mater. Technol. 2020, 25, e00169. [Google Scholar] [CrossRef]
- Appalsamy, T.; Hamilton, S.L.; Kgaphola, M.J. Tensile test analysis of 3D printed specimens with varying print orientation and infill density. J. Compos. Sci. 2024, 8, 121. [Google Scholar] [CrossRef]
- Gonçalves, V.P.D.; Vieira, C.M.F.; Colorado, H.A. Mechanical behavior of tension of multipolymers through fused deposition modeling. In Proceedings of the 153rd Annual Meeting & Exhibition of The Minerals, Metals & Materials Society, TMS 2024, Orlando, FL, USA, 3–7 March 2024; Springer: Cham, Switzerland, 2024. [Google Scholar]
- Rakshit, R.; Kalvettukaran, P.; Acharyya, S.K.; Panja, S.C.; Misra, D. Development of high specific strength acrylonitrile styrene acrylate (ASA) structure using fused filament fabrication. Prog. Addit. Manuf. 2023, 8, 1543–1553. [Google Scholar] [CrossRef]
- Camposeco-Negrete, C. Optimization of printing parameters in fused deposition modeling for improving part quality and process sustainability. Int. J. Adv. Manuf. Technol. 2020, 108, 2131–2147. [Google Scholar] [CrossRef]
- Głowacki, M.; Skórczewska, K.; Lewandowski, K.; Szewczykowski, P.; Mazurkiewicz, A. Effect of Shock-Variable Environmental Temperature and Humidity Conditions on 3D-Printed Polymers for Tensile Properties. Polymers 2024, 16, 1. [Google Scholar] [CrossRef] [PubMed]
- Głowacki, M.; Mazurkiewicz, A.; Skórczewska, K.; Lewandowski, K.; Smyk, E.; Branco, R. Effect of Thermal Shock Conditions on the Low-Cycle Fatigue Performance of 3D-Printed Materials: Acrylonitrile Butadiene Styrene, Acrylonitrile-Styrene-Acrylate, High-Impact Polystyrene, and Poly(lactic acid). Polymers 2024, 16, 1823. [Google Scholar] [CrossRef]
- Cressall, S.; Phillips, C.O.; Al-Shatty, W.; Deganello, D. The effect of high-intensity gamma radiation on PETG and ASA polymer-based fused deposition modelled 3D printed parts. J. Mater. Sci. 2024, 59, 1768–1782. [Google Scholar] [CrossRef]
- Zhang, X.; Zhang, J. Effect of core-shell structures of acrylonitrile-styrene-acrylate (ASA) terpolymer on the properties of poly(vinyl chloride) (PVC)/ASA blends: Miscibility, toughness, and heat resistance. J. Appl. Polym. Sci. 2018, 135, 46839. [Google Scholar] [CrossRef]
- Sanford, L.T.; Jaafar, I.H.; Seibi, A.; Gohn, A. The effect of infill angle, build orientation, and void fraction on the tensile strength and fracture of 3D printed ASA via fused filament fabrication. Manuf. Lett. 2022, 33, 569–573. [Google Scholar] [CrossRef]
- Mao, Z.; Zhang, J. Largely improved the low temperature toughness of acrylonitrile-styrene-acrylate (ASA) resin: Fabricated a core-shell structure of two elastomers through the differences of interfacial tensions. Appl. Surf. Sci. 2018, 444, 345–354. [Google Scholar] [CrossRef]
- Guessasma, S.; Belhabib, S.; Nouri, H. Microstructure, Thermal and Mechanical Behavior of 3D Printed Acrylonitrile Styrene Acrylate. Macromol. Mater. Eng. 2019, 304, 1800793. [Google Scholar] [CrossRef]
- Taylor, D. The Theory of Critical Distances: A New Perspective in Fracture Mechanics; Elsevier: London, UK, 2007. [Google Scholar]
- Cicero, S.; Madrazo, V.; Carrascal, I. Analysis of notch effect in PMMA using the Theory of Critical Distances. Eng. Fract. Mech. 2012, 86, 56–72. [Google Scholar] [CrossRef]
- Cicero, S.; Madrazo, V.; Garcia, T. Analysis of notch effect in the apparent fracture toughness and the fracture micromechanisms of ferritic-pearlitic steels operating within their lower shelf. Eng. Fail. Anal. 2014, 36, 322–342. [Google Scholar] [CrossRef]
- Cicero, S.; García, T.; Madrazo, V. Application and validation of the notch master curve in medium and high strength structural steels. J. Mech. Sci. Technol. 2015, 29, 4129–4142. [Google Scholar] [CrossRef]
- Ibáñez-Gutiérrez, F.T.; Cicero, S.; Carrascal, I. On the influence of moisture content on the fracture behaviour of notched short glass fibre reinforced polyamide 6. Compos. Part B Eng. 2019, 159, 62–71. [Google Scholar] [CrossRef]
- Cicero, S.; Garcia, T.; Castro, J.; Madrazo, V.; Andrés, D. Analysis of notch effect on the fracture behaviour of granite and limestone: An approach from the Theory of Critical Distances. Eng. Geol. 2014, 177, 1–9. [Google Scholar] [CrossRef]
- Neuber, H. Theory of Notch Stresses: Principles for Exact Calculation of Strength with Reference to Structural Form and Material; Springer: Berlin/Heidelberg, Germany, 1958. [Google Scholar]
- Peterson, R.E. Methods of correlating data from fatigue tests of stress concentration specimens. In Stephen Timoshenko Anniversary Volume; Macmillan: New York, NY, USA, 1938; pp. 179–183. [Google Scholar]
- Ng, C.T.; Susmel, L. Notch static strength of additively manufactured acrylonitrile butadiene styrene (ABS). Addit. Manuf. 2020, 34, 101212. [Google Scholar] [CrossRef]
- Valvez, S.; Silva, A.P.; Reis, N.B. Optimization of printing parameters to maximize the mechanical properties of 3D-printed PETG-based parts. Polymers 2022, 14, 2564. [Google Scholar] [CrossRef]
- ASTM D638-14; Standard Test Method for Tensile Properties of Plastics. ASTM International: West Conshohocken, PA, USA, 2014; Volume 08.01.
- ASTM D6068-10(2018); Standard Test Method for Determining J-R Curves of Plastic Materials. ASTM International: West Conshohocken, PA, USA, 2018.
- Creager, M.; Paris, P.C. Elastic field equations for blunt cracks with reference to stress corrosion cracking. Int. J. Fract. Mech. 1967, 3, 247–252. [Google Scholar] [CrossRef]
- ASTM D5045-14; Standard Test Methods for Plane-Strain Fracture Toughness and Strain Energy Release Rate of Plastic Materials. ASTM International: West Conshohocken, PA, USA, 2014; Volume 08.02.
- Nabavi-Kivi, A.; Ayatollahi, M.R.; Razavi, N. Investigating the effect of raster orientation on fracture behavior of 3D-printed ABS specimens under tension-tear loading. Eur. J. Mech. A-Solids 2023, 99, 104944. [Google Scholar] [CrossRef]
- McLouth, T.D.; Severino, J.V.; Adams, P.M.; Patel, D.N.; Zaldivar, R.J. The impact of print orientation and raster pattern on fracture toughness in additively manufactured ABS. Addit. Manuf. 2017, 18, 103–109. [Google Scholar] [CrossRef]
- Ayatollahi, M.R.; Nabavi-Kivi, A.; Bahrami, B.; Yahya, M.Y.; Khosravani, M.R. The influence of in-plane raster angle on tensile and fracture strengths of 3D-printed PLA specimens. Eng. Fract. Mech. 2020, 237, 107225. [Google Scholar] [CrossRef]


| Raster Orientation | E (MPa) | σt (MPa) | ɛu (%) |
|---|---|---|---|
| 0/90 | 1050 ± 66 | 19.4 ± 1.0 | 2.8 ± 0.2 |
| 45/−45 | 1053 ± 22 | 18.5 ± 0.7 | 4.5 ± 0.2 |
| 30/−60 | 990 ± 28 | 16.5 ± 0.1 | 2.8 ± 0.1 |
| Raster Orientation | Test | Notch Radius, ρ | W | B | a0 | Pcrit | avg. ± sd. | |
|---|---|---|---|---|---|---|---|---|
| (mm) | (mm) | (mm) | (mm) | (N) | (MPa·m1/2) | (MPa·m1/2) | ||
| 0/90 | 1 | 0 | 9.86 | 5.18 | 4.75 | 101.6 | 2.76 | 2.47 ± 0.19 |
| 0/90 | 2 | 0 | 9.72 | 5.16 | 4.80 | 67.4 | 2.56 | |
| 0/90 | 3 | 0 | 9.55 | 5.00 | 4.78 | 78.0 | 2.51 | |
| 0/90 | 4 | 0 | 9.64 | 5.01 | 4.90 | 52.5 | 2.20 | |
| 0/90 | 5 | 0 | 9.75 | 5.13 | 4.80 | 66.2 | 2.49 | |
| 0/90 | 6 | 0 | 9.74 | 4.99 | 4.18 | 69.8 | 2.34 | |
| 0/90 | 1 | 0.51 | 9.67 | 5.09 | 5.17 | 71.9 | 2.71 | 2.68 ± 0.18 |
| 0/90 | 2 | 0.52 | 9.57 | 5.07 | 5.16 | 70.7 | 2.77 | |
| 0/90 | 3 | 0.50 | 9.40 | 5.05 | 5.15 | 72.8 | 2.82 | |
| 0/90 | 4 | 0.49 | 9.73 | 5.10 | 4.99 | 91.7 | 2.86 | |
| 0/90 | 5 | 0.50 | 9.64 | 5.00 | 4.90 | 68.7 | 2.46 | |
| 0/90 | 6 | 0.59 | 9.51 | 5.25 | 4.14 | 67.4 | 2.47 | |
| 0/90 | 1 | 1.03 | 9.74 | 4.99 | 5.13 | 68.5 | 2.72 | 2.85 ± 0.22 |
| 0/90 | 2 | 1.00 | 9.71 | 5.01 | 5.06 | 72.1 | 2.64 | |
| 0/90 | 3 | 1.01 | 9.83 | 4.95 | 5.06 | 74.2 | 2.76 | |
| 0/90 | 4 | 1.02 | 9.75 | 5.04 | 5.19 | 93.4 | 3.19 | |
| 0/90 | 5 | 1.01 | 9.70 | 5.02 | 5.11 | 73.4 | 2.93 | |
| 0/90 | 6 | 1.01 | 9.60 | 5.02 | 5.18 | - | ||
| 0/90 | 1 | 2.10 | 9.70 | 5.03 | 4.37 | 69.3 | 2.81 | 2.70 ± 0.09 |
| 0/90 | 2 | 2.11 | 9.63 | 5.05 | 4.37 | 69.0 | 2.65 | |
| 0/90 | 3 | 2.12 | 9.67 | 5.10 | 4.36 | 69.9 | 2.82 | |
| 0/90 | 4 | 2.10 | 9.72 | 5.06 | 4.30 | 69.3 | 2.64 | |
| 0/90 | 5 | 2.13 | 9.60 | 5.01 | 4.34 | 75.1 | 2.64 | |
| 0/90 | 6 | 2.10 | 9.69 | 5.12 | 4.35 | 67.9 | 2.65 |
| Raster Orientation | Test | Notch Radius, ρ | W | B | a0 | Pcrit | avg. ± sd. | |
|---|---|---|---|---|---|---|---|---|
| (mm) | (mm) | (mm) | (mm) | (N) | (MPa·m1/2) | (MPa·m1/2) | ||
| 45/−45 | 1 | 0 | 9.74 | 5.00 | 4.94 | 68.5 | 2.49 | 2.90 ± 0.23 |
| 45/−45 | 2 | 0 | 9.80 | 5.06 | 4.40 | 88.9 | 2.95 | |
| 45/−45 | 3 | 0 | 9.84 | 5.14 | 5.07 | 87.8 | 3.12 | |
| 45/−45 | 4 | 0 | 9.52 | 5.05 | 4.97 | 82.5 | 3.04 | |
| 45/−45 | 5 | 0 | 9.58 | 5.10 | 5.02 | 82.0 | 2.75 | |
| 45/−45 | 6 | 0 | 9.68 | 5.16 | 5.25 | 89.1 | 3.01 | |
| 45/−45 | 1 | 0.60 | 9.14 | 5.39 | 4.77 | 54.3 | 2.65 | 3.07 ± 0.28 |
| 45/−45 | 2 | 0.50 | 9.59 | 5.12 | 4.90 | 86.1 | 3.34 | |
| 45/−45 | 3 | 0.70 | 9.67 | 5.01 | 4.77 | 76.4 | 3.33 | |
| 45/−45 | 4 | 0.67 | 9.68 | 5.05 | 5.06 | 71.8 | 3.19 | |
| 45/−45 | 5 | 0.60 | 9.36 | 5.20 | 5.10 | 70.5 | 3.09 | |
| 45/−45 | 6 | 0.56 | 9.70 | 5.16 | 5.19 | 56.7 | 2.80 | |
| 45/−45 | 1 | 1.13 | 9.57 | 5.04 | 4.58 | 78.0 | 2.94 | 3.10 ± 0.20 |
| 45/−45 | 2 | 1.02 | 9.45 | 5.24 | 4.80 | 72.0 | 3.26 | |
| 45/−45 | 3 | 1.10 | 9.52 | 5.23 | 4.71 | 82.9 | 2.88 | |
| 45/−45 | 4 | 1.05 | 9.26 | 5.10 | 4.99 | 59.8 | 3.26 | |
| 45/−45 | 5 | 1.10 | 9.64 | 5.14 | 5.08 | 83.6 | 3.31 | |
| 45/−45 | 6 | 1.12 | 9.55 | 5.06 | 4.54 | 80.6 | 2.93 | |
| 45/−45 | 1 | 2.14 | 9.71 | 5.02 | 5.28 | 81.5 | 3.29 | 3.44 ± 0.25 |
| 45/−45 | 2 | 2.05 | 9.56 | 5.10 | 5.20 | 75.3 | 3.65 | |
| 45/−45 | 3 | 2.02 | 9.54 | 5.12 | 5.40 | 73.3 | 3.11 | |
| 45/−45 | 4 | 2.40 | 9.51 | 5.13 | 5.50 | 63.3 | 3.79 | |
| 45/−45 | 5 | 2.20 | 9.50 | 5.12 | 4.52 | 77.0 | 3.30 | |
| 45/−45 | 6 | 2.07 | 9.57 | 5.06 | 5.21 | 73.3 | 3.46 |
| Raster Orientation | Test | Notch Radius, ρ | W | B | a0 | Pcrit | avg. ± sd. | |
|---|---|---|---|---|---|---|---|---|
| (mm) | (mm) | (mm) | (mm) | (N) | (MPa·m1/2) | (MPa·m1/2) | ||
| 30/−60 | 1 | 0 | 9.76 | 5.14 | 4.66 | 79.8 | 2.40 | 2.72 ± 0.22 |
| 30/−60 | 2 | 0 | 9.67 | 5.18 | 4.99 | 97.5 | 2.97 | |
| 30/−60 | 3 | 0 | 9.73 | 5.13 | 5.02 | 66.6 | 2.67 | |
| 30/−60 | 4 | 0 | 9.64 | 5.21 | 5.16 | 85.5 | 2.78 | |
| 30/−60 | 5 | 0 | 9.67 | 5.11 | 4.86 | 71.9 | 2.55 | |
| 30/−60 | 6 | 0 | 9.85 | 5.14 | 5.17 | 87.8 | 2.92 | |
| 30/−60 | 1 | 0.40 | 9.64 | 5.13 | 4.58 | 86.0 | 2.45 | 2.88 ± 0.25 |
| 30/−60 | 2 | 0.21 | 9.51 | 5.11 | 4.85 | 79.2 | 2.89 | |
| 30/−60 | 3 | 0.22 | 9.47 | 5.15 | 4.85 | 68.2 | 3.02 | |
| 30/−60 | 4 | 0.31 | 9.59 | 5.24 | 5.14 | 78.7 | 2.73 | |
| 30/−60 | 5 | 0.40 | 9.70 | 5.14 | 5.24 | 86.0 | 3.11 | |
| 30/−60 | 6 | 0.50 | 9.59 | 5.18 | 5.25 | 73.5 | 3.08 | |
| 30/−60 | 1 | 1.13 | 9.66 | 5.23 | 4.55 | 67.9 | 2.49 | 2.72 ± 0.22 |
| 30/−60 | 2 | 1.10 | 9.41 | 5.22 | 4.76 | 71.7 | 2.87 | |
| 30/−60 | 3 | 1.00 | 9.45 | 5.23 | 4.69 | 75.7 | 2.55 | |
| 30/−60 | 4 | 1.15 | 9.38 | 5.17 | 4.98 | 75.2 | 2.95 | |
| 30/−60 | 5 | 1.12 | 9.60 | 5.23 | 5.38 | 81.2 | 2.91 | |
| 30/−60 | 6 | 1.05 | 9.57 | 5.22 | 4.59 | 76.5 | 2.49 | |
| 30/−60 | 1 | 2.12 | 9.66 | 5.06 | 4.29 | 66.2 | 2.84 | 3.13 ± 0.61 |
| 30/−60 | 2 | 2.13 | 9.63 | 5.13 | 4.68 | 84.8 | 3.12 | |
| 30/−60 | 3 | 2.11 | 9.60 | 5.08 | 4.43 | 74.2 | 2.80 | |
| 30/−60 | 4 | 2.10 | 9.75 | 5.24 | 4.21 | 88.0 | 4.35 | |
| 30/−60 | 5 | 2.05 | 9.67 | 5.25 | 4.37 | 72.8 | 2.82 | |
| 30/−60 | 6 | 2.12 | 9.56 | 5.07 | 4.70 | 66.6 | 2.85 |
Disclaimer/Publisher’s Note: The statements, opinions and data contained in all publications are solely those of the individual author(s) and contributor(s) and not of MDPI and/or the editor(s). MDPI and/or the editor(s) disclaim responsibility for any injury to people or property resulting from any ideas, methods, instructions or products referred to in the content. |
© 2024 by the authors. Licensee MDPI, Basel, Switzerland. This article is an open access article distributed under the terms and conditions of the Creative Commons Attribution (CC BY) license (https://creativecommons.org/licenses/by/4.0/).
Share and Cite
Cicero, S.; Devito, F.; Sánchez, M.; Arrieta, S.; Arroyo, B. Notch Effect in Acrylonitrile Styrene Acrylate (ASA) Single-Edge-Notch Bending Specimens Manufactured by Fused Filament Fabrication. Materials 2024, 17, 5207. https://doi.org/10.3390/ma17215207
Cicero S, Devito F, Sánchez M, Arrieta S, Arroyo B. Notch Effect in Acrylonitrile Styrene Acrylate (ASA) Single-Edge-Notch Bending Specimens Manufactured by Fused Filament Fabrication. Materials. 2024; 17(21):5207. https://doi.org/10.3390/ma17215207
Chicago/Turabian StyleCicero, Sergio, Fabrizia Devito, Marcos Sánchez, Sergio Arrieta, and Borja Arroyo. 2024. "Notch Effect in Acrylonitrile Styrene Acrylate (ASA) Single-Edge-Notch Bending Specimens Manufactured by Fused Filament Fabrication" Materials 17, no. 21: 5207. https://doi.org/10.3390/ma17215207
APA StyleCicero, S., Devito, F., Sánchez, M., Arrieta, S., & Arroyo, B. (2024). Notch Effect in Acrylonitrile Styrene Acrylate (ASA) Single-Edge-Notch Bending Specimens Manufactured by Fused Filament Fabrication. Materials, 17(21), 5207. https://doi.org/10.3390/ma17215207