
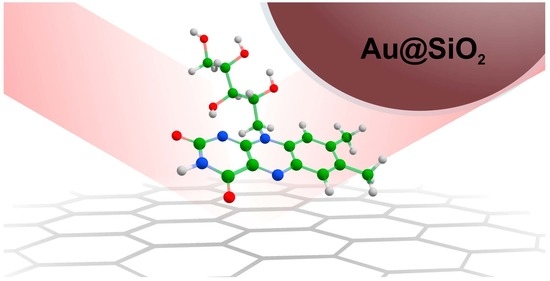
Shell-Isolated Nanoparticle-Enhanced Raman Spectroscopy for Probing Riboflavin on Graphene


 , and
, and 
Abstract
:
1. Introduction
2. Materials and Methods
2.1. Materials
2.2. Synthesis of Silicon Dioxide Covered Spherical Gold Nanoparticles
2.3. High-Resolution Transmission Electron Microscopy (HR-TEM)
2.4. Riboflavin Adsorption
2.5. Raman Measurements
2.6. Theoretical Modeling
3. Results and Discussion
3.1. GERS Spectra of Riboflavin on Graphene
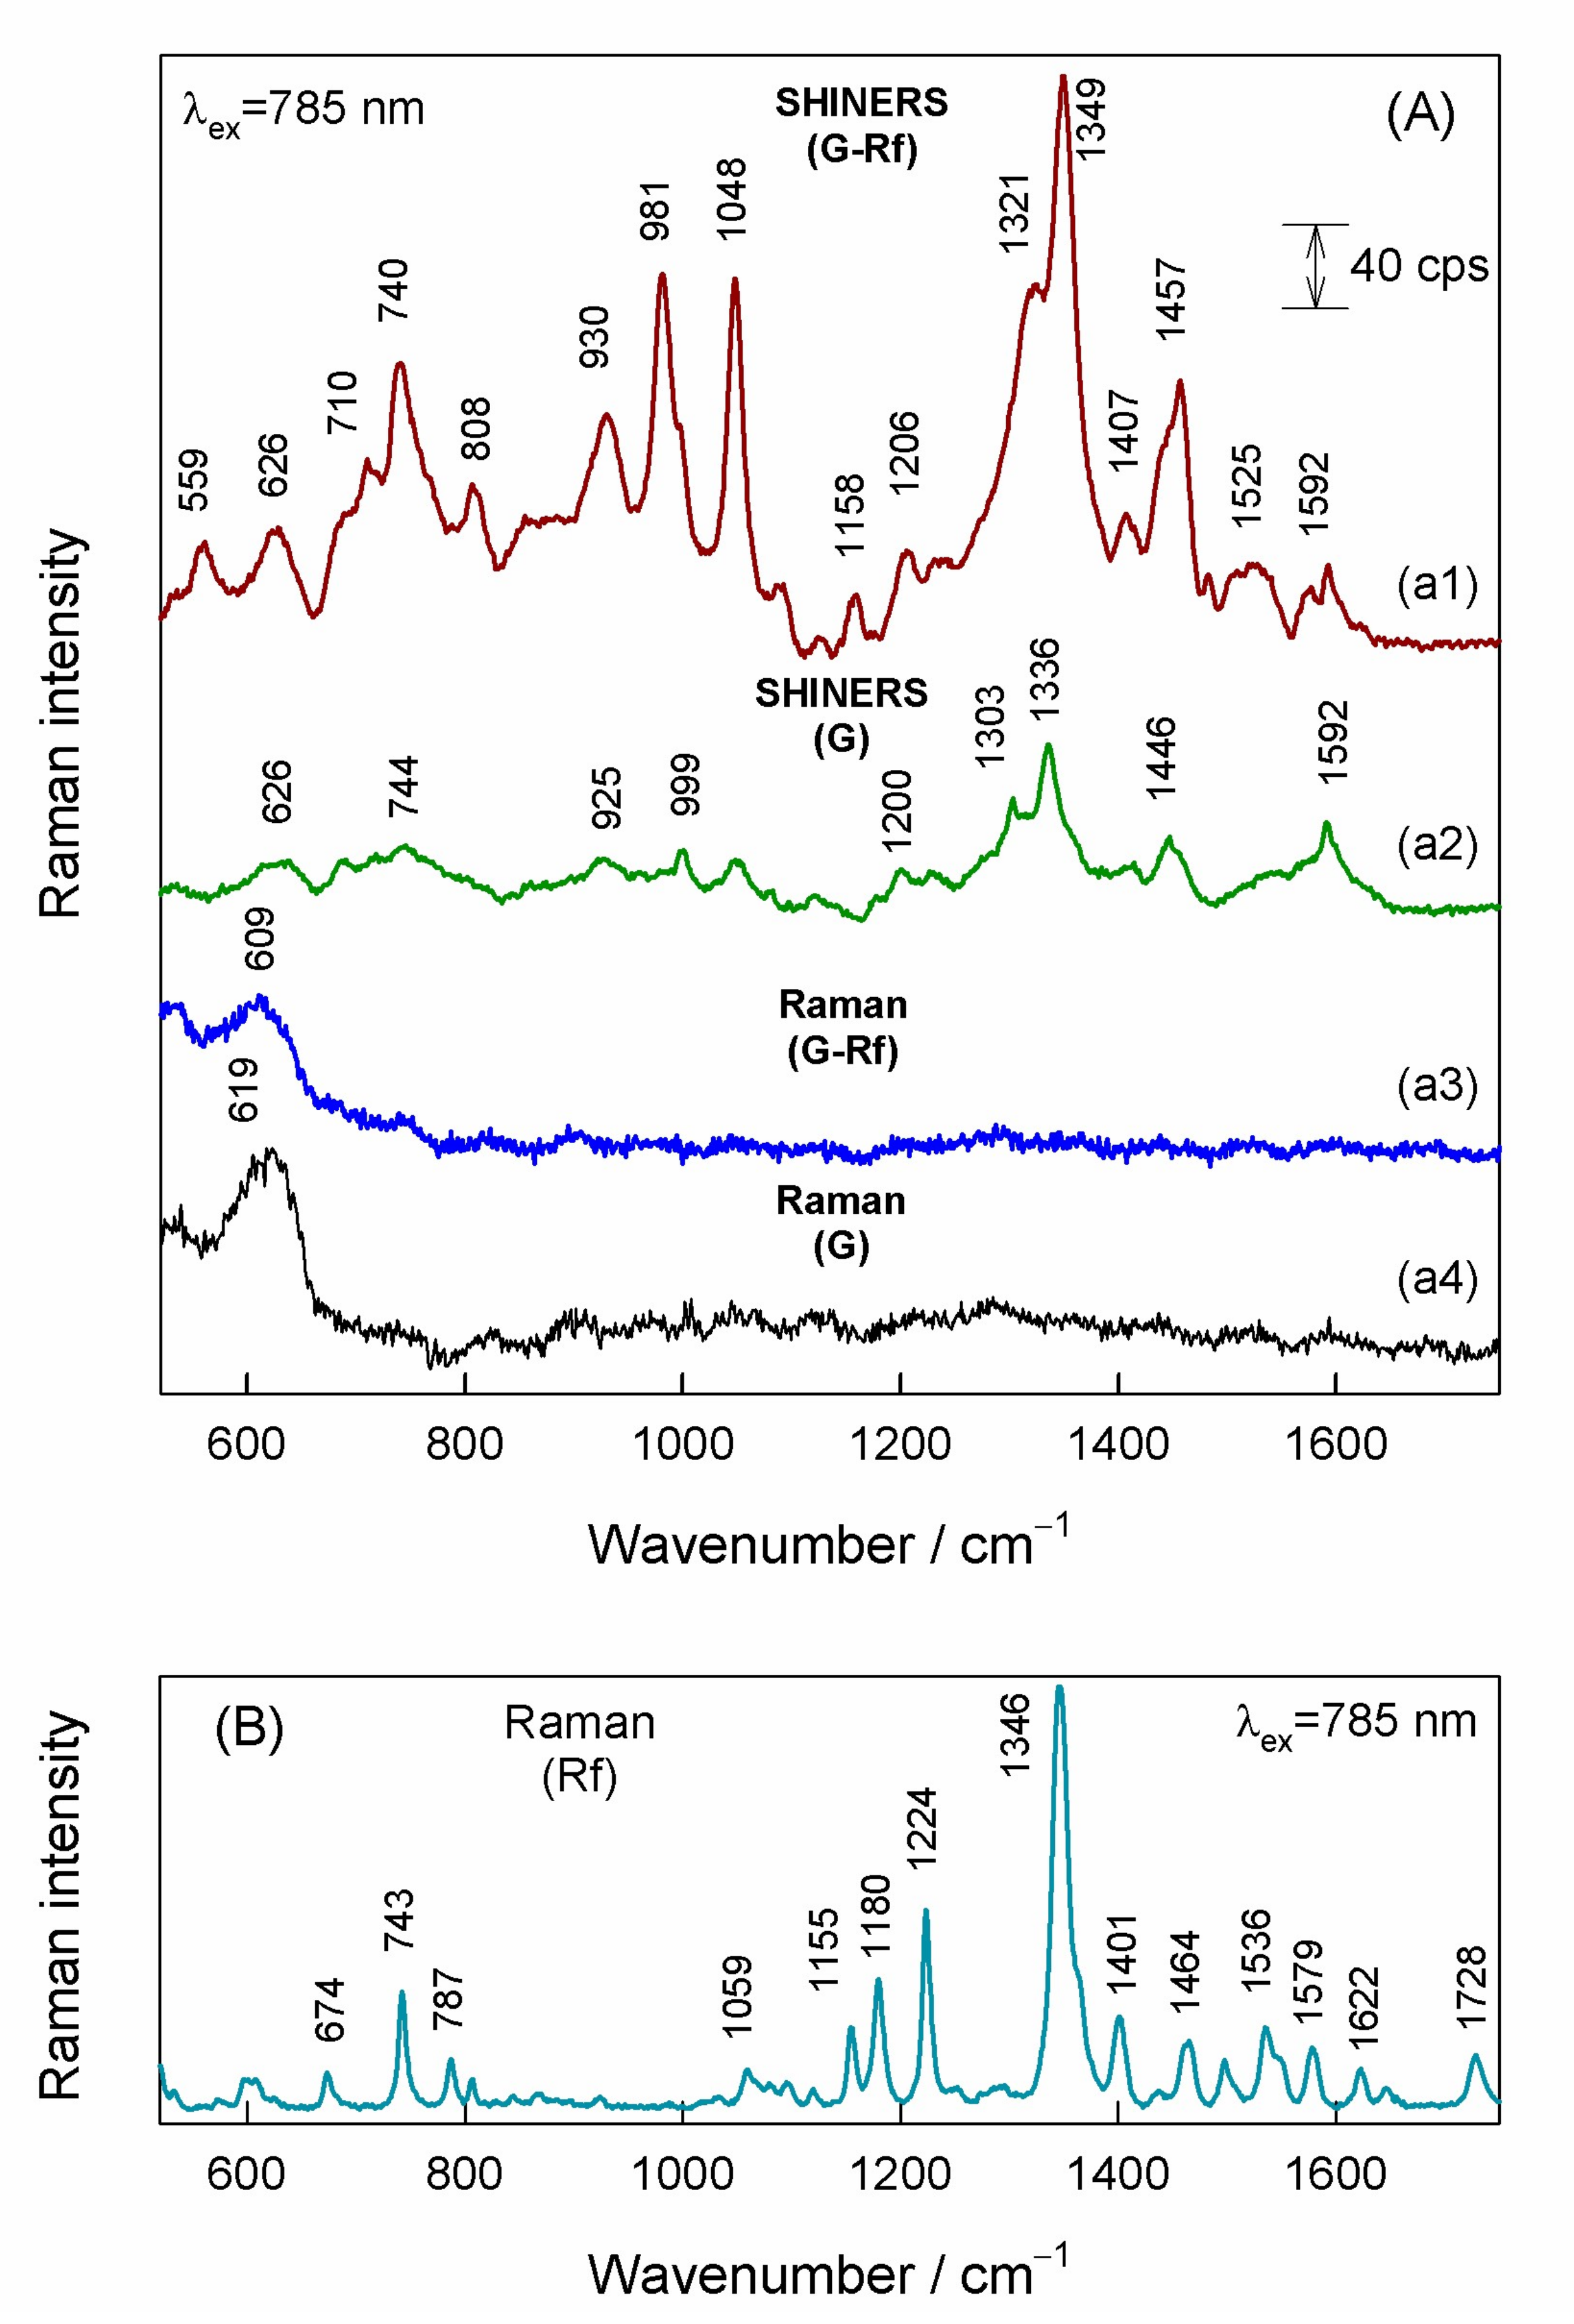
3.2. SHINERS Spectra of Riboflavin on Graphene
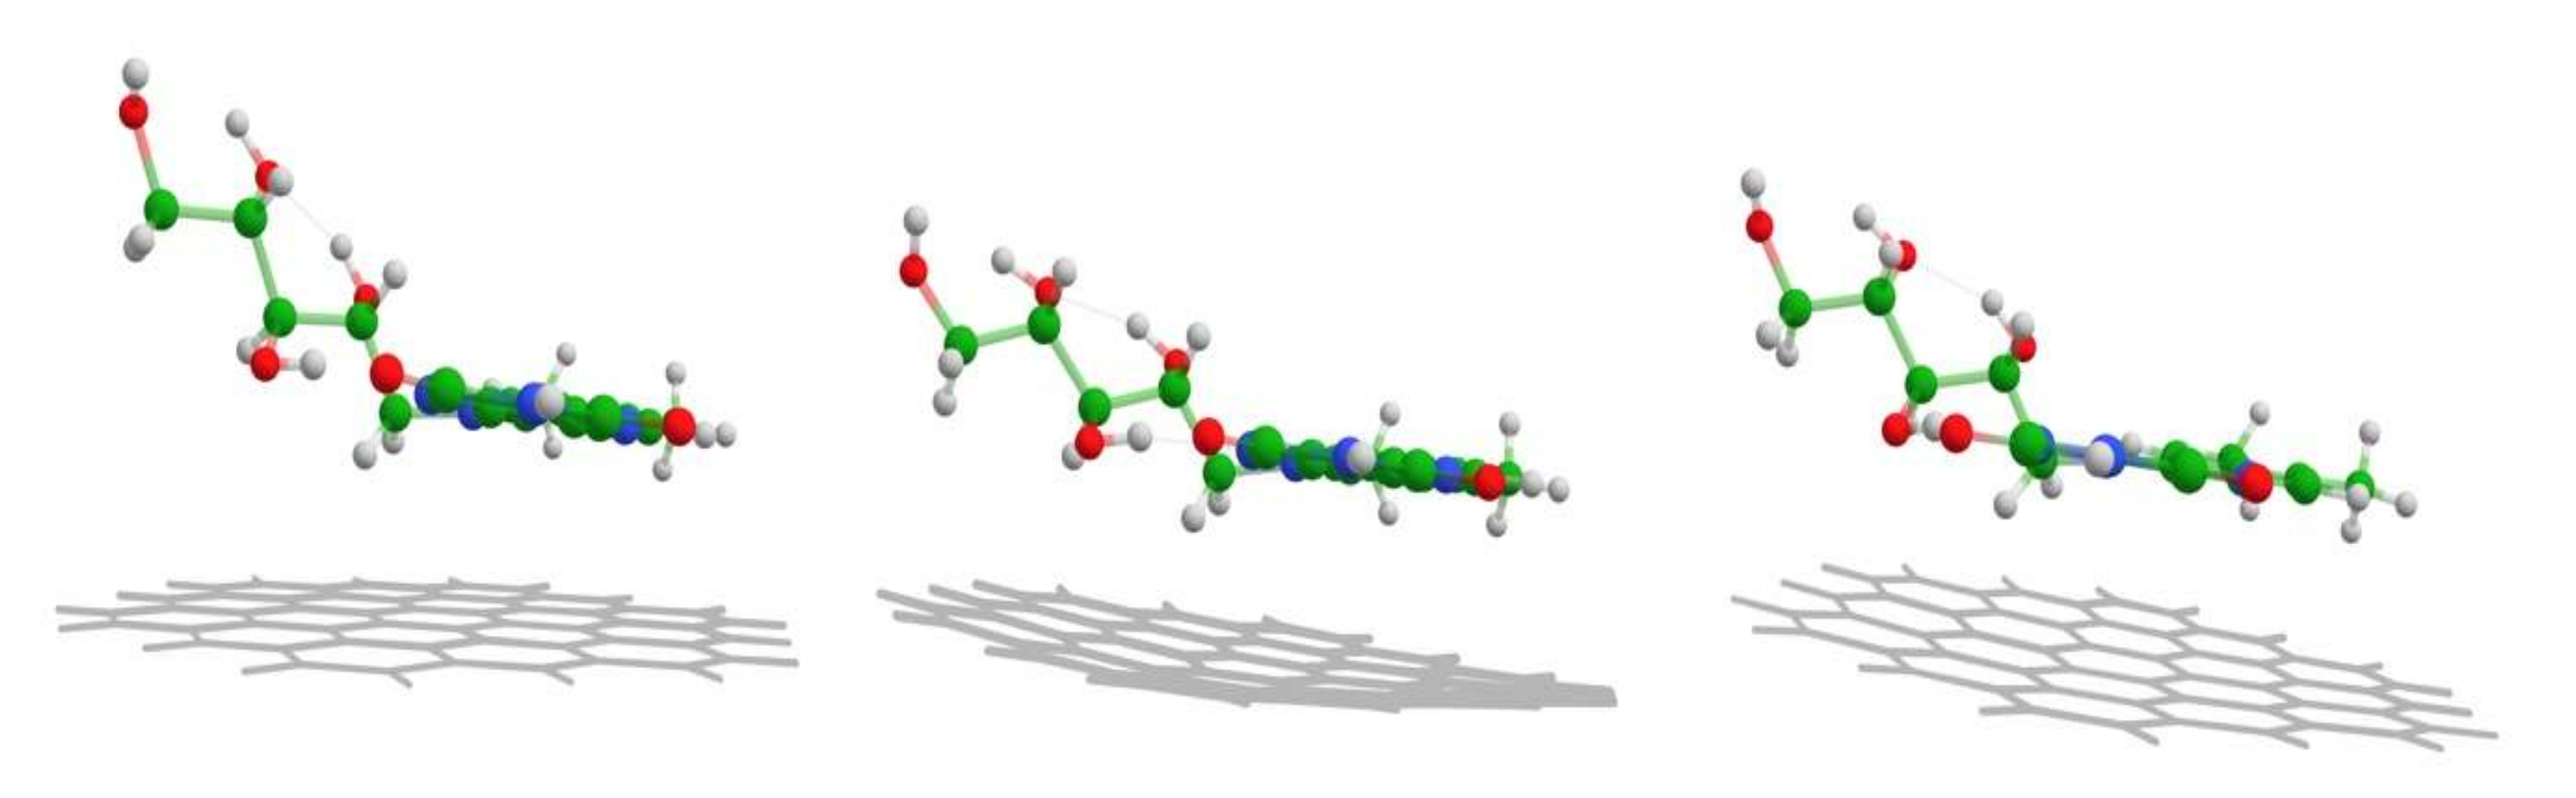
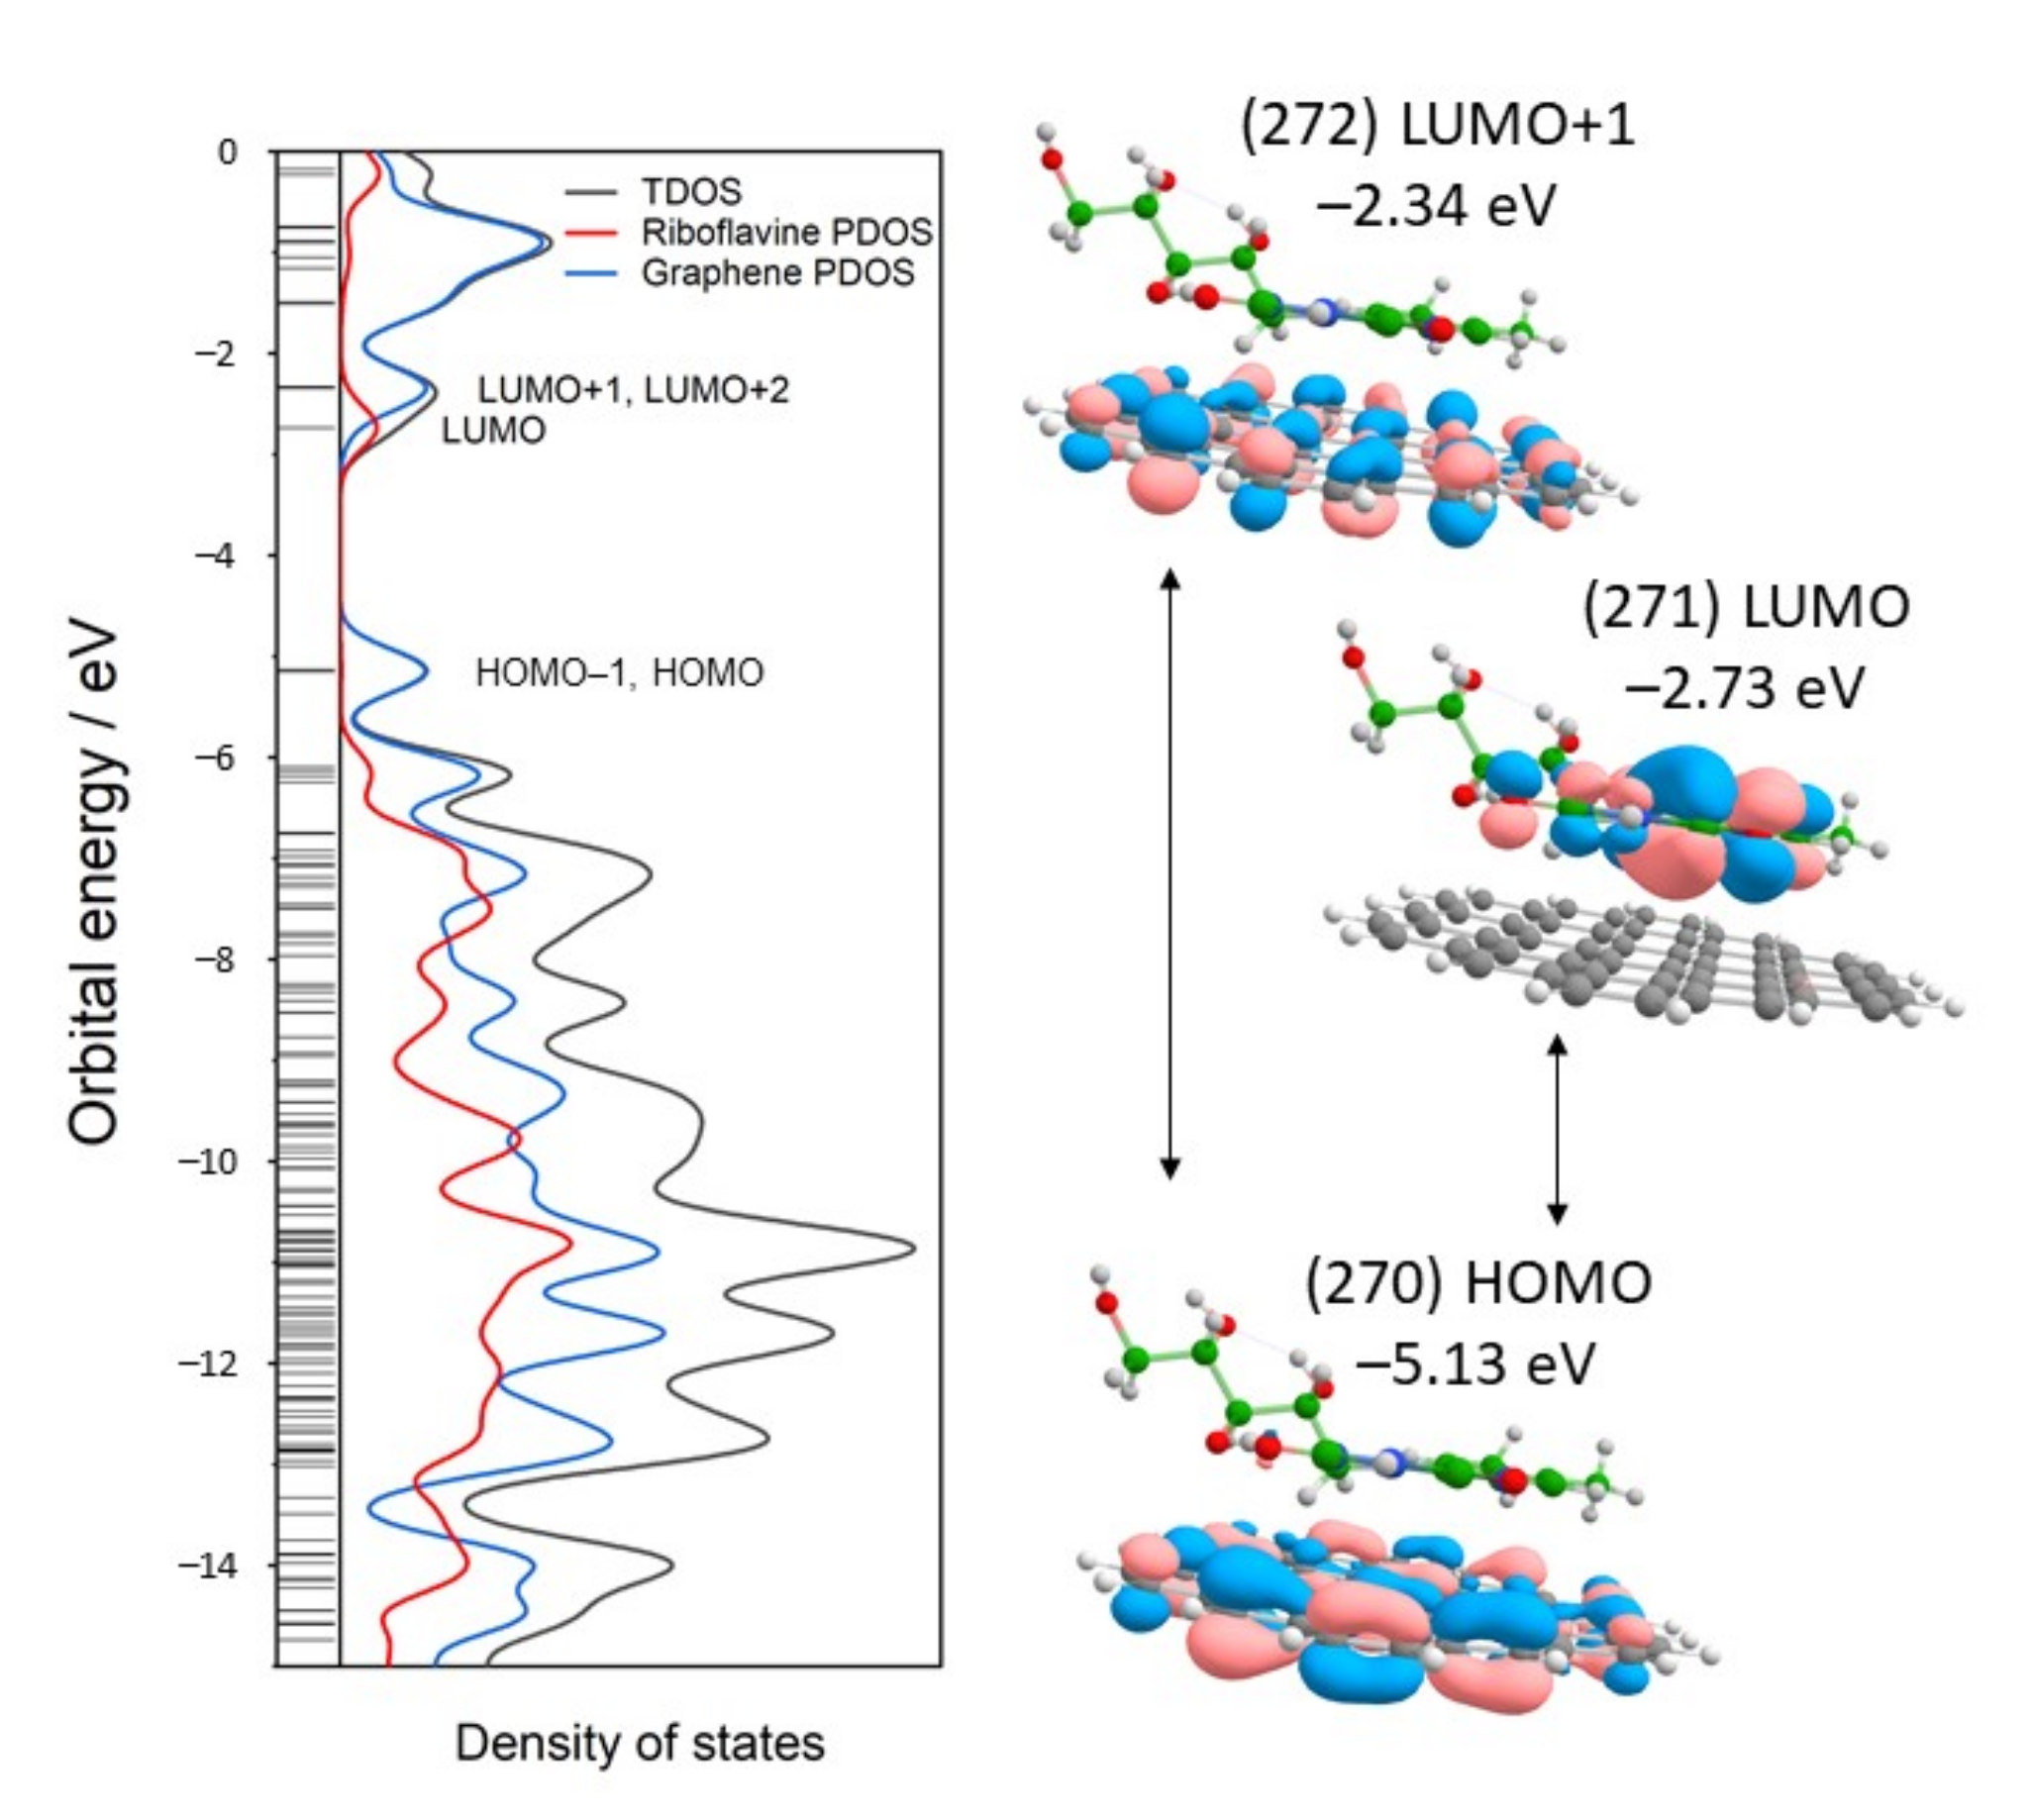
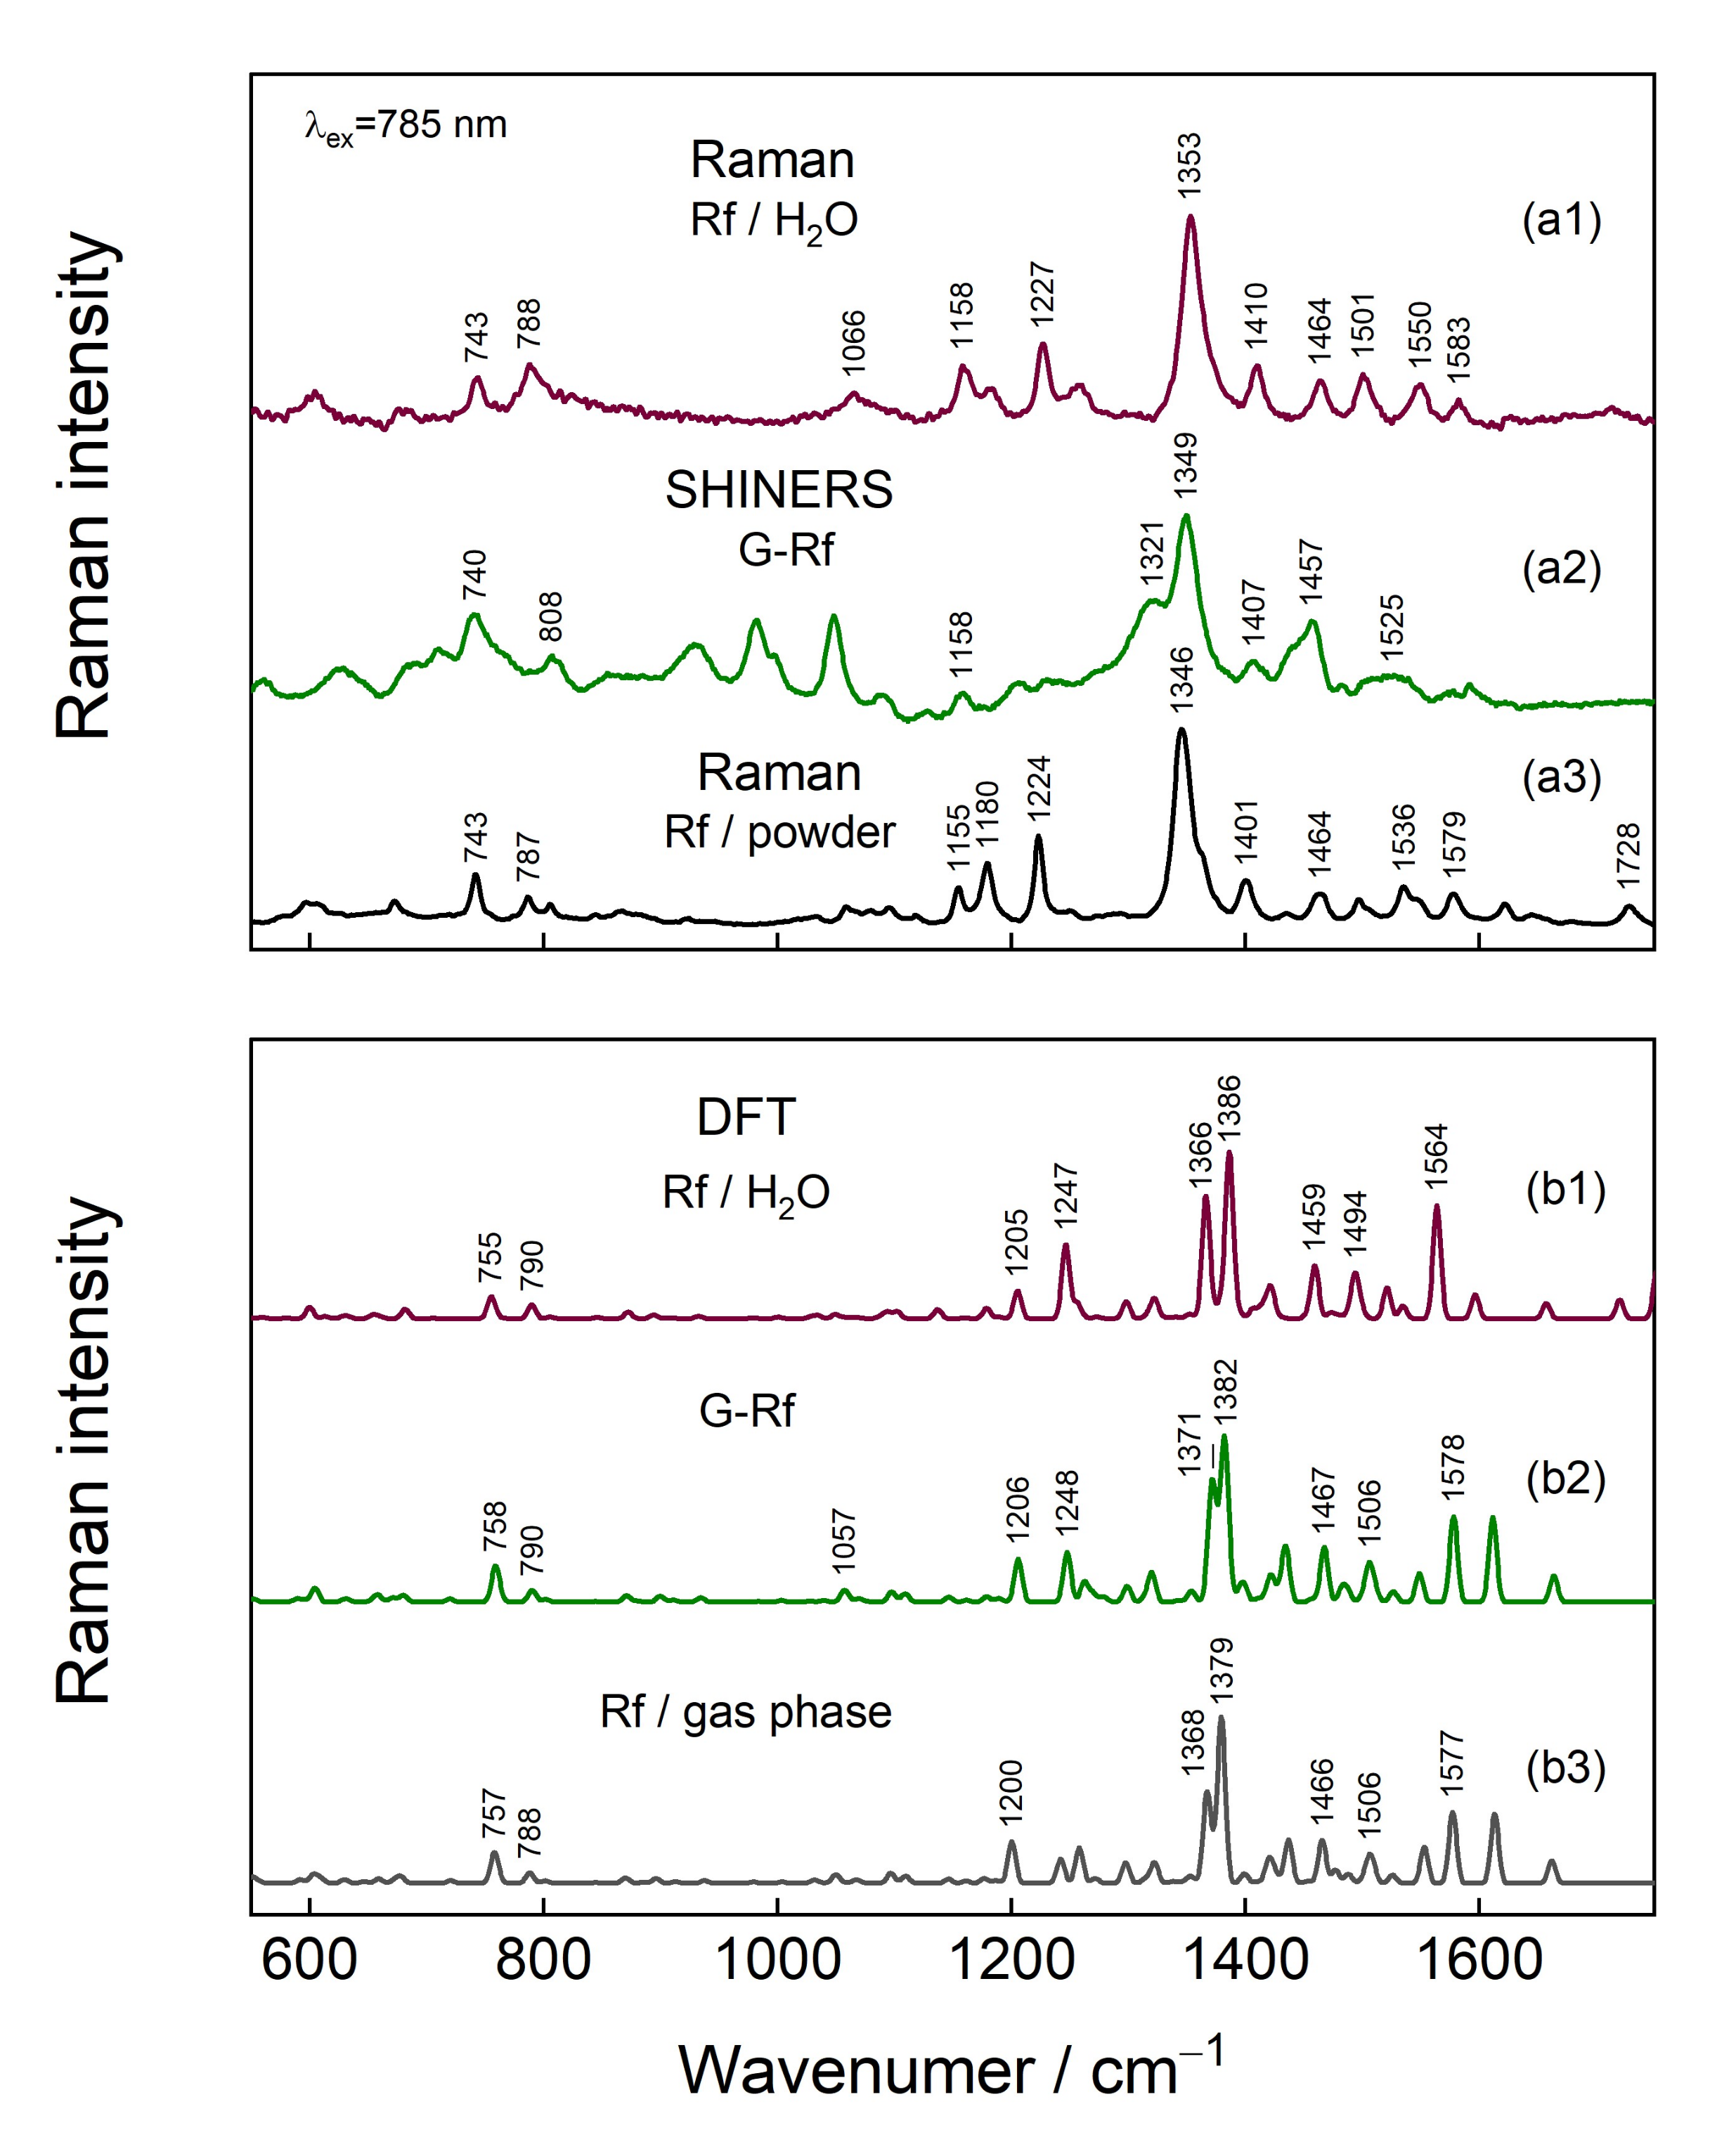
3.3. DFT Modelling Predicts Graphene-Riboflavin Interactions
3.4. Comparison of SHINERS and GERS
4. Conclusions
Author Contributions
Funding
Institutional Review Board Statement
Informed Consent Statement
Data Availability Statement
Conflicts of Interest
References
- Yang, G.; Li, L.; Lee, W.B.; Ng, M.C. Structure of graphene and its disorders: A review. Sci. technol. Adv. Mater. 2018, 19, 613–648. [Google Scholar] [CrossRef] [PubMed] [Green Version]
- Branhart, F.; Kotakoski, J.; Krasheninnikov, A.V. Structural defects in graphene. ACS Nano 2011, 5, 26–41. [Google Scholar] [CrossRef] [PubMed] [Green Version]
- Lv, R.; Terrones, M. Towards new graphene materials: Doped graphene sheets and nanoribbons. Mater. Lett. 2012, 78, 209–218. [Google Scholar] [CrossRef]
- Lee, H.; Paeng, K.; Kim, I.S. A review of doping modulation in graphene. Synth. Met. 2018, 244, 36–47. [Google Scholar] [CrossRef]
- Guo, Z.; Ni, S.; Wu, H.; Wen, J.; Li, X.; Tang, T.; Li, M.; Liu, M. Designing nitrogen and phosphorus co-doped graphene quantum dots/g-C3N4 heterojunction composites to enhance visible and ultraviolet photocatalytic activity. Appl. Surf. Sci. 2021, 548, 149211. [Google Scholar] [CrossRef]
- Sun, L.; Luo, Y.; Li, M.; Hu, G.; Xu, Y.; Tang, T.; Wen, J.; Li, X.; Wang, L. Role of pyridinic-N for nitrogen doped graphene quantum dots in oxygen reaction reduction. J. Colloid Interf. Sci. 2017, 508, 154–158. [Google Scholar] [CrossRef]
- Kong, L.; Enders, A.; Rahman, T.S.; Dowben, P.A. Molecular adsorption on graphene. J. Phys. Condens. Matter. 2014, 26, 443001. [Google Scholar] [CrossRef]
- Phillipson, R.; De la Rosa, C.J.L.; Teyssandier, J.; Walke, P.; Waghray, D.; Fujita, Y.; Adisoejoso, J.; Mali, K.S.; Asselberghs, I.; Huyghebaert, C.; et al. Tunable doping of graphene by using physisorbed self-assembled networks. Nanoscale 2016, 8, 20017–20026. [Google Scholar] [CrossRef] [Green Version]
- Zhao, G.; Li, X.; Huang, M.; Zhen, Z.; Zhong, Y.; Chen, Q.; Zhao, X.; He, Y.; Hu, R.; Yang, T.; et al. The physics and chemistry of graphene-on-surfaces. Chem. Soc. Rev. 2017, 46, 4417–4449. [Google Scholar] [CrossRef]
- Dong, X.; Fu, D.; Fang, W.; Shi, Y.; Chen, P.; Li, L.J. Doping single layer graphene with aromatic molecules. Small 2009, 5, 1422–1426. [Google Scholar] [CrossRef]
- Yoo, E.L.; Kim, J.; Hosono, E.; Zhou, H.S.; Kudo, T.; Honma, I. Large reversible Li storage of graphene nanosheet families for use in rechargeable lithium ion batteries. Nano Lett. 2008, 8, 2277–2282. [Google Scholar] [CrossRef] [PubMed]
- Malard, L.M.; Pimenta, M.A.; Dresselhaus, G.; Dresselhaus, M.S. Raman spectroscopy in graphene. Phys. Rep. 2009, 473, 51–87. [Google Scholar] [CrossRef]
- Lai, H.S.; Xu, F.G.; Zhang, Y.; Wang, L. Recent progress on graphene-based substrates for surface-enhanced Raman scattering applications. J. Mater. Chem. B 2018, 6, 4008–4028. [Google Scholar] [CrossRef] [PubMed]
- Zólyomi, V.; Koltai, J.; Kürti, J. Resonance Raman spectroscopy of graphite and graphene. Phys. Status Solidi B 2011, 248, 2435–2444. [Google Scholar] [CrossRef]
- Brill, A.R.; Biswas, S.; Toroker, M.C.; De Ruiter, G.; Koren, E. Dipole-induced Raman enhancement using noncovalent azobenzene-functionalized self-assembled monolayers on graphene terraces. ACS Appl. Mater. Interfaces 2021, 13, 10271–10278. [Google Scholar] [CrossRef]
- Huang, S.; Ling, X.X.; Liang, L.; Song, Y.; Fang, W.; Zhang, J.; Kong, J.; Meunier, V.; Dresselhaus, M.S. Molecular selectivity of graphene-enhanced Raman scattering. Nano Lett. 2015, 15, 2892–2901. [Google Scholar] [CrossRef]
- Ling, X.; Huang, S.; Deng, S.; Mao, N.; Kong, J.; Dresselhaus, M.S.; Zhang, J. Lighting up the Raman signal of molecules in the vicinity of graphene related materials. Acc. Chem. Res. 2015, 48, 1862–1870. [Google Scholar] [CrossRef]
- De la O-Cuevas, E.; Alvarez-Venicio, V.; Badillo-Raminez, I.; Islas, S.R.; De Pilar Carreón-Castro, M.; Saniger, J.M. Graphene substrates as modifiers of the emission and vibrational responses of interacting molecules: The case of BODIPY dyes. Spectrochim. Acta A 2021, 246, 119020. [Google Scholar] [CrossRef]
- Silver, A.; Kitadai, H.; Liu, H.; Granzier-Nakajima, T.; Terrones, M.; Ling, X.; Huang, S. Chemical and bio sensing using graphene-enhanced Raman spectroscopy. Nanomaterials 2019, 9, 516. [Google Scholar] [CrossRef] [Green Version]
- Shi, H.T.; Zhao, B.F.; Ma, J.; Bronson, M.J.; Cai, Z.; Chen, J.H.; Wang, Y.; Cronin, M.; Jensen, L.; Cronin, S.B. Measuring local electric fields and local charge densities at electrode surfaces using graphene-enhanced Raman spectroscopy (GERS)–based Stark-shifts. ACS Appl. Mater. Interf. 2019, 11, 36252–36258. [Google Scholar] [CrossRef]
- Zhang, N.; Tong, L.; Zhang, J. Graphene-based enhanced Raman scattering toward analytical applications. Chem. Mater. 2016, 28, 6426–6435. [Google Scholar] [CrossRef]
- Li, J.F.; Huang, Y.F.; Ding, Y.; Yang, Z.L.; Li, S.B.; Zhou, X.S.; Fan, F.R.; Zhang, W.; Zhou, Z.Y.; Wu, D.Y.; et al. Shell-isolated nanoparticle-enhanced Raman spectroscopy. Nature 2010, 464, 392–395. [Google Scholar] [CrossRef]
- Anema, J.R.; Li, J.F.; Yang, Z.L.; Ren, B.; Tian, Z.Q. Shell-isolated nanoparticle-enhanced Raman spectroscopy: Extending the versatility of surface-enhanced Raman scattering. Annu. Rev. Anal. Chem. 2011, 4, 129–150. [Google Scholar] [CrossRef] [PubMed]
- Li, J.F.; Tian, X.D.; Li, S.B.; Anema, J.R.; Yang, Z.L.; Ding, Y.; Wu, Y.F.; Zeng, Y.M.; Chen, Q.Z.; Ren, B.; et al. Surface analysis using shell-isolated nanoparticle-enhanced Raman spectroscopy. Nat. Protoc. 2013, 8, 52–65. [Google Scholar] [CrossRef] [PubMed]
- Barbillon, G. Applications of shell-isolated nanoparticle-enhanced Raman spectroscopy. Photonics 2021, 8, 46. [Google Scholar] [CrossRef]
- Krajczewski, J.; Kudelski, A. Shell-isolated Nanoparticle-enhanced Raman spectroscopy. Front. Chem. 2019, 7, 410. [Google Scholar] [CrossRef]
- Li, J.F.; Zhang, Y.J.; Ding, S.Y.; Panneerselvam, R.; Tian, Z.Q. Core-shell nanoparticle-enhanced Raman spectroscopy. Chem. Rev. 2017, 117, 5002–5069. [Google Scholar] [CrossRef]
- Keeler, A.J.; Salazar-Banda, G.R.; Russell, A.E. Mechanistic insights into electrocatalytic reactions provided by SERS. Curr. Opinion Electrochem. 2019, 17, 90–96. [Google Scholar] [CrossRef]
- Zdaniauskienė, A.; Charkova, T.; Ignatjev, I.; Melvydas, V.; Garjonytė, R.; Matulaitienė, I.; Talaikis, M.; Niaura, G. Shell-isolated nanoparticle-enhanced Raman spectroscopy for characterization of living yeast cells. Spectrochim. Acta A 2020, 240, 118560. [Google Scholar] [CrossRef]
- Zdaniauskienė, A.; Charkova, T.; Matulaitienė, I.; Eicher-Lorka, O.; Matijoška, A.; Skapas, M.; Selskis, A.; Niaura, G. Electrochemical shell-isolated nanoparticle-enhanced Raman spectroscopy: Bonding, structure, and ion-pairing of the positive charge bearing [pyridinium ring terminated monolayer at smooth gold electrode. J. Phys. Chem. C 2018, 122, 1234–1242. [Google Scholar] [CrossRef]
- El-Said, W.A.; Alshitari, W.; Choi, J.-W. Controlled fabrication of gold nanopyramids/polypyrrole for shell-isolated nanoparticle-enhanced Raman spectroscopy to detect γ-aminobutyric acid. Spectrochim. Acta A 2020, 229, 117890. [Google Scholar] [CrossRef] [PubMed]
- Puglieri, T.S.; Madden, O.; Andrade, G.F.S. SHINERS in cultural heritage: Can SHINERS spectra always be comparable with normal Raman spectra? Study of alizarin and its adsorption in the silicon dioxide shell. J. Raman Spectrosc. 2021, 52, 1406–1417. [Google Scholar] [CrossRef]
- Boccorh, D.K.; Macdonald, P.A.; Boyle, C.W.; Wain, A.J.; Berlouis, L.E.A.; Wark, A.W. A universal polymer shell-isolated nanoparticle (SHIN) design for single particle spectroelectrochemical SERS sensing using different core shapes. Nanoscale Adv. 2021, 3, 6415–6426. [Google Scholar] [CrossRef]
- Niciński, K.; Krajczewski, J.; Kudelski, A.; Witkowska, E.; Trzcińska-Danielewicz, J.; Girstun, A.; Kamińska, A. Detection of circulating tumor cells in blood by shell-isolated nanoparticle-enhanced Raman spectroscopy (SHINERS) in microfluidic device. Sci. Rep. 2019, 9, 9267. [Google Scholar] [CrossRef] [Green Version]
- Zhang, H.; Yao, J.L.; Li, J.F. Plasmonic core-shell nanomaterials and their applications in spectroscopies. Adv. Mater. 2021, 33, 2005900. [Google Scholar] [CrossRef]
- Cioates, C.N. Review–Electrochemical sensors used in the determination of riboflavin. J. Electrochem. Soc. 2020, 167, 037558. [Google Scholar] [CrossRef]
- Thakur, K.; Tomar, S.K.; Singh, A.K.; Mandal, S.; Arora, S. Riboflavin and health: A review of recent human research. Crit. Rev. Food Sci. Nutrition 2017, 57, 3650–3660. [Google Scholar] [CrossRef]
- Radzevič, A.; Niaura, G.; Ignatjev, I.; Rakickas, T.; Celiešiūtė, R.; Pauliukaite, R. Electropolymerisation of the natural monomer riboflavin and its characterization. Electrochim. Acta 2016, 222, 1818–1830. [Google Scholar] [CrossRef]
- Neese, F. The ORCA program system. Wiley Interdiscip. Rev. Comput. Mol. Sci. 2012, 2, 73–78. [Google Scholar] [CrossRef]
- Boys, S.F.; Bernardi, F. The calculation of small molecular interactions by the differences of separate total energies. Some procedures with reduced errors. Mol. Phys. 1970, 19, 553–566. [Google Scholar] [CrossRef]
- Talaikis, M.; Eicher-Lorka, O.; Valincius, G.; Niaura, G. Water-induced structural changes in the membrane-anchoring monolayers revealed by isotope-edited SERS. J. Phys. Chem. C 2016, 120, 22489–22499. [Google Scholar] [CrossRef]
- Liu, Z.; Lu, T.; Chen, Q. An sp-hybridized all-carboatomic ring, cyclo[18]carbon: Electronic structure, electronic spectrum, and optical nonlinearity. Carbon 2020, 165, 461–467. [Google Scholar] [CrossRef]
- Lu, T.; Chen, F. Multiwfn: A multifunctional wavefunction analyzer. J. Comput. Chem. 2012, 33, 580–592. [Google Scholar] [CrossRef] [PubMed]
- Chemcraft–Graphical Software for Visualization of Quantum Chemistry Calculations. Available online: https//www.chemcraftprog.com (accessed on 25 January 2022).
- Trusovas, R.; Račiukaitis, G.; Niaura, G.; Barkauskas, J.; Valušis, G.; Pauliukaite, R. Recent advances in laser utilization in the chemical modification of graphene oxide and its applications. Adv. Optical Mater. 2016, 4, 37–65. [Google Scholar] [CrossRef]
- Trusovas, R.; Ratautas, K.; Račiukaitis, G.; Niaura, G. Graphene layer formation in pinewood by nanosecond and picosecond laser irradiation. Appl. Surf. Sci. 2019, 471, 154–161. [Google Scholar] [CrossRef]
- Niaura, G. Surface-enhanced Raman spectroscopic observation of two kinds of adsorbed OH− ions at copper electrode. Electrochim. Acta 2000, 45, 3507–3519. [Google Scholar] [CrossRef]
- Liu, F.; Gu, H.; Lin, Y.; Qi, Y.; Dong, X.; Gao, J.; Cai, T. Surface-enhanced Raman scattering study of riboflavin on borohydride-reduced silver colloids: Dependence on concentration, halide anions and pH values. Spectrochim. Acta A 2012, 85, 111–119. [Google Scholar] [CrossRef]
- Bowman, W.D.; Spiro, T.G. Normal mode analysis of lumiflavin and interpretation of resonance Raman spectra of flavoproteins. Biochemistry 1981, 20, 3313–3318. [Google Scholar] [CrossRef]
- Lively, C.R.; McFarland, J.T. Assignment and the effect of hydrogen bonding on the vibrational normal modes of flavins and flavoproteins. J. Phys. Chem. 1990, 94, 3980–3994. [Google Scholar] [CrossRef]
- Ghahghaey, Z.; Hekmati, M.; Darvish Ganji, M. Theoretical investigation of phenol adsorption on functionalized graphene using DFT calculations for effective removal of organic contaminants from wastewater. J. Mol. Liq. 2021, 324, 114777. [Google Scholar] [CrossRef]
- Cortés-Arriagada, D. Intermolecular driving forces on the adsorption of DNA/RNA nucleobases to graphene and phosphorene: An atomistic perspective from DFT calculations. J. Mol. Liq. 2021, 325, 115229. [Google Scholar] [CrossRef]
- Hirshfeld, F.L. Bonded-atom fragments for describing molecular charge densities. Theor. Chim. Acta. 1977, 44, 129–138. [Google Scholar] [CrossRef]
- Fesenko, O.; Dovbeshko, G.; Dementjev, A.; Karpicz, R.; Kaplas, T.; Svirko, Y. Graphene-enhanced Raman spectroscopy of thymine adsorbed on single-layer graphene. Nanoscale Res. Let. 2015, 10, 1–7. [Google Scholar] [CrossRef] [PubMed]
- Dolgov, L.; Pidhirnyi, D.; Dovbeshko, G.; Lebedieva, T.; Kiisk, V.; Heinsalu, S.; Lange, S.; Jaaniso, R.; Sildos, I. Graphene-enhanced Raman scattering from the adenine molecules. Nanoscale Res. Lett. 2016, 11, 1–5. [Google Scholar] [CrossRef] [Green Version]
- Rad, A.S.; Shabestari, S.S.; Mohseni, S.; Aghouzi, S.A. Study on the adsorption properties of O3, SO2, and SO3 on B-doped graphene using DFT calculations. J. Solid State Chem. 2016, 237, 204–210. [Google Scholar] [CrossRef]
- Bredas, J.L. Mind the Gap! Mater. Horizons 2014, 1, 17–19. [Google Scholar] [CrossRef]
- Yun, M.J.; Cheong, B.S.; Cho, H.G. Surface-enhanced Raman spectroscopy and density functional theory studies of riboflavin, lumiflavin, and lumichrome adsorbed on silver colloids. Bull. Korean Chem. Soc. 2019, 40, 1183–1190. [Google Scholar] [CrossRef]
- Profit, A.A.; Felsen, V.; Chinwong, J.; Mojica, E.R.E.; Desamero, R.Z.B. Evidence of π-stacking interactions in the self-assembly of HIAPP22-29. Proteins Struct. Funct. Bioinform. 2013, 81, 690–703. [Google Scholar] [CrossRef] [Green Version]


| Parameters | 6-311G(d,p) | def2-TZVP |
|---|---|---|
| d, Å | 3.36 | 3.35 |
| Ead, kcal/mol | −22.39 | −33.35 |
| Hirshfeld charge, e | 0.12 (G) 1 | 0.11 (G) 1 |
| −0.12 (Rf) 1 | −0.11 (Rf) 1 | |
| Efund, eV | 2.39 (G-Rf) 1 | 2.31 (G-Rf) 1 |
| 2.77 (Rf) 2 | 3.43 (Rf) 2 |
| G-Rf Complex | Rf (Optimized in a Gas Phase) | ||||
|---|---|---|---|---|---|
| λ, nm (Orbitals) | E, eV | f | λ, nm (Orbitals) | E, eV | f |
| 651 (270 b↔271 a) 1 | 1.904 | 0.0015 | 608 (99↔100) 1 | 2.037 | 0.0003 |
| 639 (269 b↔271 a) | 1.940 | 0.0022 | 457 (98↔100) | 2.707 | 0.1900 |
| 433 (268 a,b↔271 a) | 2.860 | 0.0007 | 402 (97↔100) | 3.078 | 0.0495 |
| 428 (267 b↔271 a) | 2.893 | 0.0143 | 394 ((93,94)↔100) | 3.145 | 0.0043 |
| Peak Position (cm−1) | Raman Spectroscopy Method | Assignment 1 |
|---|---|---|
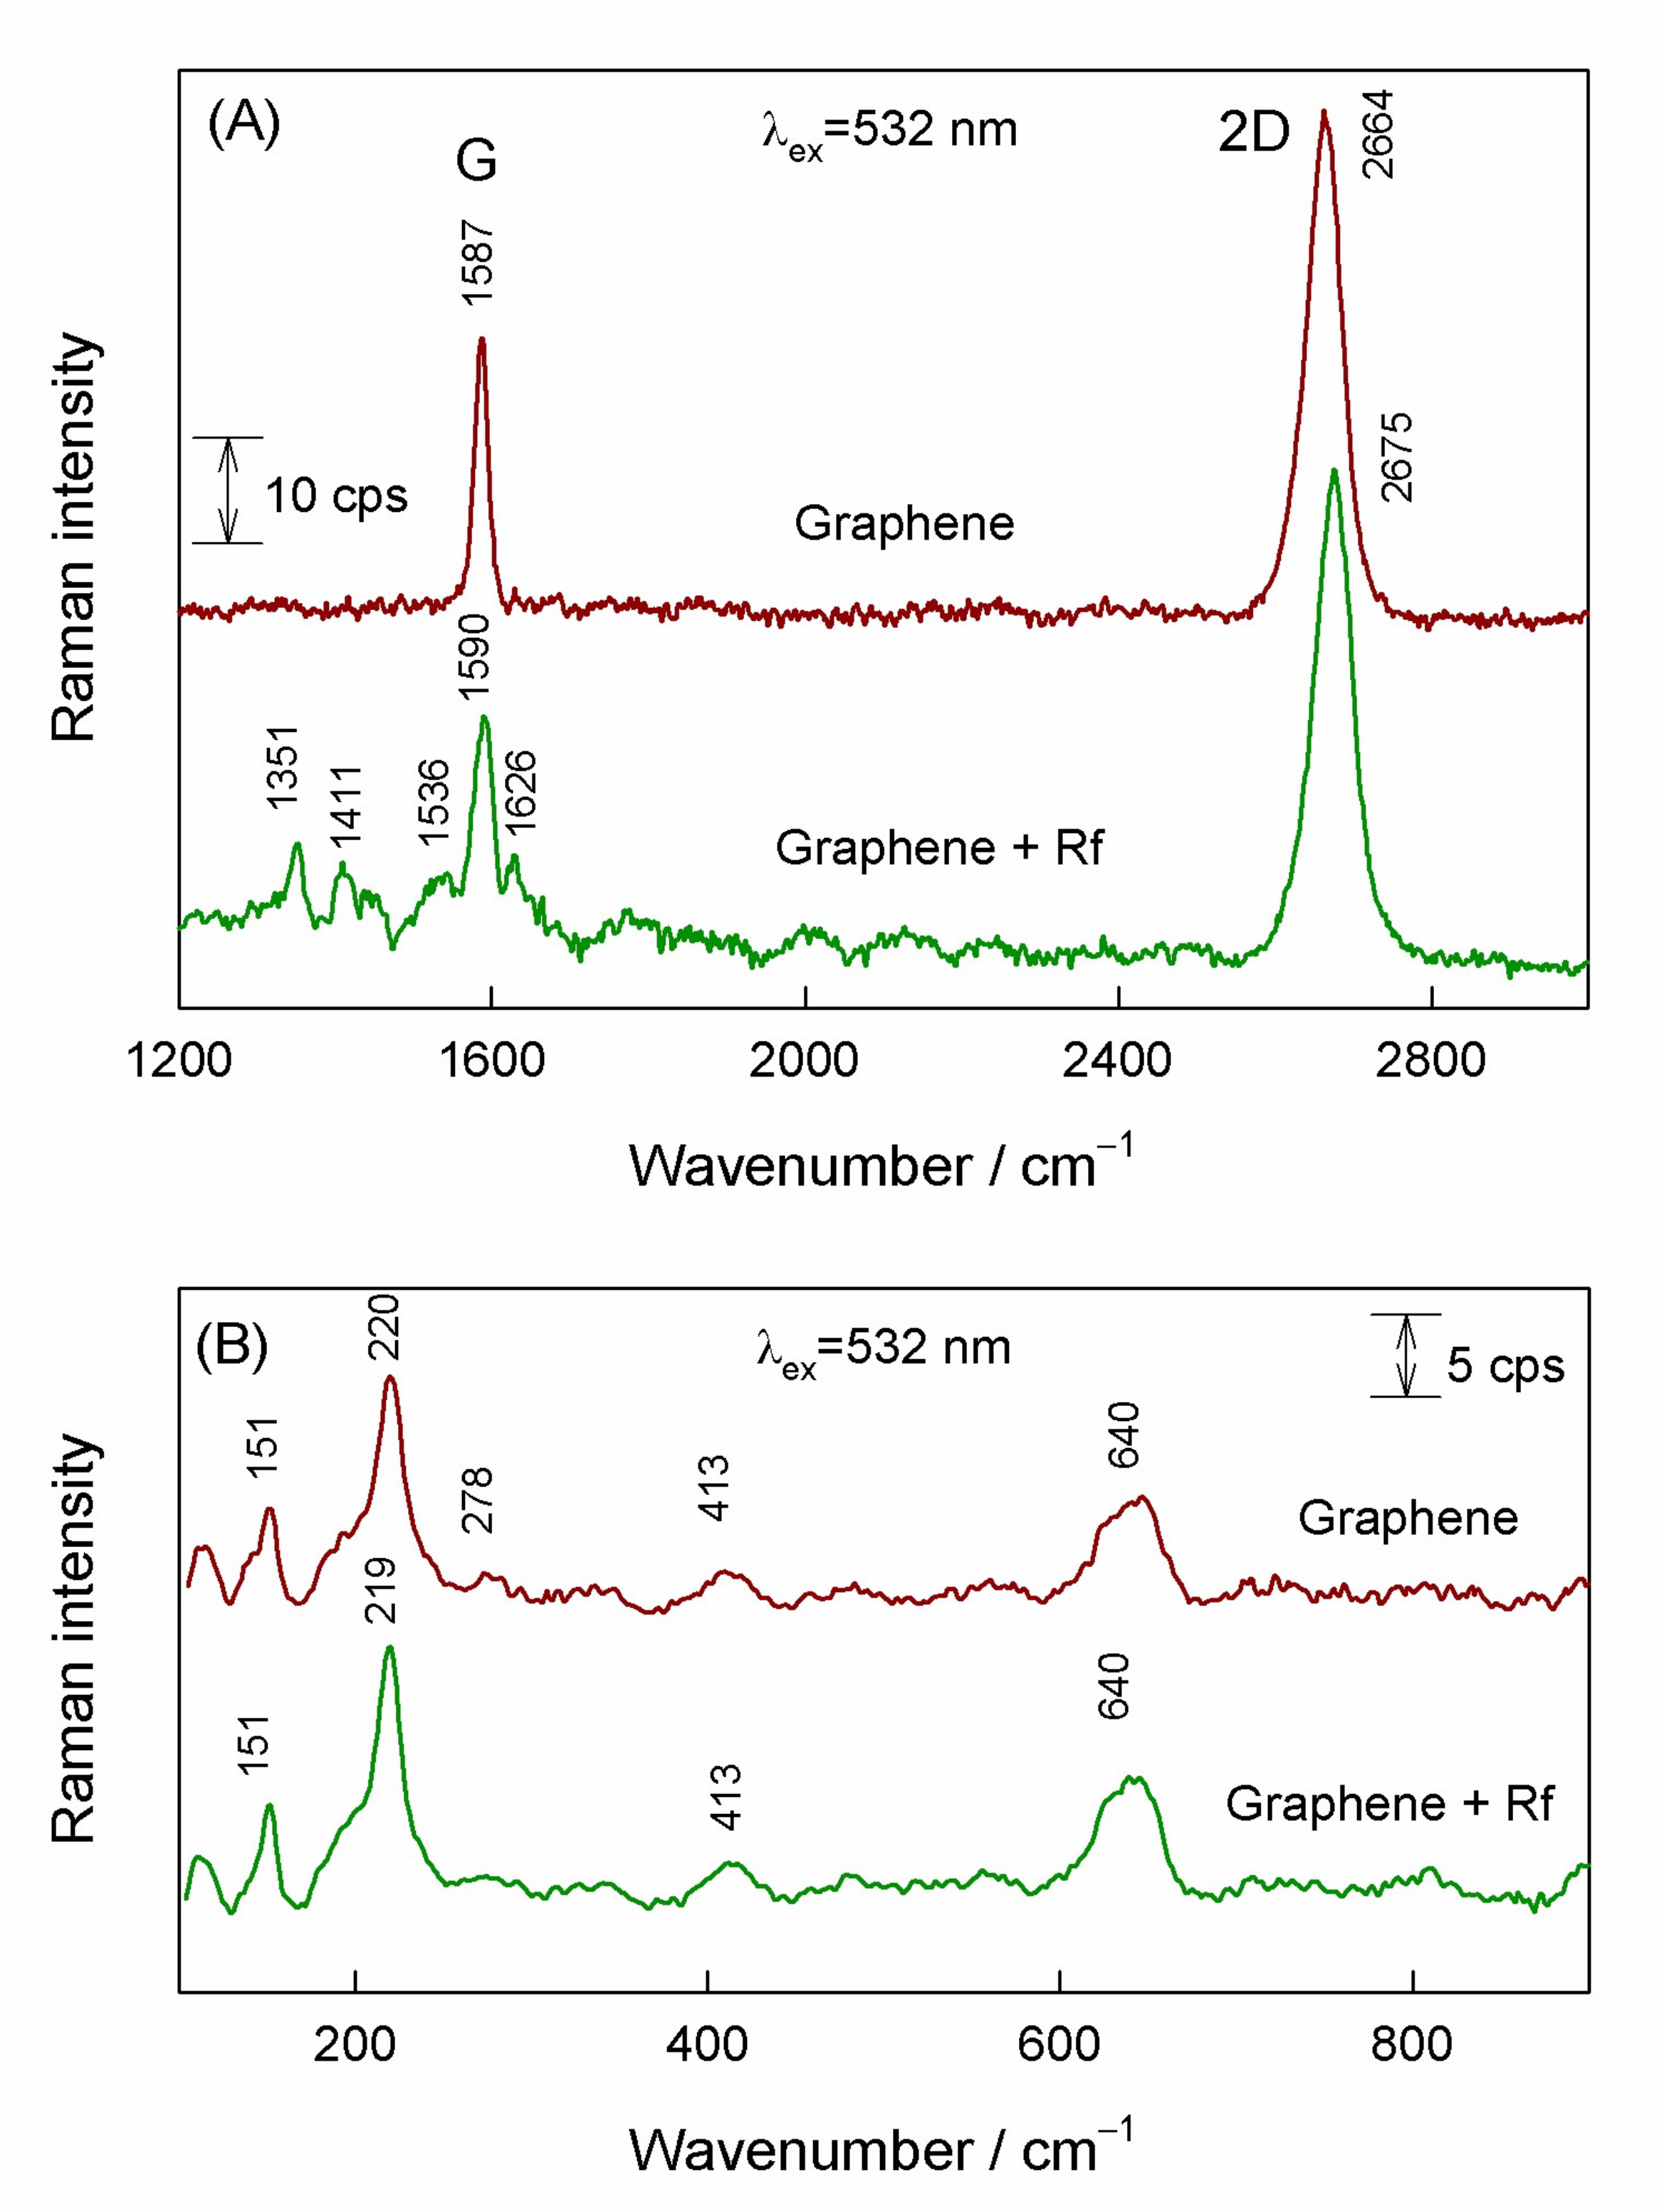
| 2675 vs | RRS | 2D band; graphene |
| 1590 m/1592 vw | RRS/SHINERS | G band; graphene |
| 1626 w | GERS | Ring I and II stretch; Rf |
| 1536 br, w/1525 br,w | GERS/SHINERS | Ring I, II, and III stretch; Rf |
| 1457 s | SHINERS | CH3 deformation + Ring I, II stretch + Ribityl bend; Rf |
| 1411 w/1407 w | GERS/SHINERS | CH3 bend; Rf |
| 1351 w/1349 vs | GERS/SHINERS | C2-N3-C4 symmetric stretch + Ring I, II, III stretch; Rf |
| 1321 s | SHINERS | D band; graphene |
| 1206 w | SHINERS | Ring I breathing + Ring II, III stretch; Rf |
| 1158 w | SHINERS | Ring I, II, III stretch + C2-N3-C4 symmetric stretch; Rf |
| 1048 s | SHINERS | Ring I, II, III stretch; Rf |
| 981 s | SHINERS | C-C + C-O stretch + COH deformation; Rf ribityl 2 |
| 930 m | SHINERS | C-C + C-N stretch + CH2 rock; Rf ribityl 2 |
| 808 w | SHINERS | N-C=O anti-symmetric bend + Ring I, II, III in-plane deformation; Rf |
| 740 s | SHINERS | Ring I in-plane bending; Rf |
| 710 w | SHINERS | Ring I, II, III in-plane deformation; Rf |
| 640 w/626 w | GERS-RRS/SHINERS | Cu2O |
| 559 w | SHINERS | N-C=O symmetric stretch + Ring I, II, III in-plane deformation; Rf |
| 413 vw | GERS-RRS | Cu2O |
| 219 m | GERS-RRS | Cu2O |
| 151 w | GERS-RRS | Cu2O |
Publisher’s Note: MDPI stays neutral with regard to jurisdictional claims in published maps and institutional affiliations. |
© 2022 by the authors. Licensee MDPI, Basel, Switzerland. This article is an open access article distributed under the terms and conditions of the Creative Commons Attribution (CC BY) license (https://creativecommons.org/licenses/by/4.0/).
Share and Cite
Zdaniauskienė, A.; Ignatjev, I.; Charkova, T.; Talaikis, M.; Lukša, A.; Šetkus, A.; Niaura, G. Shell-Isolated Nanoparticle-Enhanced Raman Spectroscopy for Probing Riboflavin on Graphene. Materials 2022, 15, 1636. https://doi.org/10.3390/ma15051636
Zdaniauskienė A, Ignatjev I, Charkova T, Talaikis M, Lukša A, Šetkus A, Niaura G. Shell-Isolated Nanoparticle-Enhanced Raman Spectroscopy for Probing Riboflavin on Graphene. Materials. 2022; 15(5):1636. https://doi.org/10.3390/ma15051636
Chicago/Turabian StyleZdaniauskienė, Agnė, Ilja Ignatjev, Tatjana Charkova, Martynas Talaikis, Algimantas Lukša, Arūnas Šetkus, and Gediminas Niaura. 2022. "Shell-Isolated Nanoparticle-Enhanced Raman Spectroscopy for Probing Riboflavin on Graphene" Materials 15, no. 5: 1636. https://doi.org/10.3390/ma15051636
APA StyleZdaniauskienė, A., Ignatjev, I., Charkova, T., Talaikis, M., Lukša, A., Šetkus, A., & Niaura, G. (2022). Shell-Isolated Nanoparticle-Enhanced Raman Spectroscopy for Probing Riboflavin on Graphene. Materials, 15(5), 1636. https://doi.org/10.3390/ma15051636