Abstract
A new preparation concept of a partially porous solid-state bilayer electrolyte (BE) for high-temperature sodium-ion batteries has been developed. The porous layer provides mechanical strength and is infiltrated with liquid and highly conductive NaAlCl4 salt, while the dense layer prevents short circuits. Both layers consist, at least partially, of Na-β-alumina. The BEs are synthesized by a three-step procedure, including a sol-gel synthesis, the preparation of porous, calcined bulk material, and spin coating to deposit a dense layer. A detailed study is carried out to investigate the effect of polyethylene oxide (PEO) concentration on pore size and crystallization of the bulk material. The microstructure and crystallographic composition are verified for all steps via mercury intrusion, X-ray diffraction, and scanning electron microscopy. The porous bulk material exhibits an unprecedented open porosity for a NaxAlOy bilayer-system of ≤57% with a pore size of ≈200–300 nm and pore volume of ≤0.3 cm3∙g−1. It contains high shares of crystalline α-Al2O3 and Na-β-alumina. The BEs are characterized by impedance spectroscopy, which proved an increase of ionic conductivity with increasing porosity and increasing Na-β-alumina phase content in the bulk material. Ion conductivity of up to 0.10 S∙cm−1 at 300 °C is achieved.
1. Introduction
Electrochemical energy storage is a key feature in transforming the global economy towards sustainability and carbon neutrality. The main alternative to Li-ion based batteries (LIBs), which are facing problems in terms of ethical issues and expensive lithium and cobalt production, are Na-ion based batteries (SIB). Sodium is cheap, environmentally safe and a suitable replacement for lithium [1,2].
The only industrially established sodium-based batteries are high-temperature Na/NiCl2- and Na/S-batteries. In both technologies, a non-porous ceramic Na-β-alumina tube is used as an electrolyte [3]. Polycrystalline Na-β-alumina electrolytes contain the two crystalline phases Na-β’-alumina (hexagonal, P63/mmc) and Na-β”-alumina (rhombohedral, R3m), which differ in stacking sequence and chemical composition [3]. The ionic conductivity of both crystal structures is caused by a conduction layer, where the mobile Na-ions are located on the c axis, and can, hence, move along this direction. [4,5] Thereby, an ionic conductivity of >0.2 S∙cm−1 at 300 °C can be reached [3,6]. Other recent studies undermine the general research interest in sodium-ion batteries [7,8].
The work presented in this article pursues the idea of a partially porous solid-state bilayer electrolyte for Na-ion based batteries. The general working principle is illustrated in Figure 1.
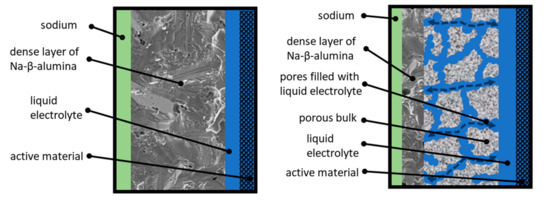
Figure 1.
Left: Sketch of the operating principle of a state-of-the-art Na/NiCl2-cell. Right: Sketch of the operating principle of a partially porous solid-state bilayer electrolyte.
The left side of Figure 1 shows the working principle of a state-of-the-art Na/NiCl2-cell. Sodium serves as an anode and is labeled green. The active material (labeled black) is infiltrated with a highly conductive liquid electrolyte (NaAlCl4, labeled blue). This ensures a conductive connection between the particles. The separation of anode and cathode is realized by a dense Na-ion-conductive Na-β-alumina layer (labeled dark grey). The thickness of commercial Na-β-alumina electrolytes amounts from 1.5 to 2 mm. This guarantees a sufficient fracture strength to withstand the thermally and mechanically induced stress at operating temperatures of 250 °C up to 330 °C [9]. The state-of-the-art industrial manufacturing route of dense Na-β-alumina electrolytes represents a solid-state synthesis as powder followed by isostatic pressing of green bodies and subsequent sintering [10]. Lab-scale syntheses of Na-β-alumina powder are established for several methods: Solid-state reaction [11,12], infiltration method [13], and citrate complexation (also called sol-gel synthesis) [14,15,16,17]. Dense Na-β-alumina electrolytes are obtained after fractionation, uniaxial pressing, and sintering [1,6,12,16,17,18,19].
The aim of this work is to develop a novel, partially porous solid-state bilayer electrolyte (cf. Figure 1, right). The thicker layer (labeled light grey) is highly porous and infiltrated with liquid NaAlCl4. To prevent short circuits, the porous layer is coated with a thin, dense layer of Na-β-alumina. Due to this setup, the transportation of Na-ions through the electrolyte is divided into two parts. The transport across the porous area, ending at the dense Na-β-alumina layer, is realized by the liquid NaAlCl4 salt and partly by the porous structure itself, while the transport through the dense thin layer is accomplished by solid-state Na-β-alumina. Since the conductivity of NaAlCl4 at 300 °C is about three times higher than the conductivity of Na-β-alumina [20], the overall resistance of the bilayer electrolyte can potentially be significantly lowered in comparison to a state-of-the-art dense Na-β-alumina electrolyte with the same thickness.
To the best of our knowledge, only one publication shares this idea. Jung et al. [21] prepared a thin solid electrolyte consisting of a porous layer of 250 µm and a dense layer of 125–250 µm. Firstly, a stack of two α-Al2O3/ZrO2 layers was prepared by tape casting. In one layer, graphite powder is implied as pore forming agent. Both layers were laminated together and calcined at 1450 °C, while embedded in NaAlO2/Na-β”-alumina powder. Due to Na-diffusion from the bed into the tape casted α-Al2O3/ZrO2 foil, a reaction to a Na-β-alumina/ZrO2 took place. This bilayer electrolyte was placed in a cell similar to the principle described in Figure 1. Contrary to our approach Jung et al. placed the porous side at the anode and filled the pores with liquid sodium instead of NaAlCl4. To overcome the high surface tension of liquid sodium, which hinders the infiltration of the pores, lead acetate was used to coat the porous side [21]. They showed that using a bilayer electrolyte could improve the energy efficiency of a Na/NiCl2-cell up to 8%. Only a few other publications are available on porous Na-β-alumina. For instance, Fukui et al. [22] prepared a porous Na-β-alumina disc with a diameter of 15 mm via a solid-state reactive sintering process. The disc has a modal pore size of 630 nm with a pore volume of 0.20 cm3∙g−1, and total porosity of up to 58%. Sakka et al. [23] infiltrated porous α-Al2O3 with a sodic solution. After sintering at 1600 and 1700 °C, porous Na-β-alumina with an inhomogeneous pore structure was formed. While no reliable data on the costs of the aforementioned methods in comparison with our sol-gel synthesis is available yet, slurry casting [21] is certainly a less time-consuming approach. However, the sol-gel synthesis allows for a controlled interconnected pore structure with the potential of monolith production [24].
Our work pursues the novel idea of porous Na-β-alumina generation via the epoxide-mediated sol-gel synthesis, which is known from the synthesis of crystalline alumina with an interconnected pore structure [25]. To obtain a porous monolith instead of a non-porous powder, the pH value of an alcoholic solution containing an Al3+ salt must be increased slowly [24]. Propylene oxide (PO) is used to induce the hydrolysis and condensation of solvated Al3+-ions by an exothermic ring opening reaction. This enables the production of gels with an interconnected pore structure. Tokudome et al. [24] introduced polyethylene oxide (PEO) into the sol-gel synthesis of alumina. PEO induces phase separation, which results in materials with adjustable macropore sizes from 400 nm to 1.8 µm.
In this report, a three-step procedure is described to produce a partially porous solid-state bilayer electrolyte (BE). These steps consist of a sol-gel synthesis, the preparation of a disc from the porous, calcined bulk material, and spin coating to deposit a dense layer onto the thus obtained disc. This approach is fundamentally different from the work previously reported by Jung and co-workers, both regarding the preparation method and the envisaged results in terms of quantifiable porosity and Na content. The effect of methanol, sodium cations, and the concentration of PEO on the pore and crystal formation of the bulk material is investigated. Furthermore, the causal connections of crystal phase composition, pore structure, and the sintering process are discussed. Ultimately, the BEs are characterized regarding their ionic conductivity.
2. Materials and Methods
2.1. Calcined Xerogel Disc via Epoxide-Mediated Sol-Gel Synthesis, Powder Preparation, and Isostatic Pressing
The macroporous sodium-containing alumina bulk material was synthesized via an epoxide-mediated sol-gel route as described by Carstens and Enke [26]. The synthesis procedure was slightly modified regarding the replacement of ethanol by methanol to enable the integration of sodium-ions in the system.
7.80 g AlCl3·6H2O (Alfa Aesar, 99%) and 0.00, 0.01 or 0.10 g polyethylene oxide with a molecular weight (M.W.) of 900,000 (Acros Organics) were dissolved in a mixture of 5.77 g deionized water and 7.90 g methanol (VWR Chemicals, 100.0%) at room temperature. The solution was placed in an ice bath and cooled down to 5 °C within 1 h. 1.414 g of 4 M NaOH (VWR chemicals) were added under constant stirring (500 rpm). Immediately, 7.00 mL propylene oxide (Acros Organics, 99.5%) was added. The ice bath was removed after three minutes. The reaction solution was stirred for another seven minutes at room temperature. The reaction vessel was then placed in a water bath at 40 °C to induce gelation, followed by aging for 24 h at 40 °C. After an ethanol exchange for five days and drying at 50 °C for seven days, the obtained xerogels were calcined at 1200 °C for 1 h with a heating rate of 10 K∙min−1 (IH 60/14, Nabertherm, Germany). For disc preparation (diameter: 20 mm, high: 3 mm), the calcinated xerogels were ground to a particle size <350 µm and pressed into a disc form.
2.2. Dense Thin Layer via Spin Coating
The slurry was produced by ball milling (400 rpm; 20 min; 30 g of 3 mm-ZrO2-milling balls) of 9.5 g Na-β-alumina [6], 0.5 g TiO2 (Alfa Aesar, Haverhill, MA, USA 99.7%), 1 g Y-stabilized ZrO2 (Tosoh Corporation, Tokyo, Japan), 14.75 mL deionized water and 0.45 g organic binder. The calcined xerogel discs were spin coated (POLOS Spin150i, Putten, The Netherlands) according to the spinning regime in Table S1.
After coating, the samples were dried overnight under ambient conditions. The dried samples were placed in a dense MgO-crucible with the coated layer facing upwards. A thin layer of Na-β-alumina powder was added to the bottom of the crucibles to avoid shrinkage deformation of the samples during heat treatment. Sintering was performed at 1400 °C for 2 h.
To guarantee a sufficiently dense layer, the procedure was repeated three times. It should be mentioned that the powder layer was only applied for the first sintering process.
2.3. Synthesis of NaAlCl4
NaAlCl4 was synthesized by stirring AlCl3 (BASF SE, Ludwigshafen, Germany) and NaCl (Akzo Nobel, Amsterdam, The Netherlands) in a molar ratio of 1:1.05 under N2 atmosphere at 180 °C for 1 h. The XRD pattern of the synthesized NaAlCl4 is shown in Figure S1.
2.4. Characterization Methods
The gelation process was controlled by temperature and pH-measurement (Mettler Toledo Seven Easy pH, Sensor InLab® Routine Pro, Gießen, Germany).
The thermal properties of non-calcinated, powdered xerogels (<350 µm) were characterized by thermogravimetric analysis (TG/DSC, STA 409, Netsch, Selb, Germany). Thirty milligrams powder was placed in a corundum crucible. Corundum powder was used as a reference. The measurement was carried out from room temperature to 1300 °C with a heating rate of 10 K∙min−1 under atmospheric air.
The chemical composition was determined by inductively coupled plasma-optical emission spectroscopy (Optima 800, Perkin Elmer, Waltham, MA, USA). 50 mg of the powdered sample were mixed with 2 mL H2SO4 (93–98%, NORMATOM, VWR Chemicals, Radnor, PA, USA) and 0.75 mL H3PO4 (85%, suprapur, Merck, Darmstadt, Germany), and solubilized in a microwave oven with an 8 XF100 rotor at 1300 W (Multiwave Pro, Anton Paar, Graz, Austria). This solution was analyzed.
The carbon content was determined by CHN elemental analysis with a Vario EL III (Elementar Analysesysteme GmbH, Langenselbold, Germany). 30 mg of the powdered sample were heated up to 1800 °C and completely oxidized to CO2 on a WO3-catalyst.
Powder X-ray diffraction (XRD) analysis was carried out with a D8 DISCOVER (Bruker Corporation, Billerica, MA, USA). CuKα radiation (40 kV, 40 mA) and a VANTEC-500 2D detector (Bruker Corporation, Billerica, MA, USA) were used. A 2θ-correction was carried out about 0.1° regarding the reference measurement of corundum. The evaluation was carried out by Match! (version 3.3.0, Crystalimpact, Bonn, Germany). The quantification of the relative number of crystal phases was carried out by Rietveld analysis by applying Topaz software (Bruker, Billerica, MA, USA). The following data were used: ICSD-99830 (γ-Al2O3), ICSD-66560 (θ-Al2O3), ICSD-30024 (α-Al2O3), ICSD-201178 (Na-β-alumina).
The xerogel microstructure was characterized by scanning electron microscopy (LEO GEMINI 1530, Zeiss, Ulm, Germany). The samples were vapor coated with gold and measured with a high electron tension of 20.00 kV at a working distance of 14.5 mm.
The microstructure of the bilayer electrolytes was characterized after embedment in epoxy and polishing by scanning electron microscopy (Ultra 55 plus, Zeiss, Germany) at a voltage of 10 kV. Furthermore, energy-dispersive X-ray spectroscopy (Trident XM14, EDAX, Weiterstadt, Germany) was employed. Both methods were applied before the liquid salt infiltration.
The pore size distribution, porosity, and pore volume were measured via mercury intrusion (PASCAL 440 by ThermoScientific/POROTEC, Waltham, MA, USA). The samples were evacuated to 0.2 mbar prior to filling with mercury. Intrusion measurements were carried out up to 400 Mpa at room temperature with an assumed contact angle of mercury of 140° and its surface tension set to 0.48 N∙m−1. The density of each sample was determined by helium pycnometry (Multi Nr. 160 494, ThermoScientific/Pycnomatic ATC, Waltham, MA, USA) to calculate the porosity from the mercury intrusion data.
The sintered bilayer electrolytes were attached to an Al2O3-cylinder to measure the ionic conductivity. To check the quality of the dense layer and the glass joint, the electrolyte assemblies were tested using a leak detector (Pfeiffer Vacuum Smart Test, Asslar, Germany) and considered as gas tight, if the leakage rate was below 1 × 10⁻⁷ mbar∙L∙s−1. Na (VWR 99.8%, Radnor, PA, USA) was applied on the dense side, while the porous side was infiltrated with NaAlCl4 at 300 °C. Both electrolyte sides were contacted with a Cu sheet. The flat test cell was sealed with TeflonTM (NaAlCl4-side) and carbon (Na-side). The ohmic resistance was measured by impedance spectroscopy (Biologic SP-240, Claix, France) from 1 MHz to 10 Hz and a sinus amplitude of 10 mV at temperatures from 165 to 300 °C. The cell assembly and measurements took place under N2 atmosphere. The impedance data were recorded and processed with the software “EC-Labs 11.3”. Equation (1) was used to calculate the specific ohmic conductivity (σ) of the electrolyte:
“A” represents the average cross-sectional area, “R” the measured ohmic resistance, and “t” the thickness of the electrolyte.
3. Results
3.1. Synthesis and Properties of Xerogels
3.1.1. Characterization of the Sol-Gel Synthesis
The sol-gel process strongly depends on pH and temperature. Figure 2 shows the pH and temperature progress of a sample without PEO.
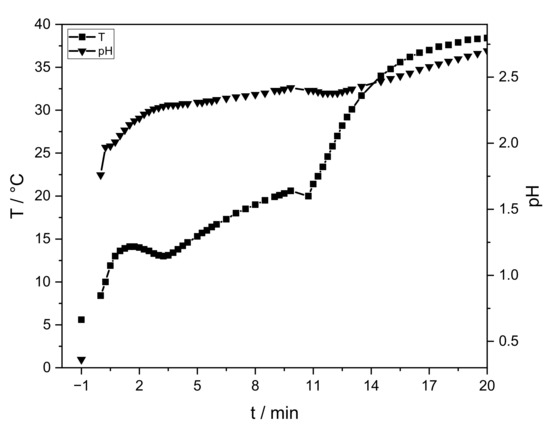
Figure 2.
Progression of temperature (squares) and pH (triangles) of the sol-gel process without PEO. The initial temperature and pH value of the AlCl3-solution are given at “−1” min. At 0 min sodium hydroxide and PO are integrated. The measurement is stopped after gelation (t = 20 min).
The AlCl3 solution has an initial temperature of 5 °C and a pH value of ≈0.4 (t = “−1” min). After sodium hydroxide addition, these values rise immediately to 1.7 and 8 °C, respectively (t = 0 min). After PO addition, the temperature and pH slowly continue to increase. Gelation is observed after 20 min. After the aging process (40 °C, 24 h) an intact lyogel is obtained, which cracks during drying (Figure 3, right). Temperature, pH progression, gelation time, and crack formation are similar for all samples.
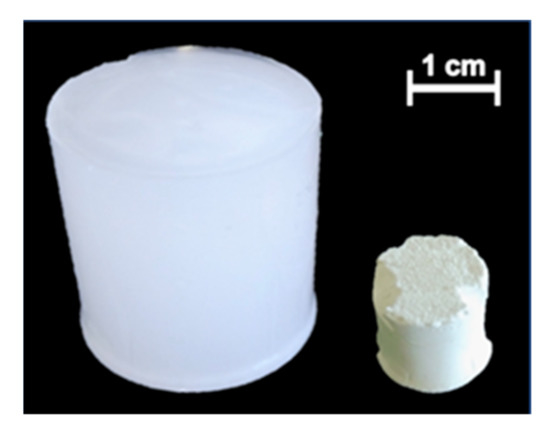
Figure 3.
Photograph of the lyogel (left, after aging) and xerogel (right, after drying).
Temperature and pH progression are similar to the study of Carstens and Enke [26]. In comparison, the addition of ≈5 wt.-% sodium hydroxide increases the pH value. PO raises the pH continuously, but with a smaller increase. Due to slightly less amount of water (−4 wt.-%), hydrolysis and exothermic ring opening reactions are slowed down. The temperature increases continuously. To ensure a controlled reaction, the velocity of hydrolysis and condensation is reduced by cooling. The latter results in similar temperature values. Gelation is observed at the same time. No influence of PEO (<0.35 wt.-%) on the sol-gel synthesis is identified via temperature and pH progression.
3.1.2. Thermal Properties of the Xerogels
The thermal properties of the obtained xerogels are characterized by TG/DSC up to 1300 °C (Figure 4). The uncertainty of the TG measurement is 0.5 wt.-%.
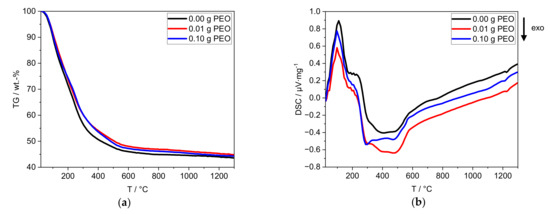
Figure 4.
Thermal analyses of the xerogels by (a) TG and (b) DSC with a heating rate of 10 K∙min−1. The sample without PEO is labeled black, the one containing 0.01 g PEO is labeled red, and the one with 0.10 g PEO is labeled blue.
For all xerogels, a loss of mass of ≈66 wt.-% is detected. The main mass loss takes place between 25 °C and 600 °C (Figure 4a), with one change in slope at around 200 °C. The mass loss of the samples with PEO is delayed in the temperature range above 200 °C. The theoretical mass loss of PEO (0.35 wt.-%) is within the defined uncertainty of measurement.
An endothermic process takes place between 25 °C and 170 °C (Figure 4b). A plateau-like transition (170–280 °C) is followed by exothermic processes (280–600 °C) with three local minima at 290, 390 and 480 °C. Between 1200 °C and 1250 °C, another exothermic process occurs. The addition of PEO reduces the intensity of the three exothermic processes at 230–600 °C. Furthermore, 0.10 g PEO shifts the exothermic process at 1200 °C to lower temperatures (Figure S2).
The first endothermic process (25–170 °C) can be attributed to the mass loss of adsorbed water. The exothermic processes (170–600 °C) can be attributed to the combustion of PEO and the phase transformation of alumina species. At 300 °C Hill et al. [27] reported the conversion of Al(OH)3 to γ-AlO(OH) (boehmite). The further conversion to γ-Al2O3 is usually observed between 300 °C and 500 °C [27,28]. Both phase transformations (280–600 °C) are accompanied by the release of chemically bound hydroxyl groups. The continuous mass loss above 600 °C is due to the release of residual hydroxyl groups. Between 600 °C and 1200 °C, no thermodynamic process is observed. In contrast, the literature reports a phase conversion to θ-Al2O3 between 850 °C and 1100 °C. At 1200 °C phase conversion of water-free Al2O3 phases, e.g., to α-Al2O3 or Na-β-alumina formation occurs [27,28].
PEO may reduce the number of crystal phases formed between 230 °C and 600 °C and could influence the phase formation process at 1200 °C. Nevertheless, further investigations are required to identify the effect of PEO on phase formation (cf. Section 3.2).
3.2. Characterization of Calcined Xerogels
3.2.1. Characterization of Chemical and Phase Composition
All three lyogels consist of 2.4 wt.-% Na2O and 87.6 wt.-% Al2O3. The Na2O content is reduced to 1.1 wt.-% after the ethanol exchange and remains constant during further heat treatment. The Na2O content is independent of the initial PEO content. PEO is virtually completely combusted during calcination, and the final carbon content amounts to only 0.22 wt.-% (±0.10%).
The initial amount of sodium of 13.4 mol-% (or 8.63 wt.-%) is based on the ideal structural formula of Na-β”-alumina (Na2O·5.33Al2O3) and is limited by the solubility in the methanol-water solvent mixture [15,22]. The largest sodium loss (−6.23 wt.-%) occurs during sol-gel synthesis. The lyogel consists of water-rich alumina species and solvent. Sodium is predominantly present in the solvent phase and is only partially incorporated into the Al2O3 network. Although sodium salts are very poorly soluble in ethanol, sodium is physically washed out (−1.3 wt.-%) by the solvent exchange. After the calcination, the phase structures of calcined xerogels were characterized via XRD (cf. Figure 5).
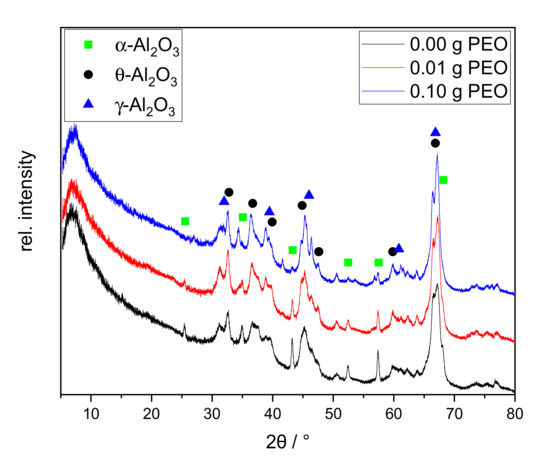
Figure 5.
XRD patterns of xerogels calcined at 1200 °C for 1 h with different initial PEO amounts (0.00 g PEO labeled black, 0.01 g PEO red, 0.10 g PEO blue). The main reflexes of alumina phases are labeled as follows: γ-Al2O3 blue triangle; θ-Al2O3 black asterisk; α-Al2O3 green square.
All XRD patterns exhibit a broad diffuse background and broadened reflexes. Major reflexes of γ-Al2O3 and θ-Al2O3 can be identified. Qualitatively, the relative intensities remain similar among all three samples. The sample synthesized without PEO shows sharp reflexes of α-Al2O3 at 25.5°, 43.2°, and 57.4° 2θ. The first one disappears with the addition of 0.01 g PEO. With an initial amount of 0.10 g PEO, the latter two are nearly completely erased. A sodium-containing phase could not be identified.
The samples form sodium-free crystal structures of alumina although 1.1 wt.-% Na2O is contained. This can be explained by the incomplete phase conversion. In agreement with the TG/DSC measurement, the conversion to γ-Al2O3 is confirmed. Although no θ-Al2O3 phase conversion was identified by thermal analyses between 850 and 1000 °C, all samples contain θ-Al2O3 according to XRD. This phase conversion may have taken place prematurely below 600 °C, or shifted upwards to the temperature range of 1200–1250 °C. It is reported that θ- and α-Al2O3 can be formed simultaneously at 1100 °C [28]. Although α-Al2O3 is only present in traces in the sample, the exothermic phase transition at 1200 °C is clearly visible in the DTA curves in Figure 4. Formation of θ-Al2O3, thus, probably occurs at 1200 °C, along with α-Al2O3.
The α-Al2O3 content is reduced with increasing initial PEO amount in the reaction solution. Guzmán-Castillo et al. [29] reported that the crystallization and the conversion to transitional alumina (e.g., γ-, δ-, and θ-Al2O3) are influenced by the crystallite size of boehmite. With increasing grain size, the removal of hydroxyl groups becomes more difficult and results in a poorer conversion to transitional alumina, subsequently also to α-Al2O3. The XRD measurements illustrate that initial PEO inhibits the α-Al2O3 conversion. PEO is burned out during thermal treatment around 200 °C before Al2O3 phase conversion occurs. Thus, PEO could be responsible for increased boehmite crystallite sizes, resulting in a lesser conversion towards transition alumina and finally α-Al2O3. The latter phase is only visible via XRD studies. This assumption is supported by the PEO-induced intensity reduction of exothermic processes at 230–600 °C in the DTA curves in Figure 4.
3.2.2. Pore Structure and Porosity Studies of Xerogels
Table S2 summarizes the texture data from the mercury intrusion of calcined xerogels, and Figure 6 shows a representative example of the pore size distribution.
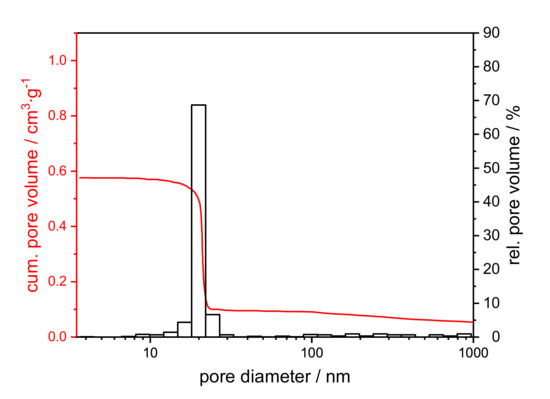
Figure 6.
Cumulative (red) and relative pore volume (black) from the mercury intrusion of a xerogel with an initial PEO amount of 0.01 g, calcined at 1200 °C for 1 h.
The mercury intrusion data do not differ between the samples (cf. Figure S3). All samples exhibit a monomodal, open-pore system with a modal pore size of 21 nm, a pore volume of 0.4 cm3∙g−1 and a porosity of around 60%. A further assessment of the texture properties can be made by SEM images in comparison to mercury measurement. The SEM images in Figure 7 reveal the presence of macropores, which are not detected by mercury intrusion. The samples are distinguished based on the amount of PEO, even though the polymer was burned out by the thermal treatment.
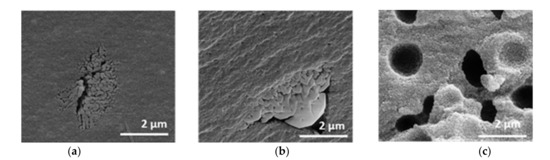
Figure 7.
SEM images of xerogels with initial PEO amounts of (a) 0.00 g, (b) 0.01 g, (c) 0.10 g, calcined at 1200 °C for 1 h.
Without PEO, the sample possesses a homogeneous structure, which is interrupted by isolated areas with interconnected pores. These areas are sporadically and statistically placed. The microstructure remains similar after the addition of 0.01 g PEO. The sample initially containing 0.10 g PEO shows a coarser material structure with homogeneously distributed semi-spherical cavities of about 1–2 µm in diameter and no additional isolated areas with interconnected pores.
Through the sol-gel and drying process, a pore system develops within the alumina network [30]. Due to calcination the system partially crystallizes. The homogeneous structure can be attributed to the part containing a homogenous mesoporous alumina network formed by γ- and θ-Al2O3 phases. Phase conversion from boehmite via transition alumina to α-Al2O3 induces sintering, resulting in increased pore sizes [25,29,31]. Therefore, the isolated areas can, hence, be plausibly attributed to α-Al2O3. The isolated semi-spherical cavities resulting from the addition of 0.10 g PEO to the synthesis mixture cannot be detected by mercury intrusion. Most of the cavities are only accessible in the complex pore structure via the smaller mesopores with 21–22 nm diameter. That means, the cavities are filled with mercury at a pressure that corresponds to the filling of the smaller mesopores (network effect of mercury intrusion). Therefore, the cavities are not displayed in the pore size distribution.
An intriguing question is why PEO appears to form those semi-spherical cavities within the gel network, rather than interconnected cavities [25,26] (cf. Figure 7c). For aluminum salt-based gels, an amount of 0.1 wt.-% PEO (M.W. 900,000) usually results in an additional interconnected macropore system around 1000 nm [20,21]. PEO induces phase separation at an early state of reaction, forming alumina (AH), and a PEO rich phase. Only week interactions might exist between AH and PEO. The solvent coexists in both phases [32].
PEO-induced phase morphology is determined by the mechanism (binodal, spinodal), the time difference (t) of the onset of phase separation, and sol-gel transition (SGT). The morphology is coarsened with increasing t and frozen at SGT. The mechanism depends on PEO concentration, solvent polarity, and temperature. The coarsening velocity is mainly influenced by the viscosity, which depends on the PEO concentration and molecular weight. The SGT is linked to the hydrolysis and condensation reaction, which depends on pH value and water content [25].
The PEO-induced phase separation does not significantly affect the development of the mesopore system, which is characteristic of alumina sol-gel syntheses and one of its main benefits. As the synthesis procedure itself was only slightly modified compared to the previously published route [26], the reason for the observed diverging pore formation mechanism must lie in the altered composition of the initial reaction solution. No significant change of SGT is observed. Therefore, a change in mechanism and/or coarsening velocity can be related to the change of alcohol-water volume ratio, polarity relating to the methanol/ethanol exchange [33,34,35,36], and/or complexation of PEO with sodium-ions [37,38].
The exchange of ethanol for methanol, the change in the alcohol-water volume ratio, and the addition of sodium-ions seem to have a decisive influence on structure formation and phase separation in the sol-gel process to form sodium-containing alumina monoliths in the first step. To fully elucidate the individual influences, further systematic studies of the individual and combined contributions of these three parameters are required.
3.3. Characterization of Xerogels Discs
The employed sol-gel route resulted in defective monoliths. For application in a test cell, the calcined and grounded, polymer-free xerogel was pressed into a disc shape (cf. Figure 8) without further thermal treatment.
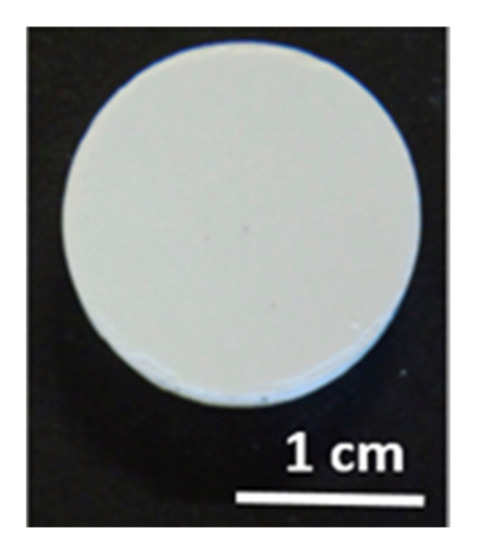
Figure 8.
Picture of an untreated disc.
The phase composition should, thus, remain unchanged, an additional investigation by XRD was not performed. The samples exhibit a monomodal, open-pore system with a pore size of 16–18 nm (cf. Figure S4), a pore volume of 0.31–0.37 cm3∙g−1, and a porosity of 52–57%. The pore sizes of the pressed discs are slightly, but distinctly smaller than those of the calcined xerogels. Table S3 summarizes the microstructural data of the pressed discs. The pore system of the starting material likely remained intact, although it may have been compacted, due to the pressurization. Furthermore, the pore volume and porosity are slightly decreased for the same reason.
For comparability, the uncoated discs were calcined according to the procedure described in Section 2.2. to evaluate the changes of phases and microstructure of the discs themselves (cf. Figure 9).
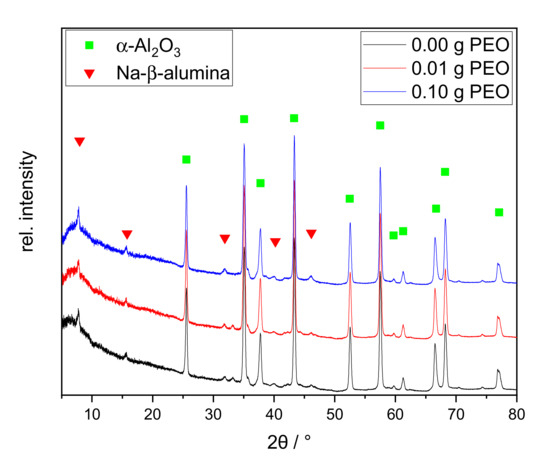
Figure 9.
XRD patterns of the discs calcined at 1400 °C for 2 h with different initial PEO amounts: 0.00 g PEO (black), 0.01 g PEO (red), and 0.10 g PEO (blue). The main reflexes of α-Al2O3 and Na--alumina are labeled with a green square and red triangle, respectively.
The XRD patterns of the calcined discs show distinct reflexes of α-Al2O3 and the main reflex of Na--alumina at 7.8° 2θ. Na-’-alumina and Na-”-alumina are structurally very similar and can be distinguished through the reflexes at 44.5° and 46.0° [39,40]. As the secondary reflexes are very small, no distinction can be made based on the recorded XRD patterns. The relative intensity of the main Na--alumina reflex at 7.8° is slightly increased with 0.10 g initial PEO, as confirmed by the subsequent Rietveld analysis. All XRD patterns show a broad diffuse background, indicating that the samples are not completely crystallized. The relative ratio of the crystal phases was determined by Rietveld analysis.
The non-crystalline content was neglected for this calculation. The samples consist mainly of α-Al2O3 (>90%). The Na--alumina content is similar in the samples without and with 0.01 g PEO (2 wt.-% or 1 wt.-%, respectively). The sample with an initial PEO amount of 0.10 g has a higher Na--alumina content with 5 wt.-%. Nevertheless, the determined Na--alumina amounts are all within the error margins of the method.
The XRD study illustrates that crystallization is not completed. The additional heat treatment at 1400 °C for 2 h promotes the formation α-Al2O3 from the transition phases. The main difference between the samples is the higher Na--alumina content of the sample initially containing 0.10 g of PEO. PEO promotes the formation of alumina rich phase, including a solvent phase, which could be enriched in water and sodium-ions [41]. Furthermore, PEO species could complex sodium-ions [37,38]. Both effects might lead to a better interaction between sodium-ions and the alumina network, such that the conversion to Na-ß-alumina is improved.
The further crystallization leads to a significantly different pore system. Table 1 summarizes the texture data from the mercury intrusion (cf. also Figure S5).

Table 1.
The modal pore size (dmod), pore volume (VP), and porosity (P) determined by mercury intrusion of the heat-treated discs at 1400 °C 2 h with different initial PEO amounts (mPEO). Measurement uncertainty. The uncertainty of the measurement is ±5% of the modal pore size, ±0.05 cm3∙g−1 for pore volume, and ±2% for porosity.
The pore sizes of the calcined discs are increased from meso- to macropores with diameters between 219 and 374 nm, whereas the pore volumes decrease to 0.2–0.3 cm3∙g−1. The porosity of the PEO free sample decreases (−5%), whereas the porosity of samples initially containing PEO remains constant. The deviation of the pore sizes is clearly beyond the error margins and can be attributed to the disc manufacturing process.
The increase in pore size is due to the formation of α-Al2O3 via transformation of transition phases. The transformation is accompanied by shrinkage, particle growth, and sintering processes. This causes cracks and consequently larger pores [25,31]. The decrease in pore volume and porosity can be attributed to sintering effects and deviations in the manufacturing process. PEO in the initial reaction solution may prevent pore collapse and improves the porosity of the heat-treated disc. Nevertheless, the mechanism is not yet fully understood and requires further investigation. Furthermore, the results clearly show that improvements in the synthesis procedure and in the conditions of the thermal treatment are necessary to increase the content of Na--alumina in the macroporous discs. In comparison, the bilayer electrolytes of Jung et al. [21] contain large parts of ZrO2 next to Na-β”-alumina. The porous bulk material contains pores of ≈12 µm, whereas the pore system was not further investigated.
3.4. Partially Porous Solid-State Bilayer Electrolyte
Untreated discs with initial PEO contents of 0.00, 0.01, and 0.10 g were used to prepare bilayer electrolytes. The thus obtained partially porous, polymer-free solid-state bilayer electrolytes (BE) were characterized regarding phase composition, microstructure, and ionic conductivity.
The phase composition was evaluated by XRD and subsequent Rietveld refinement.
The number of the Na-β-alumina phases increased, due to coating and subsequent sintering to 9 wt.-% in case of the polymer-free BE and up to 14 wt.-% in case of the BE initially containing 0.10 g PEO. This increase was expected because additional Na-β-alumina was applied via spin coating. Consequently, the α-Al2O3 amount is decreased by about 10 wt.%. The higher amount of Na-β-alumina in the samples with initial PEO can be attributed to its influence on the phase conversion (cf. Section 3.3).
To further investigate the influence of the coating on the location of Na-β-alumina, the BE were analyzed via SEM imaging. SEM micrographs of the BE synthesized with 0.10 g initial PEO are shown in Figure 10.
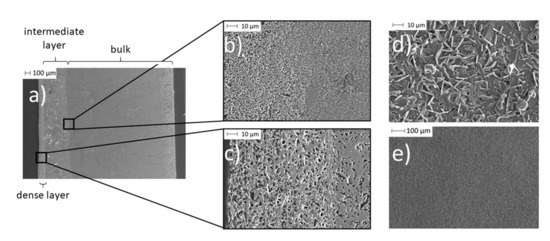
Figure 10.
SEM images of a BE synthesized with initial 0.10 g PEO: (a) A cross-section of the partially porous solid-state bilayer electrolyte; (b) a cross-section of the transition area from the Na-enriched bulk (due to spin coating) to pristine bulk material; (c) a cross-section of the dense thin layer; (d) and (e) surface of the thin layer.
In the cross-section of the BE (Figure 10a), three different areas are visible. On the left, there is a dense Na-β-alumina layer with a thickness of about 50 to 100 µm (Figure 10c). The pristine porous bulk material of the disc with a thickness of about 2.2 mm can be seen on the right side of the cross-section (Figure 10a). In between the dense Na-β-alumina layer and the porous disc bulk material, a third intermediate, sodium-enriched layer with a thickness of about 0.3 to 0.4 mm can be identified. Figure 10b shows the transition from the bulk to the intermediate layer.
The thin dense layer (Figure 10d,e) exhibits the typical flake-like shapes of Na-β-alumina crystallites [19,42,43]. Nevertheless, the dense layer shows some unintended porosity, but still enables a sufficiently low leakage rate of less than 1 × 10⁻⁷ mbar∙L∙s−1, while the untreated porous discs had a leakage rate exceeding the detection range of the employed setup. It is not yet fully understood whether the porosity of the dense layer restricts the long-term stability of the bilayer electrolyte.
EDX mapping was performed to clarify the origin of the intermediate layer. Figure 11 displays the Na distribution within the electrolytes.
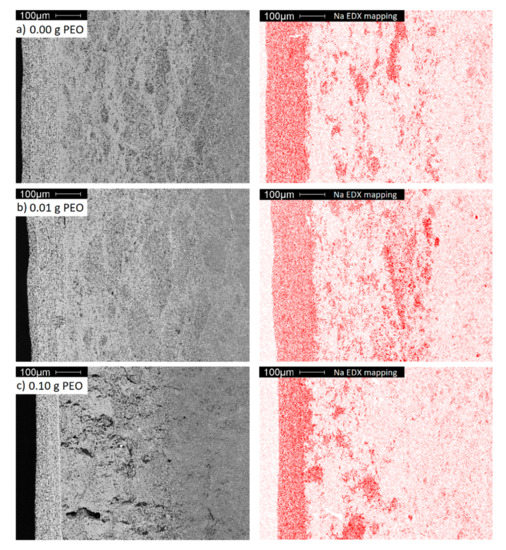
Figure 11.
A cross-section SEM images (grey) and EDX mappings of Na (red) of BE synthesized with (a) 0.00 g; (b) 0.01 g and (c) 0.10 g initial PEO.
The dense layer has the highest sodium concentration, while the porous bulk material, as shown in the previous sections, is poor in sodium. The intermediate area is distinguished by a higher sodium concentration originating from sodium diffusion from the dense layer into the porous bulk material. Since the transport of Na-ions in Na-β-alumina is faster than in Al2O3, Na-enriched domains occur predominantly within the domains already rich in Na-β-alumina, and not homogeneously [44].
A diffusion of other elements contained by the dense layer, like Ti and Zr, could not be observed (cf. Figure S6). In contrast to the other samples, the intermediate area of the sample initially synthesized with 0.10 g PEO exhibits large defects. These are most certainly caused by internal stress during the sintering step, resulting in the phase transition from transition Al2O3 to porous Na-β-alumina.
At last, the ionic conductivity of the BEs was determined. The results are given in Figure 12.
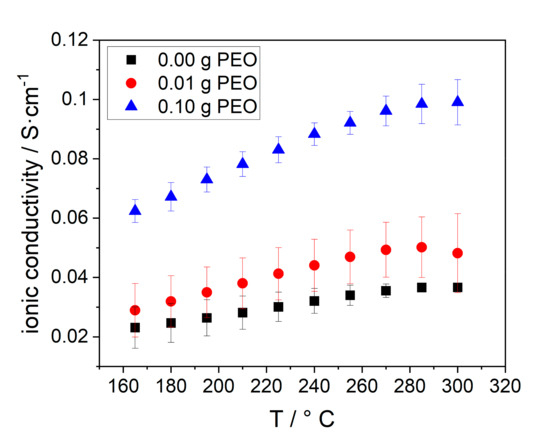
Figure 12.
Temperature dependent ohmic conductivity of electrolytes, synthesized with different amounts of initial PEO: 0.00 g (black squares), 0.01 g (red dots), 0.10 g (blue triangles).
The ionic conductivity of all samples increases with increasing temperature, due to the enhanced conductivity of Na-β-alumina and NaAlCl4. A higher initial PEO amount, and hereby, an increased Na-β-alumina phase content in the disc in combination with the porosity also increased the conductivity. Consequently, the BE with 0.10 g initial PEO has the highest ionic conductivity of 0.10 S∙cm−1 at 300 °C, while the sample without PEO only has an ionic conductivity of 0.037 S∙cm−1. The stagnation of the conductivity between 280 and 300 °C can possibly be explained by the increasing resistance of sodium. Jung et al. reached a lower conductivity of 0.015 S∙cm−1 at 300 °C in a similar measurement setup. The reason for the relatively low conductivity is the high amount of isolating ZrO2 (40 vol.%) and a partially closed porosity. [21] Furthermore, the high surface tension of liquid sodium could potentially hinder the infiltration of the porous support.
A study from Zhu et al. [42] showed that the correct number of Na-ions in Na-β-alumina electrolytes is crucial to achieving high ionic conductivity. By reducing the Na2O to Al2O3 ratio from the optimum level of 1/5 to 1/7, the Na-β”-alumina phase content of the synthesized electrolytes dropped, and thereby, the ionic conductivity was reduced from 6.6 × 10⁻³ to 3.7 × 10⁻⁵ S∙cm−1 at 300 °C. This observation can mainly be explained by the collapse of percolation pathways of Na-β-alumina particles and a lack of Na-ions within the Na-β-alumina structure.
Due to the lower Na-β-alumina phase content in the bulk material synthesized with 0.00 and 0.01 g PEO, the conductive paths for Na-ions are limited, while the BE with an initial PEO amount of 0.10 g has more conduction paths. This can be related to the higher Na-β-alumina phase content. As discussed in Section 3.2.1 and Section 3.3, PEO alters the Al2O3 phase conversion and porosity. The conductivity is, hence, only indirectly influenced by PEO.
Additionally, both the larger amount and size of NalAlCl4-filled pores in the samples prepared with higher initial PEO amounts enable a better conductivity within the bulk layer.
However, since the BEs with 0.01 g and 0.10 g initial PEO display similar porosities, but very different ionic conductivities, while the BE with 0.00 g and 0.01 g initial PEO have similar ionic conductivities, but different pore sizes, the role of pores within the three tested samples seems to be minor compared to the phase content. It can be concluded that the ion transport in the bulk layer is not only achieved by the pores filled with NaAlCl4, but also by the conductivity of the bulk material itself. High porosity and bulk conductivity are important to achieve a highly conductive electrolyte.
The electrochemical behavior of the material described in this work, motivates further research in the field of bilayer solid electrolytes. Most of the fundamentals, such as the orientation of the porous side within the battery, influence of the pore size and porosity (quantitatively), required thickness of the dense layer, and preparation route, have hardly been explored.
Further, research might focus on increasing the Na-β-alumina phase content through the established method of sodium infiltration or vapor phase conversion [44,45]. The goal is to hereby exceed the conductivity of 0.2 S∙cm−1 at 300 °C, which is typical for polycrystalline Na-β-alumina electrolytes.
4. Conclusions
In this work, a novel bilayer electrolyte for sodium-ion batteries was prepared and described. By integrating sodium-ions and PEO into the sol-gel synthesis, a mesoporous xerogel is formed, wherein 0.10 g PEO leads to additional spherical cavities by phase separation. Through the further processing of the granulate to a calcined disc, a macroporous α-Al2O3 disc containing Na-β-alumina could be successfully produced.
The porous disc was successfully spin coated with Na-β-alumina to produce bilayer electrolytes. The electrolytes were characterized regarding phase composition, morphology, and conductivity in an application near (Na/NiCl2-cell) environment. The measured conductivity of 0.10 S∙cm−1 at 300 °C is plausible compared to other solid electrolytes, but still lower than the typical conductivity of dense bulk Na-β-alumina (about 0.2 S∙cm−1 at 300 °C). The results motivate further in-depth studies on how the electrochemical behavior of bilayer electrolytes changes with the preparation method and material properties.
Further research will focus on increasing the Na-β-alumina phase content of the porous bulk material, which was found to be the most promising way to improve the bilayer electrolyte performance.
Supplementary Materials
The following are available online at https://www.mdpi.com/1996-1944/14/4/854/s1, Table S1: Spin-coating regime to coat calcined discs, Table S2: The modal pore size (dmod), pore volume (VP) and porosity (P) were determined by mercury intrusion measurement of calcined xerogels with different initial PEO amount. The detected pore structure above 100 nm is generated by the interparticle space and was hence omitted for the calculation of pore volume and porosity. The uncertainty of the measurement is ±5% of the modal pore size, ±0.05 cm3∙g−1 for pore volume and ±2% for porosity, Table S3: The modal pore size (dmod), pore volume (VP) and porosity (P) were determined by mercury intrusion measurement of the untreated disc with different initial PEO amounts (mPEO). See Table S2 for uncertainty, Figure S1: XRD pattern of NaAlCl4 (black). The red and the blue reflexes represent the literature data for NaAlCl4 (ICDD-database PDF 75-1164) and NaCl (ICDD-database PDF 05-0628). The dominant reflex at 25° is caused by an X-ray foil that protected the sample from moisture, Figure S2: Magnification of the DSC curves of the xerogels from Figure 4b, recorded with a heating rate of 10 K∙min−1. The sample without PEO is labeled black, the one containing 0.01 g PEO is labeled red. The sample labeled blue initially contained 0.10 g PEO and shows a shift for the exothermic peak around 1200 °C towards a slightly lower temperature, Figure S3: Cumulative (red) and relative pore volume (black) from the mercury intrusion of xerogels with (a) 0.00 g and (b) 0.10 g initial PEO, Figure S4: Cumulative (red) and relative pore volume (black) from the mercury intrusion of the untreated disc with (a) 0.00 g (b) 0.01 g and (c) 0.10 g initial PEO, Figure S5: Cumulative (red) and relative pore volume (black) from the mercury intrusion of the disc heat treated at 1400 °C for 2 h with (a) 0.00 g (b) 0.01 g and (c) 0.10 g initial PEO, Figure S6: XRD patterns of BEs synthesized with different initial PEO amounts of 0.00 g PEO (black), 0.01 g (red) and 0.01 g (blue). The main reflexes α-Al2O3 and Na--alumina are labeled with green squares and red triangles, respectively.
Author Contributions
Conceptualization, C.D., K.S., A.H., S.K.; methodology, C.D., K.S., A.H., S.K.; validation C.D., K.S., A.H., S.K.; investigation, C.D., A.H.; resources, C.D., A.H.; writing-original draft preparation, C.D., A.H.; writing-review and editing, M.S. (Matthias Schulz); M.S. K.S., S.K., D.E., S.C.; visualization, C.D., A.H..; supervision, K.S., M.S. (Michael Stelter), M.S. (Matthias Schulz), S.K., D.E., S.C.; project administration, K.S., M.S. (Matthias Schulz), M.S. (Michael Stelter), S.K., D.E.; funding acquisition, K.S., M.S. (Matthias Schulz), M.S. (Michael Stelter), S.K., D.E. All authors have read and agreed to the published version of the manuscript.
Funding
This work was supported by the German Federal Ministry of Education and Research (project number 03XP0171A/B).
Data Availability Statement
The data presented in this study are available on request from the corresponding author.
Conflicts of Interest
The authors declare no conflict of interest.
References
- Hueso, K.B.; Palomares, V.; Armand, M.; Rojo, T. Challenges and perspectives on high and intermediate-temperature sodium batteries. Nano Res. 2017, 10, 4082–4114. [Google Scholar] [CrossRef]
- Adelhelm, P.; Hartmann, P.; Bender, C.L.; Busche, M.; Eufinger, C.; Janek, J. From lithium to sodium: Cell chemistry of room temperature sodium-air and sodium-sulfur batteries. Beilstein J. Nanotechnol. 2015, 6, 1016–1055. [Google Scholar] [CrossRef]
- Lu, X.; Lemmon, J.P.; Sprenkle, V.; Yang, Z. Sodium-beta alumina batteries: Status and challenges. JOM 2010, 62, 31–36. [Google Scholar] [CrossRef]
- Bragg, W.L.; Gottfried, C.; West, J. The Structure of β Alumina. Z. Krist. Cryst. Mater. 1931, 77, 255–274. [Google Scholar] [CrossRef]
- Sudworth, J.; Tiley, A.R. The Sodium Sulphur Battery; Chapman & Hall: London, UK, 1985. [Google Scholar]
- Dirksen, C.L.; Skadell, K.; Schulz, M.; Stelter, M. Effects of TiO2 doping on Li+-stabilized Na-β″-alumina for energy storage applications. Sep. Purif. Technol. 2019, 213, 88–92. [Google Scholar] [CrossRef]
- Bao, W.; Shuck, C.E.; Zhan, W.; Guo, X.; Gogotsi, Y.; Wang, G. Boosting Performance of Na-S Batteries Using Sulfur-Doped Ti3C2Tx MXene Nanosheets with a Strong Affinity to Sodium Polysulfides. ACS Nano 2019, 13, 11500–11509. [Google Scholar] [CrossRef] [PubMed]
- Shanmukaraj, D.; Kretschmer, K.; Sahu, T.; Bao, W.; Rojo, T.; Wang, G.; Armand, M. Highly Efficient, Cost Effective, and Safe Sodiation Agent for High-Performance Sodium-Ion Batteries. ChemSusChem 2018, 11, 3286–3291. [Google Scholar] [CrossRef]
- Zinth, V.; Schulz, M.; Seidlmayer, S.; Zanon, N.; Gilles, R.; Hofmann, M. Neutron Tomography and Radiography on a Sodium Metal Halide Cell under Operating Conditions. J. Electrochem. Soc. 2016, 163, A838–A845. [Google Scholar] [CrossRef]
- Sudworth, J.L.; Barrow, P.; Dong, W.; Dunn, B.; Farrington, G.C.; Thomas, J.O. Toward Commercialization of the beta-alumina family of ionic conductors. MRS Bull. 2000, 25, 22–26. [Google Scholar] [CrossRef]
- Lin, J.; Wen, Z.; Wang, X.; Song, S.; Liu, Y. Mechanochemical synthesis of Na-β/β″-Al2O3. J. Solid State Electrochem. 2010, 14, 1821–1827. [Google Scholar] [CrossRef]
- Zhu, C.; Xue, J.; Ji, G. Effect of Na2O content on properties of beta alumina solid electrolytes. Mater. Sci. Semicond. Process. 2015, 31, 487–492. [Google Scholar] [CrossRef]
- Hirata, Y.; Izaiku, T.; Ishihara, Y. Synthesis of dense β, β″–alumina ceramics by reaction sintering of Na2O-containing alumina compact. J. Mater. Res. 1991, 6, 585–591. [Google Scholar] [CrossRef]
- Butee, S.; Kambale, K.; Firodiya, M. Electrical properties of sodium beta-alumina ceramics synthesized by citrate sol-gel route using glycerine. PAC 2016, 10, 67–72. [Google Scholar] [CrossRef]
- Subasri, R. Microwave processing of sodium beta alumina. Solid State Ion. 2003, 158, 199–204. [Google Scholar] [CrossRef]
- Zhang, G.; Wen, Z.; Wu, X.; Zhang, J.; Ma, G.; Jin, J. Sol–gel synthesis of Mg2+ stabilized Na-β″/β-Al2O3 solid electrolyte for sodium anode battery. J. Alloys Comp. 2014, 613, 80–86. [Google Scholar] [CrossRef]
- Agustina, A.I.; Skadell, K.; Dirksen, C.L.; Schulz, M.; Kusumocahyo, S.P. Sol-gel method for synthesis of Li+-stabilized Na-β-alumina for solid electrolytes in sodium-based batteries. In Proceedings of the 5th International Symposium on Applied Chemistry, Tangerang, Indonesia, 23–24 October 2019; AIP Publishing: Melville, NY, USA, 2019; p. 20070. [Google Scholar]
- Li, H.; Fan, H.; Zhang, J.; Wen, Y.; Chen, G.; Zhu, Y.; Lu, J.; Jiang, X.; Hu, B.; Ning, L. Sintering behavior and properties of lithium stabilized sodium β″—alumina ceramics with YSZ addition. Ceram. Int. 2019, 45, 6744–6752. [Google Scholar] [CrossRef]
- Bay, M.-C.; Heinz, M.V.F.; Figi, R.; Schreiner, C.; Basso, D.; Zanon, N.; Vogt, U.F.; Battaglia, C. Impact of Liquid Phase Formation on Microstructure and Conductivity of Li-Stabilized Na-β″-alumina Ceramics. ACS Appl. Energy Mater. 2019, 2, 687–693. [Google Scholar] [CrossRef]
- Javadi-Doodran, T. Microstructure and Conductivity of the Sodium Nickel Chloride (ZEBRA) Battery Cathode. Ph.D. Thesis, McMaster University, Hamilton, ON, Canada, 2012. [Google Scholar]
- Jung, K.; Chang, H.-J.; Bonnett, J.F.; Canfield, N.L.; Sprenkle, V.L.; Li, G. An advanced Na-NiCl2 battery using bi-layer (dense/micro-porous) β″-alumina solid-state electrolytes. J. Power Sources 2018, 396, 297–303. [Google Scholar] [CrossRef]
- Fukui, K.; Suzuki, Y. Reactive sintering and particle morphology control of β″-alumina-based water purification filters. J. Mater. Sci. 2018, 53, 1005–1013. [Google Scholar] [CrossRef]
- Sakka, Y. Fabrication of oriented β-alumina from porous bodies by slip casting in a high magnetic field. Solid State Ion. 2004, 172, 341–347. [Google Scholar] [CrossRef]
- Tokudome, Y.; Fujita, K.; Nakanishi, K.; Miura, K.; Hirao, K. Synthesis of Monolithic Al2O3 with Well-Defined Macropores and Mesostructured Skeletons via the Sol-Gel Process Accompanied by Phase Separation. Chem. Mater. 2007, 19, 3393–3398. [Google Scholar] [CrossRef]
- Baumann, T.F.; Gash, A.E.; Chinn, S.C.; Sawvel, A.M.; Maxwell, R.S.; Satcher, J.H. Synthesis of High-Surface-Area Alumina Aerogels without the Use of Alkoxide Precursors. Chem. Mater. 2005, 17, 395–401. [Google Scholar] [CrossRef]
- Carstens, S.; Enke, D. Investigation of the formation process of highly porous α-Al2O3 via citric acid-assisted sol-gel synthesis. J. Eur. Ceram. Soc. 2019, 39, 2493–2502. [Google Scholar] [CrossRef]
- Hill, M.R.; Bastow, T.J.; Celotto, S.; Hill, A.J. Integrated Study of the Calcination Cycle from Gibbsite to Corundum. Chem. Mater. 2007, 19, 2877–2883. [Google Scholar] [CrossRef]
- Dam, C.Q.; Brezny, R.; Green, D.J. Compressive behavior and deformation-mode map of an open cell alumina. J. Mater. Res. 1990, 5, 163–171. [Google Scholar] [CrossRef]
- Guzmán-Castillo, M.L.; Bokhimi, X.; Toledo-Antonio, A.; Salmones-Blásquez, J.; Hernández-Beltrán, F. Effect of Boehmite Crystallite Size and Steaming on Alumina Properties. J. Phys. Chem. B 2001, 105, 2099–2106. [Google Scholar] [CrossRef]
- Tokudome, Y.; Nakanishi, K.; Kanamori, K.; Fujita, K.; Akamatsu, H.; Hanada, T. Structural characterization of hierarchically porous alumina aerogel and xerogel monoliths. J. Colloid Interface Sci. 2009, 338, 506–513. [Google Scholar] [CrossRef]
- Rybicki, G.C.; Smialek, J.L. Effect of the θ-α-Al2O3 transformation on the oxidation behavior of β-NiAl + Zr. Oxid. Met. 1989, 31, 275–304. [Google Scholar] [CrossRef]
- Tokudome, Y.; Nakanishi, K.; Kanamori, K.; Hanada, T. In situ SAXS observation on metal-salt-derived alumina sol-gel system accompanied by phase separation. J. Colloid Interface Sci. 2010, 352, 303–308. [Google Scholar] [CrossRef]
- Kwon, K.-W.; Park, M.J.; Hwang, J.; Char, K. Effects of Alcohol Addition on Gelation in Aqueous Solution of Poly(ethylene oxide)-Poly(propylene oxide)-Poly(ethylene oxide) Triblock Copolymer. Polym. J. 2001, 33, 404–410. [Google Scholar] [CrossRef]
- Waghorne, W.E. Thermodynamics of solvation in mixed solvents. Chem. Soc. Rev. 1993, 22, 285. [Google Scholar] [CrossRef]
- Armstrong, J.; Chowdhry, B.; Mitchell, J.; Beezer, A.; Leharne, S. Effect of Cosolvents and Cosolutes upon Aggregation Transitions in Aqueous Solutions of the Poloxamer F87 (Poloxamer P237): A High Sensitivity Differential Scanning Calorimetry Study. J. Phys. Chem. 1996, 100, 1738–1745. [Google Scholar] [CrossRef]
- Parekh, P.; Singh, K.; Marangoni, D.G.; Bahadur, P. Effect of alcohols on aqueous micellar solutions of PEO–PPO–PEO copolymers: A dynamic light scattering and 1H NMR study. J. Mol. Liq. 2012, 165, 49–54. [Google Scholar] [CrossRef]
- Lightfoot, P.; Mehta, M.A.; Bruce, P.G. Structure of the poly(ethylene oxide)–sodium perchlorate complex PEO3–NaClO4 from powder X-ray diffraction data. J. Mater. Chem. 1992, 2, 379–381. [Google Scholar] [CrossRef]
- Ratner, M.A.; Shriver, D.F. Ion transport in solvent-free polymers. Chem. Rev. 1988, 88, 109–124. [Google Scholar] [CrossRef]
- Mathews, T. Solution combustion synthesis of magnesium compensated sodium-β-aluminas. Mater. Sci. Eng. B 2000, 78, 39–43. [Google Scholar] [CrossRef]
- Wei, X.; Cao, Y.; Lu, L.; Yang, H.; Shen, X. Synthesis and characterization of titanium doped sodium beta″-alumina. J. Alloys Compd. 2011, 509, 6222–6226. [Google Scholar] [CrossRef]
- Cheluget, E.L.; Gelinas, S.; Vera, J.H.; Weber, M.E. Liquid-liquid equilibirium of aqueous mixtures of poly(propyleneglycol) with NaCl. J. Chem. Eng. Data 1994, 39, 127–130. [Google Scholar] [CrossRef]
- Zhu, C.; Hong, Y.; Huang, P. Synthesis and characterization of NiO doped beta-Al2O3 solid electrolyte. J. Alloys Compd. 2016, 688, 746–751. [Google Scholar] [CrossRef]
- Zhao, K.; Liu, Y.; Zeng, S.M.; Yang, J.H.; Liu, Y.W.; Zhan, Z.L.; Song, L. Preparation and characterization of a ZrO2–TiO2-co-doped Na-β′′-Al2O3 ceramic thin film. Ceram. Int. 2016, 42, 8990–8996. [Google Scholar] [CrossRef]
- Parthasarathy, P.; Virkar, A.V. Vapor Phase Conversion of α-Alumina + Zirconia Composites into Sodium Ion Conducting Na-β″-Alumina + Zirconia Solid Electrolytes. J. Electrochem. Soc. 2013, 160, A2268–A2280. [Google Scholar] [CrossRef]
- Park, J.-H.; Kim, K.-H.; Cho, J.-M.; Lim, S.-K. Fabrication of β- and β″-Al2O3 tubes by pressureless powder packing forming and salt infiltration. J. Mater. Sci. 1998, 33, 5695–5702. [Google Scholar] [CrossRef]
Publisher’s Note: MDPI stays neutral with regard to jurisdictional claims in published maps and institutional affiliations. |
© 2021 by the authors. Licensee MDPI, Basel, Switzerland. This article is an open access article distributed under the terms and conditions of the Creative Commons Attribution (CC BY) license (http://creativecommons.org/licenses/by/4.0/).