
Analysis of Performance Losses and Degradation Mechanism in Porous La2−X NiTiO6−δ:YSZ Electrodes

 , , and
Abstract
1. Introduction
2. Experimental Section
2.1. Sample Preparation
2.2. Characterisation Techniques
3. Results and Discussion
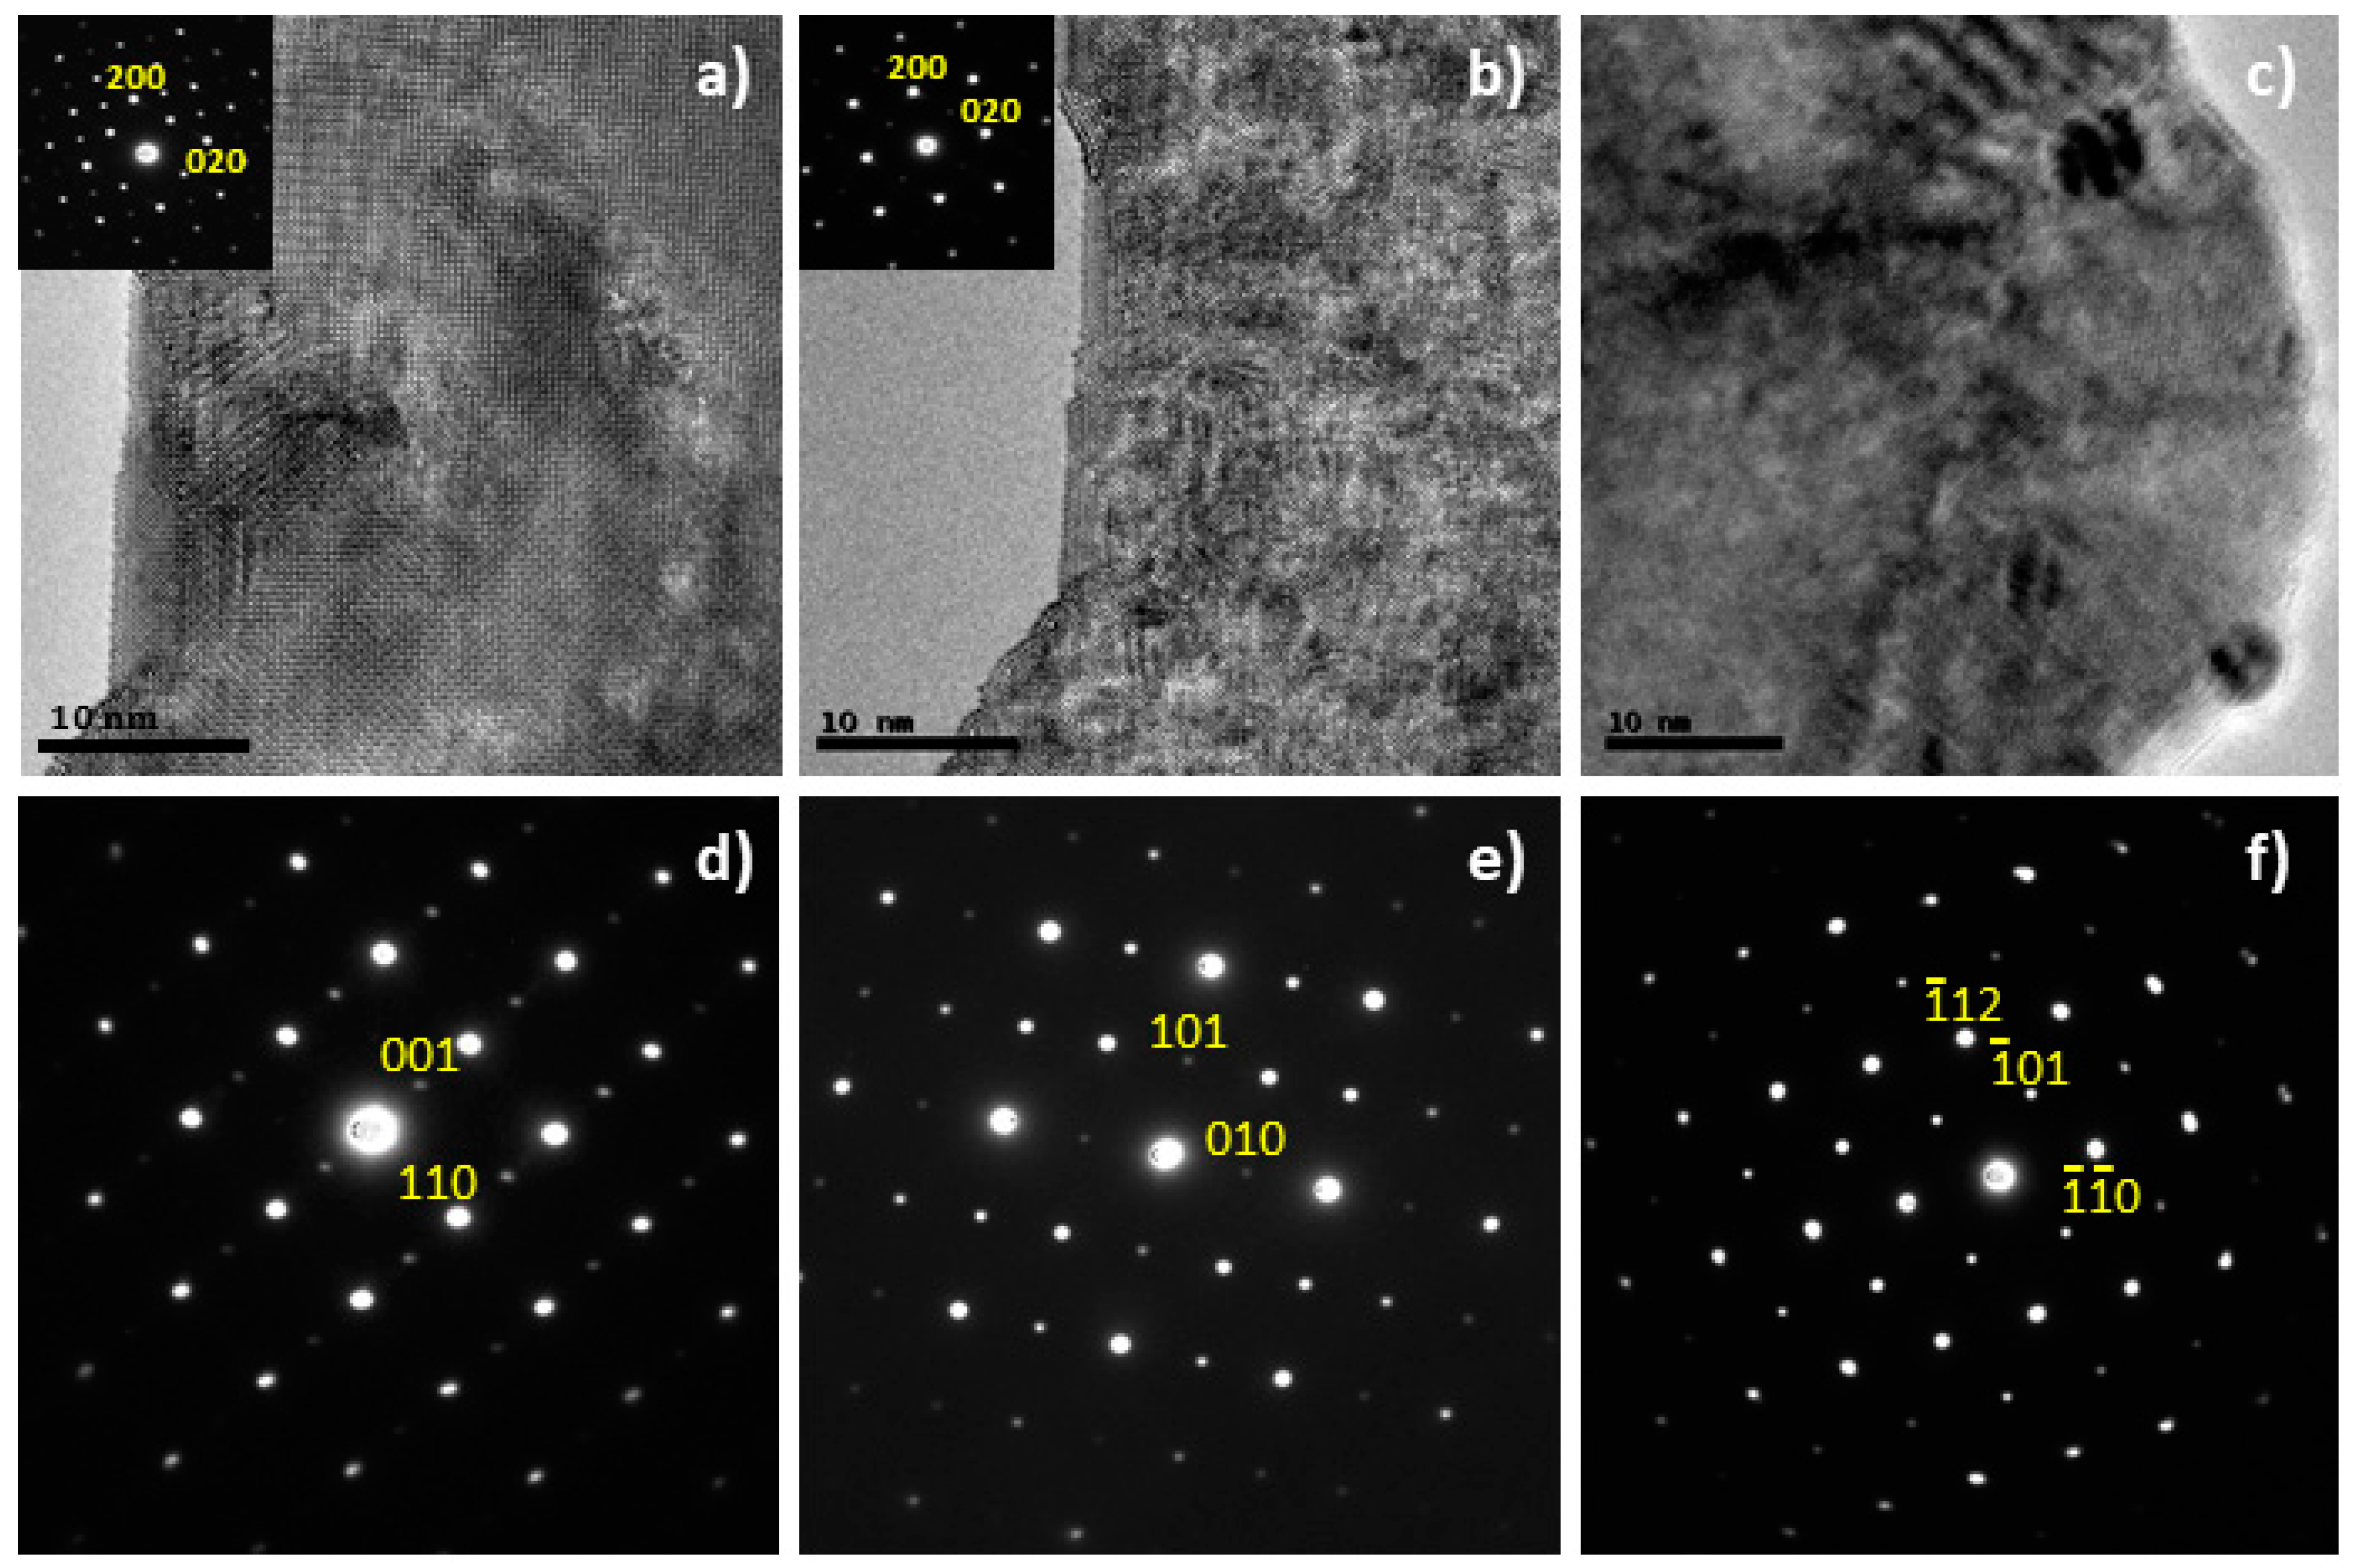
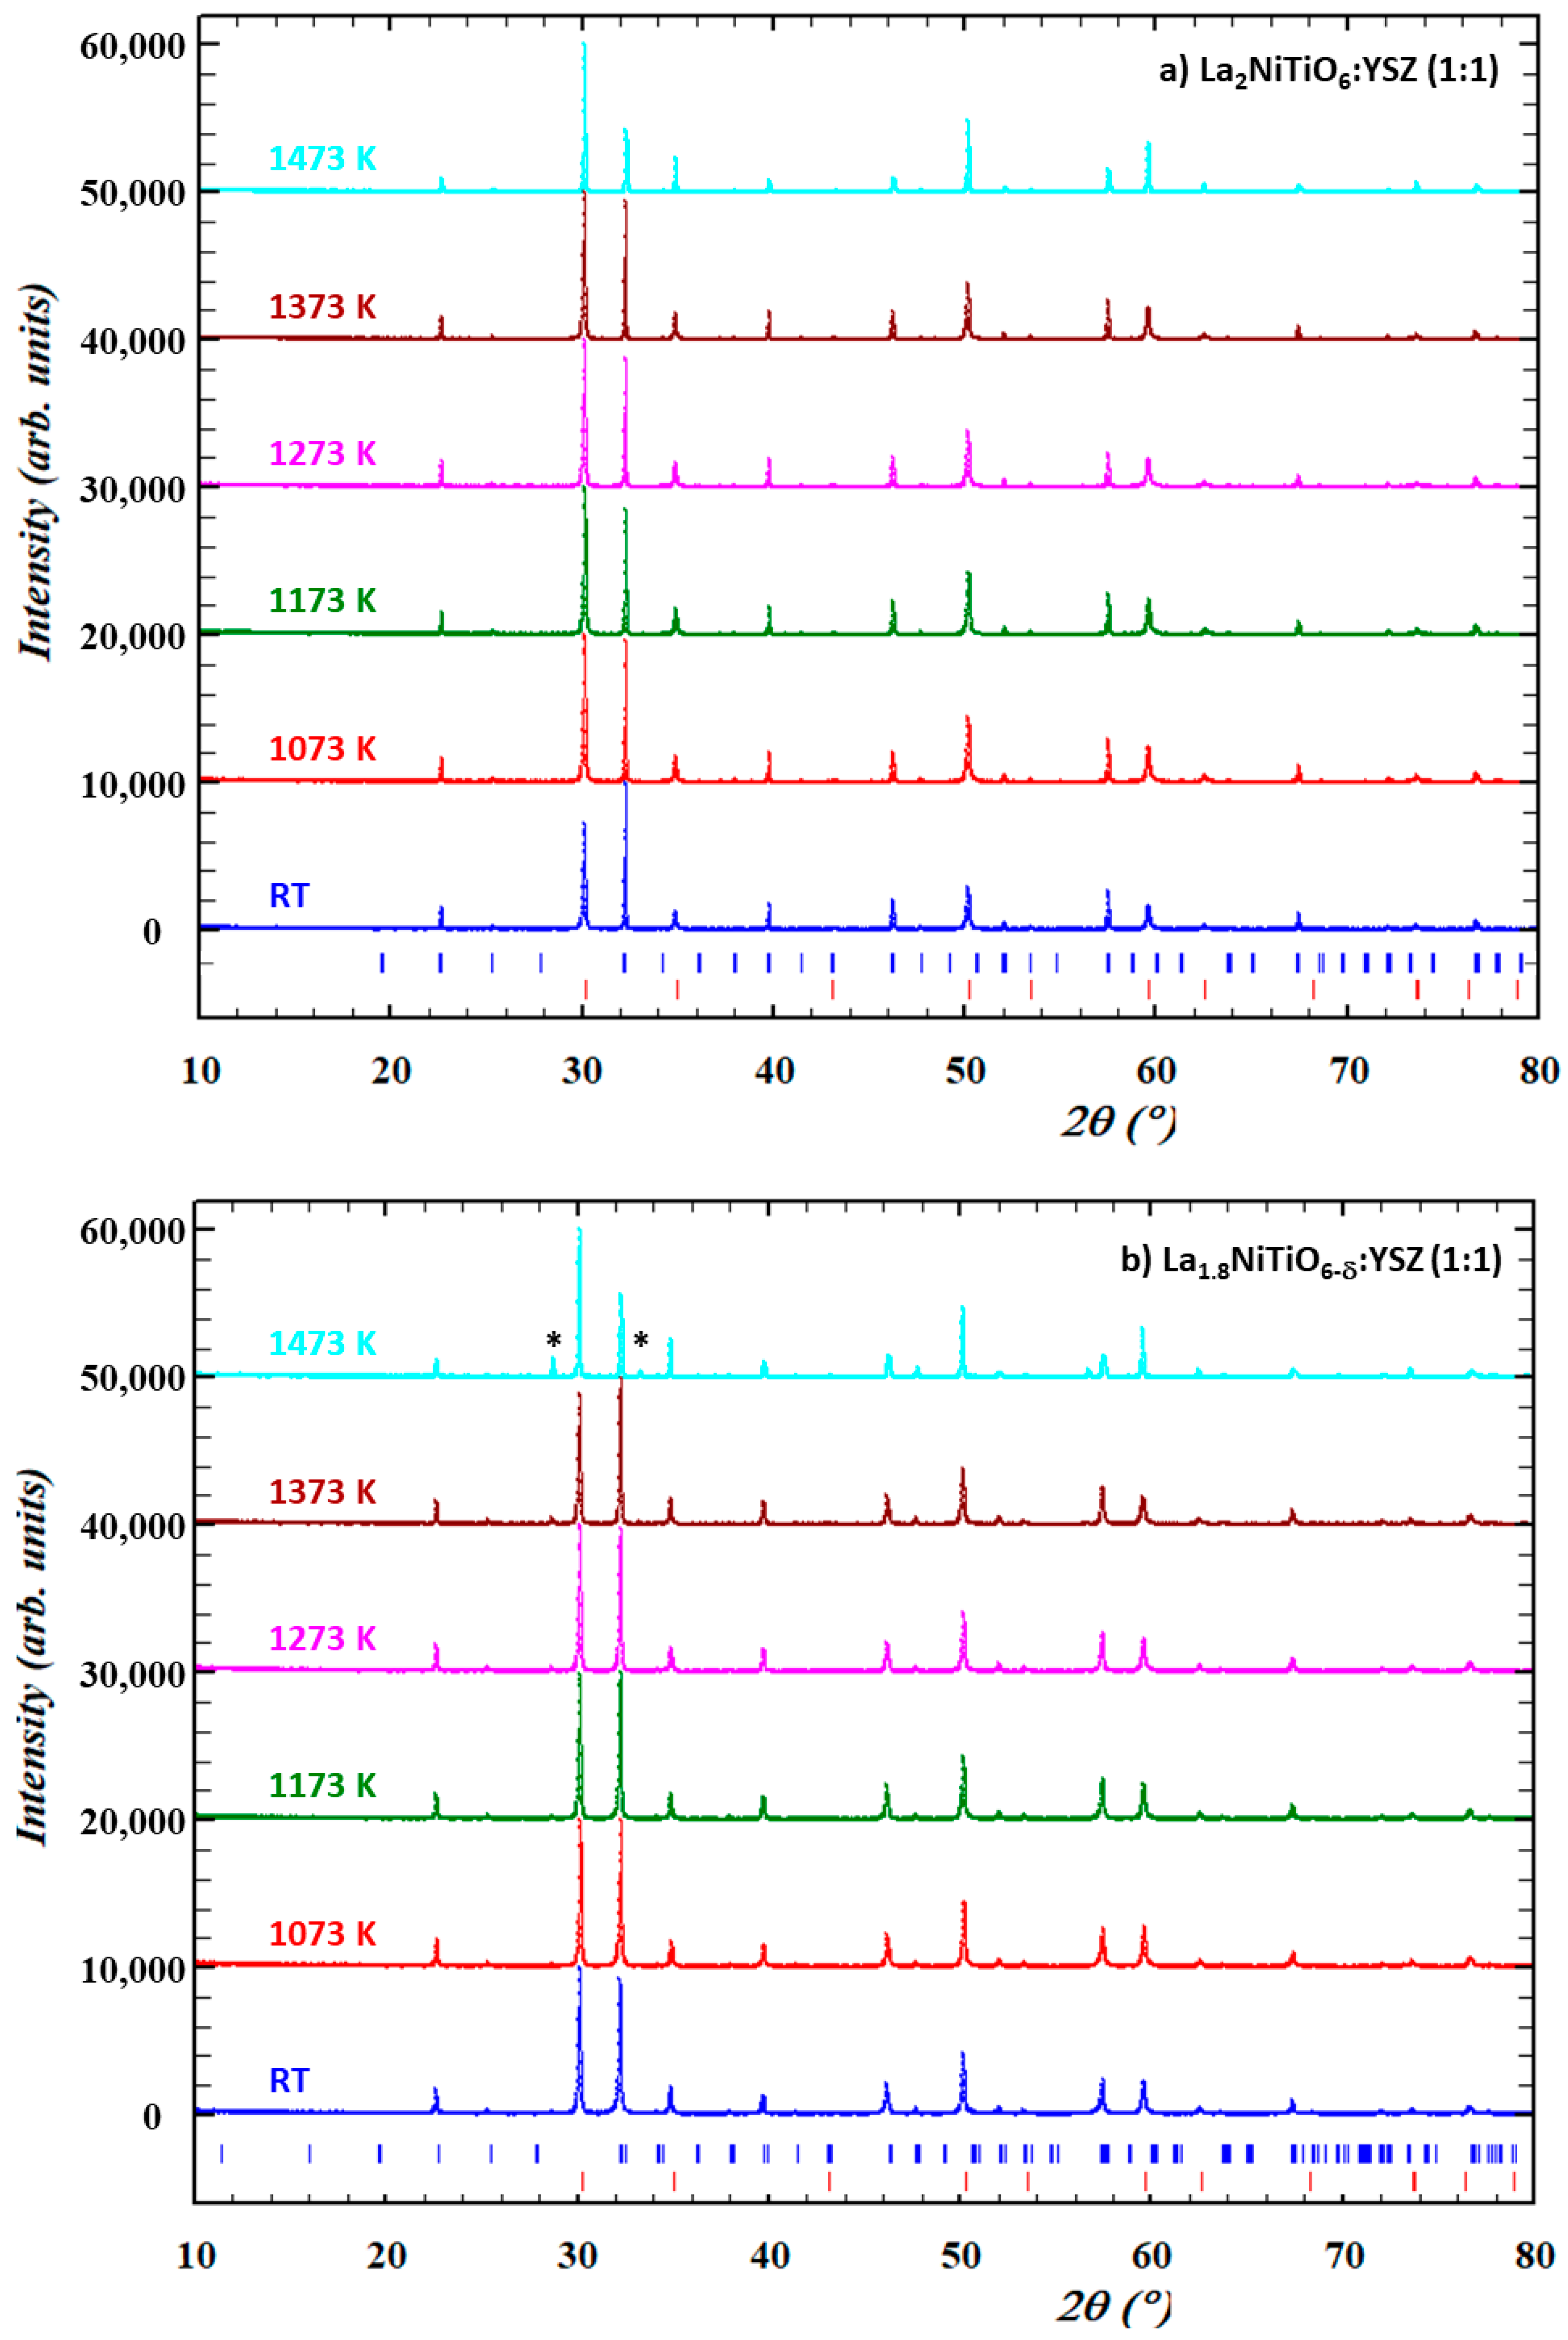
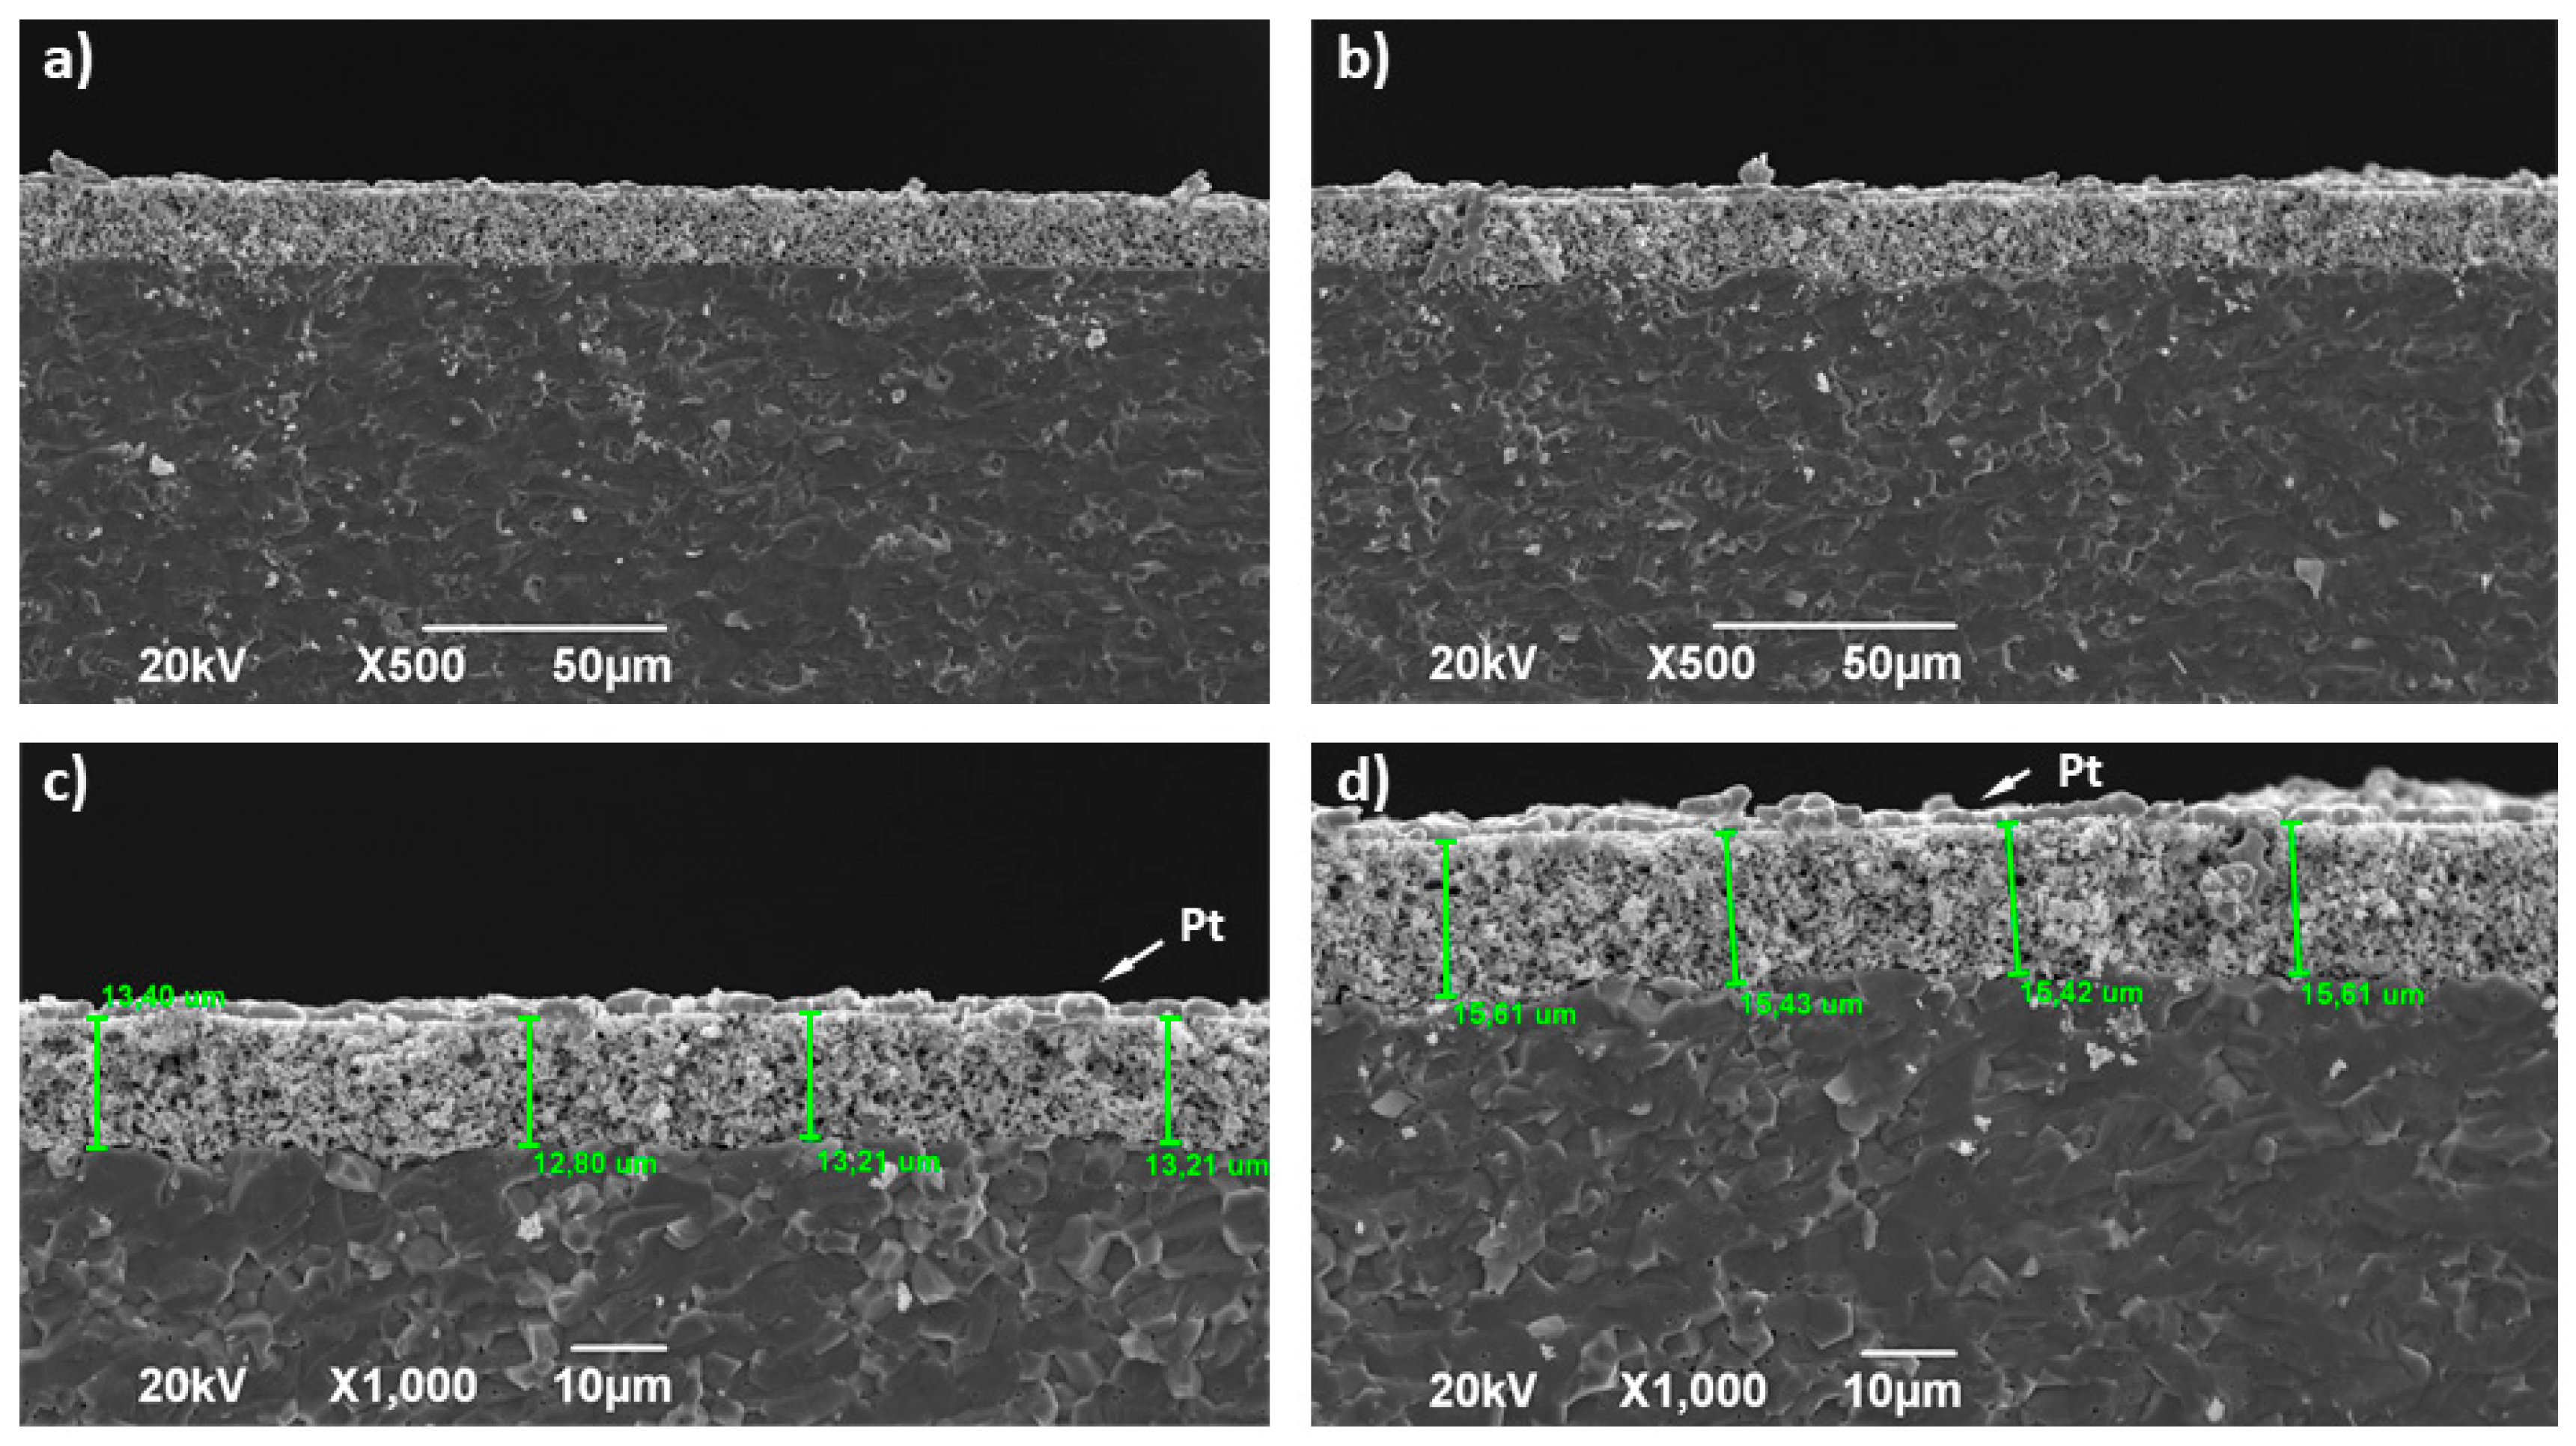
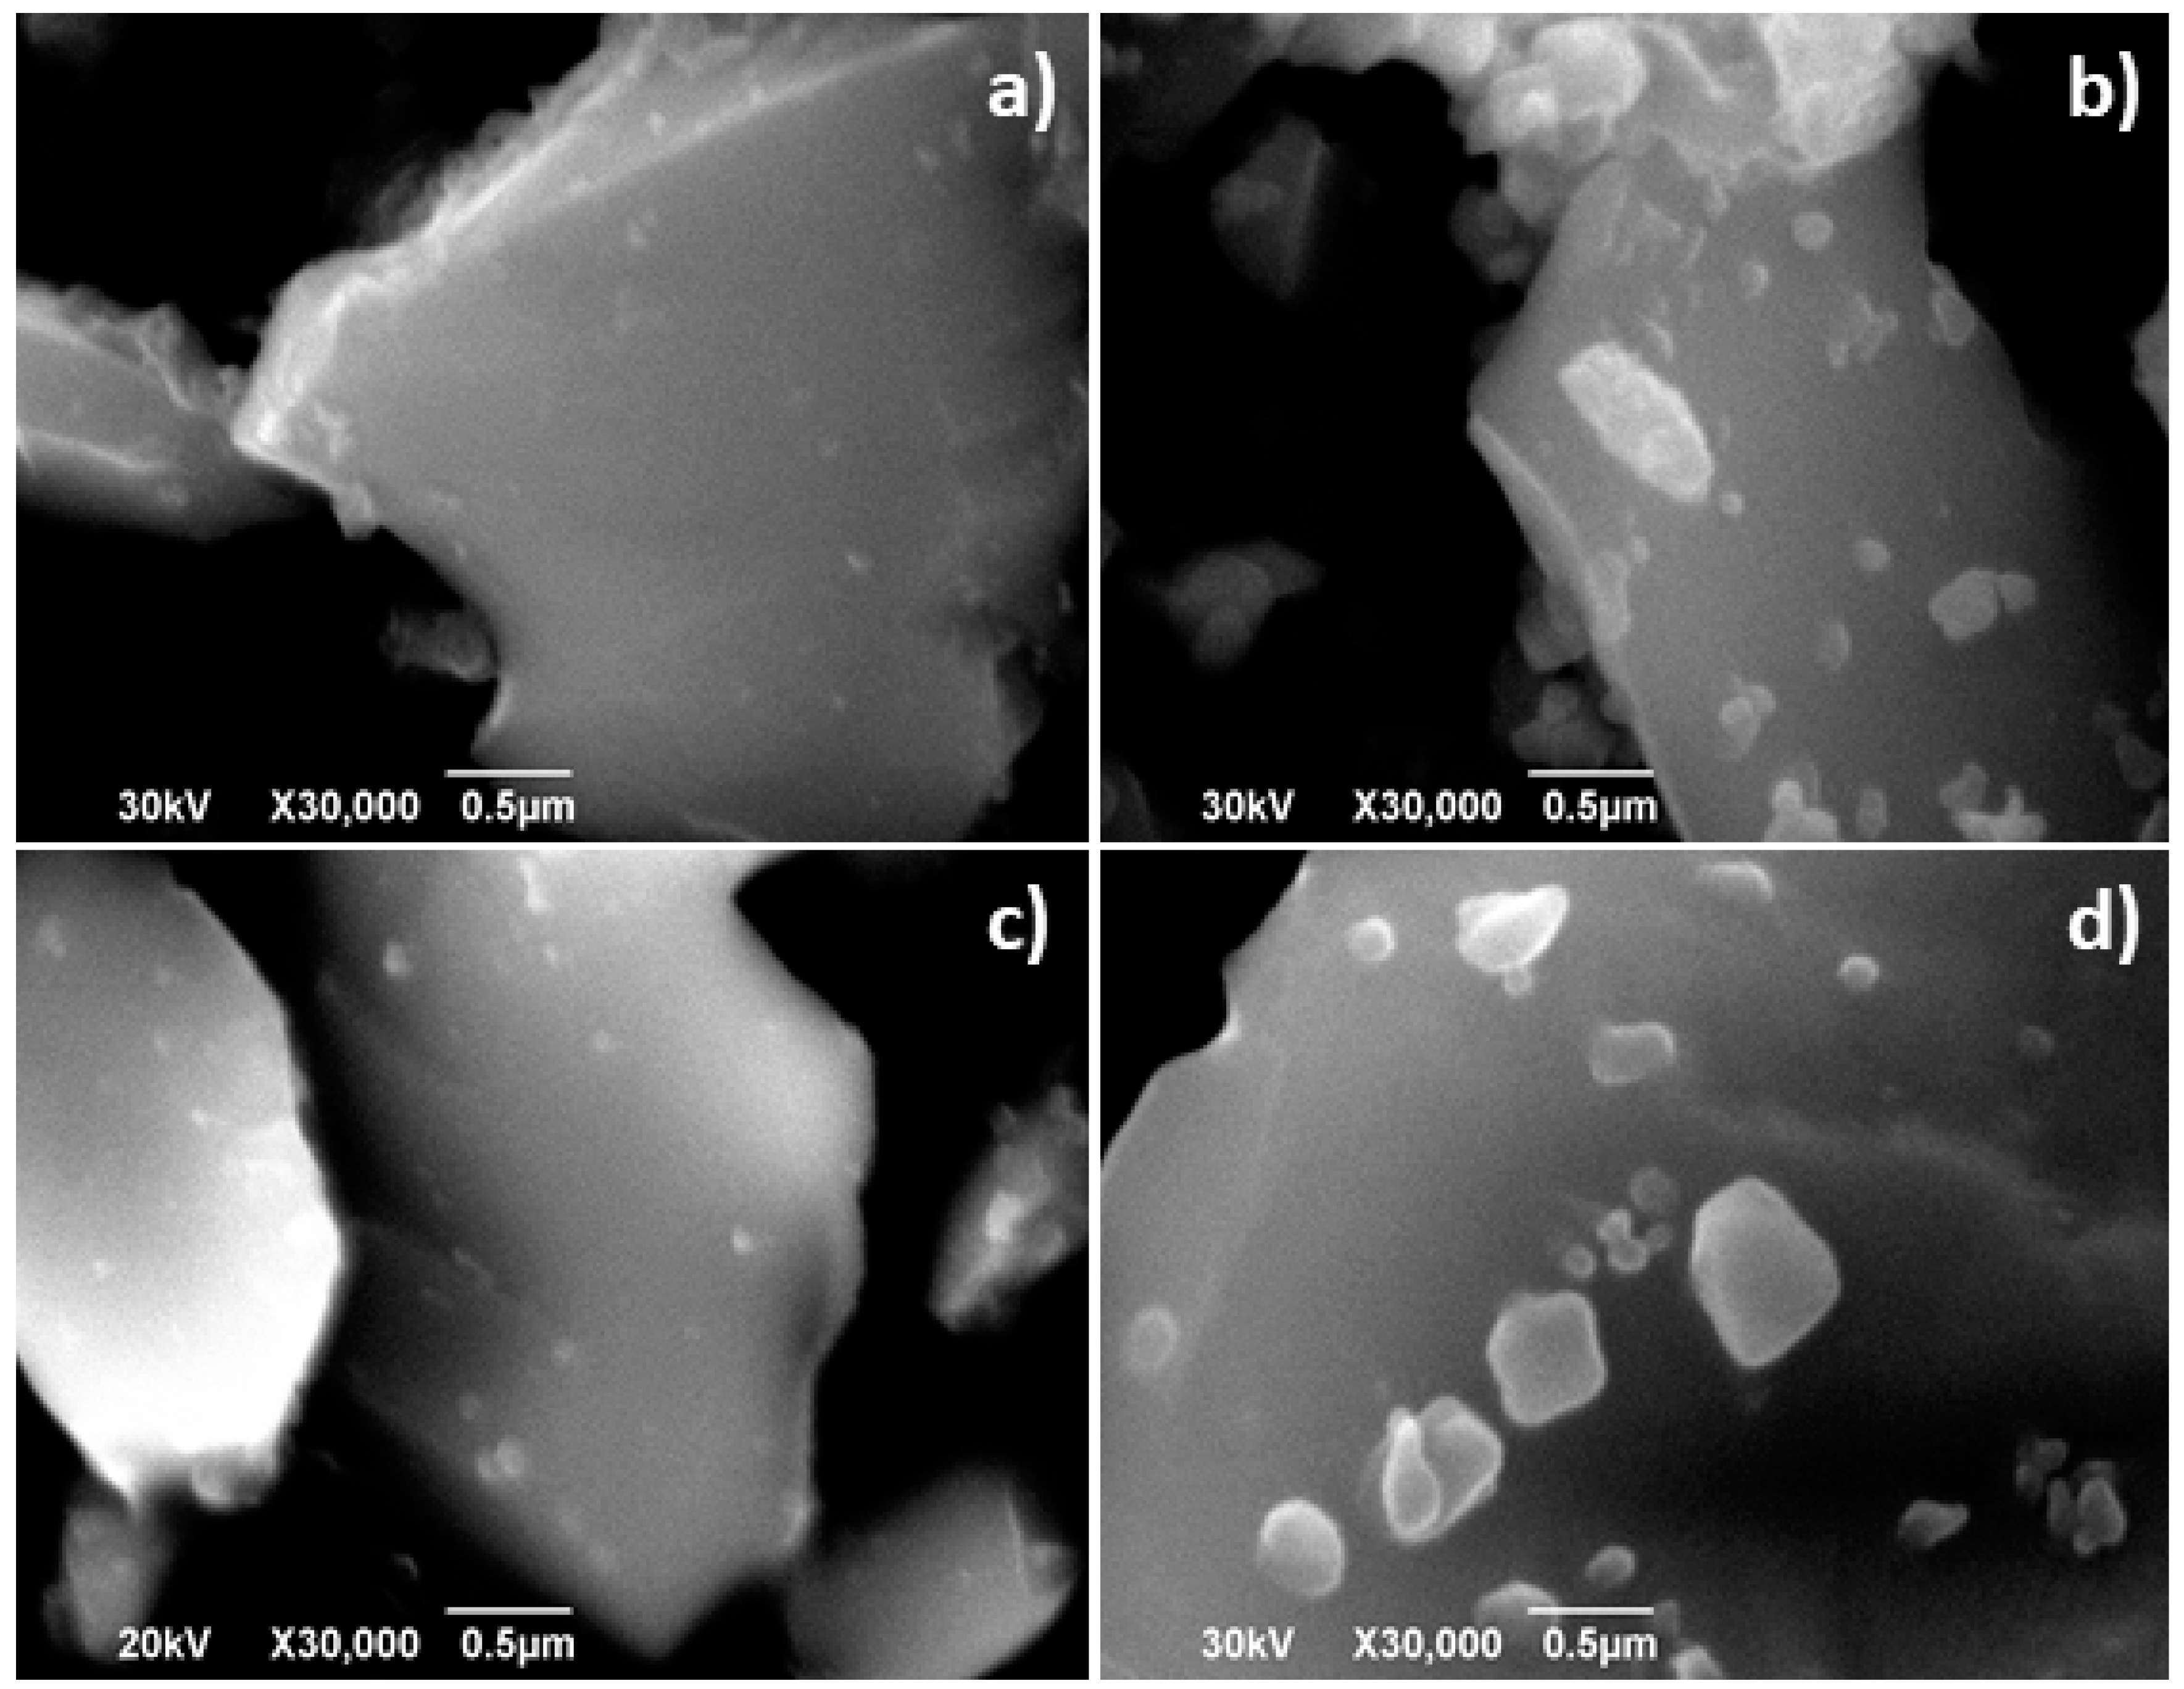
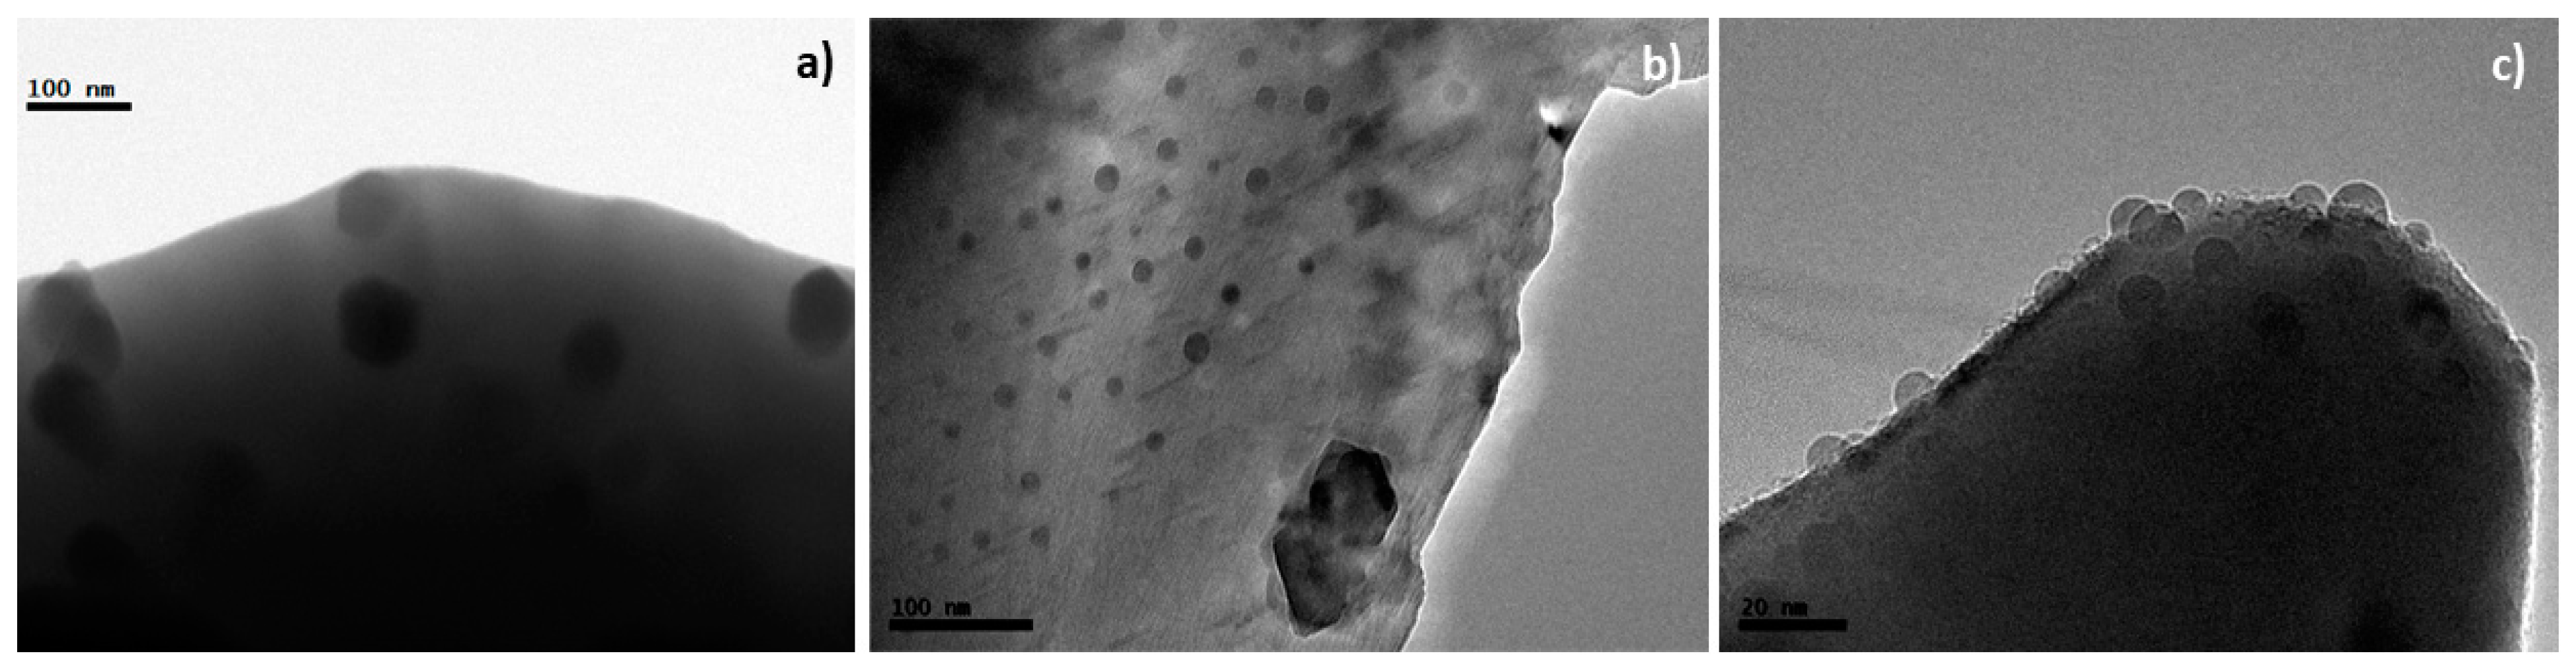
3.1. Structural Characterisation
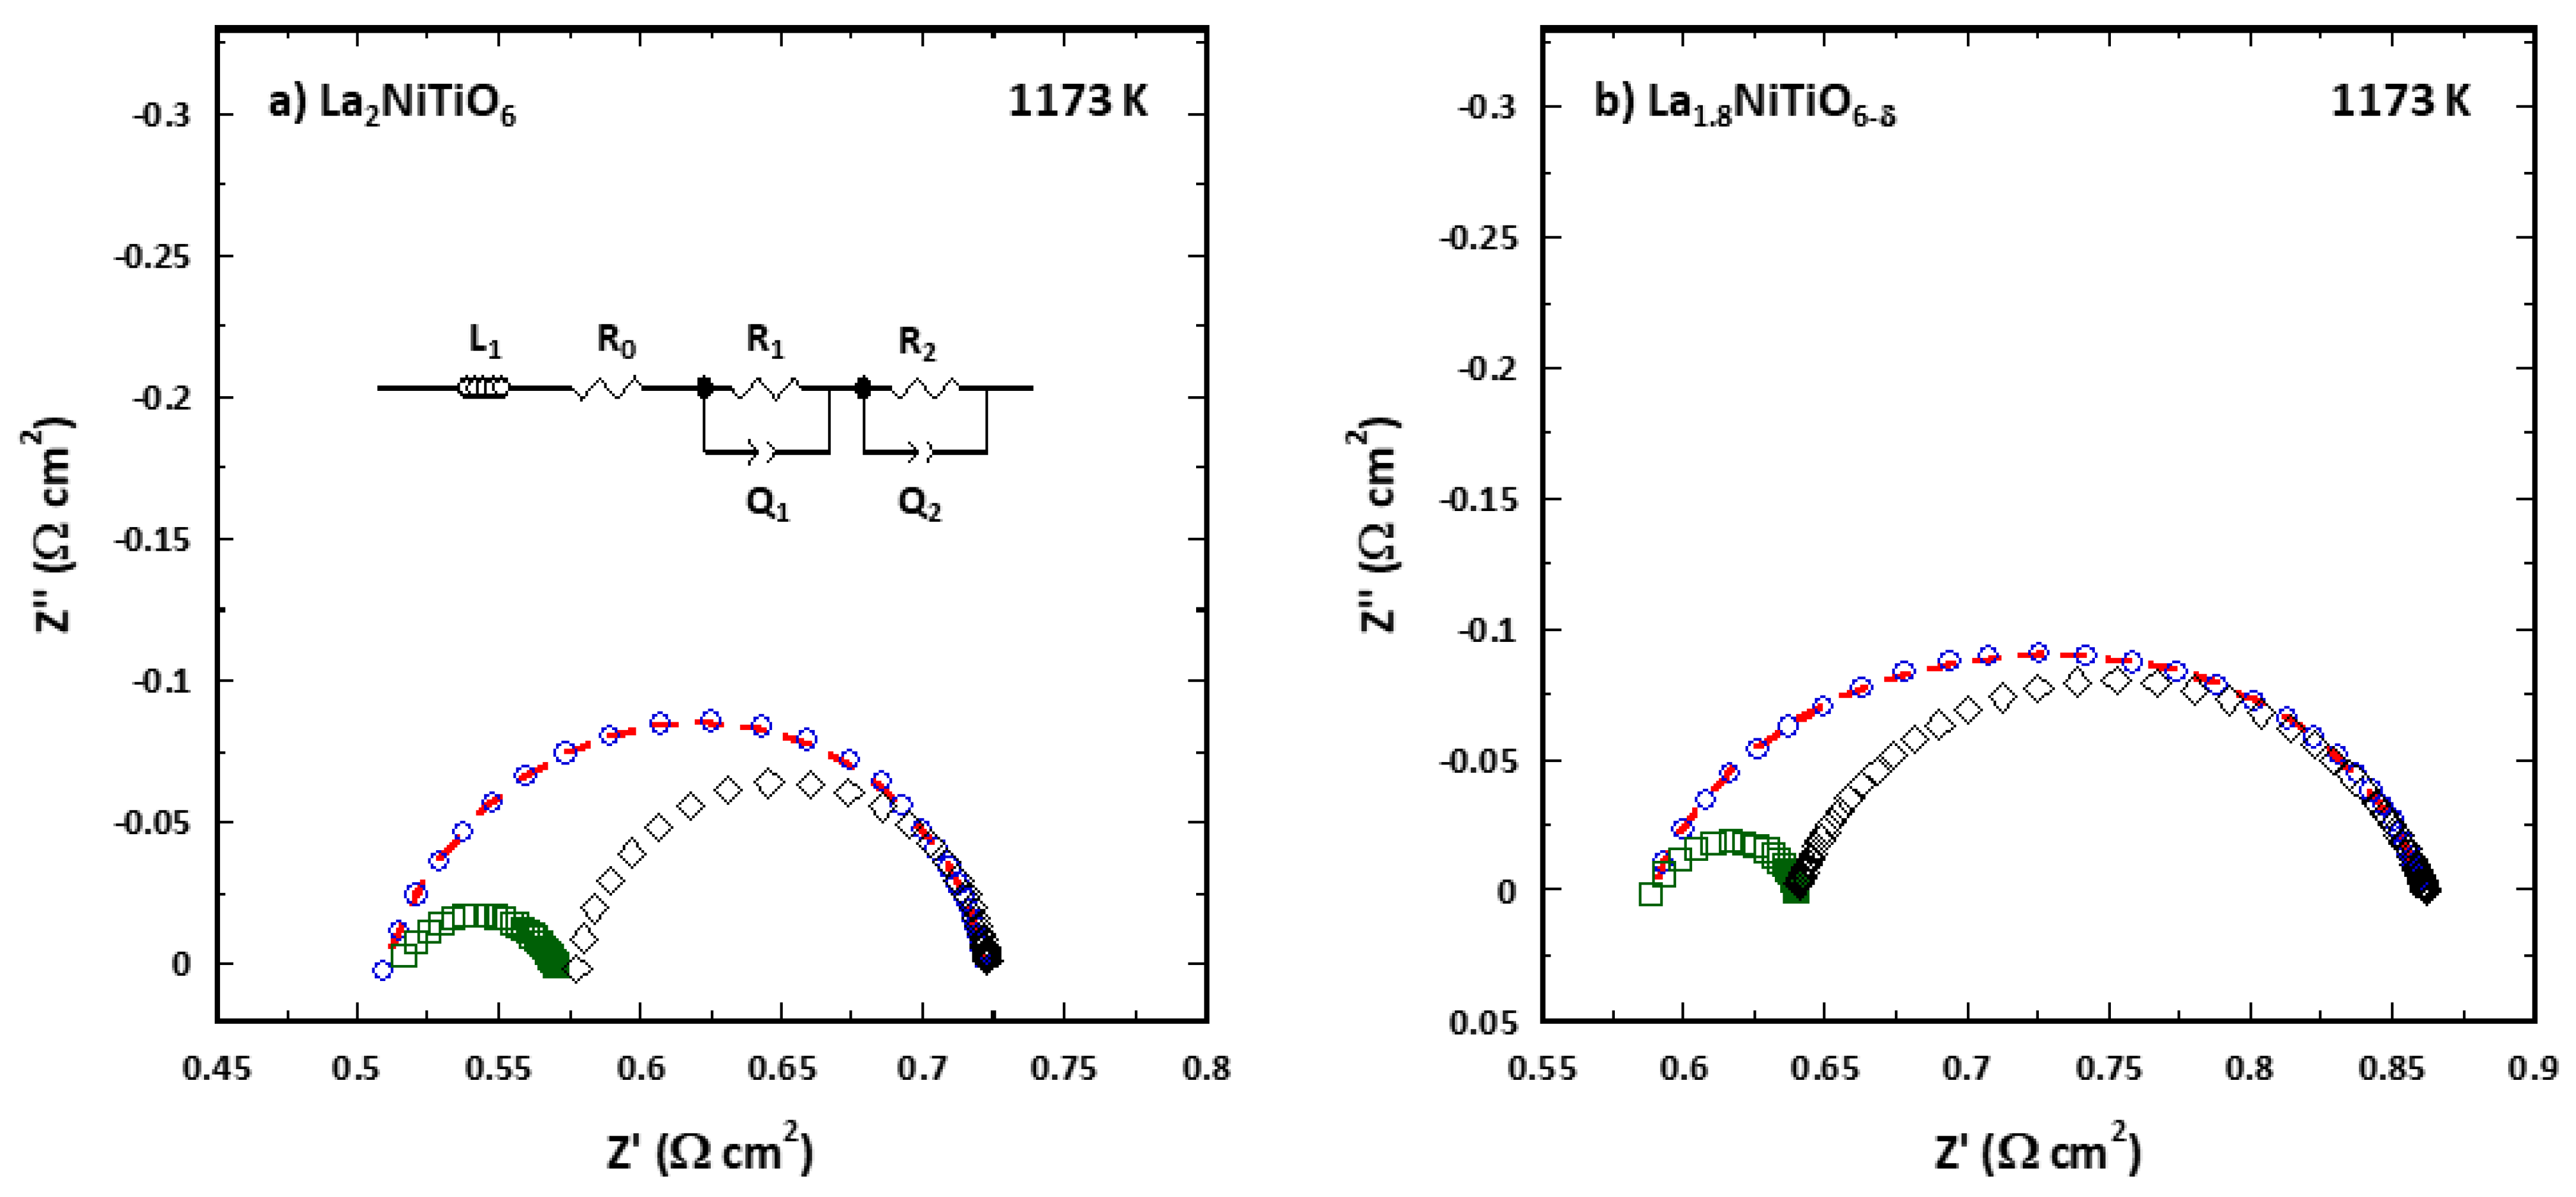
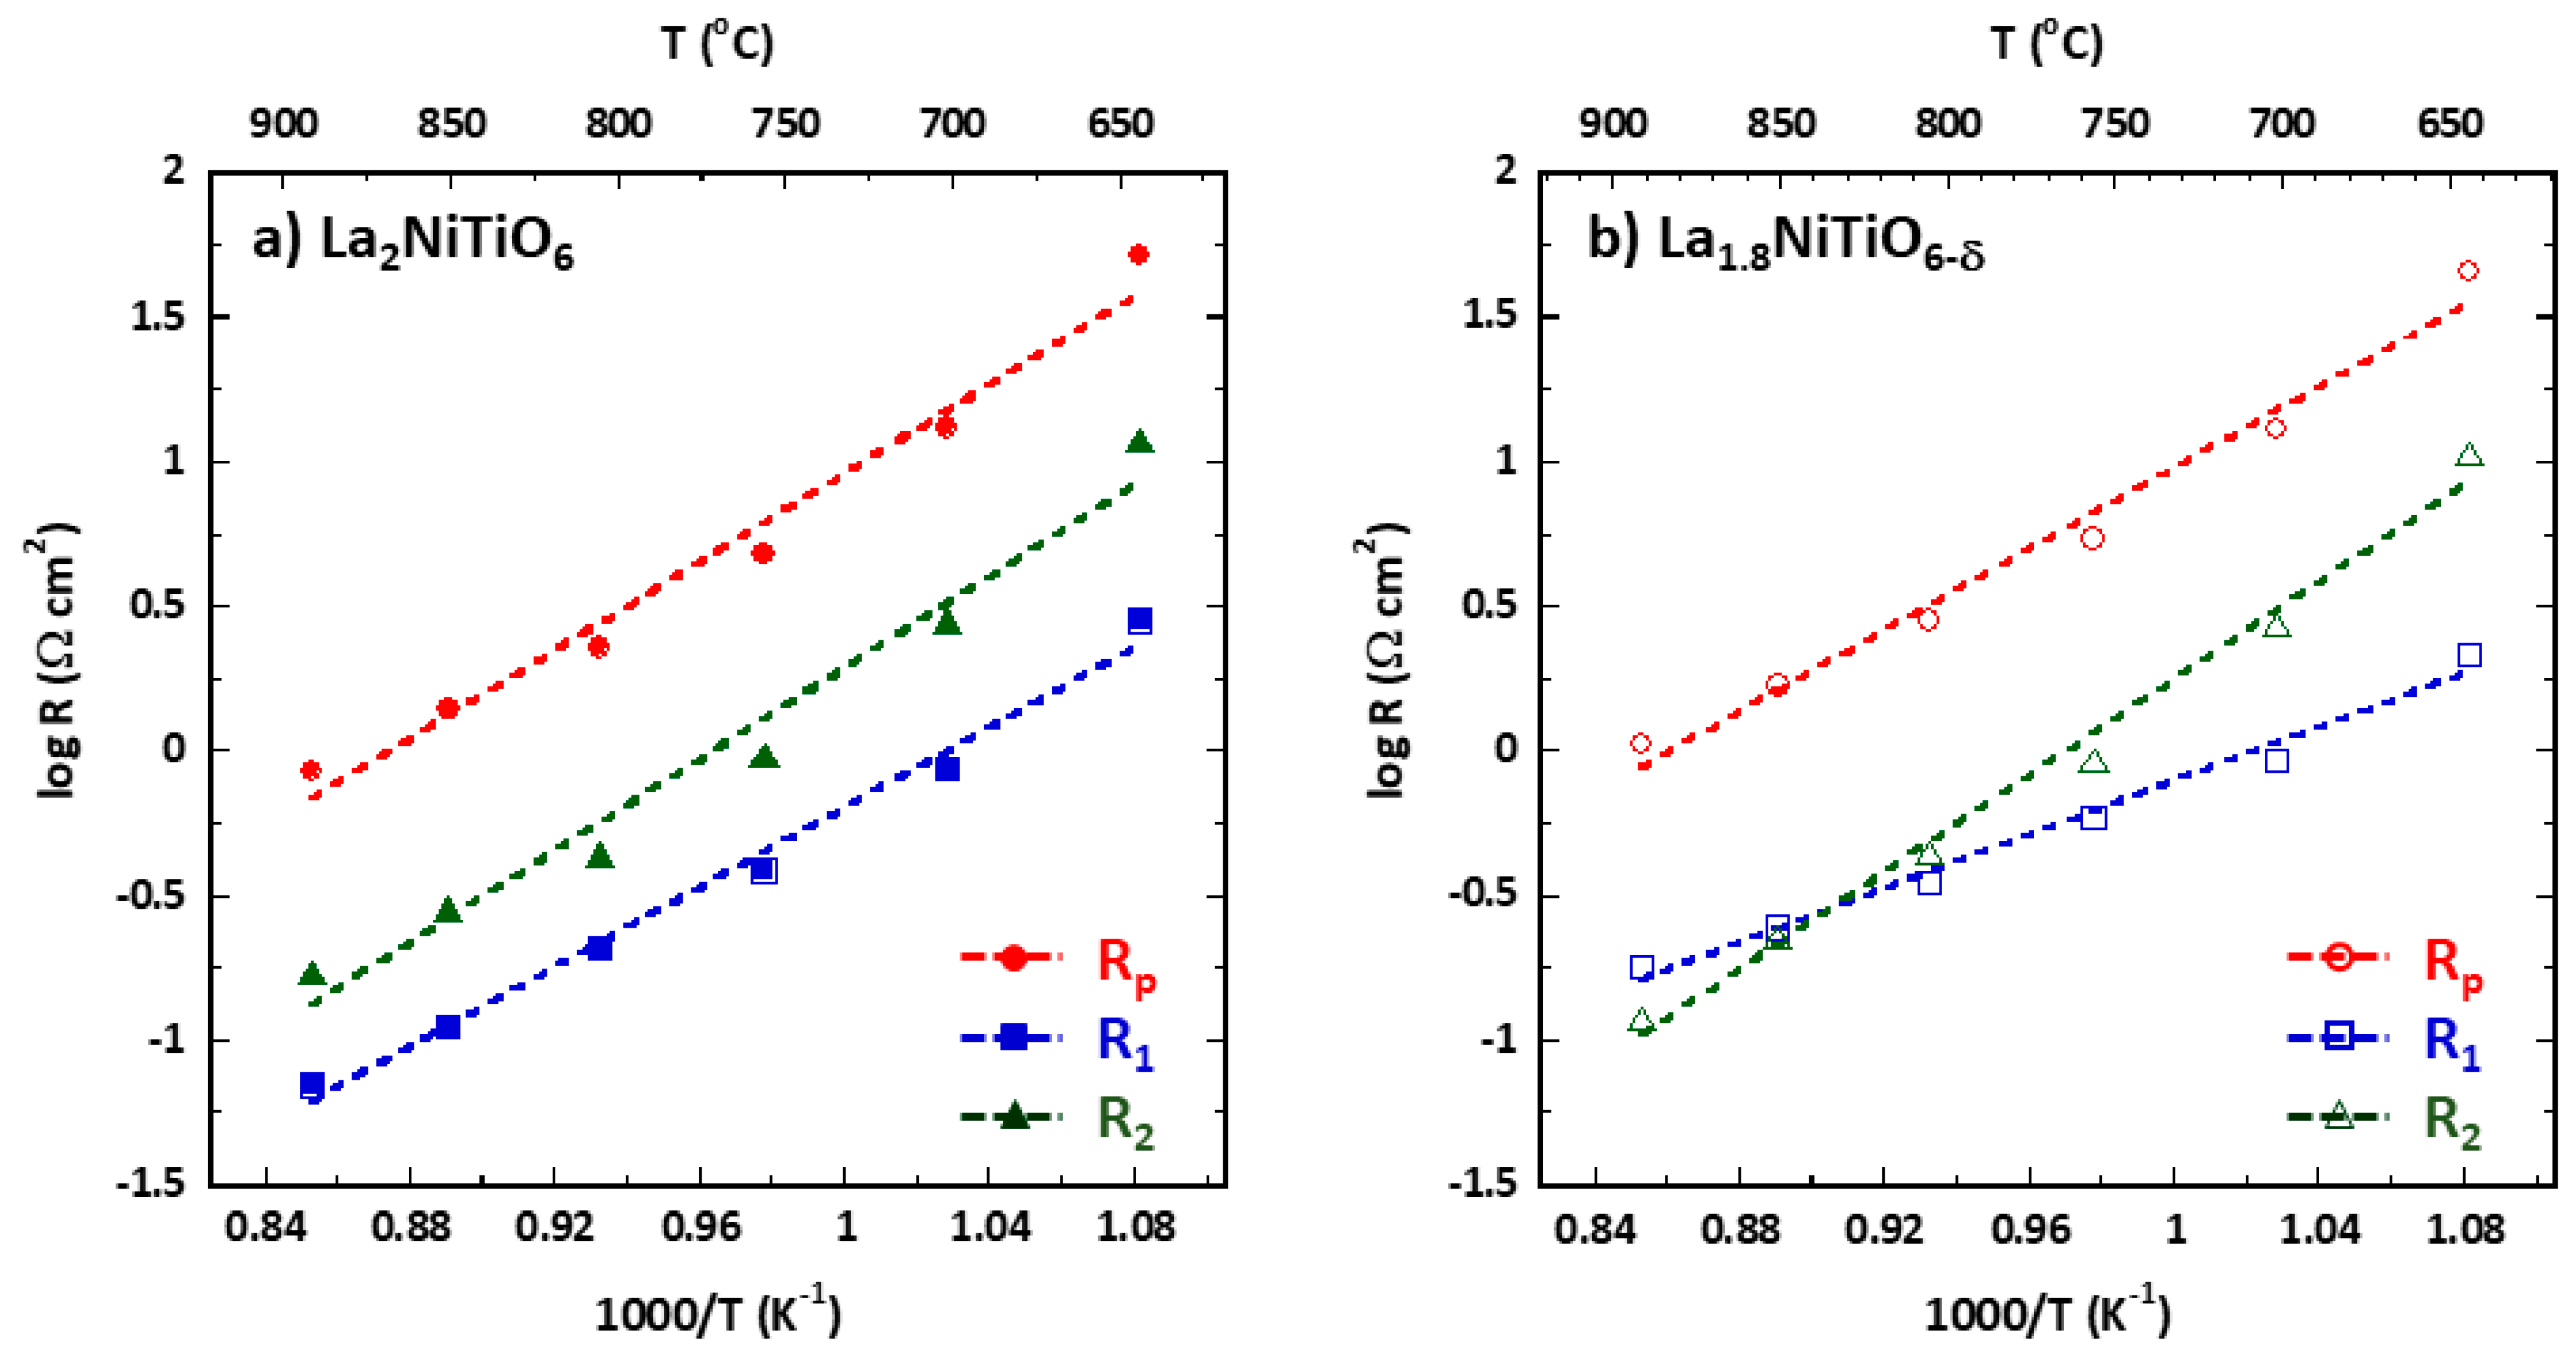
3.2. Electrical and Electrochemical Performance
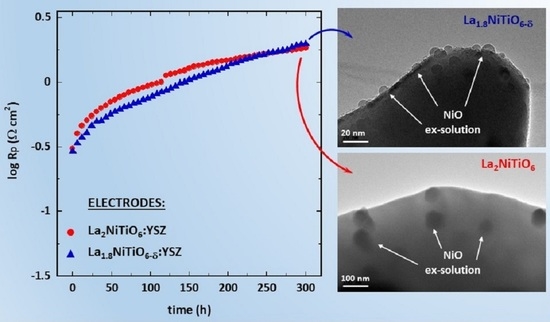
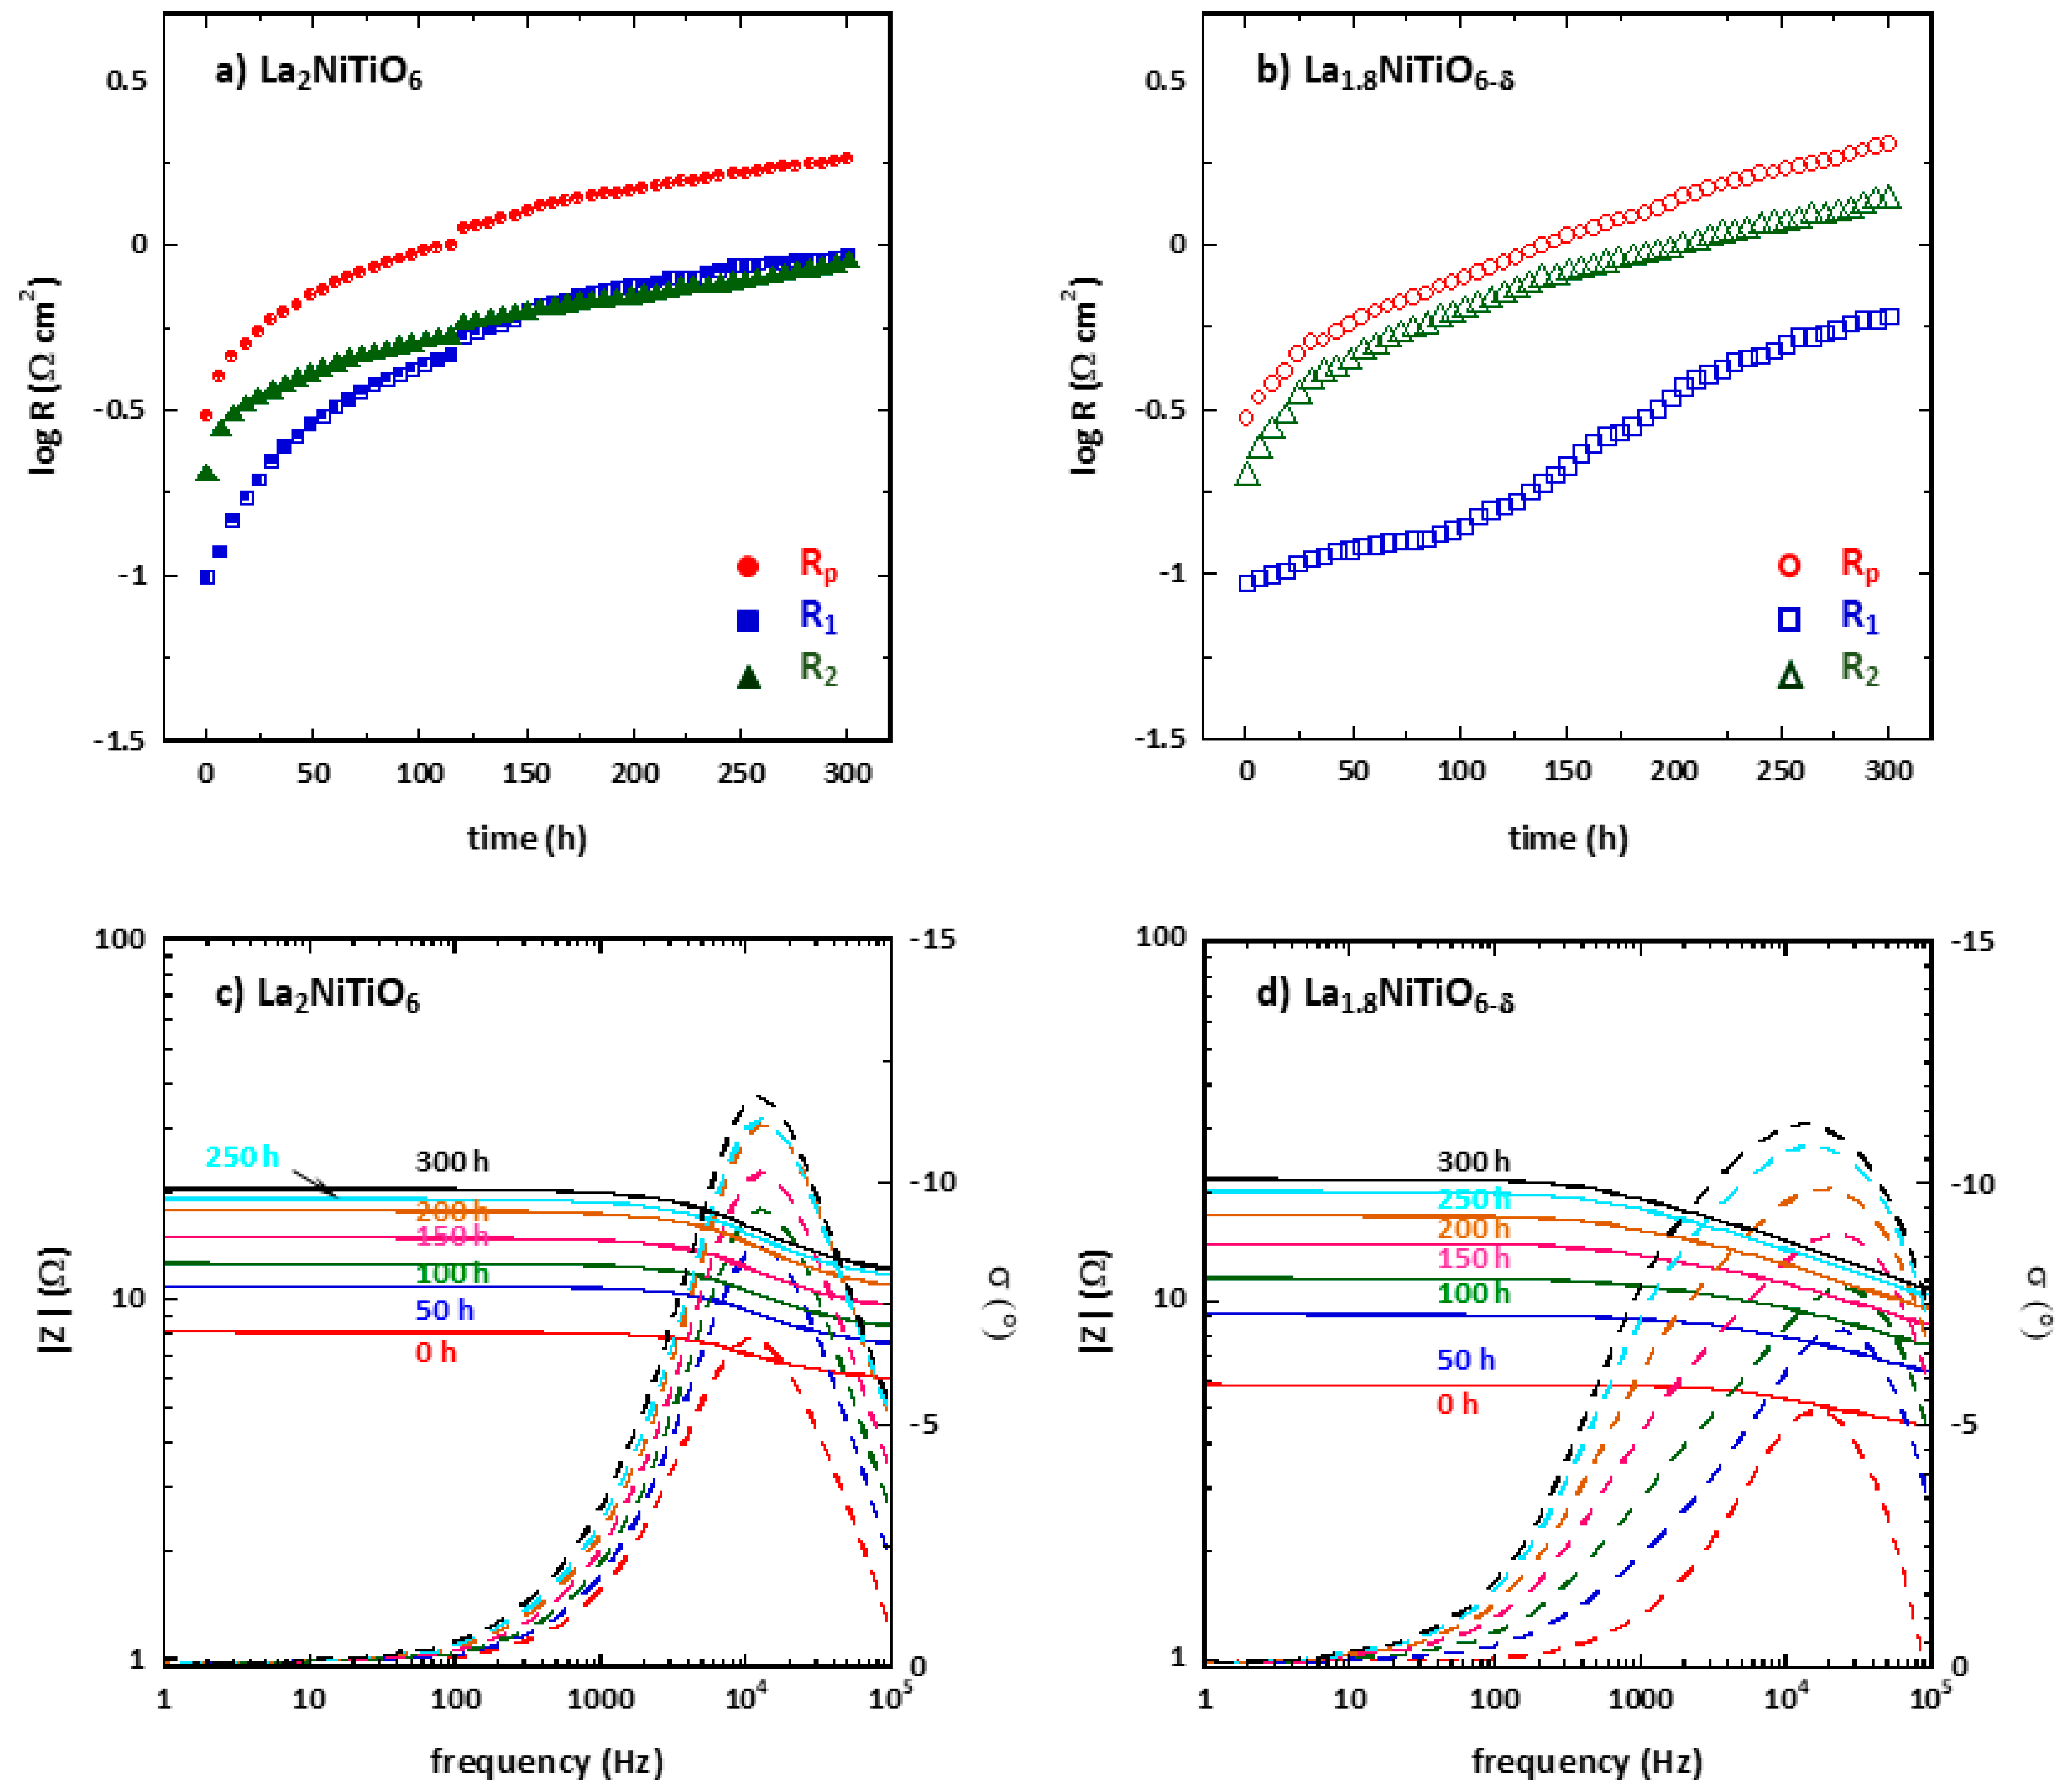
3.3. Long-Term Performance
4. Conclusions
Supplementary Materials
Author Contributions
Funding
Institutional Review Board Statement
Informed Consent Statement
Data Availability Statement
Conflicts of Interest
References
- Vielstich, W.; Lamm, A.; Gasteiger, H. Handbook of Fuel Cells: Fundamentals, Technology, Applications; John Wiley & Sons: Chichester, UK, 2003; Volume 1. [Google Scholar]
- Adler, S.B. Factors Governing Oxygen Reduction in Solid Oxide Fuel Cell Cathodes. Chem. Rev. 2004, 104, 4791–4844. [Google Scholar] [CrossRef] [PubMed]
- Ormerod, R.M. Solid oxide fuel cells. Chem. Soc. Rev. 2003, 32, 17–28. [Google Scholar] [CrossRef] [PubMed]
- Shao, Z.; Haile, S.M. A high-performance cathode for the next generation of solid-oxide fuel cells. Nat. Cell Biol. 2004, 431, 170–173. [Google Scholar] [CrossRef]
- Van Heuveln, F.H.; Bouwmeester, H.J.M.; van Berkel, F.P.F. Electrode Properties of Sr-Doped LaMnO3 on Yttria-Stabilized Zirconia: I. Three-Phase Boundary Area. J. Electrochem. Soc. 1997, 144, 126–133. [Google Scholar] [CrossRef]
- Van Heuveln, F.H.; Bouwmeester, H.J.M. Electrode Properties of Sr-Doped LaMnO3 on Yttria-Stabilized Zirconia: II. Electrode Kinetics. J. Electrochem. Soc. 1997, 144, 134–140. [Google Scholar] [CrossRef]
- Jørgensen, M.J.; Mogensen, M.B. Impedance of Solid Oxide Fuel Cell LSM/YSZ Composite Cathodes. J. Electrochem. Soc. 2001, 148, A433–A442. [Google Scholar] [CrossRef]
- Nielsen, J.; Hjelm, J. Impedance of SOFC electrodes: A review and a comprehensive case study on the impedance of LSM:YSZ cathodes. Electrochim. Acta 2014, 115, 31–45. [Google Scholar] [CrossRef]
- Jiang, S.P. A comparison of O2 reduction reactions on porous (La,Sr)MnO3 and (La,Sr)(Co,Fe)O3 electrodes. Solid State Ion. 2002, 146, 1–22. [Google Scholar] [CrossRef]
- Li, Z.; Behruzi, L.; Fuerst, D.S. Page 171 SOFC-III, PV 93-4; Singhal, S.C., Iwahara, H., Eds.; The Electrochemical Society: Pennington, NJ, USA, 1993. [Google Scholar]
- Zhang, J.-P.; Jiang, S.P.; Foger, K. Page 962 SOFC-IV, PV 99-19; The Electrochemical Society: Pennington, NJ, USA, 1999. [Google Scholar]
- Yasuda, I.; Ogasawara, K.; Hishinuma, M.; Kawada, T.; Dokiya, M. Oxygen tracer diffusion coefficient of (La, Sr)MnO3 ± δ. Solid State Ion. 1996, 86–88, 1197–1201. [Google Scholar] [CrossRef]
- Co, A.C.; Xia, S.J.; Birss, V.I. A Kinetic Study of the Oxygen Reduction Reaction at LaSrMnO3−YSZ Composite Electrodes. J. Electrochem. Soc. 2005, 152, A570. [Google Scholar] [CrossRef]
- Murray, E.P.; Tsai, T.; Barnett, S.A. Oxygen transfer processes in (La,Sr)MnO3/Y2O3-stabilized ZrO2 cathodes: An impedance spectroscopy study. Solid State Ion. 1998, 110, 235–243. [Google Scholar] [CrossRef]
- Kim, J.-D.; Kim, G.-D.; Moon, J.-W.; Park, Y.-I.; Lee, W.-H.; Kobayashi, K.; Nagai, M.; Kim, C.-E. Characterization of LSM–YSZ composite electrode by ac impedance spectroscopy. Solid State Ion. 2001, 143, 379–389. [Google Scholar] [CrossRef]
- Wang, S.; Jiang, Y.; Zhang, Y.; Yan, J.; Li, W. Promoting effect of YSZ on the electrochemical performance of YSZ+LSM composite electrodes. Solid State Ion. 1998, 113–115, 291–303. [Google Scholar] [CrossRef]
- Terner, M.R.; Schuler, J.A.; Mai, A.; Penner, D. On the conductivity degradation and phase stability of solid oxide fuel cell (SOFC) zirconia electrolytes analysed via XRD. Solid State Ion. 2014, 263, 180–189. [Google Scholar] [CrossRef]
- Sohal, M.S.; O’Brien, J.E.; Stoots, C.M.; Sharma, V.I.; Yildiz, B.; Virkar, A. Degradation Issues in Solid Oxide Cells during High Temperature Electrolysis. J. Fuel Cell Sci. Technol. 2011, 9, 011017. [Google Scholar] [CrossRef]
- O’Brien, J.E.; Stoots, C.M.; Sharma, V.I.; Yildiz, B.; Virkar, A.V. Degradation Issues in Solid Oxide Cells during High Temperature Electrolysis. In Proceedings of the Eighth International Fuel Cell Science Engineering & Technology Conference, New York, NY, USA, 14–16 June 2010. [Google Scholar]
- Sreedhar, I.; Agarwal, B.; Goyal, P.; Singh, S.A. Recent advances in material and performance aspects of solid oxide fuel cells. J. Electroanal. Chem. 2019, 848, 113315. [Google Scholar] [CrossRef]
- Da Silva, I.M.T.; Nielsen, J.; Hjelm, J.; Mogensen, M.B. Comparison of the Degradation of the Polarisation Resistance of Symmetrical LSM-YSZ cells, with Anode Supported Ni-YSZ/YSZ/LSM-YSZ SOFCs. ECS Trans. 2009, 25, 489–498. [Google Scholar] [CrossRef]
- Sreedhar, I.; Agarwal, B.; Goyal, P.; Agarwal, A. An overview of degradation in solid oxide fuel cells-potential clean power sources. J. Solid State Electrochem. 2020, 24, 1239–1270. [Google Scholar] [CrossRef]
- Matsuzaki, Y.; Yasuda, I. The poisoning effect of sulfur-containing impurity gas on a SOFC anode: Part I. Dependence on temperature, time, and impurity concentration. Solid State Ion. 2000, 132, 261–269. [Google Scholar] [CrossRef]
- Wang, F.; Kishimoto, H.; Ishiyama, T.; Develos-Bagarinao, K.; Yamaji, K.; Horita, T.; Yokokawa, H. A review of sulfur poisoning of solid oxide fuel cell cathode materials for solid oxide fuel cells. J. Power Source 2020, 478, 228763. [Google Scholar] [CrossRef]
- Schuler, A.J.; Wuillemin, Z.; Hessler-Wyser, A.; Van Herle, J. Sulfur as Pollutant Species on the Cathode Side of a SOFC System. ECS Trans. 2019, 25, 2845–2852. [Google Scholar] [CrossRef]
- Nielsen, J.; Hagen, A.; Liu, Y.-L. Effect of cathode gas humidification on performance and durability of Solid Oxide Fuel Cells. Solid State Ion. 2010, 181, 517–524. [Google Scholar] [CrossRef]
- Stochniol, G.; Syskakis, E.; Naoumidis, A. Chemical Compatibility between Strontium-Doped Lanthanum Manganite and Yttria-Stabilized Zirconia. J. Am. Ceram. Soc. 1995, 78, 929–932. [Google Scholar] [CrossRef]
- Jiang, S.P.; Love, J.G.; Zhang, J.P.; Hoang, M.; Ramprakash, Y.; Hughes, A.E.; Badwal, S.P.S. The electrochemical performance of LSM/zirconia–yttria interface as a function of a-site non-stoichiometry and cathodic current treatment. Solid State Ion. 1999, 121, 1–10. [Google Scholar] [CrossRef]
- Mitsuyasu, H.; Eguchi, K.; Arai, H. Microscopic analysis of lanthanum strontium manganite/yttria-stabilized zirconia interface. Solid State Ion. 1997, 100, 11–15. [Google Scholar] [CrossRef]
- Brant, M.C.; Dessemond, L. Electrical degradation of LSM–YSZ interfaces. Solid State Ion. 2000, 138, 1–17. [Google Scholar] [CrossRef]
- Brant, M.; Matencio, T.; Dessemond, L.; Domingues, R. Electrical degradation of porous and dense LSM/YSZ interface. Solid State Ion. 2006, 177, 915–921. [Google Scholar] [CrossRef]
- Nielsen, J.; Jacobsen, T. SOFC cathode/YSZ—Non-stationary TPB effects. Solid State Ion. 2008, 179, 1314–1319. [Google Scholar] [CrossRef]
- Carter, S.; Selcuk, A.; Chater, R.; Kajda, J.; Kilner, J.; Steele, B. Oxygen transport in selected nonstoichiometric perovskite-structure oxides. Solid State Ion. 1992, 53–56, 597–605. [Google Scholar] [CrossRef]
- Sasaki, K.; Wurth, J.; Gschwend, R.; Gödickemeier, M.; Gauckler, L.J. Microstructure-Property Relations of Solid Oxide Fuel Cell Cathodes and Current Collectors: Cathodic Polarization and Ohmic Resistance. J. Electrochem. Soc. 1996, 143, 530–543. [Google Scholar] [CrossRef]
- Hammouche, A.; Siebert, E.; Hammou, A.; Kleitz, M.; Caneiro, A. Electrocatalytic Properties and Nonstoichiometry of the High Temperature Air Electrode La1−xSrxMnO3. J. Electrochem. Soc. 1991, 138, 1212–1216. [Google Scholar] [CrossRef]
- Steinberger-Wilckens, R.; Blum, L.; Buchkremer, H.P.; De Haart, B.; Malzbender, J.; Pap, M. Recent results in solid oxide fuel cell development at Forschungszentrum Juelich. ECS Trans. 2011, 35, 53. [Google Scholar] [CrossRef]
- Malzbender, J.; Batfalsky, P.; Vaßen, R.; Shemet, V.; Tietz, F. Component interactions after long-term operation of an SOFC stack with LSM cathode. J. Power Source 2012, 201, 196–203. [Google Scholar] [CrossRef]
- Mukerjee, S.; Leah, R.; Selby, M.; Stevenson, G.; Brandon, N.P. Chapter 9—Life and Reliability of Solid Oxide Fuel Cell-Based Products: A Review. In Solid Oxide Fuel Cell Lifetime and Reliability; Brandon, N.P., Ruiz-Trejo, E., Boldrin, P., Eds.; Academic Press: Cambridge, MA, USA, 2017; pp. 173–191. [Google Scholar]
- Cassidy, M.; Neagu, D.; Savaniu, C.; Boldrin, P. New Materials for Improved Durability and Robustness in Solid Oxide Fuel Cell. In Solid Oxide Fuel Cell Lifetime and Reliability; Brandon, N.P., Ruiz-Trejo, E., Boldrin, P., Eds.; Academic Press: Cambridge, MA, USA, 2017; Chapter 10; pp. 193–216. [Google Scholar]
- Hagen, A.; Høgh, J.V.T.; Barfod, R. Accelerated testing of solid oxide fuel cell stacks for micro combined heat and power application. J. Power Source 2015, 300, 223–228. [Google Scholar] [CrossRef]
- Weber, A.; Szász, J.; Dierickx, S.; Endler-Schuck, C.; Ivers-Tiffée, E. Accelerated Lifetime Tests for SOFCs. ECS Trans. 2015, 68, 1953. [Google Scholar] [CrossRef]
- Ploner, A.; Hauch, A.; Hagen, A. Study of Operating Parameters for Accelerated Anode Degradation in SOFCs. Fuel Cells 2017, 17, 498–507. [Google Scholar] [CrossRef]
- Pérez-Flores, J.C.; Ritter, C.; Perez-Coll, D.; Mather, G.C.; Garcia-Alvarado, F.; Amador, U. Synthesis, structures and electrical transport properties of the La2−xSrx NiTiO6− δ (0 ≤ x ≤ 0.5) perovskite series. J. Mater. Chem. 2011, 21, 13195–13204. [Google Scholar] [CrossRef]
- Pérez-Flores, J.C.; Pérez-Coll, D.; García-Martín, S.; Ritter, C.; Mather, G.C.; Canales-Vázquez, J.; Gálvez-Sánchez, M.; García-Alvarado, F.; Amador, U. A- and B-Site Ordering in the A-Cation-Deficient Perovskite Series La2–xNiTiO6−δ (0 ≤ x <0.20) and Evaluation as Potential Cathodes for Solid Oxide Fuel Cells. Chem. Mater. 2013, 25, 2484–2494. [Google Scholar]
- Pérez-Flores, J.C.; Ritter, C.; Pérez-Coll, D.; Mather, G.C.; Canales-Vázquez, J.; Gálvez-Sánchez, M.; García-Alvarado, F.; Amador, U. Structural and electrochemical characterization of La2−xSrxNiTiO6−δ. Int. J. Hydrogen Energy 2012, 37, 7242–7251. [Google Scholar] [CrossRef]
- Park, K.; Lee, C.; Bae, J.; Yoo, Y. Structural and electrochemical properties of Pr0.3Sr0.7Co0.3Fe0.7O3−δ cathode for IT-SOFC. Int. J. Hydrogen Energy 2009, 34, 6852–6860. [Google Scholar] [CrossRef]
- Tietz, F.; Haanappel, V.; Mai, A.; Mertens, J.; Stöver, D. Performance of LSCF cathodes in cell tests. J. Power Source 2006, 156, 20–22. [Google Scholar] [CrossRef]
- Mizutani, Y.; Hisada, K.; Ukai, K.; Sumi, H.; Yokoyama, M.; Nakamura, Y.; Yamamoto, O. From rare earth doped zirconia to 1kW solid oxide fuel cell system. J. Alloys Compd. 2006, 408-412, 518–524. [Google Scholar] [CrossRef]
- Park, K.; Yu, S.; Bae, J.; Kim, H.; Ko, Y. Fast performance degradation of SOFC caused by cathode delamination in long-term testing. Int. J. Hydrogen Energy 2010, 35, 8670–8677. [Google Scholar] [CrossRef]
- Rodríguez-Carvajal, J. Recent advances in magnetic structure determination by neutron powder diffraction. Phys. B Condens. Matter 1993, 192, 55–69. [Google Scholar] [CrossRef]
- Boukamp, B.A. Electrochemical impedance spectroscopy in solid state ionics: Recent advances. Solid State Ion. 2004, 169, 65–73. [Google Scholar] [CrossRef]
- Boukamp, B.A. A Linear Kronig-Kramers Transform Test for Immittance Data Validation. J. Electrochem. Soc. 1995, 142, 1885–1894. [Google Scholar] [CrossRef]
- Schindelin, J.; Arganda-Carreras, I.; Frise, E.; Kaynig, V.; Longair, M.; Pietzsch, T.; Preibisch, S.; Rueden, C.; Saalfeld, S.; Schmid, B.; et al. Fiji: An open-source platform for biological-image analysis. Nat. Methods 2012, 9, 676–682. [Google Scholar] [CrossRef]
- Otsu, N. A threshold selection method from gray-level histograms. IEEE Trans. Syst. Man Cybern. 1979, 9, 62–66. [Google Scholar] [CrossRef]
- Arrivé, C.; Delahaye, T.; Joubert, O.; Gauthier, G. Exsolution of nickel nanoparticles at the surface of a conducting titanate as potential hydrogen electrode material for solid oxide electrochemical cells. J. Power Sources 2013, 223, 341–348. [Google Scholar] [CrossRef]
- Neagu, D.; Tsekouras, G.; Miller, D.N.; Ménard, H.; Irvine, J.T.S. In situ growth of nanoparticles through control of non-stoichiometry. Nat. Chem. 2013, 5, 916–923. [Google Scholar] [CrossRef]
- Lee, J.G.; Myung, J.; Naden, A.B.; Jeon, O.S.; Shul, Y.G.; Irvine, J.T.S. Replacement of Ca by Ni in a Perovskite Titanate to Yield a Novel Perovskite Exsolution Architecture for Oxygen-Evolution Reactions. Adv. Energy Mater. 2020, 10, 1903693. [Google Scholar] [CrossRef]
- Roy, K.S.; Subramaniam, C.; Panchakarla, L.S. Non-Stoichiometry Induced Exsolution of Metal Oxide Nanoparticles via Formation of Wavy Surfaces and their Enhanced Electrocatalytic Activity: Case of Misfit Calcium Cobalt Oxide. ACS Appl. Mater. Interfaces 2021, 13, 9897–9907. [Google Scholar] [CrossRef] [PubMed]
- Deiseroth, H.-J.; Müller-Buschbaum, H. Ein Beitrag zur Pyrochlorstruktur an La2Zr2O7. Z. Anorg. Allg. Chem. 1970, 375, 152–156. [Google Scholar] [CrossRef]
- Whittle, K.R.; Cranswick, L.M.; Redfern, S.; Swainson, I.P.; Lumpkin, G.R. Lanthanum pyrochlores and the effect of yttrium addition in the systems La2−xYxZr2O7 and La2−xYxHf2O7. J. Solid State Chem. 2009, 182, 442–450. [Google Scholar] [CrossRef]
- Kostogloudis, G.; Tsiniarakis, G.; Ftikos, C. Chemical reactivity of perovskite oxide SOFC cathodes and yttria stabilized zirconia. Solid State Ion. 2000, 135, 529–535. [Google Scholar] [CrossRef]
- Bebelis, S.; Kotsionopoulos, N.; Mai, A.; Tietz, F. Electrochemical characterization of perovskite-based SOFC cathodes. J. Appl. Electrochem. 2006, 37, 15–20. [Google Scholar] [CrossRef]
- Belardi, R.-M.; Deseure, J.; Brant, M.C.; Matencio, T.; Domingues, R.Z. Electrical study of cathodic activation and relaxation of La0,80Sr0,20MnO3. Ionics 2008, 15, 227–232. [Google Scholar] [CrossRef]
- Macdonald, D.D.; Urquidi-Macdonald, M. Application of Kramers-Kronig Transforms in the Analysis of Electrochemical Systems: I. Polarization Resistance. J. Electrochem. Soc. 1985, 132, 2316–2319. [Google Scholar] [CrossRef]
- Urquidi-Macdonald, M.; Real, S.; Macdonald, D.D. Application of Kramers-Kronig Transforms in the Analysis of Electrochemical Impedance Data: II. Transformations in the Complex Plane. J. Electrochem. Soc. 1986, 133, 2018–2024. [Google Scholar] [CrossRef]
- Urquidi-Macdonald, M.; Real, S.; Macdonald, D.D. Applications of Kramers—Kronig transforms in the analysis of electrochemical impedance data: III. Stability and linearity. Electrochim. Acta 1990, 35, 1559–1566. [Google Scholar] [CrossRef]
- Ni, W.; Zhu, T.; Chen, X.; Zhong, Q.; Ma, W. Stable, efficient and cost-competitive Ni-substituted Sr(Ti,Fe)O3 cathode for solid oxide fuel cell: Effect of A-site deficiency. J. Power Source 2020, 451, 227762. [Google Scholar] [CrossRef]
- Poulsen, F.W.; van der Puil, N. Phase relations and conductivity of Sr- and La-zirconates. Solid State Ion. 1992, 53–56, 777–783. [Google Scholar] [CrossRef]
- Minh, N.Q. Ceramic Fuel Cells. J. Am. Ceram. Soc. 1993, 76, 563–588. [Google Scholar] [CrossRef]
- Lee, H.Y.; Cho, W.S.; Oh, S.M. Active Reaction Sites and Oxygen Reduction Kinetics on La1-xSrxMnO3+δ (x = 0.1–0.4)/YSZ (Yttria-Stabilized Zirconia). Bull. Korean Chem. Soc. 1998, 19, 661–666. [Google Scholar]
- Adler, S.B. Mechanism and kinetics of oxygen reduction on porous La1−xSrxCoO3−δ electrodes. Solid State Ion. 1998, 111, 125–134. [Google Scholar] [CrossRef]
- Marinšek, M. Electrical Conductivity of Sintered Lsm Ceramics. Mater. Technol. 2009, 43, 79–84. [Google Scholar]
- Matsuzaki, Y.; Yasuda, I. Electrochemical properties of a SOFC cathode in contact with a chromium-containing alloy separator. Solid State Ion. 2000, 132, 271–278. [Google Scholar] [CrossRef]
- Carpanese, M.; Clematis, D.; Bertei, A.; Giuliano, A.; Sanson, A.; Mercadelli, E.; Nicolella, C.; Barbucci, A. Understanding the electrochemical behaviour of LSM-based SOFC cathodes. Part I—Experimental and electrochemical. Solid State Ion. 2017, 301, 106–115. [Google Scholar] [CrossRef]


| Magnitude | La2NiTiO6 | La1.8NiTiO6−δ | ||||||
|---|---|---|---|---|---|---|---|---|
| RO | R1Q1 | R2Q2 | Rp | RO | R1Q1 | R2Q2 | Rp | |
| Eact (eV) | 0.85 | 1.37 | 1.57 | 1.52 | 0.90 | 0.92 | 1.66 | 1.39 |
| C (F cm−2) | - | 8.70 × 10⁻⁵ | 1.02 × 10⁻⁴ | - | - | 5.67 × 10⁻⁵ | 2.82 × 10⁻⁴ | - |
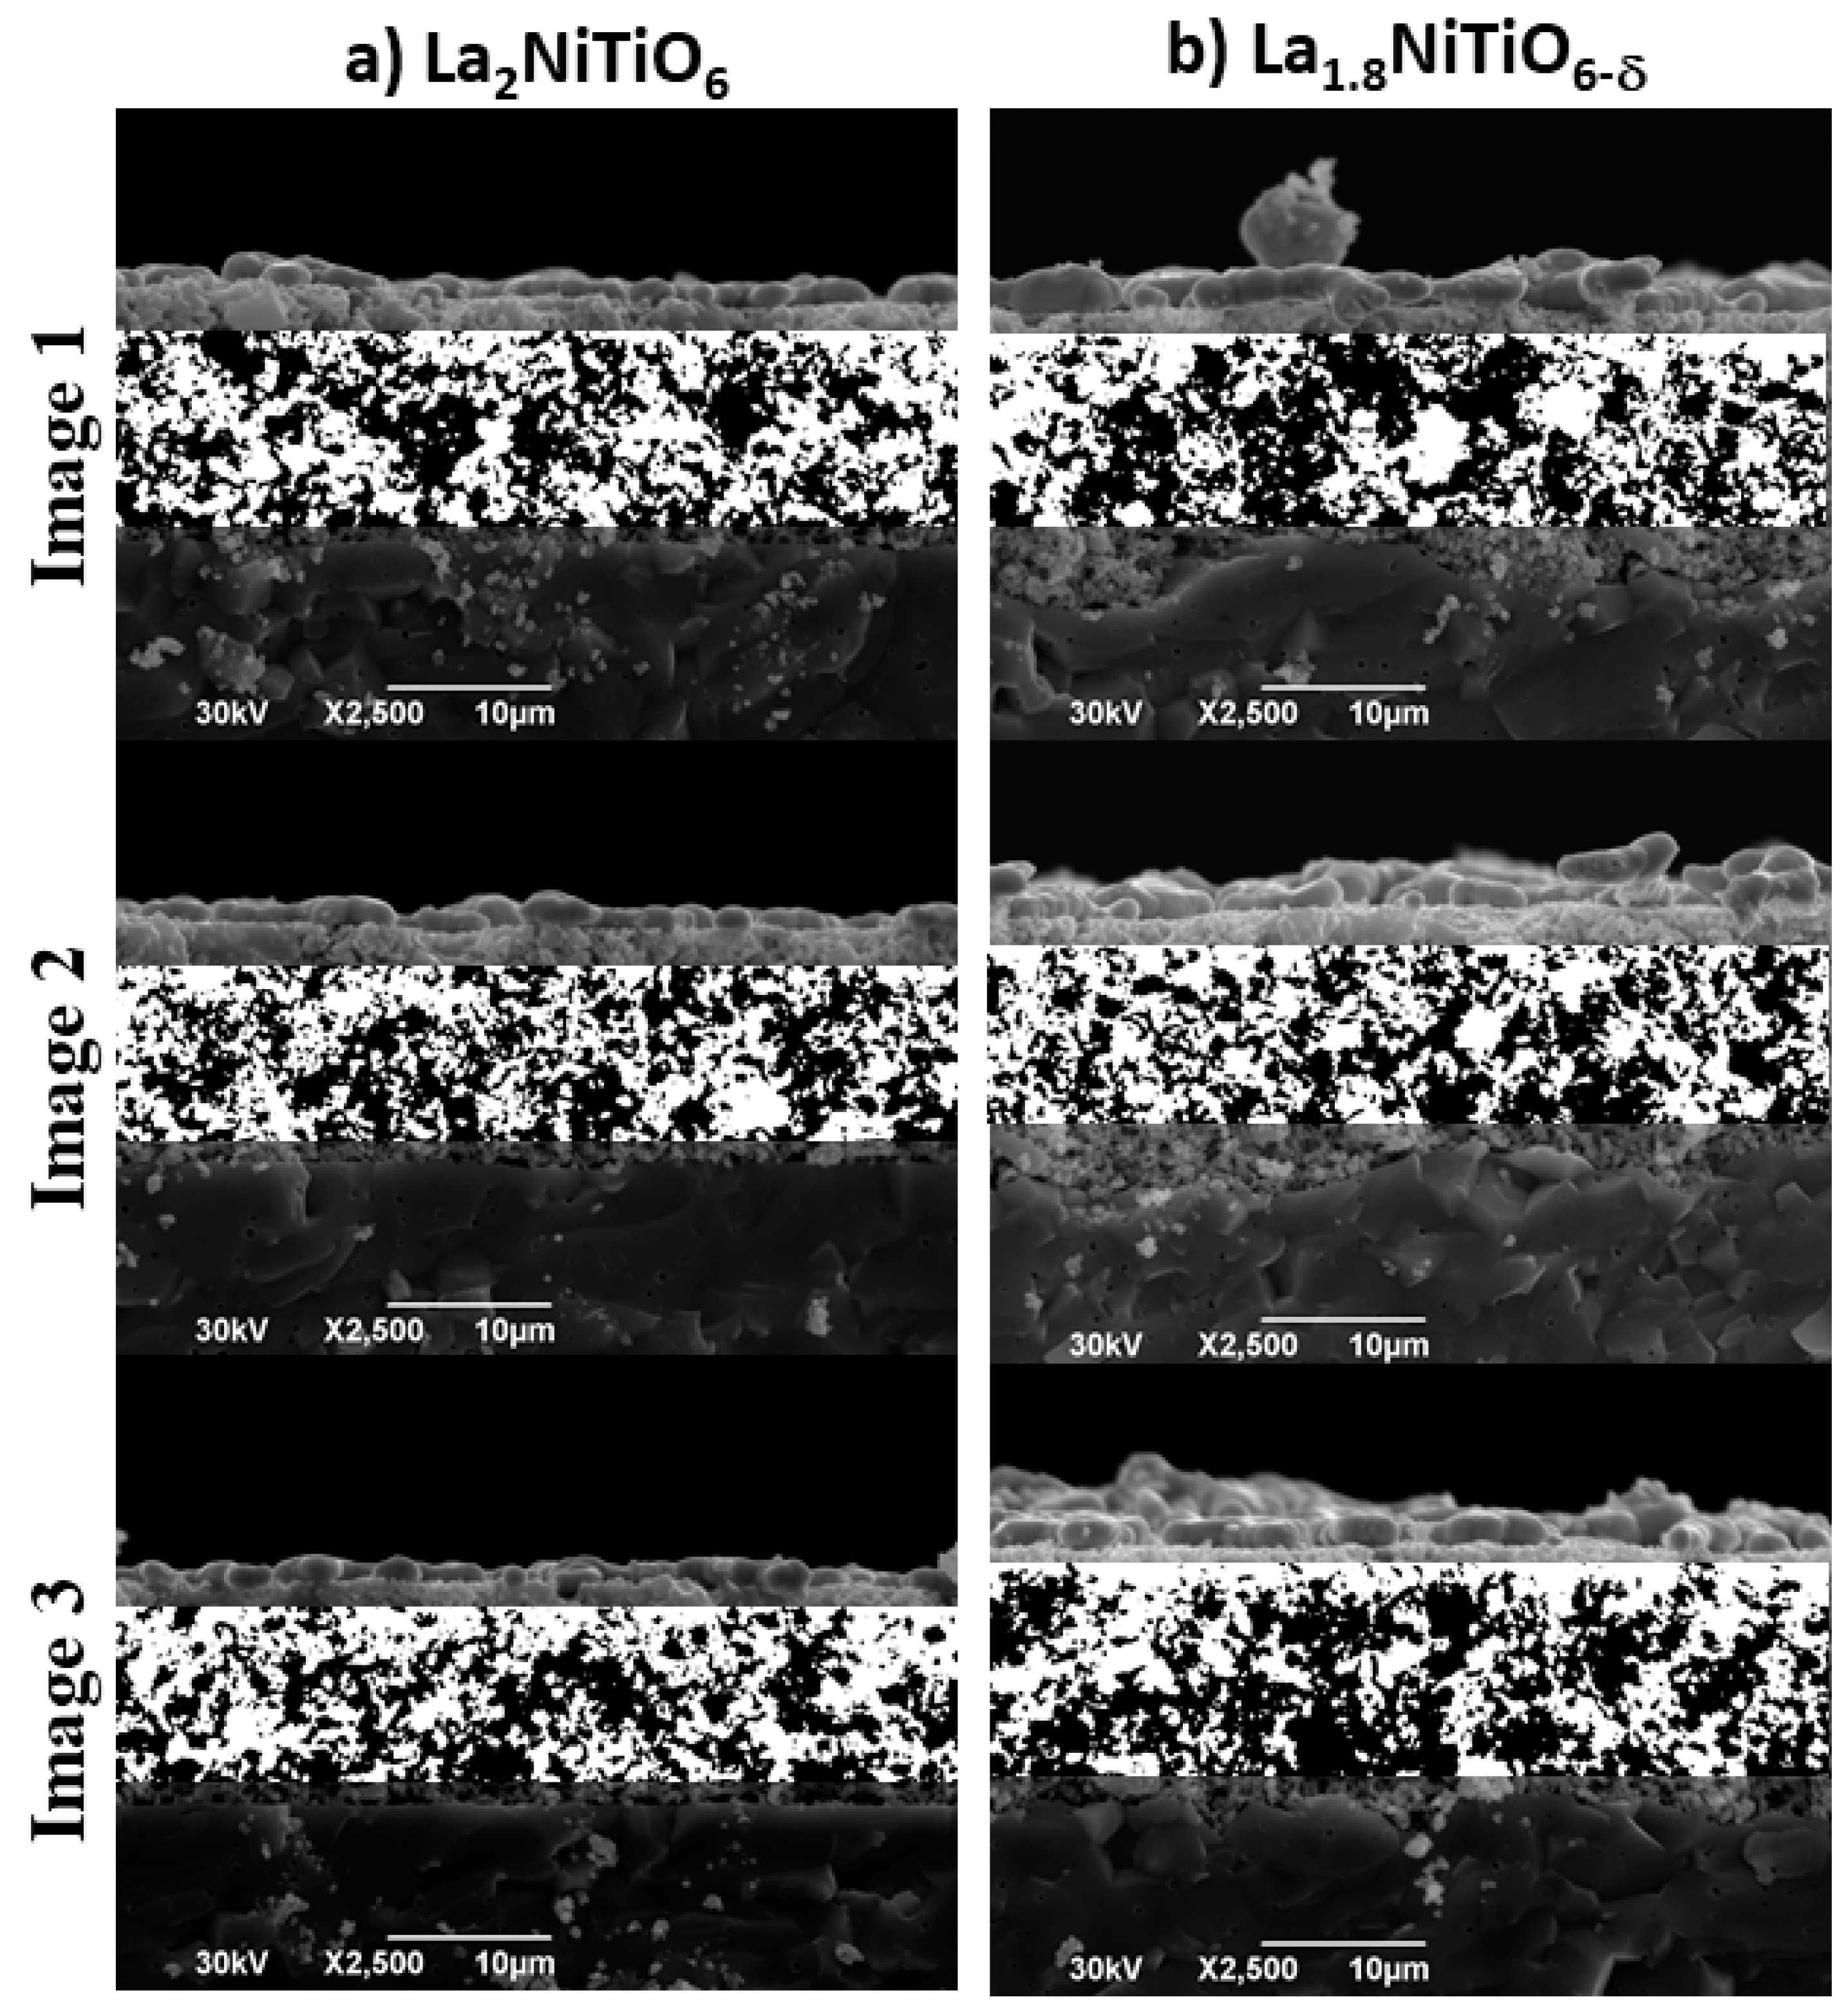
| Compound | At (μm2) | Ap (μm2) | ε (%) | As (μm2) | Sv (μm3) | D | R2(D) |
|---|---|---|---|---|---|---|---|
| La2NiTiO6 | |||||||
| Image #1 | 604.002 | 312.203 | 52% | 1.092 | 0.858 | 1.778 | 0.999 |
| Image #2 | 546.72 | 278.213 | 51% | 1.009 | 0.762 | 1.772 | 0.999 |
| Image #3 | 538.839 | 288.503 | 54% | 0.895 | 0.637 | 1.746 | 0.999 |
| 563.187 | 292.973 | 52% | 0.999 | 0.753 | 1.765 | 0.999 | |
| 35.566 | 17.430 | 0.01 | 0.099 | 0.111 | 0.017 | 0.000 | |
| La1.8NiTiO6−δ | |||||||
| Image #1 | 601.840 | 294.525 | 49% | 1.322 | 1.143 | 1.796 | 0.999 |
| Image #2 | 554.88 | 287.471 | 52% | 1.086 | 0.851 | 1.767 | 0.999 |
| Image #3 | 655.191 | 309.388 | 47% | 1.543 | 1.442 | 1.783 | 1.000 |
| 603.970 | 297.128 | 49% | 1.317 | 1.146 | 1.782 | 0.999 | |
| 50.189 | 11.188 | 0.02 | 0.229 | 0.295 | 0.015 | 0.000 |
Publisher’s Note: MDPI stays neutral with regard to jurisdictional claims in published maps and institutional affiliations. |
© 2021 by the authors. Licensee MDPI, Basel, Switzerland. This article is an open access article distributed under the terms and conditions of the Creative Commons Attribution (CC BY) license (https://creativecommons.org/licenses/by/4.0/).
Share and Cite
Pérez-Flores, J.C.; Castro-García, M.; Crespo-Muñoz, V.; Valera-Jiménez, J.F.; García-Alvarado, F.; Canales-Vázquez, J. Analysis of Performance Losses and Degradation Mechanism in Porous La2−X NiTiO6−δ:YSZ Electrodes. Materials 2021, 14, 2819. https://doi.org/10.3390/ma14112819
Pérez-Flores JC, Castro-García M, Crespo-Muñoz V, Valera-Jiménez JF, García-Alvarado F, Canales-Vázquez J. Analysis of Performance Losses and Degradation Mechanism in Porous La2−X NiTiO6−δ:YSZ Electrodes. Materials. 2021; 14(11):2819. https://doi.org/10.3390/ma14112819
Chicago/Turabian StylePérez-Flores, Juan Carlos, Miguel Castro-García, Vidal Crespo-Muñoz, José Fernando Valera-Jiménez, Flaviano García-Alvarado, and Jesús Canales-Vázquez. 2021. "Analysis of Performance Losses and Degradation Mechanism in Porous La2−X NiTiO6−δ:YSZ Electrodes" Materials 14, no. 11: 2819. https://doi.org/10.3390/ma14112819
APA StylePérez-Flores, J. C., Castro-García, M., Crespo-Muñoz, V., Valera-Jiménez, J. F., García-Alvarado, F., & Canales-Vázquez, J. (2021). Analysis of Performance Losses and Degradation Mechanism in Porous La2−X NiTiO6−δ:YSZ Electrodes. Materials, 14(11), 2819. https://doi.org/10.3390/ma14112819