Abstract
Understanding the mechanisms that govern the conductive properties of multifunctional cement-materials is fundamental for the development of the new applications proposed to enhance the energy efficiency, safety and structural properties of smart buildings and infrastructures. Many fillers have been suggested to increase the electrical conduction in concretes; however, the processes involved are still not entirely known. In the present work, we investigated the effect of graphene nanoplatelets (1 wt% on the electrical properties of cement composites (OPC/GNPs). We found a decrease of the bulk resistivity in the composite associated to the enhancement of the charge transport properties in the sample. Moreover, the study of the dielectric properties suggests that the main contribution to conduction is given by water diffusion through the porous network resulting in ion conductivity. Finally, the results support that the increase of direct current in OPC/GNPs is due to pore refinement induced by graphene nanoplatelets.
1. Introduction
In recent years, the interest on the smart city concept to promote environmental sustainability through the implementation of new technologies has shown a large growth. New construction technologies have been investigated to enhance the energy efficiency, safety, and structural performance of buildings and infrastructure. In this framework, the development of multifunctional cement-based materials has a key role. Indeed, a strong effort is needed to design innovative concretes that could serve as structural material with tailored functional behavior to meet specific requirements.
Multifunctional cement-based materials have been proposed for several applications [1]. Regarding the infrastructure, much interest has been devoted to snow melting and de-icing systems with conductive concrete composites as heating elements [2,3,4], cathodic protection of steel reinforcement concrete to prevent corrosion damages [5,6,7] and traffic sensors with conductive concrete [8]. Cement-based composites have been proposed for grounding systems [9,10] as well as electromagnetic wave shielding [11,12]. Regarding the development of smart buildings, structural health monitoring systems are fundamental for the modern structures and concrete composite sensors are a good candidate due to the intrinsic compatibility with the cement matrix [1]. Finally, multifunctional cement-based materials have been suggested for the development of structural supercapacitors [13,14,15].
All the applications mentioned above base their efficiency on the conductive properties of the structural material. However, it is well known that concrete is characterized by an insulating behavior. To overcome such a drawback, different conductive fillers have been indicated as good aggregates to achieve the design of conductive concrete [1,16]. Metal conductive admixtures have been proposed with the addition of steel fibers and micro fibers [17,18,19] and steel shaving [2]. Among the carbon admixtures, graphite [20,21,22], carbon fibers [3,18,19,23,24,25,26] and graphene [27,28] have been investigated for electrical conductive concretes. Finally, carbon nanomaterials gathered a lot of attention as they have, beyond high electrical conductivity, unique physical properties [16,29]. Among carbon nanomaterials employed in concrete composites we mention carbon black [30,31], carbon nanotubes [32,33,34,35] and nanofibers [36,37,38,39,40], as well as graphene nanoplatelets [41,42,43,44,45].
Performance of electrical conductive concrete depends clearly on the nature and amount of the filler. However, it has been demonstrated that water as well plays a crucial role in the conduction mechanism. Indeed, electrical resistivity depends on aging due to changes of pore water amount [18,40] and an ionic conduction in wet concretes has been observed due to the free water molecules [46]. Nonetheless, the conductive mechanism in cement-based materials is still not completely understood. Moreover, the studies on the effect of fillers on electrical properties focused the attention mainly on the formation of a conduction path.
With the aim of elucidating the processes involved in conduction in cement-based materials and, in particular, of investigating the role of water molecules and the indirect impact of the addition of fillers, we studied graphene nanoplatelets/cement composite by means of dielectric spectroscopy technique at different temperatures. Such a technique, commonly used to study conductivity in ceramic materials [47,48,49,50,51,52] and dielectric and electrical properties of porous systems [53,54,55,56,57,58,59,60] and polymer composite [61,62,63,64,65,66,67,68], is a very suitable tool due to its unique properties. In fact, due to its large frequency range, it is possible to investigate the impedance and dielectric response of the material on different time scale and, therefore, to obtain information on the different processes involved in the ionic and electronic conduction phenomena. First, due to the strong response of dielectric spectroscopy to water amount, thermal gravimetric analysis results are shown. Therefore, the impedance response of the specimens is examined to understand how graphene nanoplatelets affect the electrical properties. Finally, the dielectric response of the system is discussed to reveal the conduction mechanism and the role of the filler.
2. Materials and Methods
In this study, two samples were prepared: OPC paste (as reference) and OPC/Graphene nanoplatelets (GNPs) composite. To focus the attention on ion conduction, the porosity of the system was increased by using a water-to-cement ratio of w/c = 0.6 and curing the samples during seven days. Moreover we added only 1 wt% of GNPs to keep the sample below the percolation threshold suggested by literature [41] to minimize the electrical conduction that may contributes when a complete conductive path is formed. The cement used was CEM II/A-LL 42.5 R and GPL from GrapheneTech (Zaragoza, Spain) was used as filler. This product presents a specific surface area around 200 m2 g−1, lateral size between 500–1000 nm and a carbon content above 97%. For sample preparation, first powders were mixed using a mechanical blender at low speed (350 rpm) for 1 min to obtain a uniform dispersion of GNPs in the OPC powder. Afterwards, ultrapure water was added and the solution was mixed at 750 rpm. Both sets were cast in cylindrical silicone molds with d = 4 cm and sealed. After 24 h, specimens were demolded and cured in water for 7 days. Finally, the cylinders were crashed into fine powder and kept overnight in desiccator with silica gel before measured.
Thermal gravimetric analyses were carried out using a TGA-500 (TA Instruments, New Castle, DE, USA) to investigate the water amount in the samples and verify if any phase transformation occurs when GNPs are added. All the measurements were conducted under high-purity nitrogen flow over a temperature of 303–1173 °C with a ramp rate of 5 K/min.
A broadband dielectric spectrometer, Novocontrol Alpha-A, (Novocontrol, Montabaur, Germany) was used to measure the complex dielectric permittivity, defined as where C0 is the capacitance of the free space, C* is the complex capacitance function, Z* is the complex impedance and the angular frequency with f the applied electric field frequency. Data were collected over a broad frequency range, from 10−2 to 106 Hz. Samples were prepared by placing the sample powder between two parallel gold-plated electrodes of a diameter of d = 30 mm and thickness of about 0.7 mm. First, the sample was kept at room temperature inside the spectrometer during 10 min to overcome humidity signal. Therefore, isothermal scans were performed on heating every 5 degrees over the temperature range of 290–310 K. Temperature was controlled by a nitrogen gas flow with stability better than ±0.1 K.
3. Results and Discussion
3.1. Thermal Gravimetric Analysis
Thermal Gravimetric Analysis (TGA) and Differential Thermal Gravimetric (DTG) (TA instruments, New Castle, DE, USA) measurements allow to identify the different water population in the sample. These data are deeply relevant for the interpretation of the dielectric response of the material. TGA and DTG curves of OPC and OPC/GNPs samples are shown in Figure 1. Clearly, both TGA and DTG measurements share similar temperature dependence behavior. The first peak at ~98 °C in DTG curve is associated with evaporable water in C-S-H gel and ettringite [69,70]. At ~140 °C we observe a further decrease in weight than can be related to gypsum or amorphous carbon illuminate hydrate decompositions [71]. Moreover, a stiff decrease is observed in TGA curve in the range between 390 °C–460 °C. Such event is associated to the dehydroxylation of Ca(OH)2 [72]. Finally, the peak at around ~680 °C is related to the decarbonation, together with possible solid-solid phase transformations [69].
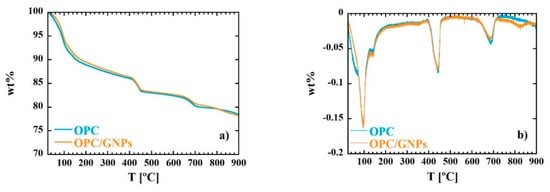
Figure 1.
Thermal Gravimetric (TG) (a) and Differential Thermal Gravimetric (DTG) (b) curves for OPC and OPC/GNPs samples.
In OPC/GNPs sample, a further peak in DTG curve is observed at ~825 °C. In Table 1, the weight percent loss corresponding to water and portlandite is shown. Both samples are characterized by a similar amount of free water (~7 wt%) at a temperature lower than 105 °C) and physical bound water of hydrates (~7.5 wt%). Moreover, OPC and OPC/GNPs specimens contains the same amount of Portlandite (15 wt%).

Table 1.
Free water, non-evaporable water cw% and portlandite content obtained by TGA analysis.
3.2. Impedance Response
The complex impedance function is defined as:
where the real part and the imaginary part are defined as Z′ = R and Z″ = 1/ωC, with R and C resistance and capacitance respectively. The plot in the complex Z″-Z′ plane, called Nyquist plot (Z″ vs. Z′), in the temperature range investigated (290–310 K) is shown in Figure 2. This representation allows to separate bulk properties from electrode polarization [73,74]. In the OPC sample, in the low frequency region (right side of the figure), a sloped line that can be related to cement-electrode interface contribution is observed [75,76,77]. At around 40 Hz, the line starts to diverge to a broad and asymmetric semi-circle corresponding to an overlap of polarization mechanisms in the bulk. From the intersection between interface and polarization contributions the bulk resistance value of 8.9 KΩ at 300 K was extracted. When graphene nanoplatelets are added to the cement paste some relevant changes in the Nyquist plot are observed. In fact, a stretching of the semi-arcs for frequencies higher than 40 Hz was clearly noticed and the bulk resistance at room temperature decreased to 3.9 KΩ indicating an enhance of charge transport in the composite sample. Such behavior is confirmed when the real part of the impedance of the reference is compared to that of the composite. In fact, the resistance of the OPC samples is, at low frequencies, almost three times higher than that measured for OPC/GNPs (see Figure 3a) and, even though such difference decreases with frequency, Z′ values of OPC are still two times larger than those observed in OPC/GNPs for f > 1 KHz. This effect has been already observed in alkali activated slag (AAS) composites with graphene and carbon nanotubes addition and it was related to the creation of conductive paths resulting in a reduction of electrical resistance [78,79,80]. However, due to the small amount of GNPs in our composite, a continuous conductive path is not formed as demonstrated by Bai et al. [41]. In Figure 3b, the capacitance of OPC and OPC/GNPs at 300 K is compared. In the low frequency region, the addition of graphene nanoplatelets increases the electrical capacitance of three times. However, as the frequency increased, the difference between the two samples almost disappeared. Finally, we observed an increment of C values as a function of temperature (Figure 4): Such effect appears stronger for f ≤ 1 KHz and, in particular, in the composite sample. Summarizing, an enhancement of electrical capacitance and charge transport properties is observed when 1 wt% of GNPs is added to the cement paste. As such an amount of filler is not sufficient to create a complete conductive path, a deeper analysis must be carried out to clarify how the fillers lead to the electrical improvements in the composite.

Figure 2.
Nyquist plot of the impedance of OPC (a) and OPC/GNPs (b). Dashed line is the extrapolation to high frequencies of the cement-electrode interface contribution.
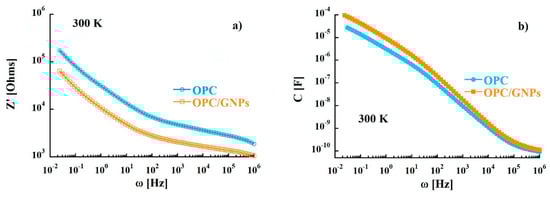
Figure 3.
(a) Dependence of the real part of the complex impedance function as a function of frequency. (b) Frequency dependence of capacitance at 300 K.
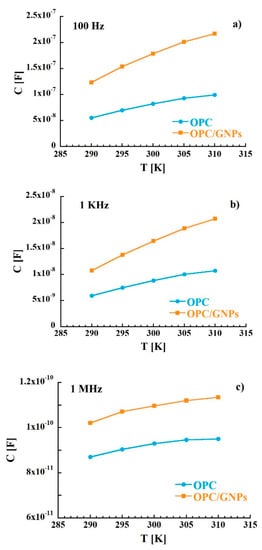
Figure 4.
Temperature dependence of the capacitance as at 100 Hz (a), 1 KHz (b) and 1 MHz (c).
3.3. Dielectric Response
Dielectric Spectroscopy allows us to investigate molecules dynamics, charge transport and interface interactions through the study of dipole reorientations when an alternative electric field is applied. In fact, depending on the temperature and frequency range, different dipole relaxations are observed, reflecting the distinct nature of the processes and interactions with the environment.
Through the characterization of the energy activations and characteristic relaxation times the information on the origin of the processes can be extracted. Moreover, the complex conductivity function can be calculated from the dielectric loss according to the relation and, hence, it is possible to investigate the mechanisms that mark the electrical properties of the system. Figure 5 shows the variation of the real part of the complex conductivity in the temperature range 290–310 K. The presence of GNPs leads to an increase of values in the whole frequency range. In both samples, the same frequency pattern is observed: (1) frequency dependent conductivity at high frequencies (f > 105 Hz) indicating an alternating current (ac) dominating contribution (2) an almost flat region related to the direct current (dc) (101 to 105 Hz) (3) a drastic drop at frequencies <100 Hz due to electrode polarization effects. Data were analyzed by using:
where is the dc conductivity, A is the pre-exponential factor and n is the exponential factor with values between 0 and 1 [81]. The resulting parameters are listed in Table 2. As expected, increases with temperature in both reference sample and composite. Moreover, the n parameter values of 0.17 tend low compared to those obtained for ionic conductors, 0.5 < n < 1, [82] and they are independent from both temperature and graphene nanoplatelets addition. In contrast, the values of are affected by GNPs: indeed, at room temperature they increase 4 times with respect to those measured in the reference sample at room temperature, and this effect grows with temperature.
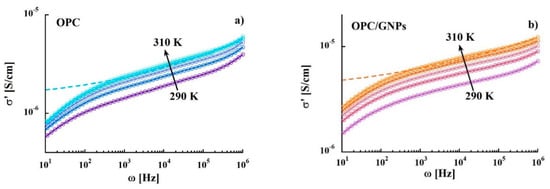
Figure 5.
Electrical conductivity as a function of frequency in the temperature range 290–310 K of OPC (a) and OPC/GNPs (b).
Table 2.
Parameters obtained from the Arrhenius equation applied to data in Figure 5.
Additionally, the temperature dependence of conductivity was analyzed considering the dc conductivity as a thermally activated process with activation energy calculated according to the Arrhenius relation [83]:
where σ0 is the pre-exponential factor associated with the charge carrier mobility and density of states, EA is the activation energy, kB is the Boltzmann constant and T is the temperature. The obtained activation energies, shown in Table 3, are low compared to those found for hopping conductivity (typically about 0.7–0.9 eV) [84]. Finally, we observed a decrease of the activation energy as we add graphene nanoplatelets. Figure 6 compares the variation of the real and imaginary part of the complex permittivity function of the samples with frequency at different temperatures. Regarding the real part ε′ (Figure 6a,c) a strong dispersion in the low frequency region is observed, followed by an almost frequency-independent behavior above 10 Hz. The decrease of ε′ can be attributed to electrode polarization and Maxwell-Wagner effect [85]. In the composite sample, we found higher values of ε′ at room temperature for f < 10 Hz. Moreover, we observed a severe temperature dependence of the dielectric constant that reach values almost one order of magnitude higher than in the reference sample. Regarding the imaginary part of the complex permittivity (Figure 6b,d), spectra of both specimens are characterized by a strong dispersion, as observed in ε′.
Table 3.
Activation Energy (EA) and pre-Exponential Factor (log [σ0]), which were obtained from the Arrhenius equation.
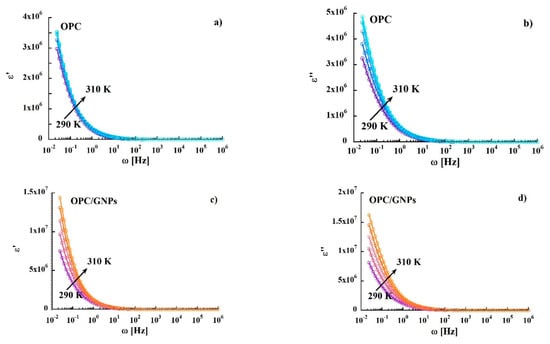
Figure 6.
Frequency dependence of real and imaginary part of permittivity in OPC, (a,b), and in OPC/GNPs, (c,d), in the temperature range 290–310 K.
Hence, in order to investigate the relaxation processes occurring in the samples, we focused our attention on the loss tangent [85] defined as:
In Figure 7a the spectra of the loss tangent of the reference, measured at different temperatures, are shown. In the whole temperature range the presence of two peaks is noticed. The most intense has the maximum centered at around 30 KHz and it does not show a strong dependence on temperature of the maximum position. On the other hand, the less intense peak at lower frequency is characterized by a clear dependence on the temperature of the peak maximum. Spectra of the loss tangent of the OPC/GNPs sample are shown in Figure 7b. The peak in the high frequency region is more intense than that found in OPC sample, even though the temperature dependence appears to be similar. On the other hand, the low frequency peak shows a different behavior when temperature is increased: The position of the maximum does not change with temperature, while the intensity increases.

Figure 7.
Variation of loss tangent in OPC (a) and OPC/GNPs (b) as a function of frequency in the temperature range 290–310 K.
Regarding the origin of those contributions, the peak at lower frequency appears where polarization effects were found both in the impedance response and in conductivity. Therefore, we believe that this contribution is given by electrode polarization or Maxwell-Wagner effect instead of some relaxation process. On the contrary, the intense peak of loss tangent appears in the frequency region where direct current is observed. A contribution with a similar weak temperature dependence was found at room temperature and at the same frequency range also in other porous materials [86,87,88]. In these works, the peak was related to the percolation of charge carriers through the porous network. To confirm this origin, we analyzed deeper the dielectric loss tangent spectra. In Figure 8 the relaxation times extracted from the position of the maximum of the peak are shown as a function of the inverse of temperature. In the composite specimen, a slight decrease of the relaxation times is observed. Furthermore, we observed a linear temperature dependence of log () typical of a simply thermal activated process.

Figure 8.
Temperature dependence of relaxation times extracted by the position of the peak maximum in the loss tangent.
Therefore, with the aim of obtaining information on the nature of the relaxation processes, the temperature dependence of τ values has been fitted with an Arrhenius law:
where τ0 is the pre-exponential factor the characteristic relaxation times of the process, EA is the activation energy, kB is the Boltzmann constant and T is the temperature. The resulting activation energy and pre-exponential factor parameters are shown in Table 4. First, we observed that the values of the pre-factor are larger than those typically observed for molecular vibrations ( 10−14–10−12 s). Moreover, the activation energies are similar to those found for the self-diffusion of ions through water in argillaceous rock porous network [89]. It is worth noting that the values of the activation energy calculated by the dielectric loss tangent correspond to those obtained by the direct current analysis indicating a correlation between these quantities. Therefore, we can associate the intense peak observed in dielectric loss tangent to the percolation of water molecules contributing to ion conductivity.
Table 4.
Activation Energy (EA) and pre-Exponential Factor (log [τ0 (s)]) values obtained from the Arrhenius equation applied to data in Figure 8.
Finally, such a scenario is supported by modulus formalism analysis with complex modulus defined as:
In Figure 9 the peaks of Z″, M″ and tgδ (normalized to the maximum value) are shown. We observed a significant mismatch between the position of the peak of the maximum in the imaginary part of electric modulus and the imaginary part of impedance. Such condition indicates a short-range nature of the motion of the charge carriers instead of long-range hopping mechanism [90].
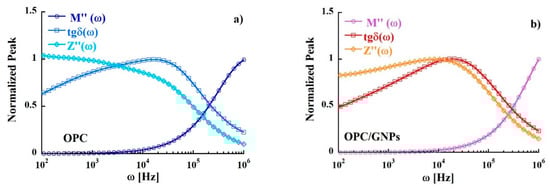
Figure 9.
Comparison of tgδ, M″ and Z″ as a function of frequency at 300 K in OPC (a) and OPC/GNPs (b).
Trying to elucidate how the presence of graphene nanoplatelets affect conductivity in cement paste, we summarize the main results of this work: First we observed an enhancement of the electrical properties in the composite by means of impedance response study, while dielectric response investigation proved that the main mechanism of charge transport is water percolation. At first sight, an increase of conductivity might be related to an increase of charge carriers in the composite, that is more water molecules in the specimen with GNPs. However, TG and DTG measurements showed that the samples have similar free water and bound water amount. Therefore, it is not possible to associate a raise of conductivity to an increase of charge carriers caused by GNPs presence. Consequently, the addition of graphene nanoplatelets must lead to some topological changes in the cement paste. This interpretation is supported by previous experimental works. In fact, it has been shown how the addition of graphene nanoplatelets lead to a refinement of the pore structure [43,91]. A small amount of GNPs reduces the percentage of macropores, even though the total porosity is slightly affected suggesting a broader distribution of small gel pores in the composite. Moreover, during the hydration process, C-S-H particles bonded to graphene flakes act as a nucleation site and promote the growth of C-S-H gel with higher crystallinity degree [92]. Under this scenario, we can explain the increase of ionic conductivity in relation with the enhancement of ordered C-S-H gel that promote a smoother diffusion of water molecules through the porous network. This would also explain the decrease of the energy activation of the relaxation process associated to water percolation and the slight smaller values of its relaxation times in OPC/GNPs sample.
4. Conclusions
With the aim of understanding the processes involved in conduction in cement-based materials, OPC cement paste and OPC/GNPs composite were studied by dielectric spectroscopy over a broad frequency range (10−2–106 Hz) and at different temperatures. At low frequency, the enhancement of charge transport properties, reflected by the decrease of bulk resistivity and Z′, is observed once graphene nanoplatelets are added to the cement paste. Moreover, the electrical capacitance shows higher values in the composite over all the frequency range investigated. Finally, the effect of GNPs on the dielectric response of the system was also investigated. Regarding conductivity, larger values of direct current was found in OPC/GNPs. Information on the origin was extracted by analyzing its temperature dependence: EA and n parameters calculated for both samples suggest that the main contribution to direct current is given by ion diffusion. Moreover, at around ~104 Hz, an intense peak is found in the loss tangent spectra. Previous dielectric studies on porous systems found a similar process related to water percolation through the pore network. The relaxation times associated to the maximum of this contribution were studied as a function of temperature: the calculated activation energy is close to that found for in the same frequency window and, therefore, these processes are correlated. Hence, we associated the intense peak observed in dielectric loss tangent to the percolation of water molecules contributing to ion conductivity. With respect to the role of the filler in the conduction enhancement, an increase of conductivity in the composite cannot be associated with an increase of charge carriers because TG and DTG measurements revealed that GNPs do not affect the water populations in the pore network. As graphene leads to a refinement of the pore, we propose that the enhancement of conductivity is mainly given by the ordered C-S-H gel structure growth around GNPs promoting the water diffusion and, therefore, resulting in an increase of conduction. It is clear that our results are calling for new experiments devoted to exploring the subtle changes provoked by GNP into the cementitious pore-network to favor the water percolation. In that sense, the combination of experiments and techniques like SANS [93,94], H-NMR [95,96], porosity measurements [97] can provide valuable help in understanding the conductivity of cementitious composites.
Author Contributions
Conceptualization, G.G. and J.S.D.; Experiments and Data analysis, G.G.; Writing—Original draft preparation, G.G. and J.S.D.; Writing—Review and Editing, G.G. and J.S.D.; Supervision, J.S.D. All authors have read and agreed to the published version of the manuscript.
Funding
This work is partially supported by the Gobierno Vasco-UPV/EHU project IT1246-19 and the Spanish Ministry of Science, Innovation and Universities projects PCI2019-103657 and RTI2018-098554-B-I00. The project is co-funded by EUSKAMPUS FUNDAZIOA.
Conflicts of Interest
The authors declare no conflict of interest.
References
- El-Dieb, A.S.; El-Ghareeb, M.A.; Abdel-Rahman, M.A.H.; Nasr, E.S.A. Multifunctional electrically conductive concrete using different fillers. J. Build. Eng. 2018, 15, 61–69. [Google Scholar] [CrossRef]
- Yehia, S.A.; Tua, C.Y. Thin conductive concrete overlay for bridge deck deicing and anti-icing. Transp. Res. Rec. 2000, 1698, 45–53. [Google Scholar] [CrossRef]
- Zhao, H.; Wu, Z.; Wang, S.; Zheng, J.; Che, G. Concrete pavement deicing with carbon fiber heating wires. Cold Reg. Sci. Technol. 2011, 65, 413–420. [Google Scholar] [CrossRef]
- Wu, J.; Liu, J.; Yang, F. Three-phase composite conductive concrete for pavement deicing. Constr. Build. Mater. 2015, 75, 129–135. [Google Scholar] [CrossRef]
- Bertolini, L.; Bolzoni, F.; Pastore, T.; Pedeferri, P. Effectiveness of a conductive cementitious mortar anode for cathodic protection of steel in concrete. Cem. Concr. Res. 2004, 34, 681–694. [Google Scholar] [CrossRef]
- Jing, X.; Wu, Y. Electrochemical studies on the performance of conductive overlay material in cathodic protection of reinforced concrete. Constr. Build. Mater. 2011, 25, 2655–2662. [Google Scholar] [CrossRef]
- Yao, W.; Xu, J. Current distribution in reinforced concrete cathodic protection system. Tongji Daxue Xuebao/J. Tongji Univ. 2009, 37, 1014–1018. [Google Scholar]
- Han, B.; Kwon, E.; Yu, X. Self-sensing CNT/cement composite for traffic monitoring Strength improvement additives for cement bitumen emulsion mixture View project A self-sensing carbon nanotube/cement composite for traffic monitoring. Nanotechnology 2009, 20, 445501. [Google Scholar] [CrossRef]
- Qin, Z.; Wang, Y.; Mao, X.; Xie, X. Development of graphite electrically conductive concrete and application in grounding engineering. New Build. Mater 2009, 11, 46–48. [Google Scholar]
- Chung, D.D.L. Electrically conductive cement-based materials. Adv. Cem. Res. 2004, 16, 169–176. [Google Scholar] [CrossRef]
- Guan, H.; Liu, S.; Duan, Y.; Cheng, J. Cement Based Electromagnetic Shielding and Absorbing Building Materials; Elsevier: Amsterdam, The Netherlands, 2006. [Google Scholar]
- Wen, S.; Chung, D.D.L. Double percolation in the electrical conduction in carbon fiber reinforced cement-based materials. Carbon N. Y. 2007, 45, 263–267. [Google Scholar] [CrossRef]
- Chung, D.D.L. Development, design and applications of structural capacitors. Appl. Energy 2018, 231, 89–101. [Google Scholar] [CrossRef]
- Zhang, J.; Xu, J.; Zhang, D. A structural supercapacitor based on graphene and hardened cement paste. J. Electrochem. Soc. 2016, 163, E83–E87. [Google Scholar] [CrossRef]
- Xu, J.; Zhang, D. Multifunctional structural supercapacitor based on graphene and geopolymer. Electrochim. Acta 2017, 224, 105–112. [Google Scholar] [CrossRef]
- Wang, L.; Aslani, F. A review on material design, performance, and practical application of electrically conductive cementitious composites. Constr. Build. Mater. 2019, 229, 116892. [Google Scholar] [CrossRef]
- Berrocal, C.G.; Hornbostel, K.; Geiker, M.R.; Löfgren, I.; Lundgren, K.; Bekas, D.G. Electrical resistivity measurements in steel fibre reinforced cementitious materials. Cem. Concr. Compos. 2018, 89, 216–229. [Google Scholar] [CrossRef]
- Banthia, N.; Djeridane, S.; Pigeon, M. Electrical resistivity of carbon and steel micro-fiber reinforced cements. Cem. Concr. Res. 1992, 22, 804–814. [Google Scholar] [CrossRef]
- Wen, S.; Chung, D.D.L. A comparative study of steel- and carbon-fibre cement as piezoresistive strain sensors. Adv. Cem. Res. 2003, 15, 119–128. [Google Scholar] [CrossRef]
- Lunak, M.; Kusak, I.; Chobola, Z. Carbon Admixtures Influence on the Electrical Properties of Slag Mortars Focusing on Alternating Conductivity and Permittivity. Procedia Eng. 2016, 151, 236–240. [Google Scholar] [CrossRef]
- He, Y.; Lu, L.; Jin, S.; Hu, S. Conductive aggregate prepared using graphite and clay and its use in conductive mortar. Constr. Build. Mater. 2014, 53, 131–137. [Google Scholar] [CrossRef]
- Wang, H.; Yang, J.; Liao, H.; Chen, X. Electrical and mechanical properties of asphalt concrete containing conductive fibers and fillers. Constr. Build. Mater. 2016, 122, 184–190. [Google Scholar] [CrossRef]
- Chen, B.; Wu, K.; Yao, W. Conductivity of carbon fiber reinforced cement-based composites. Cem. Concr. Compos. 2004, 26, 291–297. [Google Scholar] [CrossRef]
- Fu, X.; Chung, D.D.L. Carbon fiber reinforced mortar as an electrical contact material for cathodic protection. Cem. Concr. Res. 1995, 25, 689–694. [Google Scholar] [CrossRef]
- Hou, Z.; Li, Z.; Wang, J. Electrical conductivity of the carbon fiber conductive concrete. J. Wuhan Univ. Technol. Mater. Sci. Ed. 2007, 22, 346–349. [Google Scholar] [CrossRef]
- Donnini, J.; Bellezze, T.; Corinaldesi, V. Mechanical, electrical and self-sensing properties of cementitious mortars containing short carbon fibers. J. Build. Eng. 2018, 20, 8–14. [Google Scholar] [CrossRef]
- Peyvandi, A.; Soroushian, P.; Balachandra, A.M.; Sobolev, K. Enhancement of the durability characteristics of concrete nanocomposite pipes with modified graphite nanoplatelets. Constr. Build. Mater. 2013, 47, 111–117. [Google Scholar] [CrossRef]
- Alkhateb, H.; Al-Ostaz, A.; Cheng, A.H.D.; Li, X. Materials genome for graphene-cement nanocomposites. J. Nanomech. Micromech. 2013, 3, 67–77. [Google Scholar] [CrossRef]
- Raut, P.; Swanson, N.; Kulkarni, A.; Pugh, C.; Jana, S.C. Exploiting arene-perfluoroarene interactions for dispersion of carbon black in rubber compounds. Polymer 2018, 148, 247–258. [Google Scholar] [CrossRef]
- Ding, Y.; Chen, Z.; Han, Z.; Zhang, Y.; Pacheco-Torgal, F. Nano-carbon black and carbon fiber as conductive materials for the diagnosing of the damage of concrete beam. Constr. Build. Mater. 2013, 43, 233–241. [Google Scholar] [CrossRef]
- Monteiro, A.O.; Cachim, P.B.; Costa, P.M.F.J. Electrical Properties of Cement-based Composites Containing Carbon Black Particles. Mater. Today Proc. 2015, 2, 193–199. [Google Scholar] [CrossRef]
- Yu, X.; Kwon, E. A carbon nanotube/cement composite with piezoresistive properties. Smart Mater. Struct. 2009, 18. [Google Scholar] [CrossRef]
- Saafi, M.; Andrew, K.; Tang, P.L.; McGhon, D.; Taylor, S.; Rahman, M.; Yang, S.; Zhou, X. Multifunctional properties of carbon nanotube/fly ash geopolymeric nanocomposites. Constr. Build. Mater. 2013, 49, 46–55. [Google Scholar] [CrossRef]
- Kusak, I.; Lunak, M.; Rovnanik, P. Electric Conductivity Changes in Geopolymer Samples with Added Carbon Nanotubes. Procedia Eng. 2016, 151, 157–161. [Google Scholar] [CrossRef]
- Kim, H.K.; Nam, I.W.; Lee, H.K. Enhanced effect of carbon nanotube on mechanical and electrical properties of cement composites by incorporation of silica fume. Compos. Struct. 2014, 107, 60–69. [Google Scholar] [CrossRef]
- Gao, D.; Sturm, M.; Mo, Y.L. Electrical resistance of carbon-nanofiber concrete. Smart Mater. Struct. 2009, 18. [Google Scholar] [CrossRef]
- Konsta-Gdoutos, M.S.; Aza, C.A. Self sensing carbon nanotube (CNT) and nanofiber (CNF) cementitious composites for real time damage assessment in smart structures. Cem. Concr. Compos. 2014, 53, 162–169. [Google Scholar] [CrossRef]
- Azhari, F.; Banthia, N. Cement-based sensors with carbon fibers and carbon nanotubes for piezoresistive sensing. Cem. Concr. Compos. 2012, 34, 866–873. [Google Scholar] [CrossRef]
- Materazzi, A.L.; Ubertini, F.; D’Alessandro, A. Carbon nanotube cement-based transducers for dynamic sensing of strain. Cem. Concr. Compos. 2013, 37, 2–11. [Google Scholar] [CrossRef]
- Yoo, D.Y.; You, I.; Lee, S.J. Electrical properties of cement-based composites with carbon nanotubes, graphene, and graphite nanofibers. Sensors 2017, 17, 1064. [Google Scholar] [CrossRef]
- Bai, S.; Jiang, L.; Jiang, Y.; Jin, M.; Jiang, S.; Tao, D. Research on electrical conductivity of graphene/cement composites. Adv. Cem. Res. 2018, 1–8. [Google Scholar] [CrossRef]
- Sun, S.; Han, B.; Jiang, S.; Yu, X.; Wang, Y.; Li, H.; Ou, J. Nano graphite platelets-enabled piezoresistive cementitious composites for structural health monitoring. Constr. Build. Mater. 2017, 136, 314–328. [Google Scholar] [CrossRef]
- Du, H.; Pang, S.D. Enhancement of barrier properties of cement mortar with graphene nanoplatelet. Cem. Concr. Res. 2015, 76, 10–19. [Google Scholar] [CrossRef]
- Jing, G.; Ye, Z.; Lu, X.; Hou, P. Effect of graphene nanoplatelets on hydration behaviour of Portland cement by thermal analysis. Adv. Cem. Res. 2017, 29, 63–70. [Google Scholar] [CrossRef]
- Haddad, A.S.; Chung, D.D.L. Decreasing the electric permittivity of cement by graphite particle incorporation. Carbon N. Y. 2017, 122, 702–709. [Google Scholar] [CrossRef]
- Wen, S.; Chung, D.D.L. The role of electronic and ionic conduction in the electrical conductivity of carbon fiber reinforced cement. Carbon N. Y. 2006, 44, 2130–2138. [Google Scholar] [CrossRef]
- Molak, A.; Paluch, M.; Pawlus, S.; Klimontko, J.; Ujma, Z.; Gruszka, I. Electric modulus approach to the analysis of electric relaxation in highly conducting (Na0.75Bi0.25)(Mn0.25Nb 0.75)O3 ceramics. J. Phys. D Appl. Phys. 2005, 38, 1450–1460. [Google Scholar] [CrossRef]
- Raevski, I.P.; Prosandeev, S.A.; Bogatin, A.S.; Malitskaya, M.A.; Jastrabik, L. High dielectric permittivity in AFe1/2B1/2O3 nonferroelectric perovskite ceramics (A=Ba, Sr, Ca; B=Nb, Ta, Sb). J. Appl. Phys. 2003, 93, 4130–4136. [Google Scholar] [CrossRef]
- Karthik, C.; Varma, K.B.R. Dielectric and AC conductivity behavior of BaBi2Nb2O9 ceramics. J. Phys. Chem. Solids 2006, 67, 2437–2441. [Google Scholar] [CrossRef]
- Acharya, T.; Choudhary, R.N.P. Structural, dielectric and impedance characteristics of CoTiO3. Mater. Chem. Phys. 2016, 177, 131–139. [Google Scholar] [CrossRef]
- Lin, Y.Q.; Chen, X.M.; Liu, X.Q. Relaxor-like dielectric behavior in La2NiMnO6 double perovskite ceramics. Solid State Commun. 2009, 149, 784–787. [Google Scholar] [CrossRef]
- Wang, W.G.; Li, X.Y. Impedance and dielectric relaxation spectroscopy studies on the calcium modified Na0.5Bi0.44Ca0.06TiO2.97 ceramics. AIP Adv. 2017, 7. [Google Scholar] [CrossRef]
- Cerveny, S.; Arrese-Igor, S.; Dolado, J.S.; Gaitero, J.J.; Alegra, A.; Colmenero, J. Effect of hydration on the dielectric properties of C-S-H gel. J. Chem. Phys. 2011, 134. [Google Scholar] [CrossRef] [PubMed]
- Monasterio, M.; Jansson, H.; Gaitero, J.J.; Dolado, J.S.; Cerveny, S. Cause of the fragile-to-strong transition observed in water confined in C-S-H gel. J. Chem. Phys. 2013, 139. [Google Scholar] [CrossRef] [PubMed]
- Goracci, G.; Monasterio, M.; Jansson, H.; Cerveny, S. Dynamics of nano-confined water in Portland cement-Comparison with synthetic C-S-H gel and other silicate materials. Sci. Rep. 2017, 7, 1–10. [Google Scholar] [CrossRef]
- Swenson, J.; Jansson, H.; Bergman, R. Relaxation processes in supercooled confined water and implications for protein dynamics. Phys. Rev. Lett. 2006, 96, 1–4. [Google Scholar] [CrossRef]
- Ryabov, Y.; Gutina, A.; Arkhipov, V.; Feldman, Y. Dielectric Relaxation of Water Absorbed in Porous Glass. J. Phys. Chem. B 2001, 105, 1845–1850. [Google Scholar] [CrossRef]
- Gutina, A.; Antropova, T.; Rysiakiewicz-Pasek, E.; Virnik, K.; Feldman, Y. Dielectric relaxation in porous glasses. Microporous Mesoporous Mater. 2003, 58, 237–254. [Google Scholar] [CrossRef]
- Vasilyeva, M.A.; Gusev, Y.A.; Shtyrlin, V.G.; Gutina, A.G.; Puzenko, A.; Ishai, P.B.; Feldman, Y. Dielectric relaxation of water in clay minerals. Clays Clay Miner. 2014, 62, 62–73. [Google Scholar] [CrossRef]
- Feldman, Y.; Puzenko, A.; Ryabov, Y. Dielectric relaxation phenomena in complex materials. Fractals Diffus. Relax. Disord. Complex Syst. A Spec. Vol. Adv. Chem. Phys. 2006, 133, 125. [Google Scholar]
- Tsangaris, G.M.; Psarras, G.C.; Kouloumbi, N. Electric modulus and interfacial polarization in composite polymeric systems. J. Mater. Sci. 1998, 33, 2027–2037. [Google Scholar] [CrossRef]
- Psarras, G.C. Hopping conductivity in polymer matrix-metal particles composites. Compos. Part A Appl. Sci. Manuf. 2006, 37, 1545–1553. [Google Scholar] [CrossRef]
- Sanida, A.; Stavropoulos, S.G.; Speliotis, T.; Psarras, G.C. Development, characterization, energy storage and interface dielectric properties in SrFe12O19/ epoxy nanocomposites. Polymer 2017, 120, 73–81. [Google Scholar] [CrossRef]
- Dang, Z.M.; Nan, C.W.; Xie, D.; Zhang, Y.H.; Tjong, S.C. Dielectric behavior and dependence of percolation threshold on the conductivity of fillers in polymer-semiconductor composites. Appl. Phys. Lett. 2004, 85, 97–99. [Google Scholar] [CrossRef]
- Zhu, M.; Huang, X.; Yang, K.; Zhai, X.; Zhang, J.; He, J.; Jiang, P. Energy storage in ferroelectric polymer nanocomposites filled with core-shell structured polymer@BaTiO3 nanoparticles: Understanding the role of polymer shells in the interfacial regions. ACS Appl. Mater. Interfaces 2014, 6, 19644–19654. [Google Scholar] [CrossRef]
- Palomba, M.; Carotenuto, G.; Longo, A.; Sorrentino, A.; Di Bartolomeo, A.; Iemmo, L.; Urban, F.; Giubileo, F.; Barucca, G.; Rovere, M.; et al. Thermoresistive properties of graphite platelet films supported by different substrate. Materials 2019, 12, 3638. [Google Scholar] [CrossRef]
- Gorrasi, G.; Bugatti, V.; Milone, C.; Mastronardo, E.; Piperopoulos, E.; Iemmo, L.; Di Bartolomeo, A. Effect of temperature and morphology on the electrical properties of PET/conductive nanofillers composites. Compos. Part B Eng. 2018, 135, 149–154. [Google Scholar] [CrossRef]
- Khan, S.; Lorenzelli, L. Recent advances of conductive nanocomposites in printed and flexible electronics. Smart Mater. Struct. 2017, 26, 083001. [Google Scholar] [CrossRef]
- Sha, W.; O’Neill, E.A.; Guo, Z. Differential scanning calorimetry study of ordinary Portland cement. Cem. Concr. Res. 1999, 29, 1487–1489. [Google Scholar] [CrossRef]
- Sha, W.; Pereira, G.B. Differential scanning calorimetry study of ordinary Portland cement paste containing metakaolin and theoretical approach of metakaolin activity. Cem. Concr. Compos. 2001, 23, 455–461. [Google Scholar] [CrossRef]
- Alarcon-Ruiz, L.; Platret, G.; Massieu, E.; Ehrlacher, A. The use of thermal analysis in assessing the effect of temperature on a cement paste. Cem. Concr. Res. 2005, 35, 609–613. [Google Scholar] [CrossRef]
- Esteves, L.P. On the hydration of water-entrained cement-silica systems: Combined SEM, XRD and thermal analysis in cement pastes. Thermochim. Acta 2011, 518, 27–35. [Google Scholar] [CrossRef]
- Kyritsis, A.; Siakantari, M.; Vassilikou-Dova, A.; Pissis, P.; Varotsos, P. Dielectric and electrical properties of polycrystalline rocks at various hydration levels. IEEE Trans. Dielectr. Electr. Insul. 2000, 7, 493–497. [Google Scholar] [CrossRef]
- Schwan, H.P. Electrod polarization impedance and measurements in biological materials. Ann. N. Y. Acad. Sci. 1968, 148, 191–209. [Google Scholar] [CrossRef] [PubMed]
- Cabeza, M.; Merino, P.; Miranda, A.; Nóvoa, X.R.; Sanchez, I. Impedance spectroscopy study of hardened Portland cement paste. Cem. Concr. Res. 2002, 32, 881–891. [Google Scholar] [CrossRef]
- Gu, P.; Xie, P.; Fu, Y.; Beaudoin, J.J. AC impedance phenomena in hydrating cement systems: Frequency dispersion angle and pore size distribution. Cem. Concr. Res. 1994, 24, 86–88. [Google Scholar] [CrossRef]
- Keddam, M.; Takenouti, H.; Nóvoa, X.R.; Andrade, C.; Alonso, C. Impedance measurements on cement paste. Cem. Concr. Res. 1997, 27, 1191–1201. [Google Scholar] [CrossRef]
- Lunak, M.; Kusak, I. Modern Electrical Measurement of Alkali Activated Slag Mortars with Increased Electrical Conductivity. Appl. Mech. Mater. 2016, 861, 64–71. [Google Scholar] [CrossRef]
- Kusak, I.; Lunak, M.; Chobola, Z. Monitoring of concrete hydration by electrical measurement methods. Procedia Eng. 2016, 51, 271–276. [Google Scholar] [CrossRef][Green Version]
- Kusak, I.; Lunak, M.; Mikova, M.; Rovnanik, P. Influence of carbon admixtures to the electrical conductivity of slag mortars. Solid State Phenom. 2017, 258, 465–468. [Google Scholar] [CrossRef]
- Jonscher, A.K. Dielectric relaxation in solids. J. Phys. D Appl. Phys. 1999, 32, R57–R70. [Google Scholar] [CrossRef]
- Mauritz, K.A.; Yun, H. Dielectric Relaxation Studies of Ion Motions in Electrolyte-Containing Perfluorosulfonate Ionomers. 3. ZnSO4 and CaCl2 Systems. Macromolecules 1989, 22, 220–225. [Google Scholar] [CrossRef]
- Dyre, J.C. The random free-energy barrier model for ac conduction in disordered solids. J. Appl. Phys. 1988, 64, 2456–2468. [Google Scholar] [CrossRef]
- MacOvez, R.; Zachariah, M.; Romanini, M.; Zygouri, P.; Gournis, D.; Tamarit, J.L. Hopping conductivity and polarization effects in a fullerene derivative salt. J. Phys. Chem. C 2014, 118, 12170–12175. [Google Scholar] [CrossRef]
- Kremer, F.; Schönhals, A. Broadband Dielectric Spectroscopy; Springer: Berlin/Heidelberg, Germany, 2003; ISBN 9783642628092. [Google Scholar]
- Axelrod, E.; Givant, A.; Shappir, J.; Feldman, Y.; Sa’ar, A. Dielectric relaxation and porosity determination of porous silicon. J. Non. Cryst. Solids 2002, 305, 235–242. [Google Scholar] [CrossRef]
- Øye, G.; Axelrod, E.; Feldman, Y.; Sjöblom, J.; Stöcker, M. Dielectric properties and Fourier transform IR analysis of MCM-48, Al-MCM-48 and Ti-MCM-48 mesoporous materials. Colloid Polym. Sci. 2000, 278, 517–523. [Google Scholar] [CrossRef]
- Gutina, A.; Axelrod, E.; Puzenko, A.; Rysiakiewicz-Pasek, E.; Kozlovich, N.; Feldman, Y. Dielectric relaxation of porous glasses. J. Non Cryst. Solids 1998, 235–237, 302–307. [Google Scholar] [CrossRef]
- Van Loon, L.R.; Müller, W.; Iijima, K. Activation energies of the self-diffusion of HTO, 22Na+ and 36Cl- in a highly compacted argillaceous rock (Opalinus Clay). Appl. Geochem. 2005, 20, 961–972. [Google Scholar] [CrossRef]
- Gerhardt, R. Impedance and Dielectric Revisited: Distinguishing From Long-Range Conductivity. J. Phys. Chem. Solids 1994, 55, 1491–1506. [Google Scholar] [CrossRef]
- Du, H.; Gao, H.J.; Pang, S.D. Improvement in concrete resistance against water and chloride ingress by adding graphene nanoplatelet. Cem. Concr. Res. 2016, 83, 114–123. [Google Scholar] [CrossRef]
- Dimov, D.; Amit, I.; Gorrie, O.; Barnes, M.D.; Townsend, N.J.; Neves, A.I.S.; Withers, F.; Russo, S.; Craciun, M.F. Ultrahigh Performance Nanoengineered Graphene—Concrete Composites for Multifunctional Applications. Adv. Funct. Mater. 2018, 28. [Google Scholar] [CrossRef]
- Jennings, H.M.; Thomas, J.J.; Gevrenov, J.S.; Constantinides, G.; Ulm, F.J. A multi-technique investigation of the nanoporosity of cement paste. Cem. Concr. Res. 2007, 37, 329–336. [Google Scholar] [CrossRef]
- Allen, A.J.; Windsor, C.G.; Rainey, V.; Pearson, D.; Double, D.D.; Alford, N.M. A Small-Angle Neutron-Scattering Study of Cement Porosities. J. Phys. D Appl. Phys. 1982, 15, 1817–1833. [Google Scholar] [CrossRef]
- Valori, A.; McDonald, P.J.; Scrivener, K.L. The morphology of C-S-H: Lessons from 1H nuclear magnetic resonance relaxometry. Cem. Concr. Res. 2013, 49, 65–81. [Google Scholar] [CrossRef]
- Mogami, Y.; Yamazaki, S.; Matsuno, S.; Matsui, K.; Noda, Y.; Takegoshi, K. Hydrogen cluster/network in tobermorite as studied by multiple-quantum spin counting 1H NMR. Cem. Concr. Res. 2014, 66, 115–120. [Google Scholar] [CrossRef]
- Raut, P.; Liang, W.; Chen, Y.M.; Zhu, Y.; Jana, S.C. Syndiotactic Polystyrene-Based Ionogel Membranes for High Temperature Electrochemical Applications. ACS Appl. Mater. Interfaces 2017, 9, 30933–30942. [Google Scholar] [CrossRef]
© 2020 by the authors. Licensee MDPI, Basel, Switzerland. This article is an open access article distributed under the terms and conditions of the Creative Commons Attribution (CC BY) license (http://creativecommons.org/licenses/by/4.0/).