Abstract
Voltage stability assessment under transmission contingencies is traditionally performed using severity-based indices evaluated on isolated outage scenarios. While effective for identifying extreme events, such approaches provide limited insight into which transmission corridors structurally govern voltage-stress behavior across the full contingency space. This paper introduces a persistence-based diagnostic framework for voltage stability assessment under exhaustive line contingencies, using the Fast Voltage Stability Index (FVSI) as a base indicator. Rather than ranking lines by instantaneous severity, the proposed methodology identifies dominant transmission lines—defined as those attaining the maximum FVSI in each convergent contingency—and aggregates these outcomes statistically to quantify dominance persistence, conditional severity, and dispersion. A dominance concentration metric () is introduced to measure how many transmission corridors are sufficient to explain the majority of dominant voltage-stress events. The framework is applied to IEEE 14, 30, and 118-bus benchmark systems under exhaustive enumeration. Results reveal a clear phenomenon of dominance collapse: as system size increases, dominant voltage-stress outcomes concentrate onto an extremely small set of transmission corridors. While IEEE 14 exhibits partial dominance dispersion (), both IEEE 30 and IEEE 118 demonstrate near-total dominance collapse (), where a single corridor governs more than 90% of dominant FVSI events. The proposed approach is fully deterministic, scalable, and independent of control or optimization assumptions, making it well-suited for planning-stage screening, monitoring prioritization, and pre-filtering of large-scale contingency studies. By shifting voltage stability analysis from severity-only screening to persistence-based structural diagnosis, this work provides new insight into vulnerability concentration in modern transmission networks.
1. Introduction
Voltage stability remains a critical concern in the planning and operation of modern electrical power systems, particularly under increasing system loading, network expansion, and contingency-driven stress conditions. Transmission networks must be capable of sustaining acceptable voltage profiles not only under normal operation, but also following credible disturbances such as line outages, generator failures, or topology reconfigurations. Among these, transmission line contingencies represent a fundamental reliability criterion and continue to serve as a benchmark for vulnerability assessment in transmission systems.
Recent literature continues to emphasize that voltage-stability vulnerability under contingencies is not fully characterized by isolated worst-case events, particularly as transmission networks become more stressed, interconnected, and exposed to extreme operating conditions. Prior studies have highlighted the continued relevance of contingency-driven voltage-security assessment and the need for screening methodologies that remain interpretable across wide outage ensembles and stressed regimes [1,2,3].
These works collectively motivate the development of diagnostics that go beyond single-scenario severity, supporting the identification of structurally critical corridors that repeatedly govern system stress behavior.
A wide range of voltage stability indices have been proposed to support contingency analysis and system screening, including the Fast Voltage Stability Index (FVSI), L-index, FVSI-derived variants, and other line-based or bus-based indicators. These indices are typically employed to quantify proximity to voltage instability at a given operating point or under a specific disturbance scenario. In practice, however, transmission planners and operators are rarely concerned with a single contingency in isolation. Instead, the key challenge lies in identifying structurally critical transmission elements that repeatedly govern voltage-stress behavior across a large set of plausible outages [4].
Most existing voltage-stability assessments implicitly assume that severity alone is sufficient to characterize criticality: transmission lines or buses are ranked according to the maximum value of a chosen index under a given scenario. While this approach is effective for identifying extreme events, it does not capture how often a given element becomes critical across the contingency space. As a result, lines that exhibit high index values in rare scenarios may be overemphasized, whereas lines that repeatedly dominate voltage stress under diverse contingencies may be underprioritized [5].
This paper addresses this limitation by introducing a persistence-based diagnostic framework for voltage stability assessment under exhaustive transmission line contingencies. Using the Fast Voltage Stability Index (FVSI) as a base indicator, the proposed methodology shifts the analytical focus from isolated severity toward dominance persistence: the frequency with which a transmission line emerges as the most critical element across the full contingency ensemble. Rather than proposing a new stability index or control strategy, the work reinterprets FVSI outcomes through statistical aggregation, enabling the identification of structurally dominant corridors that govern worst-case voltage-stress propagation.
The proposed framework is applied to three benchmark transmission systems of increasing scale and complexity: IEEE 14-, 30-, and 118-bus networks. Through exhaustive enumeration, the study demonstrates that voltage-stress dominance becomes increasingly concentrated as system size grows, leading to a phenomenon referred to as dominance collapse, in which a very small number of transmission corridors account for the majority of dominant FVSI events. This behavior has direct implications for planning-stage screening, monitoring prioritization, and preventive reinforcement strategies.
Several comprehensive reviews have addressed voltage and stress stability assessment from analytical, index-based, and operational perspectives, highlighting both classical criteria and emerging challenges under increasing system stress and structural complexity. Despite these advances, most existing approaches emphasize isolated severity metrics or specific operating scenarios, motivating the need for diagnostic frameworks that identify structurally critical transmission elements across the full contingency space.
The main contributions of this paper are summarized as follows:
- Resolves a key limitation of severity-only contingency screening: This research shows that ranking lines solely by high FVSI values in isolated outages can misrepresent structural vulnerability, because it ignores how often an element governs worst-case behavior across the contingency space.
- Introduces a persistence-based dominance diagnostic: the proposed framework identifies dominant lines (maximum-FVSI lines per convergent contingency) and aggregates them to quantify dominance persistence, conditional severity, and dispersion in a reproducible manner.
- Provides a compact dominance-concentration indicator: the metric quantifies how many corridors explain 90% of dominant events, enabling direct interpretation of whether vulnerability is dispersed or collapses onto a sparse set.
- Delivers cross-scale evidence of dominance collapse: exhaustive enumeration on IEEE 14/30/118 reveals that dominant FVSI outcomes increasingly concentrate onto a tiny corridor set as system size grows, supporting planning-stage prioritization and contingency pre-filtering.
The remainder of the paper is organized as follows. Section 2 reviews related work on voltage stability indices and contingency-based screening. Section 3 details the proposed persistence-based FVSI framework. Section 4 presents and analyzes the results for the benchmark systems. Section 5 discusses physical interpretation and practical implications. Finally, conclusions are drawn in the last section.
2. Related Work and Background
Voltage stability assessment and reinforcement under transmission contingencies has been widely studied through two complementary streams: (i) index-based screening and ranking to identify weak buses/lines, and (ii) corrective planning and control using reactive power compensation (FACTS devices) and optimization. Within these streams, the Fast Voltage Stability Index (FVSI) remains one of the most frequently adopted line-based indicators due to its simplicity and strong correlation with proximity to voltage collapse. The following review summarizes the most relevant contributions and clarifies the gap addressed by the present persistence-based dominance framework.
2.1. FVSI-Based Identification, Contingency Screening, and Severity Ranking
A common approach is to combine Newton–Raphson (NR) power flow with FVSI to rank contingencies or identify critical transmission corridors. The work in [6] presents an FVSI-based contingency severity assessment under single line outages, showing that FVSI ranking can effectively prioritize critical outages for preventive actions. Similarly, Ref. [7] applies NR power flow together with FVSI and LQP to rank contingencies and detect weak lines, reinforcing FVSI as a consistent severity indicator across benchmark systems. Beyond basic ranking, Ref. [4] proposes an automated contingency analysis and ranking tool that integrates load flow, line removal, voltage stability evaluation, and ranking within a single workflow, reducing computation time and supporting fast on-line screening. A related direction appears in [8], where classical FVSI is complemented with a Reduced FVSI (RFVSI) and a fuzzy logic (FL) layer to accelerate contingency ranking while maintaining accuracy comparable to FVSI.
While these studies confirm FVSI as a practical severity metric, their analysis is typically scenario-centric; criticality is inferred from high index values in individual contingencies or from instantaneous ranking results. This often provides limited insight into whether the same transmission corridor repeatedly governs the system’s stressed behavior across the full contingency space.
2.2. Reactive Support Planning Under Contingencies (SVC/FACTS) Guided by FVSI
A significant portion of the literature uses FVSI (alone or alongside other indices) to guide the placement and sizing of reactive power compensation devices under contingencies. In [9], FVSI is used to identify the weakest bus while continuation power flow (CPF) determines maximum loadability; an SVC placed at the selected location enhances voltage recovery and reduces losses in the IEEE 14-bus system. A more systematic framework is reported in [1], combining NR power flow with exhaustive contingency evaluation to identify critical lines and then determine the optimal location and sizing of a single SVC across IEEE 14, 30, and 118-bus systems, achieving full recovery of FVSI and voltage profile to pre-contingency conditions.
Several works extend this principle by combining FVSI-based screening with metaheuristic optimization. For instance, Ref. [5] allocates SVC and TCSC by identifying weak buses and lines via VCPI and FVSI, then applying particle swarm optimization (PSO) to tune device ratings, yielding improved voltage profiles and reduced losses. The study in [10] uses FVSI to identify congested/critical lines and sizes SVC through an Adaptive Embedded Clonal Evolutionary Programming (AECEP) algorithm, reporting substantial loss reductions and voltage recovery in IEEE 30- and 118-bus systems. Multi-criteria and coordinated FACTS planning is also common: Ref. [11] proposes a multiobjective reactive power planning scheme under contingencies using a hybrid PSO–GSA algorithm and FVSI/Lmn indices; Ref. [12] coordinates shunt and series FACTS deployment (STATCOM, SSSC, UPFC) using CPF-based contingency ranking and multiple indices (including FVSI), improving voltage stability margins and loadability limits.
Related contingency-driven placement strategies have also been developed for series and hybrid controllers. In [13], a UPFC is placed using a fuzzy ranking index to improve voltage stability and reduce losses under outage scenarios; Ref. [14] coordinates SVC, TCSC, and UPFC placement for maximum loadability under and contingencies using CSI and FVSI with a modified differential evolution algorithm. Alternative line-based indices are occasionally used with similar planning objectives, such as LSI-guided TCSC sizing under line outages [15]. Moreover, FVSI has also been discussed as a monitoring-oriented indicator when combined with synchronized measurements in broader instrumentation studies [16]; however, the present work remains strictly focused on offline, planning-stage contingency diagnostics rather than real-time implementation.
Overall, these works show that FVSI is effective as a trigger for planning or control. However, the primary objective in these studies is device deployment and operational improvement, not the structural characterization of which lines are persistently dominant across the full outage ensemble.
2.3. Composite Indices, Recurrence-Aware Ranking, and Broader Contingency Analytics
A smaller group of studies begins to move beyond pure severity ranking by incorporating recurrence or probabilistic perspectives. In [17], a redundancy-based IPFC placement strategy uses a Composite Severity Index (CSI) that combines line utilization and FVSI; the ranking incorporates repeated severity across outages and demonstrates restoration of indices and improved voltage profiles. A closely related risk-of-severity concept is reported in [18,19], where IPFC locations are selected based on the probability of repeated severity under contingencies, yielding reductions in overloads and voltage deviations. These contributions are conceptually aligned with recurrence-aware thinking, yet they remain focused on controller placement outcomes and rely on composite indices that mix loading and stability effects, which can complicate interpretation when isolating voltage-stress dominance alone.
Beyond voltage stability indices, data-driven and statistical contingency assessment methods have also been proposed for extreme events. For example, Refs. [20,21] introduce a real-time adaptive load shedding scheme using Monte Carlo contingency analysis and statistical distribution factors, combined with PCA and SVM-based classification to derive an overload index for fast corrective action. In renewable-integrated contexts, Ref. [22] compares several indices within a multiobjective OPF and shows that the “best” index can change between normal and contingency conditions. Likewise, Refs. [23,24] evaluate contingency impacts after DFIG integration using performance indices (PIV/PIF), demonstrating that device integration and topology changes can alter contingency severity patterns.
2.4. Positioning and Gap Addressed by This Paper
From the above literature, two observations emerge. First, FVSI is widely used for severity assessment and as an input signal to optimization/control frameworks under contingencies [1,4,5,6,7,8,9,10,11,12]. Second, most FVSI-based contingency studies remain scenario-centric, emphasizing the most severe lines or outages within individual cases, rather than quantifying whether the same corridor repeatedly becomes the system’s dominant voltage-stress bottleneck across the entire contingency space.
Motivated by this gap, the present work focuses on a diagnostic objective: it introduces a persistence-based dominance framework that aggregates the maximum-FVSI (dominant) line observed in each convergent contingency and ranks transmission corridors by dominance frequency (persistence), complemented by conditional severity statistics. This shifts FVSI usage from single-snapshot screening toward a structural characterization of dominance collapse and sparsity in voltage-stress propagation, enabling compact cross-system insights without relying on additional controllers or optimization layers.
3. Methodology
This paper proposes a diagnostic methodology for the robust identification of structurally critical transmission lines in electrical power systems under contingency conditions. The framework is intended for planning-stage, offline contingency screening and, therefore, does not require real-time measurements or communication infrastructures during execution; communication degradation does not affect the proposed analysis because all computations are performed on static network models using steady-state power flow solutions.
While higher-order contingency criteria such as are relevant for systems with tightly coupled corridors, extreme loading, or stringent security requirements, the present study focuses on the criterion, which remains the standard planning benchmark in most transmission systems. Extending the proposed persistence-based framework to scenarios is conceptually straightforward but computationally more demanding and is, therefore, left for future investigation.
Unlike snapshot-based approaches, the proposed framework evaluates all possible single-line outage scenarios and statistically aggregates FVSI dominance patterns to identify transmission lines that consistently exhibit the highest proximity to voltage instability. The methodology proceeds through successive stages: Newton–Raphson power flow computation, FVSI evaluation, exhaustive contingency enumeration, dominant-line extraction, and persistence-based statistical ranking.
To improve readability and provide an intuitive overview of the proposed framework, Figure 1 summarizes the complete persistence-based FVSI dominance pipeline at a high level. The flowchart highlights the main computational stages, the convergence screening logic, and the aggregation of dominant outcomes across exhaustive contingencies. Detailed mathematical formulations and algorithmic procedures corresponding to each stage are presented in the subsequent subsections and Algorithms 1–4.
| Algorithm 1 FVSI calculation for all transmission lines in the base case |
|
| Algorithm 2 contingency generation and convergence screening |
|
| Algorithm 3 Dominant line identification using maximum FVSI (per contingency) |
|
| Algorithm 4 Persistence-based ranking of structurally critical transmission lines |
|
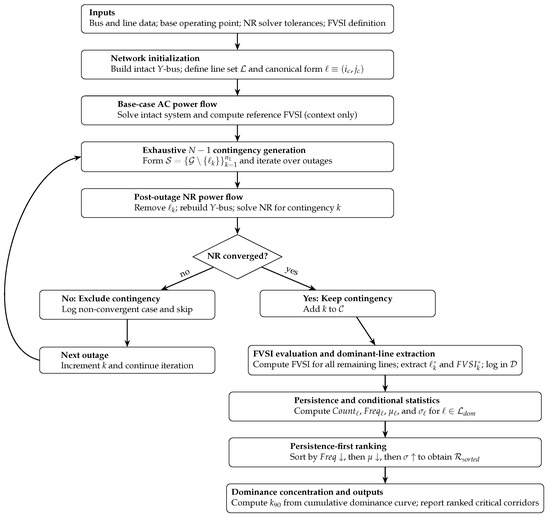
Figure 1.
High-level workflow of the persistence-based FVSI dominance framework for exhaustive contingency analysis and dominance aggregation.
Clarification: In this research, “global” refers to exhaustive system-wide enumeration of all single-line () outages and aggregation across the full contingency space; it does not denote global optimality in an optimization sense.
Each stage shown in Figure 1 is formally defined and implemented in the following subsections.
3.1. Power Flow Calculations: Newton–Raphson
The steady-state operating point of the electrical power system is obtained using the Newton–Raphson (NR) power flow method, which is widely recognized for its numerical robustness and convergence properties. The NR method solves the nonlinear algebraic equations derived from Kirchhoff’s laws by iteratively updating voltage magnitudes and phase angles at all buses.
The active and reactive power balance equations at bus i are given by [1]:
where and denote the voltage magnitude and phase angle at bus i, while and represent the conductance and susceptance of the transmission line connecting buses i and j.
The iterative update process is described by:
Convergence of the Newton–Raphson iterations is declared when the infinity norm of the state update satisfies
with tolerance . If this condition is not met within a maximum of iterations, the power-flow solution is classified as non-convergent, and the corresponding contingency is excluded from subsequent dominance analysis.
3.2. Transmission-Line Voltage Stability Screening: Fast Voltage Stability Index
The Fast Voltage Stability Index (FVSI) is employed as the line-based voltage stability indicator in this study. FVSI provides a scalar measure of how close a transmission line is to its voltage instability limit, making it suitable for rapid screening under multiple operating conditions.
For a transmission line connecting sending bus i and receiving bus j, the FVSI is defined as [25]:
where is the line impedance, is the line reactance, is the voltage magnitude at the sending bus, and is the reactive power received at bus j from bus i.
The complex power flowing from bus i to bus j is expressed as:
from which the reactive power component is extracted. After solving the NR power flow, FVSI values are computed for all transmission lines. Values approaching unity indicate proximity to voltage instability.
3.3. Persistence-Based Critical Line Identification Framework
All algorithmic steps and pseudocode presented in this work are original and were developed specifically for the proposed persistence-based FVSI dominance aggregation framework. For clarity, the framework is also summarized using a flowchart representation.
Conventional FVSI-based screening is typically performed under a single operating point (base case) or under a small subset of stressed conditions, which can lead to scenario-dependent conclusions. In contrast, this paper proposes a persistence-based framework that evaluates all single-line outage scenarios and identifies transmission lines that recurrently dominate voltage-stress conditions.
The key idea is to construct a mapping from each convergent contingency scenario to its dominant line, defined as the transmission line that attains the maximum FVSI value under that scenario. By aggregating this mapping over the complete contingency set, the methodology produces a robust, statistically grounded ranking of structurally critical lines.
For consistency and to avoid duplicated representations due to directionality, each physical line is represented in canonical form as:
3.3.1. Stage 1: Base-Case Initialization and FVSI Computation
All bus and line parameters are initialized and a base-case NR power flow is solved to obtain voltage magnitudes and angles. FVSI values are then computed for all transmission lines to provide a reference stress profile. Although the base case is not used for persistence ranking, it supports interpretability and contextual comparison in the results section.
Given the NR solution and a line with impedance , the complex voltages are written as:
The receiving-end complex power from bus i to bus j is:
and the associated reactive power is . FVSI is then computed as:
Algorithm 1 details the computational procedure used in this stage.
3.3.2. Stage 2: Full Contingency Enumeration
Let denote the set of all transmission lines in the intact network, with cardinality . A complete contingency set is formed by removing one line at a time:
where is the intact network graph representation and is the post-outage topology.
For each scenario k, the Y-bus is rebuilt and NR is executed. Convergent cases are collected in the set , which will be the domain for dominance analysis. Algorithm 2 summarizes this stage.
3.3.3. Stage 3: Dominant-Line Extraction per Contingency
For each convergent contingency , FVSI values are computed for all remaining lines in the post-outage system. The dominant line is defined as the line that maximizes FVSI under that contingency:
The resulting dominant mapping is stored in the log , which constitutes the primary dataset for persistence aggregation (Stage 4). Algorithm 3 provides the computational steps.
3.3.4. Stage 4: Statistical Aggregation and Persistence Ranking
Let be the set of unique dominant lines observed across all convergent contingencies:
For each , define the set of dominant FVSI values conditioned on dominance:
The persistence (dominance) count and frequency are then computed as:
Severity and dispersion are computed using:
Finally, lines are ranked using a persistence-first rule:
where stores tuples for all . Algorithm 4 summarizes the aggregation and ranking procedure.
3.3.5. Stage 5: Dominance Concentration Metric ()
Beyond identifying the most persistent lines, it is useful to quantify whether dominance is dispersed across many lines or concentrated in a small subset. Let the ranked dominant-line frequency list be , ordered according to (17). The cumulative dominance share is:
The dominance concentration metric is then defined as:
A small indicates that a limited set of lines dominates the FVSI maxima across most contingencies, revealing structural sparsity in the system’s voltage-stress propagation mechanism.
Finally, it is important to clarify that the proposed framework is primarily intended for high-voltage and extra-high-voltage transmission networks, where steady-state voltage stability indices such as FVSI provide meaningful stress indicators and network behavior is predominantly governed by reactive power balance. Application to sub-transmission or distribution networks, characterized by higher ratios, closer load proximity, and active control devices, may require adaptation of the underlying stability index and load modeling assumptions.
3.4. Case Studies
The proposed methodology is validated on three benchmark transmission systems: IEEE 14-bus, IEEE 30-bus, and IEEE 118-bus networks. These systems provide increasing levels of topological and operational complexity, allowing evaluation of scalability and dominance concentration trends. For each case study, all possible single-line outage scenarios are exhaustively evaluated and aggregated using the persistence-based ranking framework.
Software and Computational Environment
All simulations were executed in MATLAB (R2025) using a deterministic exhaustive contingency enumeration pipeline. Computations were performed on a workstation equipped with an Intel CPU (12 cores), 64 GB RAM, running Windows (11). The Newton–Raphson solver tolerance was set to with a maximum of (1000) iterations per contingency case.
4. Analysis of Results
4.1. IEEE 14-bus System: Persistence-Based Critical Line Results
This subsection reports the outcomes of the proposed persistence-based FVSI framework on the IEEE 14-bus benchmark. Following the stages defined in Section 3 (Algorithms 1–4), the base-case power flow is first solved (Stage 1), all line-outage contingencies are exhaustively generated and screened for convergence (Stage 2), the dominant (maximum-FVSI) transmission line is extracted for each convergent contingency (Stage 3), and dominant-line statistics are aggregated to produce a persistence-first ranking (Stage 4). The dominance concentration metric (Stage 5) is then computed from the cumulative dominance distribution.
4.1.1. Simulation Summary and Convergence
The IEEE 14-bus system contains buses and transmission lines, yielding 20 distinct line-outage cases. The base-case solution converged successfully, and all contingencies also converged (, i.e., 100%), which ensures that the dominance statistics are not biased by numerical non-convergence.
In the base case, the maximum FVSI value was observed on line 2–5 with . This base-case result is reported only as reference and is not used directly for persistence ranking, which is determined exclusively from the dominant-line outcomes across the ensemble.
4.1.2. Persistence Ranking of Dominant Lines
For each convergent contingency (Algorithm 2), FVSI values are computed for all remaining lines and the dominant line
is extracted (Algorithm 3), together with its maximum value . The set of dominant-line events is then aggregated (Algorithm 4) to compute persistence and severity statistics for each unique dominant line: (i) the occurrence count , (ii) the dominance frequency in percent, (iii) the conditional mean severity (mean of when that line is dominant), and (iv) the conditional dispersion (standard deviation of when dominant).
Table 1 summarizes the resulting persistence ranking for IEEE 14. Only three unique lines appear as dominant across the full ensemble, indicating strong concentration of voltage-stress dominance. Line 2–5 dominates 75% of contingencies (15 of 20), whereas line 10–11 dominates 20% (4 cases), and line 3–4 dominates once (5%). Importantly, the most persistent dominant line (2–5) is not the most severe in terms of conditional mean FVSI, motivating the persistence-first viewpoint: structural criticality is characterized by repeated dominance across contingencies, not merely by isolated extreme FVSI values.

Table 1.
IEEE 14-bus: Persistence-based dominant-line ranking across all convergent contingencies.
4.1.3. Persistence and Dominance Concentration
Figure 2 provides a compact summary of (i) persistence frequency across unique dominant lines and (ii) dominance concentration through the cumulative Pareto curve. The cumulative dominance curve is computed over the ranked list as
where denotes the dominance frequency of the r-th ranked line. The metric is defined as the smallest k such that . For IEEE 14, , meaning that the top two ranked lines (2–5 and 10–11) jointly explain at least 90% of dominant FVSI events. This indicates a sparse dominance structure: a very small subset of transmission elements repeatedly governs the worst-case FVSI behavior under diverse outages.
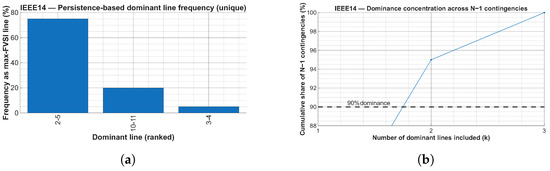
Figure 2.
IEEE 14-bus system: persistence frequency and dominance concentration under exhaustive contingencies. (a) Persistence frequency of each unique dominant transmission line across all convergent outages. (b) Dominance concentration curve with the 90% threshold used to compute the dominance concentration metric .
4.1.4. Contingency-Dependent Dominance and Severity Distribution
While Table 1 and Figure 2 establish which lines are structurally dominant, Figure 3 explains how dominance depends on the specific outage and how severe the maximum-FVSI outcomes are.
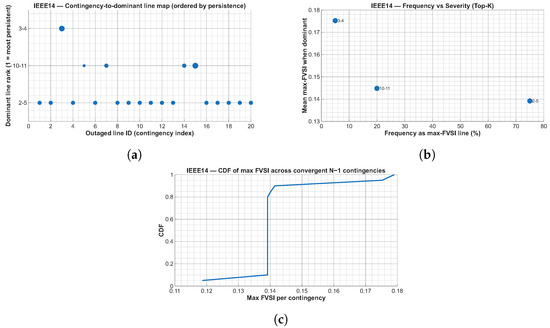
Figure 3.
IEEE 14-bus system: contingency-dependent dominance patterns and severity distribution under exhaustive contingencies. (a) Contingency-to-dominant-line map ordered by dominance persistence, where marker size reflects the maximum FVSI value attained in each contingency. (b) Persistence–severity relationship for unique dominant transmission lines, showing dominance frequency versus conditional mean severity . (c) Empirical cumulative distribution function (CDF) of the contingency maximum FVSI values across all convergent outages.
Interpretation guide (Figure 3).
- Map (a): dominant line rank vs outage index; marker size encodes .
- Scatter (b): persistence–severity tradeoff using .
- CDF (c): distribution of across all convergent contingencies.
Dominance Map (Figure 3a).
The map indicates that most outages collapse to the same dominant outcome (rank-1 line 2–5), while a smaller subset of contingencies shifts dominance to rank-2 line 10–11 and one isolated contingency shifts dominance to rank-3 line 3–4. This is a direct visual explanation of the dominance concentration quantified by .
Frequency-Severity Scatter (Figure 3b).
The scatter compares persistence (x-axis) and conditional mean severity (y-axis). IEEE 14 clearly shows that persistence and severity are not equivalent: line 2–5 is highly persistent (75%) but has moderate (0.139), whereas line 3–4 is rare (5%) but has the largest (0.175). This supports the persistence-first ranking rule of Algorithm 4.
CDF of Contingency Maximum FVSI (Figure 3c).
Let denote the maximum FVSI value in contingency k (Algorithm 3). The empirical cumulative distribution function (CDF) is
where is the indicator function. The IEEE 14 CDF exhibits a pronounced jump around –0.141, consistent with the dominance of line 2–5 at nearly constant severity (very small in Table 1). The upper tail reflects the smaller set of contingencies dominated by 10–11 and the isolated 3–4 event, which produce larger values.
4.1.5. Key IEEE 14-bus Findings
The IEEE 14-bus results support three central observations:
- Structural dominance is highly concentrated: only three unique lines appear as dominant across all contingencies, and the top two lines explain at least 90% of dominance events ().
- Persistence differs from severity: the most persistent line (2–5) is not the most severe in conditional mean FVSI. This validates the persistence-first ranking embedded in Algorithm 4.
- Contingency dependence is visible and interpretable: the dominance map shows most outages yield the same dominant line (2–5), while a smaller subset shifts dominance to 10–11 and one isolated case to 3–4.
Together, these outcomes establish IEEE 14 as a compact demonstration of the proposed framework: rather than treating FVSI as a single-snapshot index, the framework identifies structurally critical transmission elements through dominance persistence across the full contingency space.
4.2. IEEE 30-bus System: Dominance Collapse Under Contingencies
This subsection reports the results of the proposed persistence-based FVSI framework applied to the IEEE 30-bus system. In contrast to IEEE 14, which exhibits limited competition among a small set of dominant lines, the IEEE 30 network reveals a markedly different regime characterized by dominance collapse, where voltage-stress dominance becomes overwhelmingly concentrated on a single transmission corridor.
The same methodological stages defined in Section 3 (Algorithms 1–4) are followed without modification.
4.2.1. Simulation Summary and Convergence
The IEEE 30-bus system contains buses and transmission lines, yielding 41 distinct line-outage contingencies. The base-case Newton–Raphson power flow converged successfully, and all contingency cases also converged (, 100%), ensuring that persistence statistics are not influenced by numerical infeasibility.
In the base case, the maximum FVSI value was observed on line 2–5 with . As in IEEE 14, this value is reported only as reference and is not used directly for persistence ranking.
4.2.2. Persistence Ranking and Dominance Collapse
For each convergent contingency , the dominant line
is extracted together with its maximum value (Algorithm 3). Aggregation of all dominant-line events (Algorithm 4) yields the persistence statistics summarized in Table 2.
Table 2.
IEEE 30-bus: Persistence-based dominant-line ranking across all convergent contingencies.
The results indicate an extreme concentration of dominance. Line 2–5 dominates 38 out of 41 contingencies (92.68%), while all other dominant events are isolated, single-occurrence cases. This behavior (as seen in Figure 4 (i) persistence frequency across unique dominant lines and (ii) dominance concentration through the cumulative Pareto curve) constitutes a clear case of dominance collapse: voltage-stress dominance becomes structurally monopolized by a single transmission element, largely independent of the specific outage location.
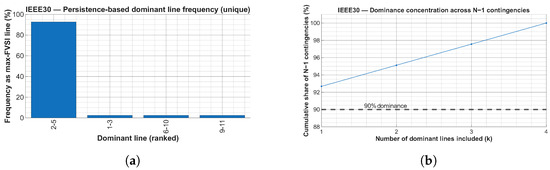
Figure 4.
IEEE 30-bus system: dominance collapse under exhaustive contingencies. (a) Persistence frequency of each unique dominant transmission line across all convergent outages. (b) Dominance concentration curve with the 90% threshold used to compute the dominance concentration metric .
4.2.3. Contingency Dependence and Severity Decoupling
Figure 5 shows that nearly all contingencies collapse to the same dominant outcome (line 2–5), with only three isolated outages redirecting dominance to alternative lines. This confirms that dominance is weakly dependent on the outage identity.
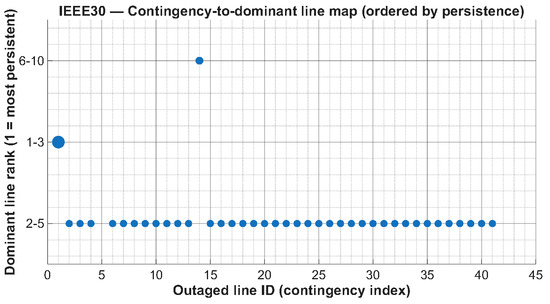
Figure 5.
IEEE 30-bus: Contingency-to-dominant-line map (ordered by persistence). Marker size reflects contingency maximum FVSI.
As shown in Figure 6, the IEEE 30-bus persistence–severity landscape exhibits a clear decoupling between dominance frequency and conditional severity. In Figure 6a, line 2–5 dominates nearly all convergent contingencies (90%) but with moderate mean severity (), whereas line 1–3 shows the highest severity () with negligible frequency (below ). Lines 6–10 and 9–11 follow the same pattern of low persistence despite moderate severity.
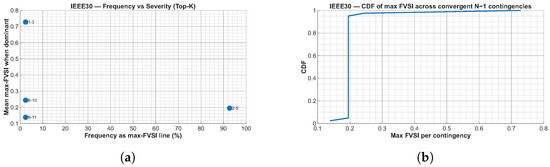
Figure 6.
IEEE 30-bus system: persistence–severity decoupling under exhaustive contingencies. (a) Persistence–severity relationship for unique dominant transmission lines, showing dominance frequency versus conditional mean severity . (b) Empirical cumulative distribution function (CDF) of the contingency maximum FVSI values across all convergent outages.
The CDF in Figure 6b further indicates that most contingency maximum FVSI values cluster around , with a thin upper tail representing rare extreme events. Overall, the results confirm that stability risk is driven by persistence rather than isolated high-severity outliers, supporting a persistence-first ranking criterion.
4.2.4. Key IEEE 30-bus Findings
- Dominance collapse occurs: a single line dominates more than 92% of contingencies.
- Maximum structural sparsity: the dominance concentration metric reduces to .
- Persistence and severity diverge strongly: rare extremes do not govern system-wide stress behavior.
The IEEE 30-bus system, thus, represents a distinct regime in which voltage-stress dominance is structurally monopolized, highlighting the diagnostic value of persistence-based analysis beyond severity-only indices.
4.3. IEEE 118-bus System: Extreme Dominance Collapse Under Contingencies
This subsection reports the results of the proposed persistence-based FVSI framework applied to the IEEE 118-bus system. Due to its scale and meshed topology, this case is used to test whether dominant voltage-stress mechanisms become distributed or, conversely, collapse onto a small structural set as network complexity increases.
4.3.1. Simulation Summary and Convergence
The IEEE 118-bus system comprises buses and transmission lines, yielding 186 distinct line-outage contingencies. The base-case power flow converged successfully, and all contingencies also converged (, 100%). Therefore, dominance statistics are computed over the full contingency space without exclusions due to numerical non-convergence.
4.3.2. Persistence Ranking and Dominance Collapse
For each convergent contingency , FVSI values are computed for all remaining lines and the dominant line
is extracted (Algorithms 2 and 3). The dominant-line events are then aggregated following Algorithm 4 to compute persistence and conditional-severity statistics.
Table 3 reveals an extreme dominance-collapse outcome: a single transmission line (92–100) dominates 97.31% of all contingencies (181 out of 186). The remaining dominant events are rare and scattered across three alternative lines. This indicates that, at this scale, voltage-stress dominance becomes strongly structurally deterministic, governed by an overwhelmingly dominant bottleneck.
Table 3.
IEEE 118-bus: Persistence-based dominant-line ranking across all convergent contingencies.
4.3.3. Graph-by-Graph Evidence: Concentration, Collapse, and Severity
Figure 7 quantifies dominance concentration. The frequency plot confirms that line 92–100 dominates nearly all contingencies, while the Pareto cumulative curve reaches the 90% threshold with . Thus, a single line explains at least 90% of dominant FVSI events, which is the strongest possible concentration outcome in the proposed metric.
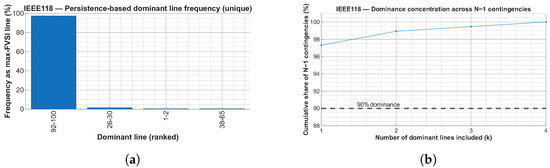
Figure 7.
IEEE 118-bus system: dominance concentration under exhaustive contingencies. (a) Persistence frequency of unique dominant transmission lines across all convergent outages. (b) Dominance concentration curve (Pareto cumulative distribution) used to compute the dominance metric , with the dashed line indicating the 90% cumulative threshold ().
Figure 8 provides contingency-level and distributional evidence. The contingency-to-dominant map shows that almost all outage scenarios collapse to the same dominant outcome (rank-1 line 92–100), with only a few isolated contingencies switching dominance to alternative lines. The frequency–severity scatter highlights the core persistence insight: rare dominant lines can exhibit higher conditional mean FVSI, yet their negligible frequency prevents them from being structurally critical under the persistence-first definition. Finally, the empirical CDF of contingency maximum FVSI shows a sharp concentration near the dominant-line severity level with a thin upper tail driven by rare dominance switches.
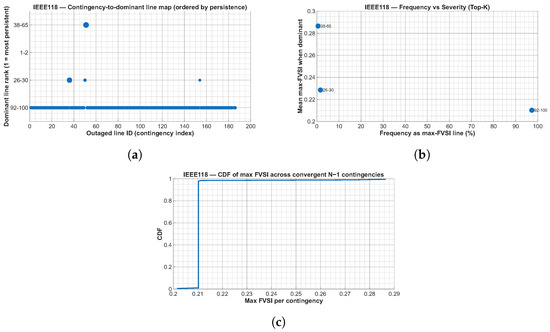
Figure 8.
IEEE 118-bus system: contingency-dependent dominance patterns and maximum-FVSI distribution under exhaustive contingencies. (a) Contingency-to-dominant-line map ordered by dominance persistence, illustrating the weak dependence of dominant outcomes on the specific outage. (b) Persistence–severity relationship for unique dominant transmission lines, showing dominance frequency versus conditional mean severity . (c) Empirical cumulative distribution function (CDF) of the contingency maximum FVSI values across all convergent outages.
4.3.4. Key IEEE 118-bus Findings
- Extreme dominance collapse: line 92–100 dominates 97.31% of all contingencies.
- Maximum concentration by : indicates that a single transmission element explains at least 90% of dominant FVSI events.
- Persistence differs from severity: rare dominant lines can be more severe when they occur, but structural criticality is governed by repeated dominance across contingencies (Algorithm 4).
4.4. Cross-System Synthesis: Dominance Collapse Across IEEE 14/30/118
This subsection consolidates the three case studies to highlight the central system-level outcome of the proposed persistence-based FVSI framework: as network scale increases, dominant-line outcomes increasingly collapse onto a very small subset of structurally critical corridors. The synthesis is based on the ranked dominant-line statistics obtained from Stage 4 (Algorithm 4) and the dominance concentration metric from Stage 5.
4.4.1. Comparative Summary of Dominance Concentration
Table 4 summarizes the key indicators across IEEE 14-, 30-, and 118-bus systems. Two patterns are immediate. First, the number of unique dominant lines is small in all systems (three to four), despite a large increase in the total number of lines and cases. Second, the top-ranked dominant line becomes progressively more persistent as scale grows, reaching in IEEE 30 and in IEEE 118. This is mirrored by the dominance concentration metric: while IEEE 14 requires two lines to exceed 90% cumulative dominance (), both IEEE 30 and IEEE 118 reach the 90% threshold with a single line (). These results provide quantitative evidence of dominance collapse under exhaustive contingencies in larger networks.
Table 4.
Cross-system dominance concentration summary under exhaustive line-outage contingencies (Stages 2–5). “Unique dominant lines” counts distinct lines that appear as dominant (maximum FVSI) across the convergent ensemble (Algorithm 3).
4.4.2. Interpretation: Why “Persistence-First” Becomes Sharper with Scale
The persistence-first definition embedded in Algorithm 4 becomes increasingly decisive as system size grows. In IEEE 14, dominance is concentrated but not absolute: contingency-dependent rerouting produces a second dominant corridor often enough to yield . In contrast, IEEE 30 and IEEE 118 exhibit near-total collapse of dominant outcomes onto a single line (top-line frequency ), resulting in . Practically, this indicates that the voltage-stress propagation landscape becomes more structurally constrained at larger scales: a small set of corridors repeatedly becomes the system bottleneck under diverse outage scenarios.
This outcome also clarifies why severity-only screening can be misleading in contingency ensembles. Rare dominant lines can exhibit higher conditional severity when they occur (higher conditional mean FVSI), yet contribute negligibly to system-wide structural criticality due to their low persistence. The proposed framework, therefore, separates two complementary notions: (i) structural criticality (high persistence across outages), and (ii) episodic severity (high FVSI in isolated events). Across all three benchmarks, the decisive planning-relevant signal is the repeated dominance of a tiny set of lines, with the collapse becoming strongest in IEEE 30 and IEEE 118.
4.4.3. Cross-System Dominance-Collapse Visualization
Figure 9 provides a compact cross-system visualization of dominance collapse. Rather than repeating case-level dominance curves, this figure summarizes the persistence of the top-ranked dominant line in each system. As network size increases, dominant FVSI outcomes concentrate onto a single corridor, with the top line exceeding the 90% dominance threshold in IEEE 30 and IEEE 118.
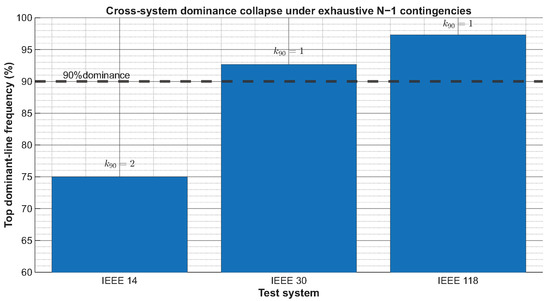
Figure 9.
Cross-system dominance collapse under exhaustive contingencies. Bars report the frequency of the top-ranked dominant line in each system. The dashed line marks the 90% dominance threshold used to define . Dominance collapses from partial (IEEE 14) to near-total (IEEE 30 and IEEE 118) as system scale increases.
4.4.4. Key Cross-System Takeaway (Energies-Oriented)
Across IEEE 14/30/118, the proposed framework consistently identifies a small set of structurally critical transmission corridors, but the most striking behavior is that criticality becomes increasingly single-corridor dominated at larger scale. This dominance-collapse signature provides a compact planning-oriented diagnostic: rather than distributing attention across many candidate lines, operators can focus monitoring and reinforcement on a tiny persistence-ranked subset that governs worst-case voltage-stress outcomes across the full space.
5. Discussion
This section discusses the physical interpretation, practical implications, and methodological boundaries of the proposed persistence-based FVSI framework. Rather than restating numerical results, the discussion focuses on explaining the observed dominance-collapse behavior, clarifying the value of persistence-first screening, and positioning the contribution within the broader voltage-stability literature.
5.1. Physical Interpretation of Dominance Collapse
A central outcome of this study is the progressive collapse of dominance as network scale increases. While all three benchmark systems exhibit a limited set of dominant transmission lines under exhaustive contingencies, the degree of concentration becomes markedly stronger in the IEEE 30 and IEEE 118 systems, where a single corridor explains more than 90% of dominant FVSI events.
This behavior can be interpreted as a structural effect of meshed transmission networks. As system size grows, power-flow redistribution under line outages increasingly funnels reactive power stress through a small number of topologically central corridors. These corridors act as structural bottlenecks: regardless of which peripheral element is removed, voltage-stress propagation converges toward the same transmission path. In this sense, dominance collapse does not indicate reduced vulnerability, but rather a constrained vulnerability landscape, where stress is repeatedly absorbed by the same elements.
Importantly, this phenomenon is not captured by base-case FVSI values alone. Although the base case may identify weak lines, persistence analysis reveals which lines consistently govern worst-case conditions across the full contingency ensemble. The results, therefore, highlight that structural criticality is an emergent property of contingency interactions, not a static attribute of individual operating points.
5.2. Persistence Versus Severity: Implications for Screening
Across all systems, the analysis demonstrates a systematic decoupling between dominance persistence and conditional severity. Several transmission lines exhibit high FVSI values when they become dominant, yet appear extremely rarely across contingencies. Conversely, the most persistent dominant lines typically exhibit moderate but highly repeatable FVSI values.
This distinction is particularly pronounced in the IEEE 30 and IEEE 118 systems, where rare dominant events can reach substantially higher FVSI magnitudes than the most persistent corridor. A severity-only screening approach would, therefore, overemphasize isolated extreme events and underemphasize the transmission elements that repeatedly govern voltage stress under diverse outages.
The persistence-first ranking rule introduced in Algorithm 4 addresses this limitation by explicitly prioritizing recurrence across the contingency space. From a planning and monitoring perspective, a line that dominates in nearly all cases represents a more critical structural vulnerability than a line that becomes severe only under exceptional conditions. The proposed framework, thus, reframes FVSI from a snapshot-based indicator into a contingency-robust diagnostic tool.
5.3. Practical Implications for Planning and Operation
This diagnostic role is particularly suited to transmission-level planning studies, where steady-state security criteria dominate early-stage reinforcement and investment decisions. The results have several practical implications for power-system planning and operation:
- Planning-stage screening: The persistence-based ranking provides a compact method to identify structurally critical transmission corridors before engaging in detailed optimization, reinforcement, or control studies.
- Monitoring and instrumentation: Highly persistent dominant lines are natural candidates for enhanced monitoring, including prioritized placement of PMUs or advanced voltage sensors.
- Preventive reinforcement: Rather than distributing resources across many candidate lines, planners can focus on a small subset of corridors that govern worst-case voltage-stress propagation.
- Pre-filtering for advanced studies: The framework can serve as a front-end filter for dynamic simulations, corrective control design, or FACTS placement studies, reducing computational burden while preserving structural insight.
Crucially, these implications arise without introducing new control devices or optimization layers. The proposed method is deliberately diagnostic, making it suitable for early-stage decision support and large-scale screening.
In practical planning workflows, the persistence-ranked set of dominant transmission corridors provides a focused basis for the comparative evaluation of voltage-stability enhancement measures. Corridors exhibiting high dominance persistence represent high-impact candidates for targeted interventions, such as reactive power compensation, network reinforcement, topology reconfiguration, or advanced control deployment. By reducing the candidate set to a small number of structurally critical elements, the proposed framework supports more efficient comparison of alternative technical solutions and prioritization of planning investments, while avoiding overemphasis on isolated worst-case contingencies.
5.4. Methodological Scope and Limitations
To avoid overinterpretation, it is important to clarify the scope and limitations of the proposed framework. First, the analysis is based on steady-state power-flow solutions and a static voltage-stability index. Dynamic voltage stability, transient behavior, and time-domain interactions are outside the scope of this work. Second, the framework does not propose corrective actions, mitigation strategies, or optimal control schemes. Its purpose is to identify where voltage-stress vulnerability is structurally concentrated, not how it should be alleviated.
Special voltage-stability phenomena associated with industrial load centers, such as induction motor stalling during faults and group self-starting following fault clearance, are inherently dynamic and time-dependent. These effects are typically captured using detailed dynamic load models and time-domain simulations. As the present study adopts a steady-state, planning-stage perspective based on AC power flow and FVSI evaluation, such dynamic motor behavior is not explicitly modeled. Nevertheless, the proposed persistence-based framework can be used as a diagnostic pre-screening tool to identify structurally critical transmission corridors where dynamic voltage instability mechanisms are most likely to manifest, thereby guiding the selection of locations for more detailed dynamic analysis.
From a numerical perspective, the framework relies on Newton–Raphson (NR) power-flow convergence to identify feasible steady-state operating points under each contingency. Convergence is assessed using a strict infinity-norm tolerance on state updates, ensuring that all retained solutions are numerically stable and well-conditioned. Non-convergent NR cases are excluded from dominance aggregation, as numerical non-convergence does not necessarily imply physical voltage collapse and may arise from ill-conditioning near feasibility boundaries. Treating NR failure as an automatic indicator of instability would, therefore, risk overestimating system vulnerability.
The proposed methodology is not intended to locate voltage-collapse points or trace post-critical behavior. Continuation power flow (CPF) and dynamic simulations remain the appropriate tools for such analyses; however, their computational cost makes them unsuitable for exhaustive contingency screening. In this context, the persistence-based dominance framework is deliberately positioned as a first-stage, high-throughput diagnostic that identifies a reduced set of structurally critical corridors on which more detailed CPF or time-domain analysis can subsequently be focused.
Additionally, the results depend on the assumed loading conditions and network models of the benchmark systems. While exhaustive enumeration ensures robustness with respect to line outages, extensions to stochastic load variations or combined contingencies represent natural directions for future research.
5.5. Positioning Within Existing Voltage-Stability Studies
Most existing FVSI-based studies focus on single operating points or isolated contingencies, ranking transmission lines based on instantaneous severity. In contrast, the present work introduces a persistence-based aggregation across the complete contingency space, enabling the identification of structurally critical corridors that repeatedly dominate voltage-stress conditions.
By demonstrating dominance collapse across IEEE 14-, 30-, and 118-bus systems, the study provides cross-scale evidence that voltage-stability vulnerability becomes increasingly concentrated as system size grows. This contribution complements existing severity-oriented analyses and offers a new diagnostic perspective that is particularly relevant for large, meshed transmission networks.
5.6. Future Work and Research Challenges
While the proposed persistence-based FVSI framework provides a scalable diagnostic for identifying structurally dominant transmission corridors under exhaustive outages, several extensions are both necessary and scientifically promising.
5.6.1. Future Work
- Load and generation uncertainty (stochastic persistence): Extend the analysis from a single operating point to probabilistic ensembles by sampling load/generation scenarios (e.g., Monte Carlo, time-series profiles). This enables robust persistence metrics that remain valid under realistic variability and renewable intermittency.
- Multi-element contingencies and topology classes: Generalize the dominance mapping beyond to and selected credible combinations (e.g., correlated corridors, common right-of-way). A structured sampling strategy is needed to avoid combinatorial explosion while preserving diagnostic value.
- Dynamic voltage stability and time-domain validation: Couple persistence-ranked corridors with dynamic simulations (e.g., induction motor load models, AVR dynamics, PV inverter controls) to evaluate whether static dominance persistence correlates with transient/post-disturbance voltage recovery margins.
- Remedial action integration (diagnostic-to-action pipeline): Use the persistence-ranked subset as a pre-filter for downstream mitigation studies (FACTS placement, reactive power planning, topology control, RAS design). This preserves the diagnostic nature of the contribution while enabling actionable planning workflows.
- Cross-index generalization: Replicate the persistence pipeline using alternative indices (e.g., L-index, VCPI, Lmn, LQP) to test whether dominance collapse is index-invariant or FVSI-specific, and to establish a generalized persistence-based stability screening layer.
- Observability-driven monitoring design: Leverage dominance persistence to guide PMU/voltage sensor placement or adaptive monitoring priorities, linking structural dominance to measurement sufficiency and situational awareness.
- Large-scale systems and computational acceleration: Benchmark on practical networks (thousands of buses) and incorporate acceleration strategies (parallel power flow, contingency screening heuristics, sparse linear algebra, GPU/cluster execution) to enable utility-scale deployment.
5.6.2. Open Challenges
- Operating-point dependence and transferability: Dominance persistence is influenced by loading patterns, dispatch, and voltage setpoints; a key challenge is defining transferability bounds (when a ranked corridor remains dominant across operating regimes).
- Interpretability of dominance collapse: Although dominance collapse is empirically observable, linking it rigorously to structural properties (e.g., electrical centrality, reactive power distribution bottlenecks, corridor impedance characteristics) remains an open research direction.
- Handling non-convergent contingencies: This study observed full convergence, but in stressed systems non-convergent cases may occur. A principled treatment is required (e.g., feasibility-aware dominance metrics, CPF-based fallback, or continuation-based severity proxies) to avoid bias.
- Validation against ground-truth instability events: Establishing the relationship between static persistence dominance and real instability mechanisms (PV curve collapse points, dynamic load recovery failure, voltage collapse incidents) requires systematic cross-validation.
- Ranking stability and statistical confidence: When dominance is less concentrated, ranking uncertainty increases. Confidence intervals, bootstrapped persistence scores, and sensitivity analysis are needed to quantify ranking stability.
5.7. Discussion Summary
In summary, the discussion highlights that (i) dominance collapse is a structural phenomenon that intensifies with system scale, (ii) persistence-first screening reveals critical corridors that severity-only approaches may overlook, and (iii) the proposed framework serves as a scalable, planning-oriented diagnostic rather than a control or optimization method. These characteristics position the approach as a valuable front-end tool for voltage-stability assessment under exhaustive contingency conditions.
6. Conclusions
This paper presented a persistence-based diagnostic framework for voltage stability assessment under exhaustive transmission line contingencies, using the Fast Voltage Stability Index (FVSI) as a base indicator. Unlike conventional severity-based screening, the proposed approach identifies structurally critical transmission corridors by aggregating dominant (maximum-FVSI) outcomes across the full contingency space.
Quantitative results obtained from IEEE 14-, 30-, and 118-bus benchmark systems demonstrate a clear and scalable phenomenon of dominance concentration. In the IEEE 14 system, three transmission lines appeared as dominant across all contingencies, with the two most persistent corridors jointly explaining 90% of dominant events (). In contrast, the IEEE 30 and IEEE 118 systems exhibited near-total dominance collapse, where a single transmission corridor accounted for 92.68% and 97.31% of dominant FVSI events, respectively, yielding in both cases.
Across all systems, persistence and severity were shown to be systematically decoupled. Lines with the highest conditional mean FVSI values often appeared only in isolated contingencies, whereas structurally critical corridors were characterized by repeated dominance with moderate but highly consistent FVSI levels. This confirms that severity-only ranking can misrepresent structural vulnerability under large contingency ensembles.
Compared with conventional FVSI-based contingency screening, which typically highlights isolated worst-case scenarios, the proposed framework reduces the effective set of critical transmission corridors from dozens of candidates to at most two lines in IEEE 14 and a single line in IEEE 30 and IEEE 118. This represents a substantial compression of the contingency assessment space while preserving the dominant voltage-stress mechanisms.
Overall, the results establish persistence-based dominance analysis as a robust, scalable, and planning-oriented diagnostic tool for identifying structurally critical transmission lines under exhaustive conditions. The framework provides compact, quantitatively interpretable outputs that support vulnerability screening, monitoring prioritization, and contingency reduction in large-scale transmission networks.
Author Contributions
M.J.: conceptualization, methodology, validation, writing—review and editing, data curation, formal analysis. D.C.: validation, review and editing. C.B.-S.: review and editing. L.T.: review and editing. F.P.: review and editing. J.G.: review and editing. All authors have read and agreed to the published version of the manuscript.
Funding
This work was supported by Universidad Politécnica Salesiana and GIREI—Smart Grid Research Group.
Data Availability Statement
The original contributions presented in this study are included in the article. Further inquiries can be directed to the corresponding author.
Conflicts of Interest
Author Filippos Perdikos was employed by the company Openchip & Software Technologies SL, 08034 Barcelona, Spain. The remaining authors declare that the research was conducted in the absence of any commercial or financial relationships that could be construed as a potential conflict of interest.
Abbreviations
The following abbreviations and symbols are used in this manuscript:
| AC | Alternating Current |
| FVSI | Fast Voltage Stability Index |
| NR | Newton–Raphson |
| IEEE | Institute of Electrical and Electronics Engineers |
| Single-line outage contingency criterion | |
| Y-bus | Bus admittance matrix |
| Bus indices (sending and receiving ends of a line) | |
| n | Total number of buses in the system |
| Total number of transmission lines in the intact network | |
| k | Contingency (outage) scenario index |
| ℓ | Transmission line (edge) in the network graph |
| Canonical representation of a physical line | |
| Canonical bus index (lower index) | |
| Canonical bus index (higher index) | |
| Set of all transmission lines in the intact network | |
| Complete contingency set (all single-line outages) | |
| Intact network graph representation | |
| Post-outage network topology under contingency k | |
| Set of convergent contingency indices | |
| Dominant-line log (max-FVSI line per contingency) | |
| Set of unique dominant lines across all convergent contingencies | |
| Number of unique dominant lines, | |
| Dominant FVSI set conditioned on line ℓ being dominant | |
| Line-wise persistence and severity tuples | |
| Ranked list of dominant lines (persistence-first rule) | |
| Active power balance at bus i | |
| Reactive power balance at bus i | |
| Voltage magnitude at bus i (p.u.) | |
| Voltage phase angle at bus i (rad) | |
| Angle difference, | |
| Conductance between buses i and j | |
| Susceptance between buses i and j | |
| x | NR state vector (voltage magnitudes and angles) |
| NR state vector at iteration k | |
| Power mismatch vector | |
| J | Jacobian matrix |
| NR convergence flag (1 converged, 0 not converged) | |
| Line resistance between buses i and j | |
| Line reactance between buses i and j | |
| Line impedance, | |
| Magnitude of impedance, | |
| j | Imaginary unit, |
| Complex voltage, | |
| Complex voltage, | |
| Receiving-end complex power from bus i to bus j | |
| Complex conjugate | |
| Imaginary-part operator | |
| Receiving reactive power at bus j, | |
| FVSI of line | |
| FVSI of line ℓ under contingency k | |
| Dominant line under contingency k | |
| Maximum FVSI under contingency k | |
| Dominance count of line ℓ | |
| Dominance frequency (%), | |
| Mean of | |
| Standard deviation of | |
| Cumulative dominance share of the top-K ranked lines | |
| Minimum K such that |
References
- Jaramillo, M.D.; Carrión, D.F.; Muñoz, J.P. A Novel Methodology for Strengthening Stability in Electrical Power Systems by Considering Fast Voltage Stability Index under N − 1 Scenarios. Energies 2023, 16, 3396. [Google Scholar] [CrossRef]
- Musirin, I.; Rahman, T. On-line voltage stability based contingency ranking using fast voltage stability index (FVSI). In Proceedings of the IEEE/PES Transmission and Distribution Conference and Exhibition, Yokohama, Japan, 6–10 October 2002; Volume 2, pp. 1118–1123. [Google Scholar] [CrossRef]
- Fan, P.; Li, S.; Bu, S.; Wen, Y.; Chung, C.Y. Resilient Power Systems against Wildfire Risks: Towards a Human-Centric and Secure Future. CSEE J. Power Energy Syst. 2025, 11, 2553–2575. [Google Scholar] [CrossRef]
- Musirin, I.; Rahnian, T.K.A. Fast automatic contingency analysis and ran king for power system security assessment technique. In Proceedings of the Student Conference on Research and Development: Networking the Future Mind in Convergence Technology, SCOReD 2003—Proceedings, Putrajaya, Malaysia, 25–26 August 2003; pp. 231–236. [Google Scholar] [CrossRef]
- Nadeem, M.; Zeb, M.Z.; Imran, K.; Janjua, A.K. Optimal Sizing and Allocation of SVC and TCSC in Transmission Network by combined Sensitivity index and PSO. In Proceedings of the 2019 International Conference on Applied and Engineering Mathematics, ICAEM 2019—Proceedings, Taxila, Pakistan, 27–29 August 2019; pp. 111–116. [Google Scholar] [CrossRef]
- Jaramillo, M.D.; Carrión, D.F. Optimizing Critical Overloaded Power Transmission Lines with a Novel Unified SVC Deployment Approach Based on FVSI Analysis. Energies 2024, 17, 2063. [Google Scholar] [CrossRef]
- Jaramillo, M.; Carrión, D.; Perdikos, F.; Tipan, L. A Data-Driven Approach to Voltage Stability Support via FVSI-Based Distributed Generator Placement in Contingency Scenarios. Energies 2025, 18, 2466. [Google Scholar] [CrossRef]
- Panda, S.B.; Mohanty, S. Assessment of Power System Security for Different Bus Systems through FVSI/RFVSI and Fuzzy Logic Approaches. IETE Tech. Rev. 2022, 39, 1485–1500. [Google Scholar] [CrossRef]
- Choudekar, P.; Sinha, S.K.; Siddiqui, A. Optimal location of SVC for improvement in voltage stability of a power system under normal and contingency condition. Int. J. Syst. Assur. Eng. Manag. 2017, 8, 1312–1318. [Google Scholar] [CrossRef]
- Mohd Ali, N.Z.; Bin Musirin, I.; Mohamad, H. Effect of SVC installation on loss and voltage in power system congestion management. Indones. J. Electr. Eng. Comput. Sci. 2019, 14, 428–435. [Google Scholar] [CrossRef]
- Amrane, Y.; Kouba, N.E.L.Y. A Multiobjective optimal VAR dispatch using FACTS devices considering voltage stability and contingency analysis. In Predictive Modelling for Energy Management and Power Systems Engineering; Elsevier: Amsterdam, The Netherlands, 2020; pp. 1–26. [Google Scholar] [CrossRef]
- Gupta, S.K.; Mallik, S.K. Enhancement in Voltage Stability Using FACTS Devices Under Contingency Conditions. J. Oper. Autom. Power Eng. 2024, 12, 365–378. [Google Scholar] [CrossRef]
- Magadum, R.B.; Patil, B.K.; Dodamani, S.N.; Shetty, V.J. Contigency based UPFC Placement for Steady State Analysis. In Proceedings of the 2019 2nd International Conference on Power and Embedded Drive Control, ICPEDC 2019, Chennai, India, 21–23 August 2019; pp. 450–453. [Google Scholar] [CrossRef]
- Malathy, P.; Shunmugalatha, A. Enhancement of Maximum Loadability during N-1 and N-2 contingencies with multi type FACTS devices and its optimization using MDE algorithm. In Proceedings of the 2016 IEEE Uttar Pradesh Section International Conference on Electrical, Computer and Electronics Engineering, UPCON 2016, Varanasi, India, 9–11 December 2016; pp. 173–178. [Google Scholar] [CrossRef]
- Sheth, A.; Kotwal, C.D.; Pujara, S. Optimal placement of TCSC for improvement of static voltage stability. In Proceedings of the NUiCONE 2015—5th Nirma University International Conference on Engineering, Ahmedabad, India, 26–28 November 2016. [Google Scholar] [CrossRef]
- Sadanandan Sajan, K.; Kumar Mishra, A.; Kumar, V.; Tyagi, B. Phased Optimal PMU Placement Based on Revised Analytical Hierarchy Process. Electr. Power Components Syst. 2016, 44, 1005–1017. [Google Scholar] [CrossRef]
- Mishra, A.; Kumar, G.V.N. A redundancy based optimal placement of interline power flow controller using composite severity index for contingency management. Period. Polytech. Electr. Eng. Comput. Sci. 2015, 59, 138–146. [Google Scholar] [CrossRef]
- Gupta, S.K.; Mallik, S.K.; Tripathi, J.M.; Sahu, P. Comparison of Voltage Stability Index with Optimal Placement of SSSC Considering Maximum Loadability. In Proceedings of the 2021 International Symposium of Asian Control Association on Intelligent Robotics and Industrial Automation, IRIA 2021, Goa, India, 20–22 September 2021; pp. 101–106. [Google Scholar] [CrossRef]
- Mishra, A.; Kumar, G.V.N. A risk of severity based scheme for optimal placement of interline power flow controller using composite index. Int. J. Power Energy Convers. 2017, 8, 257–275. [Google Scholar] [CrossRef]
- Udgir, S.; Srivastava, L.; Pandit, M. Optimal placement and sizing of SVC for loss minimization and voltage security improvement using differential evolution algorithm. In Proceedings of the International Conference on Recent Advances and Innovations in Engineering, ICRAIE 2014, Jaipur, India, 9–11 May 2014. [Google Scholar] [CrossRef]
- Cepeda, J.C.; Ramirez, D.; Colome, D.G. Real-time adaptive load shedding based on probabilistic overload estimation. In Proceedings of the 2014 IEEE PES Transmission and Distribution Conference and Exposition, PES T and D-LA 2014—Conference Proceedings, Medellin, Colombia, 10–13 September 2014; pp. 1–6. [Google Scholar] [CrossRef]
- Kyomugisha, R.; Muriithi, C.M.; Nyakoe, G.N. Performance of Various Voltage Stability Indices in a Stochastic Multiobjective Optimal Power Flow Using Mayfly Algorithm. J. Electr. Comput. Eng. 2022, 2022, 7456333. [Google Scholar] [CrossRef]
- Izzati, T.N.; Soeprijanto, A.; Syifa, B.N.; Aryani, N.K.; Rahayu, P. Voltage Stability Enhancement Using NCPI-Based Optimal Reactive Power Compensation Under Critical Line Outages. In Proceedings of the International Seminar on Intelligent Technology and Its Applications, ISITIA, Surabaya, Indonesia, 23–25 July 2025; pp. 755–760. [Google Scholar] [CrossRef]
- Waghmare, R.S.; Bhat, S.; Dora, B.K. Contingency Analysis of IEEE 14 Bus System with Integration of DFIG Wind Farm. In Proceedings of the 2024 IEEE 4th International Conference on Sustainable Energy and Future Electric Transportation, SEFET 2024, Hyderabad, India, 31 July–3 August 2024. [Google Scholar] [CrossRef]
- Musirin, I.; Abdul Rahman, T. Novel fast voltage stability index (FVSI) for voltage stability analysis in power transmission system. In Proceedings of the Student Conference on Research and Development, Shah Alam, Malaysia, 17 July 2002; pp. 265–268. [Google Scholar] [CrossRef]


Disclaimer/Publisher’s Note: The statements, opinions and data contained in all publications are solely those of the individual author(s) and contributor(s) and not of MDPI and/or the editor(s). MDPI and/or the editor(s) disclaim responsibility for any injury to people or property resulting from any ideas, methods, instructions or products referred to in the content. |
© 2026 by the authors. Licensee MDPI, Basel, Switzerland. This article is an open access article distributed under the terms and conditions of the Creative Commons Attribution (CC BY) license.