Article

Numerical and Experimental Investigation of Blade Outlet Angle Effects on Flow Characteristics and Energy Losses in a Vortex Pump

1
College of Mechanical and Electrical Engineering, Guangxi Vocational College of Water Resources and Electric Power, Nanning 530023, China
2
Guangxi Datengxia Gorge Water Conservancy Development Co., Ltd., Nanning 530023, China
3
College of Energy and Electrical Engineering, Hohai University, Nanjing 211100, China
4
College of Metrology Measurement and Instrument, China Jiliang University, Hangzhou 310018, China
*
Author to whom correspondence should be addressed.
Energies 2026, 19(3), 758; https://doi.org/10.3390/en19030758
Submission received: 24 December 2025 / Revised: 21 January 2026 / Accepted: 28 January 2026 / Published: 31 January 2026

Abstract

The blade outlet angle is a critical design parameter of vortex pump impellers, exerting a significant influence on the pump’s hydraulic performance and internal flow characteristics. In this study, numerical simulations combined with experimental validation were conducted to investigate a vortex pump, with three impellers featuring blade outlet angles of 50°, 60°, and 65° analyzed based on the SST kω turbulence model. To quantify irreversible energy losses, entropy production theory was adopted, while the Liutex method was utilized to characterize rigid-body vorticity. The results demonstrate that increasing the blade outlet angle leads to a reduction in head under both small-flow-rate and design-flow-rate conditions, impairs flow uniformity, strengthens vortex structures, and elevates total entropy production—with turbulent dissipation being the dominant contributor to energy losses. Additionally, larger outlet angles enhance the sensitivity of internal flow structures to off-design operating conditions. These findings offer valuable guidance for the optimization of impeller design and the development of energy-efficient vortex pumps.

1. Introduction

As a key energy conversion device, pumps are widely applied in aerospace, petrochemical engineering, transportation, and many other fields. According to their working principles, pumps can be classified into positive displacement pumps, rotodynamic pumps, and other types [1,2,3,4,5,6,7,8]. In industrial production and daily life, scenarios such as municipal sewage discharge, wastewater treatment, and slurry transportation often involve the conveyance of media with high viscosity and high solid content. Conventional pump types generally suffer from low efficiency, severe wear, and a high tendency to clog under such conditions [2,9,10,11,12,13]. The emergence of vortex pumps has effectively addressed these technical challenges [14,15,16,17].
A vortex pump is a type of centrifugal pump characterized by a rear-mounted impeller located behind the pressure chamber. Within the bladeless chamber, the fluid forms two distinct flow patterns, namely through-flow and circulating flow. When conveying solid–liquid mixtures, solid particles are predominantly entrained into the low-pressure region generated by the circulating flow and are discharged together with the through-flow, while only a very small fraction of particles enter the impeller. This minimizes impeller wear while the bladeless chamber allows solid particles and long fibers to pass through the pump without contacting the rotating components, thereby effectively preventing blockages, which is why the vortex pump is commonly referred to as a non-clogging pump [18]. Owing to this inherent advantage—particularly its ability to tolerate large particles, fibers, and corrosive abrasives present in sewage and acids—vortex pumps have been widely employed in municipal sewage discharge, acid transportation, and agricultural irrigation [19,20,21].
The impeller is the core hydraulic component of a vortex pump. By performing work on the fluid, it converts mechanical energy into fluid kinetic energy and directly determines the overall pump performance [22]. Key geometric parameters of the impeller include blade width, impeller diameter, blade number, and blade thickness [19]. Optimization of these parameters can improve the internal flow pattern and enhance hydraulic efficiency [23,24,25]. In recent years, several studies have investigated the influence of impeller geometry on the performance of vortex pumps [19,22,23,24]. Although machine learning is increasingly applied to pump performance prediction [26,27,28,29], it often focuses on data-driven correlations while overlooking the underlying physical mechanisms. Therefore, a detailed analysis of specific geometric parameters remains essential to understand their intrinsic impact on flow dynamics. Among these parameters, the blade outlet angle is one of the most critical design variables in rotodynamic pumps. It directly controls the velocity direction and momentum distribution of the fluid at the impeller outlet, thereby affecting pressure recovery, hydraulic efficiency, and flow stability. Appropriate selection of the outlet angle can suppress adverse flow phenomena, reduce pressure pulsations and noise, and improve operational reliability. In addition, the blade outlet angle influences blade loading distribution, which is closely related to structural stress and service life, making it a key parameter in the integrated optimization of hydraulic and mechanical performance.
For the blade outlet angle, existing studies—primarily focused on centrifugal pumps—have yielded consistent insights: Muslim H et al. [30] found that smaller outlet angles increase pump pressure but reduce efficiency due to higher kinetic energy losses; Sakran K et al. [31] reported that increasing the outlet angle leads to elevated entropy generation; Han et al. [32] observed that a larger outlet angle results in a steeper velocity gradient at the diffuser inlet, exacerbating diffuser losses; Ding et al. [33] noted that at low flow rates, larger outlet angles boost flow speed near the volute tongue while the low-pressure area at the impeller inlet first expands and then shrinks; and Ding et al. [34] demonstrated that centrifugal pump head increases with the outlet angle, while efficiency rises initially and then declines as flow rate increases.
Existing studies have primarily focused on the effect of blade outlet angle on the performance of centrifugal pumps. Using flow visualization experiments, numerical simulations, or combined experimental–numerical approaches, researchers have established a relatively mature understanding of how outlet angle variations affect pump head and efficiency. However, compared with centrifugal pumps, systematic investigations on the blade outlet angle of vortex pumps remain limited, and the underlying flow and energy dissipation mechanisms are still insufficiently understood.
In recent years, entropy production theory has been increasingly employed to analyze internal energy losses in fluid machinery, providing a quantitative and physically interpretable framework for identifying irreversible dissipation. Previous studies on centrifugal pumps have demonstrated that entropy production analysis can effectively reveal the relationship between blade outlet angle and internal energy loss characteristics. Nevertheless, vortex pumps differ fundamentally from centrifugal pumps in both outlet angle design and internal flow structure. To generate strong swirling flow, vortex pumps typically adopt relatively large blade outlet angles. As a hybrid pump combining characteristics of positive displacement and rotodynamic pumps, vortex pumps play an irreplaceable role in complex and multiphase fluid transport due to their superior anti-clogging capability and structural robustness.
Despite their engineering importance, the mechanisms by which the blade outlet angle influences the internal flow evolution, energy dissipation, and vortex dynamics in vortex pumps remain poorly understood. In particular, systematic studies integrating hydraulic performance, entropy production, and vortex structure analysis are still lacking, which limits the theoretical basis for outlet angle optimization in vortex pump design.
Complementary research on entropy production and rigid-body vorticity has further laid the groundwork for understanding flow and energy loss mechanisms: Guan et al. [35] identified the volute as the dominant source of energy loss; Huang et al. [36] found that turbulence is the primary contributor to entropy generation; Jia et al. [37] reported a correlation between flow loss and vibration; Li et al. [38] observed that pulse flow induces lag effects; Shi et al. [39] demonstrated that the Omega method effectively identifies vortex instability; and Alvarez O et al. [40] showed that the Liutex method offers superior vortex definition compared to traditional approaches.
Therefore, in this study, numerical simulations combined with experimental tests are conducted. The SST kω turbulence model is employed, together with entropy production theory and the Liutex vortex identification method, to systematically investigate the effects of blade outlet angle variation on the hydraulic performance, internal flow characteristics, energy loss mechanisms, and rigid-body vorticity evolution in a vortex pump. The aim is to fill existing research gaps and provide theoretical support and data references for impeller structural optimization and engineering applications of vortex pumps.

2. Physical Model

2.1. Research Object

In this study, a vortex pump with a rated flow rate of 40 m3/h, a rated head of 20 m, and a rated rotational speed of 2700 r/min is selected as the research object. Other main design parameters of the vortex pump are listed in Table 1.
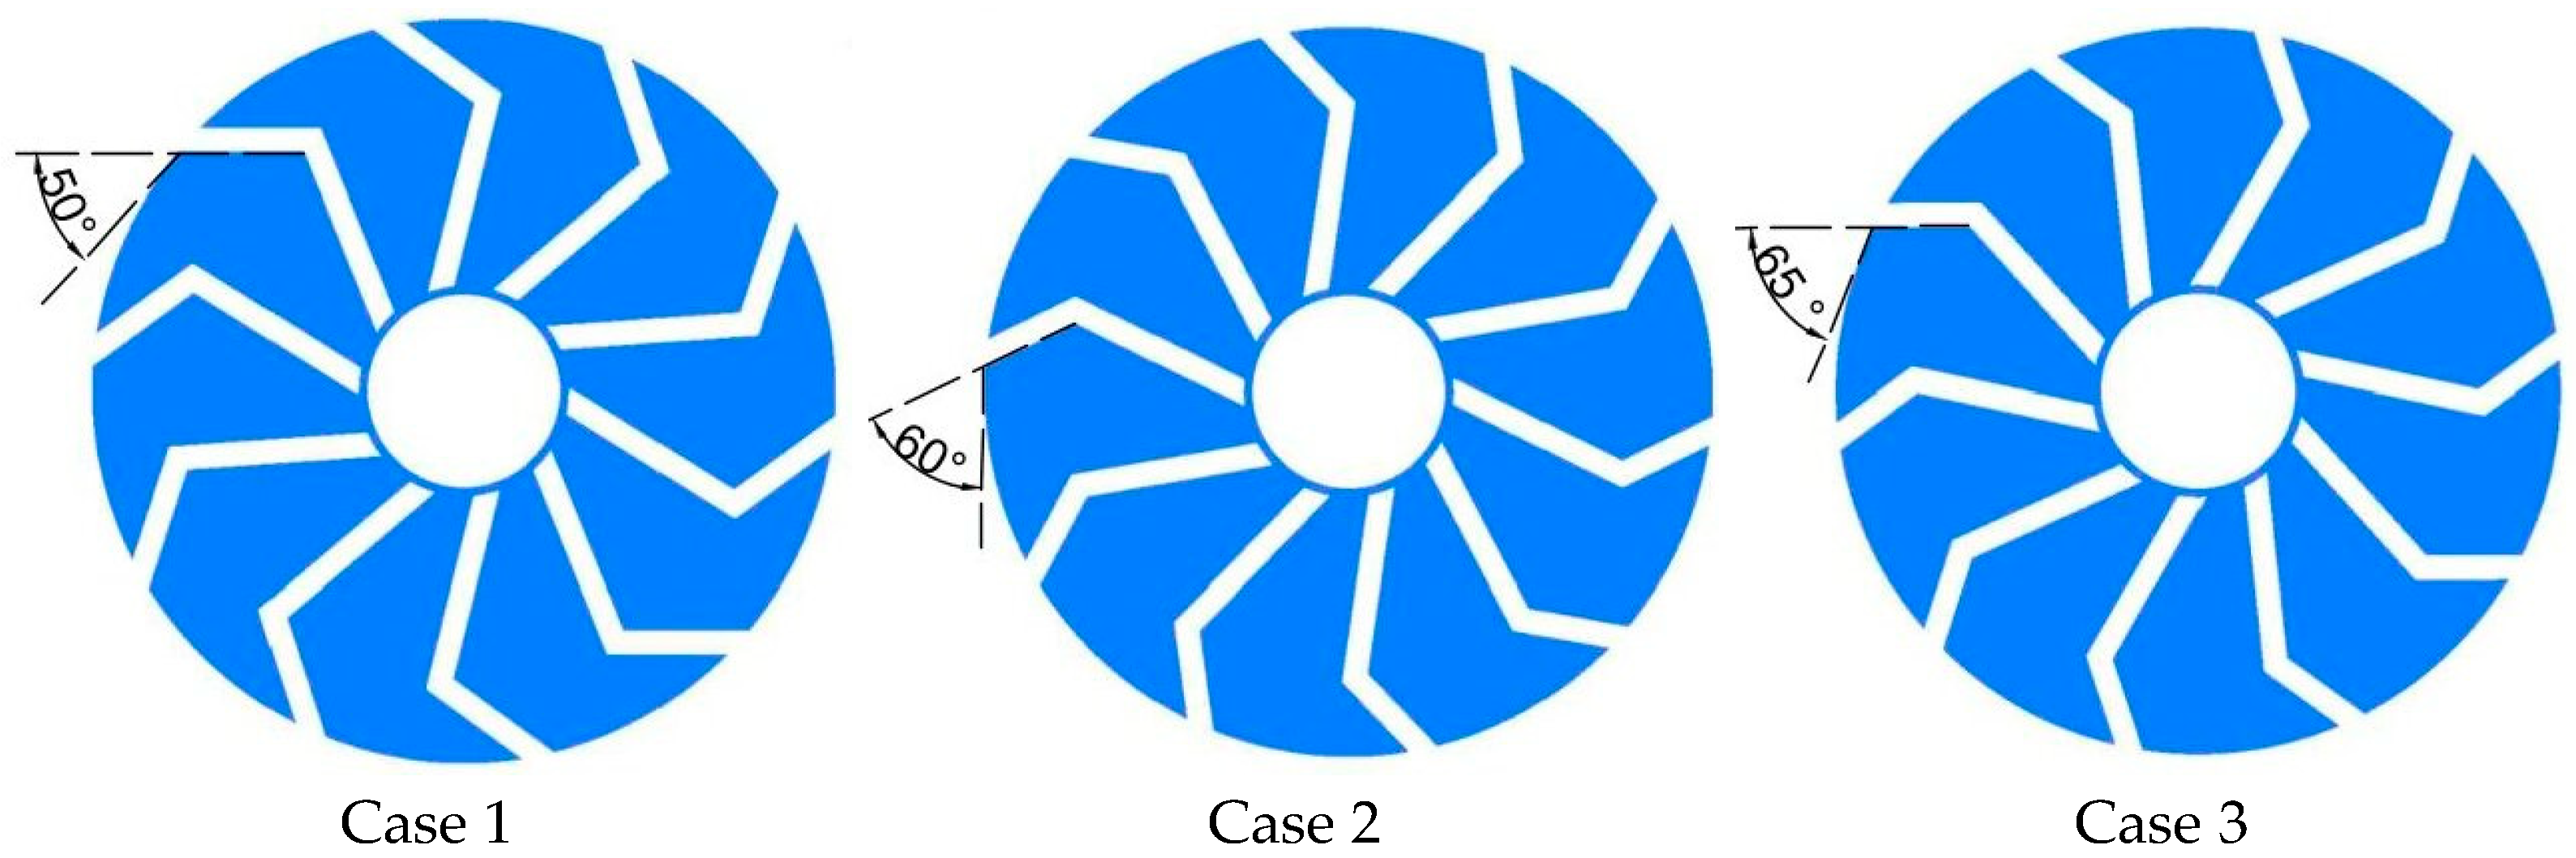
The blade outlet angle, as a core design parameter of the vortex pump impeller, has a significant influence on the hydraulic performance of the pump. It directly determines the velocity direction of the fluid at the impeller outlet, the efficiency of momentum conversion, and the overall operating performance of the pump. In this study, three outlet angle Cases of 50°, 60°, and 65° are designed, as shown in Figure 1. Our prior work demonstrated that the pump exhibits the best overall performance at a blade outlet angle of 65.9° [41]. Furthermore, existing literature suggests that investigations into blade outlet angles typically focus on a narrow interval of ±15° relative to the optimal angle [31]. Consequently, to elucidate the underlying influence mechanism of this parameter, angles of 50°, 60°, and 65° were chosen for detailed analysis, as depicted in Figure 1. Numerical simulations are carried out to investigate the influence of outlet angle variation on the hydraulic performance of the vortex pump, and experimental tests are conducted to validate the numerical results.

2.2. Numerical Preprocessing

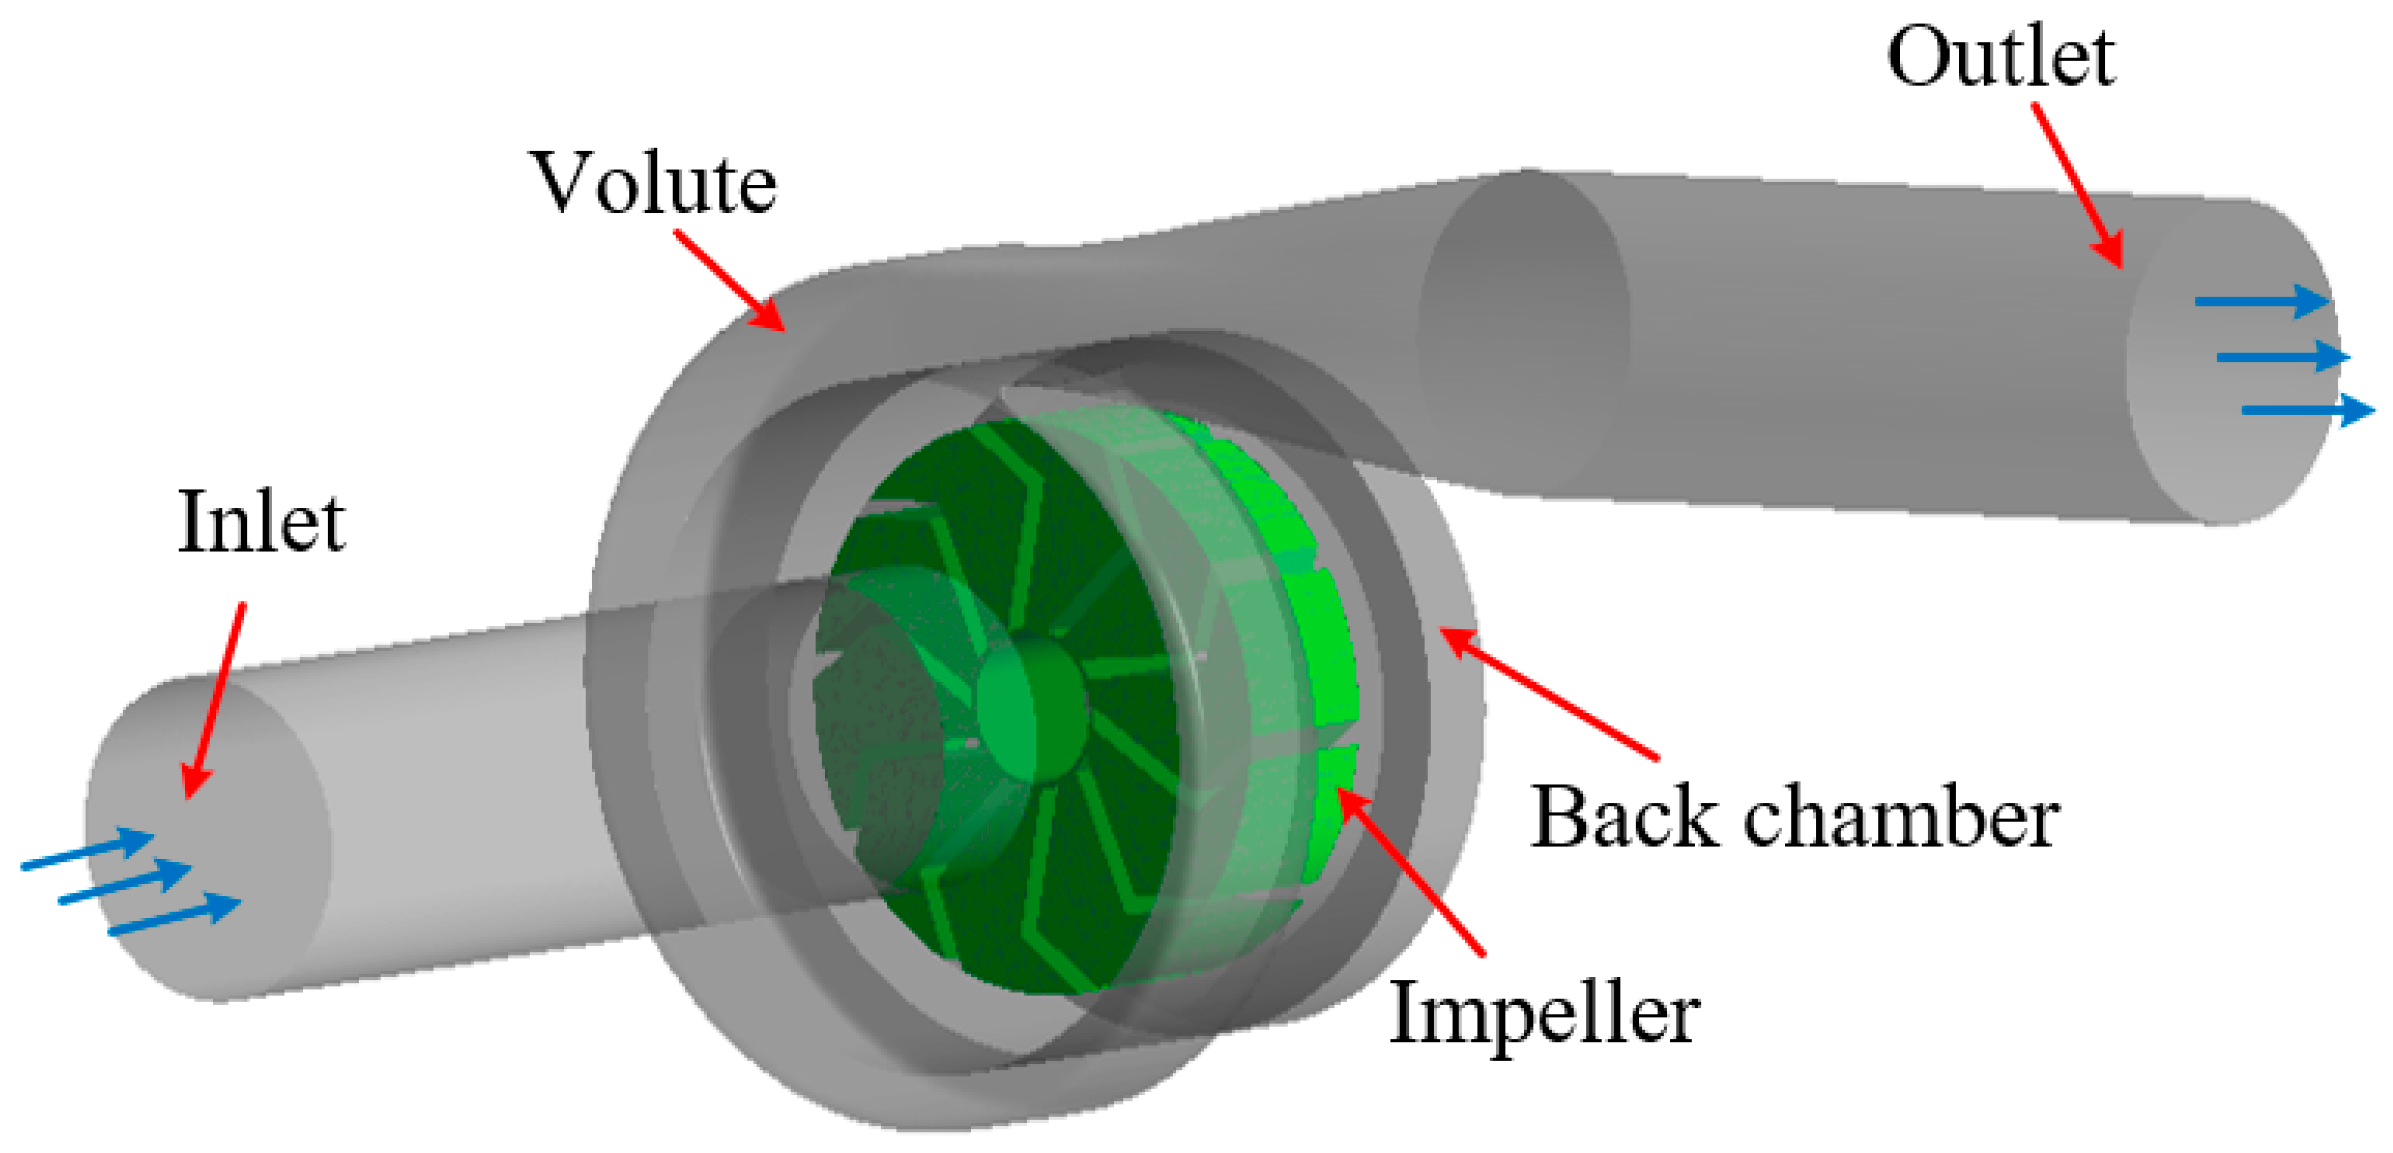
Prior to numerical simulation, preprocessing of the vortex pump model is required. First, a three-dimensional computational domain was established using simulation software, including the inlet section, outlet section, impeller, volute, and pump chamber clearance, which constitute the main hydraulic flow passages, as shown in Figure 2.
The quality of mesh generation directly affects the accuracy and efficiency of numerical simulations. In this study, structured meshes were adopted for the impeller and pump chamber, while an unstructured mesh was applied to the volute. y+ is a core parameter characterizing near-wall grid resolution, which directly affects the accuracy of boundary layer flow simulation [42,43]. The kω model is inherently a “low-Reynolds-number model” that can directly solve near-wall flow without relying on wall functions. Within the range of y + 5 , the model’s prediction accuracy for near-wall turbulence can be ensured, and the error is controlled within an engineering acceptable range. The y+ value in this simulation is 5.
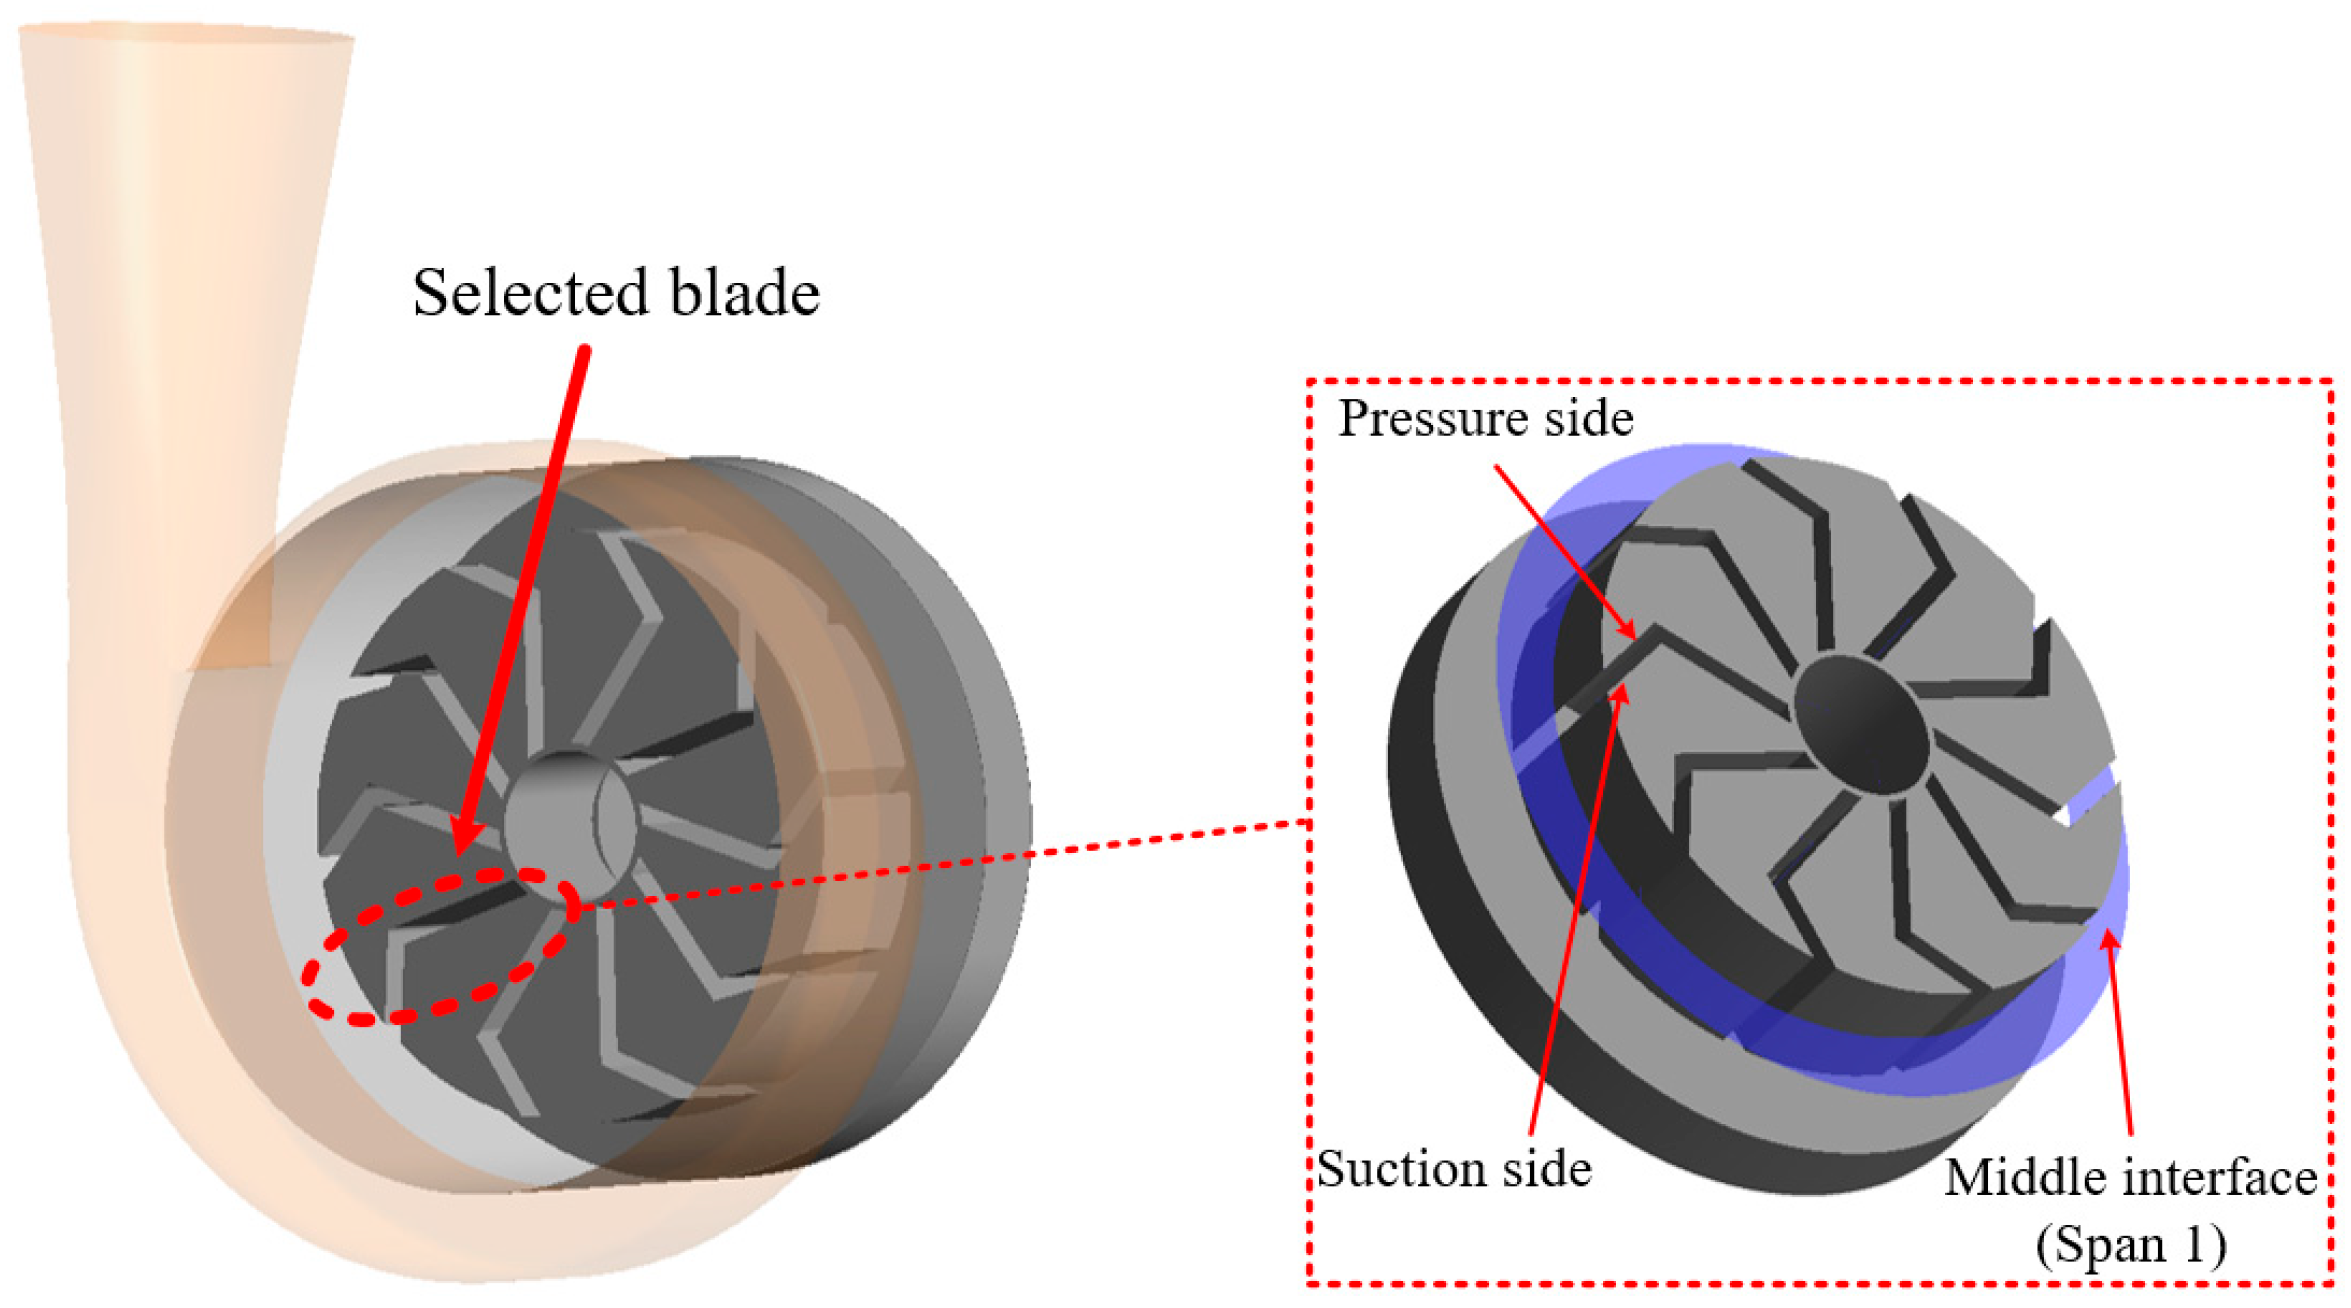
Accurate capture of the pressure distribution on blade surfaces is essential for evaluating hydrodynamic performance. Therefore, a representative analysis section located at the mid-span position (Span 1) was defined on the target blade As shown in Figure 3, This section is perpendicular to the hub axis and spans the entire flow passage. Located at the geometric center along the blade height direction, this mid-span section is considered the most representative position for capturing the core blade loading and dominant flow structures. Systematic comparative analysis of the pressure side and suction side on this section enables effective evaluation of the variations in external characteristics, entropy production, and rigid-body vorticity evolution of blades with different outlet angles under various operating conditions, thereby providing critical guidance for impeller design optimization.

2.3. Grid Independence Verification

In numerical simulations of internal pump flow, the number of grid elements has a significant influence on computational cost and simulation accuracy. The primary objective of numerical simulation is to ensure reliable results while maintaining efficient utilization of computational resources. When the grid number is insufficient, computational time may be reduced, but simulation accuracy is often inadequate to accurately represent the complex internal flow characteristics. Conversely, excessively fine grids improve accuracy at the expense of substantially increased computational time.
As shown in Table 2 under otherwise identical computational conditions, the influence of grid number on key pump performance parameters such as head and efficiency can be directly observed. When the grid number exceeds 4.41 million, the variation rates of head and efficiency are both below 0.5%, indicating that the simulation results have reached a converged and stable state and are no longer significantly affected by further grid refinement. This satisfies the fundamental criterion of grid independence, namely that beyond a certain threshold, the influence of grid density on numerical results becomes negligible. Therefore, considering both simulation accuracy and computational efficiency, a grid number of 4.41 million was selected as the optimal mesh configuration for the present study.
The Grid Convergence Index (GCI) is a core indicator in Computational Fluid Dynamics (CFD) used to quantify grid discretization errors and evaluate the reliability of numerical simulation results. It is generally considered that when GCI < 3%, the grid dependence of the solution is extremely low, and the simulation results are highly reliable.
The GCI calculation procedure is as follows:
  • Step 1: Determine the grid refinement ratio r
Calculate one Grid Convergence Index (GCI) for every 3 sets of grids and perform numerical simulations: set r = 1.13 for the first three groups of grids and r = 1.06 for the last three groups. This means the grids are expanded by r times simultaneously in 3 directions, and the head and efficiency under rated flow rate are selected as the evaluation parameters for convergence.
  • Step 2: Calculate the convergence accuracy
    p = ln ( f 3 f 2 ) ( f 2 f 1 ) / ln ( r )
    where f i represents the head or efficiency of each set of grids.
  • Step 3: Calculate the ideal solution using the Richardson extrapolation method
    f h = 0 = f 1 + f 1 f 2 r p 1
  • Step 4: Calculate the relative error
    ε 12 = ( f 1 f 2 ) / f 1
    ε 23 = ( f 2 f 3 ) / f 2
  • Step 5: Calculate the Grid Convergence Index (GCI)
    G C I 12 = F s ε 12 r p 1
    G C I 23 = F s ε 23 r p 1
    where F s is the safety factor, taken as 1.25 in this paper.
The calculation results are shown in Table 2 and Table 3. This meets the basic criteria for mesh independence, so considering both simulation accuracy and computational efficiency, this study selects a mesh number of 4.41 million as the optimal mesh configuration.

2.4. Governing Equations and Boundary Conditions

During operation, the internal flow of a vortex pump exhibits typical turbulent characteristics. Therefore, appropriate selection of a turbulence model is critical for ensuring the reliability of numerical simulations. The Reynolds-Averaged Navier–Stokes (RANS) approach, which involves time-averaging of the governing equations, offers advantages such as low computational cost and strong engineering applicability and has been widely used in practical simulations. Common RANS-based turbulence models include the standard kε model, the RNG kε model, and the SST kω model.
The SST kω model is selected for this study due to its core advantage of introducing a blending function that enables smooth switching between the kω and kε models based on wall distance—perfectly adapting to the vortex pump’s complex flow field with distinct near-wall and free-stream characteristics [44]. In the near-wall region of the impeller and volute, where viscous effects dominate and low-Reynolds-number boundary layer flows prevail, the model switches to the kω formulation to accurately capture velocity gradients and turbulent energy dissipation. In the free-stream region where large-scale turbulence dominates, it transitions to the kε model to reliably predict large vortex structures and overall flow distribution. This blending mechanism overcomes the kω model’s high sensitivity to free-stream conditions and the kε model’s inadequacy in boundary layer simulations, making it particularly suitable for capturing adverse pressure gradients and flow separation in vortex pumps. Widely accepted in academic and engineering communities for turbomachinery internal flow simulations, this model further improves the definition of eddy viscosity [45] and incorporates transport effects of principal turbulent shear stress, significantly enhancing prediction accuracy for complex flows. The governing equations are expressed as:
( ρ k ) t + ( ρ u j k ) x j = τ i j μ i x j + x j [ ( μ + σ k ρ k ω ) k x j ] β * ρ k ω
( ρ ω ) t + ( ρ u j ω ) x j = x j [ ( u + σ ω u t ) ω x j ] + γ v t τ i j μ i x j β ρ ω 2 + 2 ( 1 F 1 ) ρ σ ω 2 ω k x j ω x j
where u denotes the velocity components; σ ω , σ ω 2 , β , β * , γ are empirical constants; and τ i j represents the stress tensor.
This numerical simulation employs the SST kε turbulence model. For numerical simulations, the boundary conditions and computational parameters were specified as follows. A mass flow rate inlet was applied at the inlet boundary, while a pressure outlet condition was imposed at the outlet. The impeller region was defined as a rotating domain with a rotational speed of 2700 r/min, and all other regions were treated as stationary domains. The reference pressure was set to 1 atm. All solid walls were modeled using no-slip boundary conditions, and standard wall functions were employed for near-wall treatment. Interfaces between rotating and stationary domains were handled using the frozen rotor approach. For steady-state simulations, the maximum number of iterations was set to 3000, with a convergence residual threshold of 10−6.
For unsteady flow simulations, the interface type was switched to a transient rotor–stator model. The time step size was set to 0.00006 s, and the total simulation time was 0.1296 s, corresponding to six impeller revolutions. The maximum number of iterations per time step was limited to 20. Considering that flow field stability during the initial transient periods may be relatively poor, only the results from the final cycle were selected for analysis to ensure reliability of the unsteady flow results.

3. Experimental Investigation

3.1. Experimental Setup

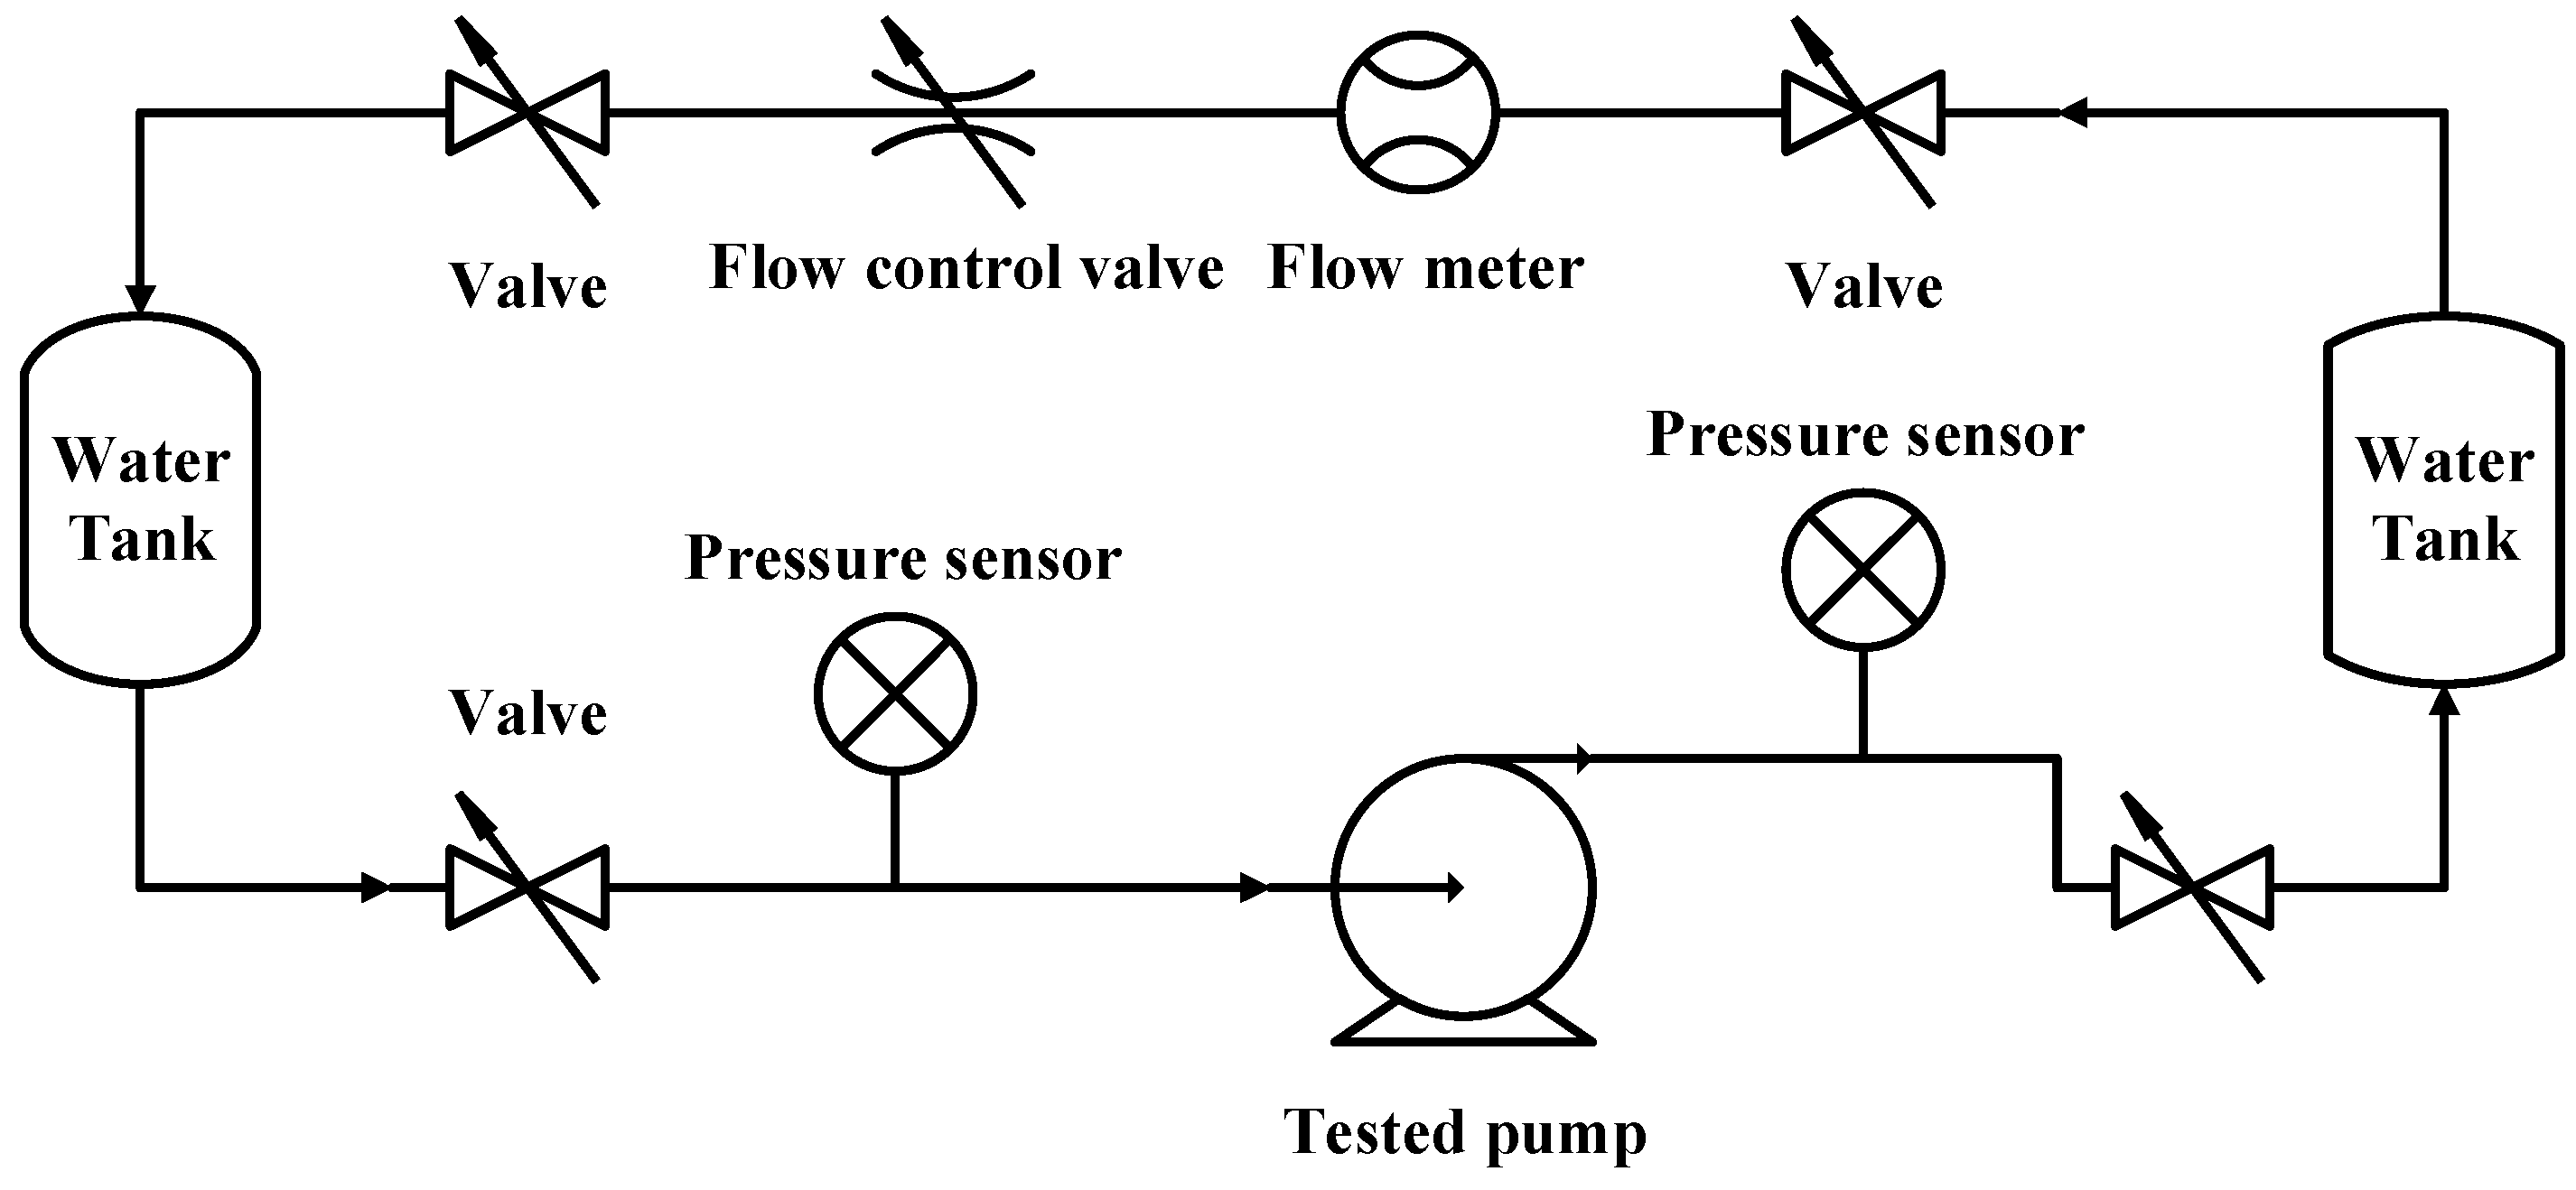
In this study, a closed-loop test rig was employed to establish the external performance testing system for the vortex pump. The system mainly consists of a surge tank, cavitation tank, three-phase asynchronous motor, tested vortex pump, pressure sensors, flowmeter, lifting platform, pipelines, valves, and a control system (including a computer and control cabinet). The overall configuration of the test system is shown in Figure 4. Detailed specifications of the experimental instruments are listed in Table 4.
During the experiments, the operating states of the motor, valves, and flowmeter were centrally regulated by the control system to ensure precise and stable control of the testing process. Meanwhile, the measurement data from the pressure sensors were collected, stored, and monitored in real time through the control system, providing reliable support for dynamic tracking and complete recording of experimental data.
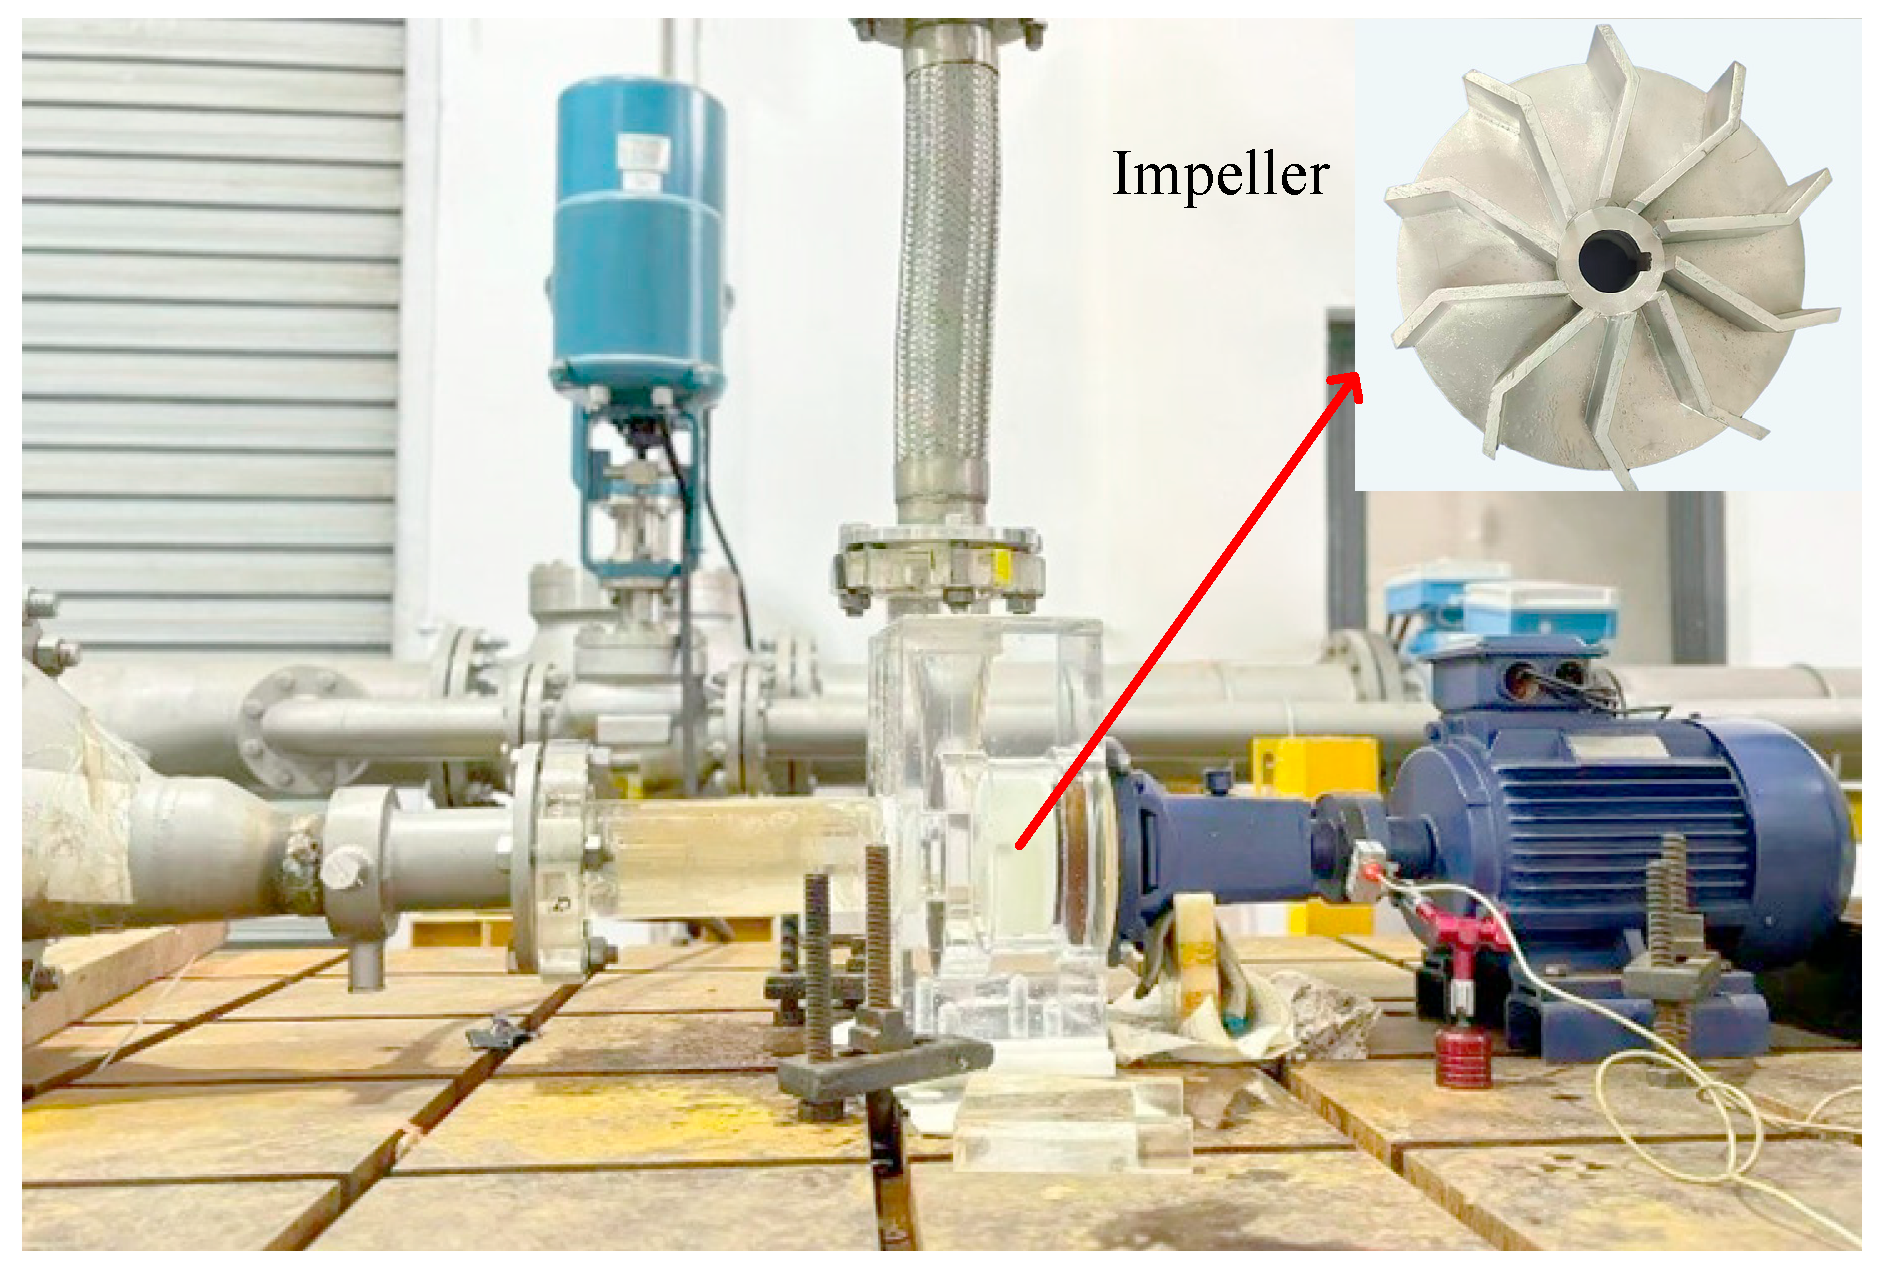
Figure 5 shows a photograph of the experimental setup for hydraulic performance testing of the vortex pump. The inlet and outlet of the vortex pump were connected to the test pipeline through flange joints to ensure stable and leak-free fluid flow within the system. The environmental parameters during the experiments, such as fluid temperature and atmospheric pressure, were maintained in close agreement with the preset boundary conditions used in numerical simulations. This consistency provides a solid basis for effective comparison and in-depth analysis between numerical and experimental results, thereby supporting validation and optimization of the vortex pump design.
To comprehensively verify the credibility and reliability of the experimental results, a systematic uncertainty analysis was conducted on the measured data in this study, focusing on two key dimensions: random uncertainty ER and systematic uncertainty ES. The combined uncertainty E was further calculated to comprehensively characterize the measurement accuracy of the experimental results. In the analysis process, the random uncertainty was derived based on the standard deviation, number of measurements, individual measured values, arithmetic mean, and a confidence coefficient of 1.96. The systematic uncertainty was determined by integrating the systematic uncertainties of the sensors and data acquisition instruments, with a related coefficient k = 1.96, and the combined uncertainty was obtained through further derivation from the two aforementioned uncertainties. Calculations based on the measured data of flow rate and pressure show that the random uncertainty ER of flow rate is 0.045% and its systematic uncertainty ES is 0.21, while the random uncertainty ER of pressure is 0.415% and its systematic uncertainty ES is 0.26%. The combined uncertainties of both parameters fall within their respective reasonable ranges. All measurement uncertainties do not exceed the acceptable engineering limits, and no significant systematic bias is observed. The proportional relationship between systematic uncertainty and random uncertainty is consistent with the experimental design expectations, confirming the stable operating state of the measurement instruments and the reliability of the experimental procedures. These results fully demonstrate that the experimental results of this study have high credibility, and the uncertainty analysis further validates the reliability of the entire measurement system.

3.2. Experimental Results

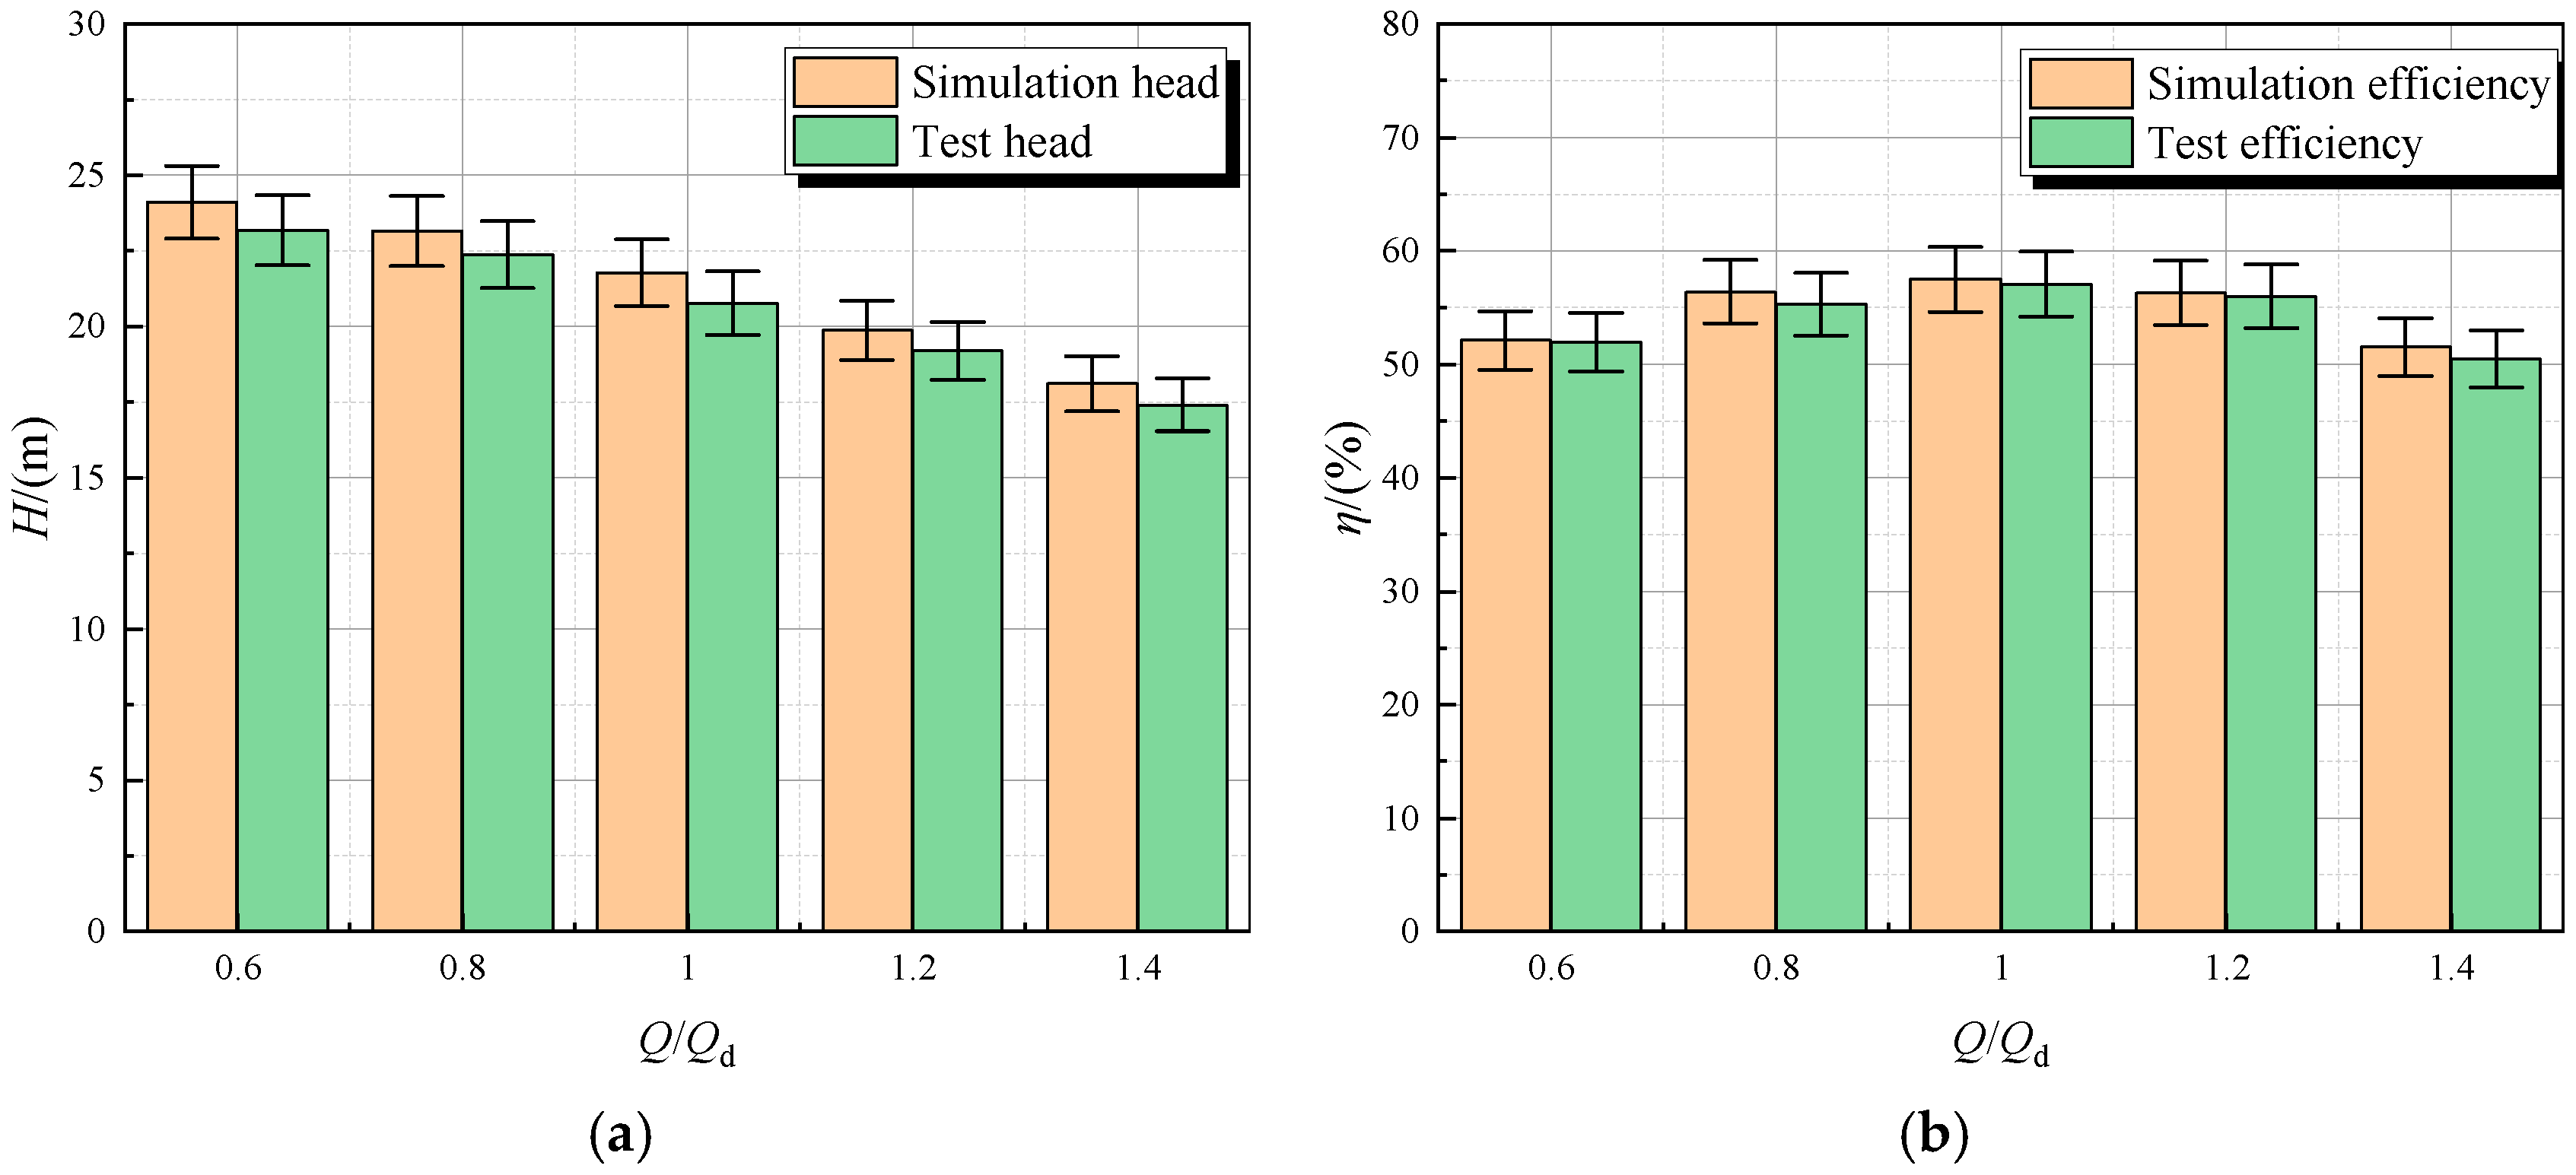
In this study, hydraulic performance characterization was carried out for five typical flow rate conditions of the original vortex pump model using a combination of experimental testing and numerical simulation. The experimental and numerical results are plotted in Figure 6 and Table 5.
As shown in Figure 6, the head of the original model decreases monotonically with increasing flow rate, while the efficiency first increases and then decreases as the flow rate rises. This behavior is fully consistent with the inherent hydraulic performance characteristics of vortex pumps. Comparison of the external characteristic curves obtained from numerical simulations and experiments indicates that the simulated results are slightly higher than the experimental values; which is mainly attributed to the neglect of wall roughness in the numerical model, simplification of small gaps and filet structures in the computational domain, and inherent approximation of the turbulence model; however, the overall trends are in good agreement, and the quantitative discrepancies remain within an acceptable range.
These observations demonstrate that the numerical simulation approach adopted in this study provides sufficient computational accuracy. The simulation results meet the accuracy requirements for both engineering applications and academic research and can effectively capture the internal flow characteristics of the vortex pump.

4. Results and Discussion

4.1. Effect of Blade Outlet Angle on External Characteristics

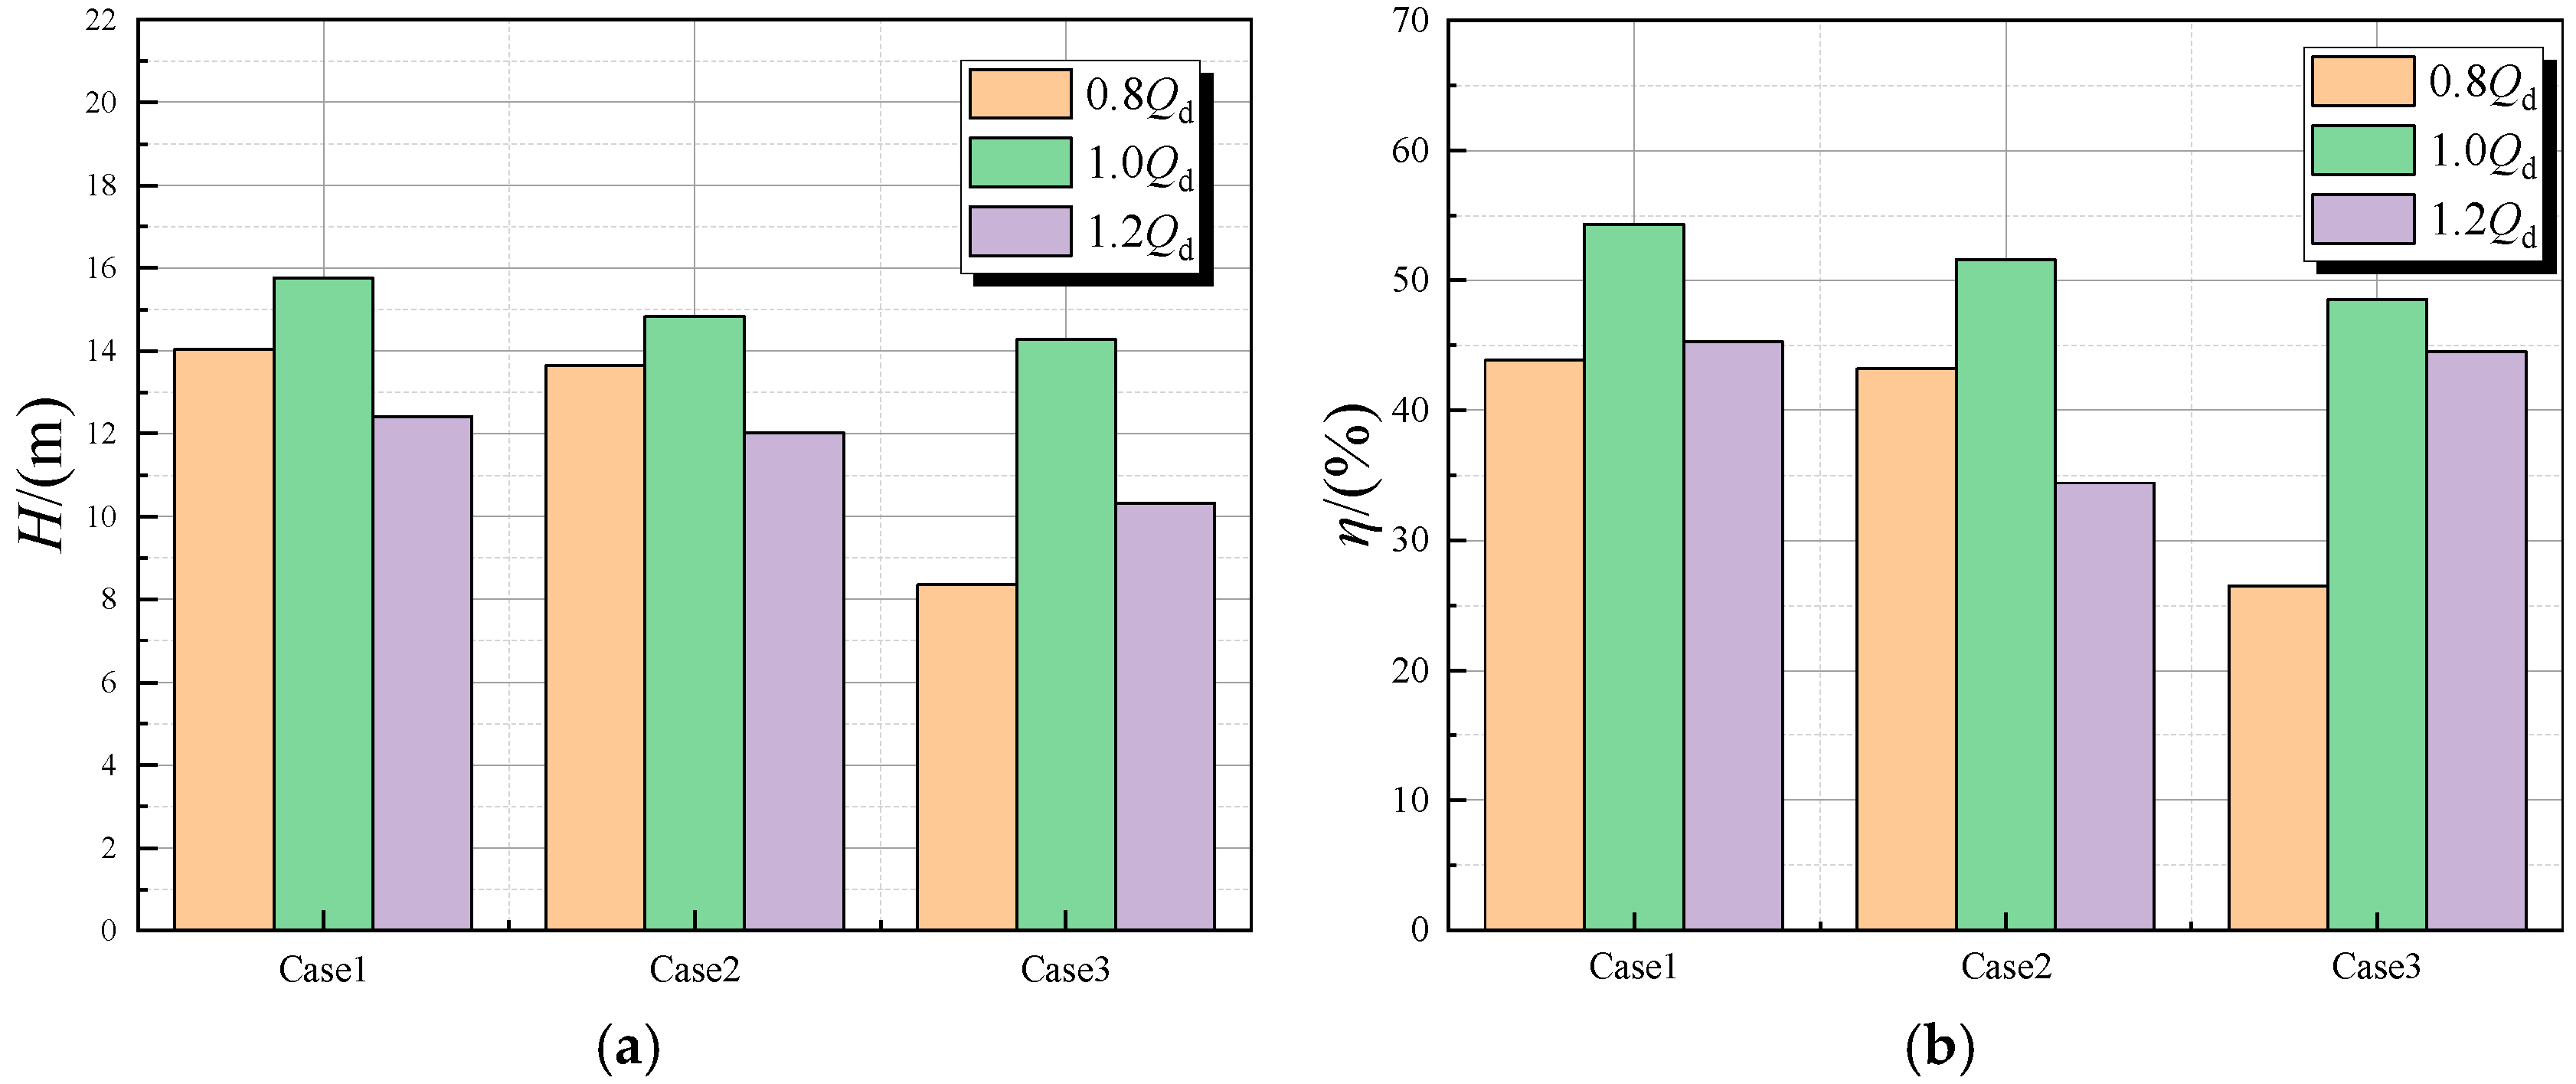
According to the results summarized in Table 6 and Figure 7, the influence of blade outlet angle on head and efficiency is evident. In terms of head, under the 0.8Qd and 1.0Qd operating conditions, the head generally decreases as the blade outlet angle increases from 50° to 65°. Under the 0.8Qd condition, the head corresponding to the 65° outlet angle is only 8.35 m, which is the lowest among all cases. Under the 1.0Qd condition, the reduction in head is relatively moderate.
With respect to efficiency, for a given outlet angle, the efficiency generally follows the intrinsic characteristic of vortex pumps, increasing first and then decreasing with increasing flow rate. For example, at an outlet angle of 50°, the efficiency reaches 0.54 under the 1.0Qd condition, which is higher than those at 0.8Qd and 1.2Qd. However, under the same operating condition, efficiency does not exhibit a monotonic variation with outlet angle. For instance, under the 1.2Qd condition, efficiency decreases as the outlet angle increases from 50° to 60° and then slightly increases when the outlet angle is further increased to 65°.
Overall, 1.0Qd represents a relatively optimal operating condition for the vortex pump. Among the tested designs, the impeller with a blade outlet angle of 50° exhibits superior overall performance in terms of both head and efficiency across different operating conditions.

4.2. Effect of Blade Outlet Angle on Internal Flow Field

The analysis of external characteristics has systematically revealed the influence of different blade outlet angles and operating conditions on macroscopic performance indicators such as head and efficiency of the vortex pump. However, external characteristic analysis mainly focuses on overall pump performance and is insufficient to elucidate the underlying flow mechanisms responsible for these macroscopic differences. In other words, it cannot explain why variations in blade outlet angle lead to specific trends in head and efficiency, nor can it capture microscopic flow phenomena such as non-uniform velocity distribution, abrupt pressure gradients, and vortex generation within the flow passages.
These microscopic flow features are precisely the intrinsic factors governing the macroscopic performance of vortex pumps [46]. Their evolution is directly related to energy conversion efficiency and operational stability. Therefore, to overcome the limitations of external characteristic analysis and fundamentally clarify the regulating mechanism of blade outlet angle on vortex pump performance, the following section focuses on internal flow field analysis. By combining velocity contours, pressure contours, and velocity vector diagrams, the detailed flow characteristics within the passages under different outlet angles and operating conditions are thoroughly examined. This analysis aims to identify the distribution patterns of flow field parameters and the mechanisms responsible for abnormal flow phenomena, thereby providing a more accurate theoretical basis for subsequent structural optimization of vortex pumps.
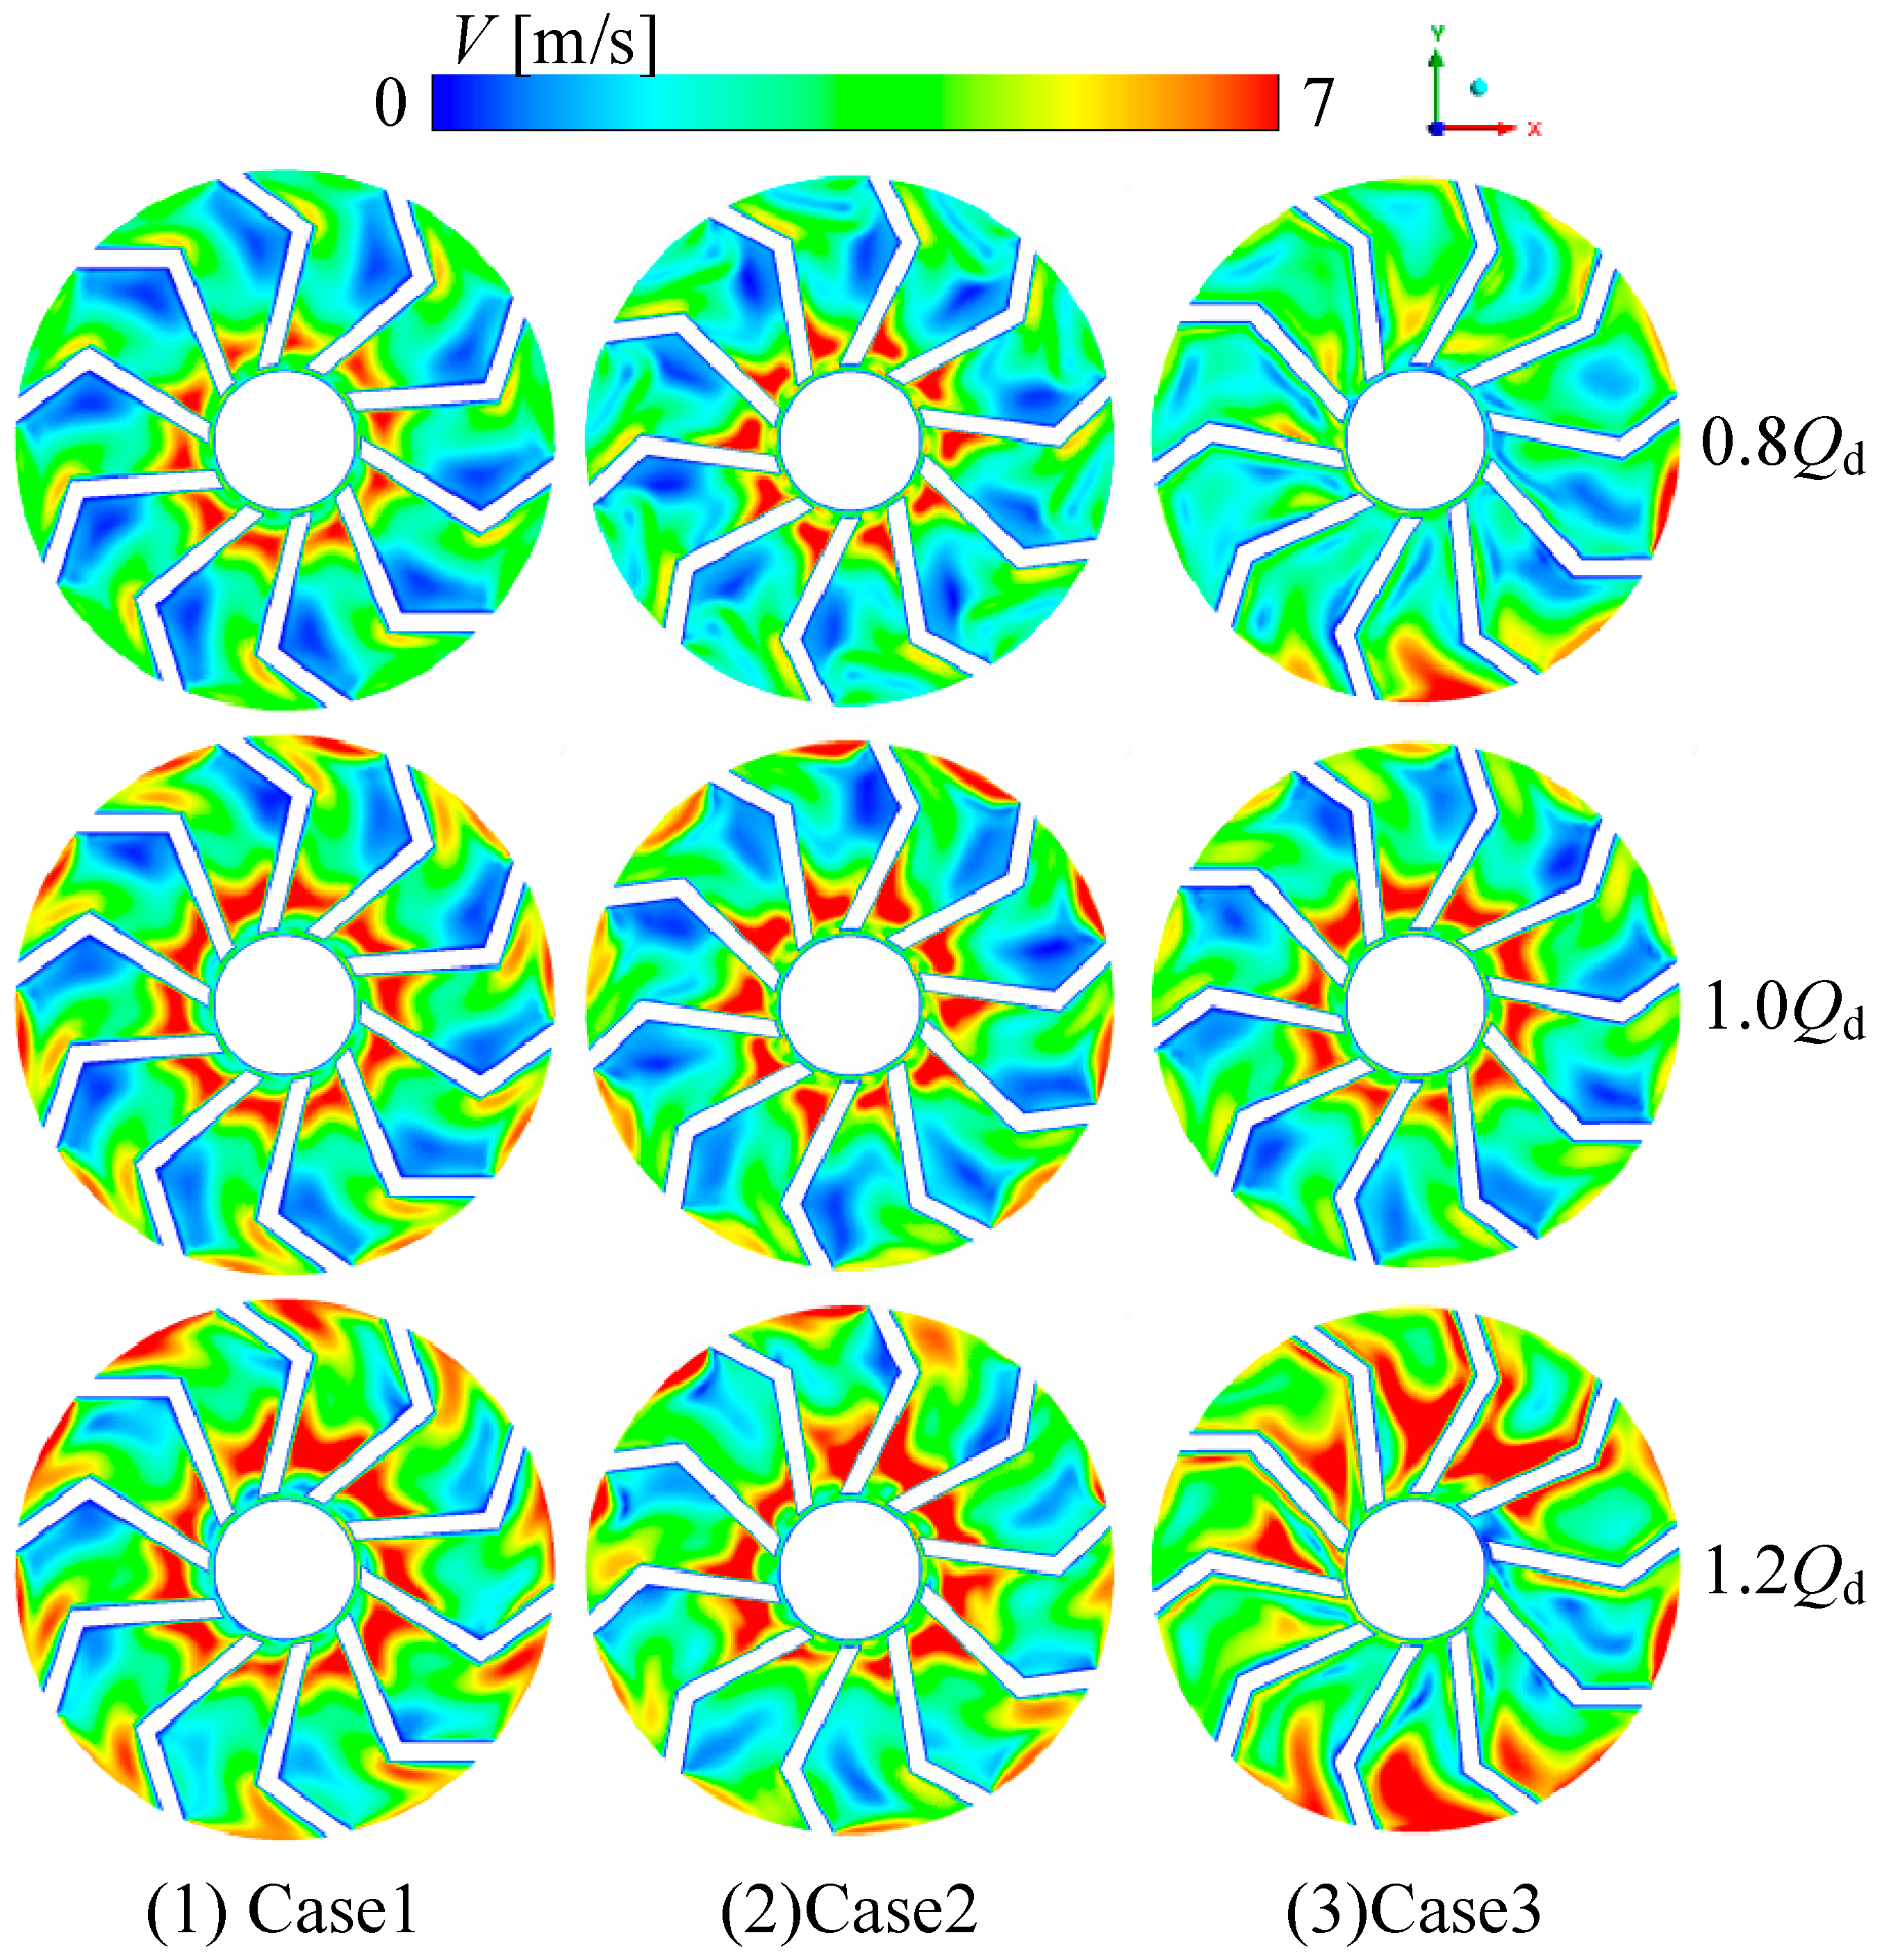
Figure 8 presents the velocity contours in the flow passages under different blade outlet angles and operating conditions. As shown in the figure, for Case 1, the velocity distribution within the flow passages remains relatively uniform under 0.8Qd, 1.0Qd, and 1.2Qd conditions. The velocity difference is generally controlled within 2 m/s, and the transition from low-velocity regions to medium–low-velocity regions is smooth, without pronounced fluctuations. No localized velocity spikes are observed within individual blade passages.
For Case 2, localized high-velocity regions of approximately 5–6 m/s begin to appear near the suction surface. The velocity gradient within the passage shows a moderate increase, and the overall uniformity of velocity distribution is noticeably reduced compared with Case 1. For Case 3, the velocity distribution uniformity deteriorates significantly under off-design conditions. Under the 0.8Qd condition, a concentrated high-velocity region of 6–7 m/s appears near the blade outlet. Under the 1.2Qd condition, large fluctuations characterized by alternating low- and high-velocity regions are observed among different blade passages.
Fundamentally, from Case 1 to Case 3, the blade outlet angle increases progressively, causing excessive expansion of the flow passage beyond the adaptability range of the fluid. As a result, the coordination of fluid motion within the passage continuously deteriorates, ultimately leading to a gradual degradation of velocity distribution uniformity.
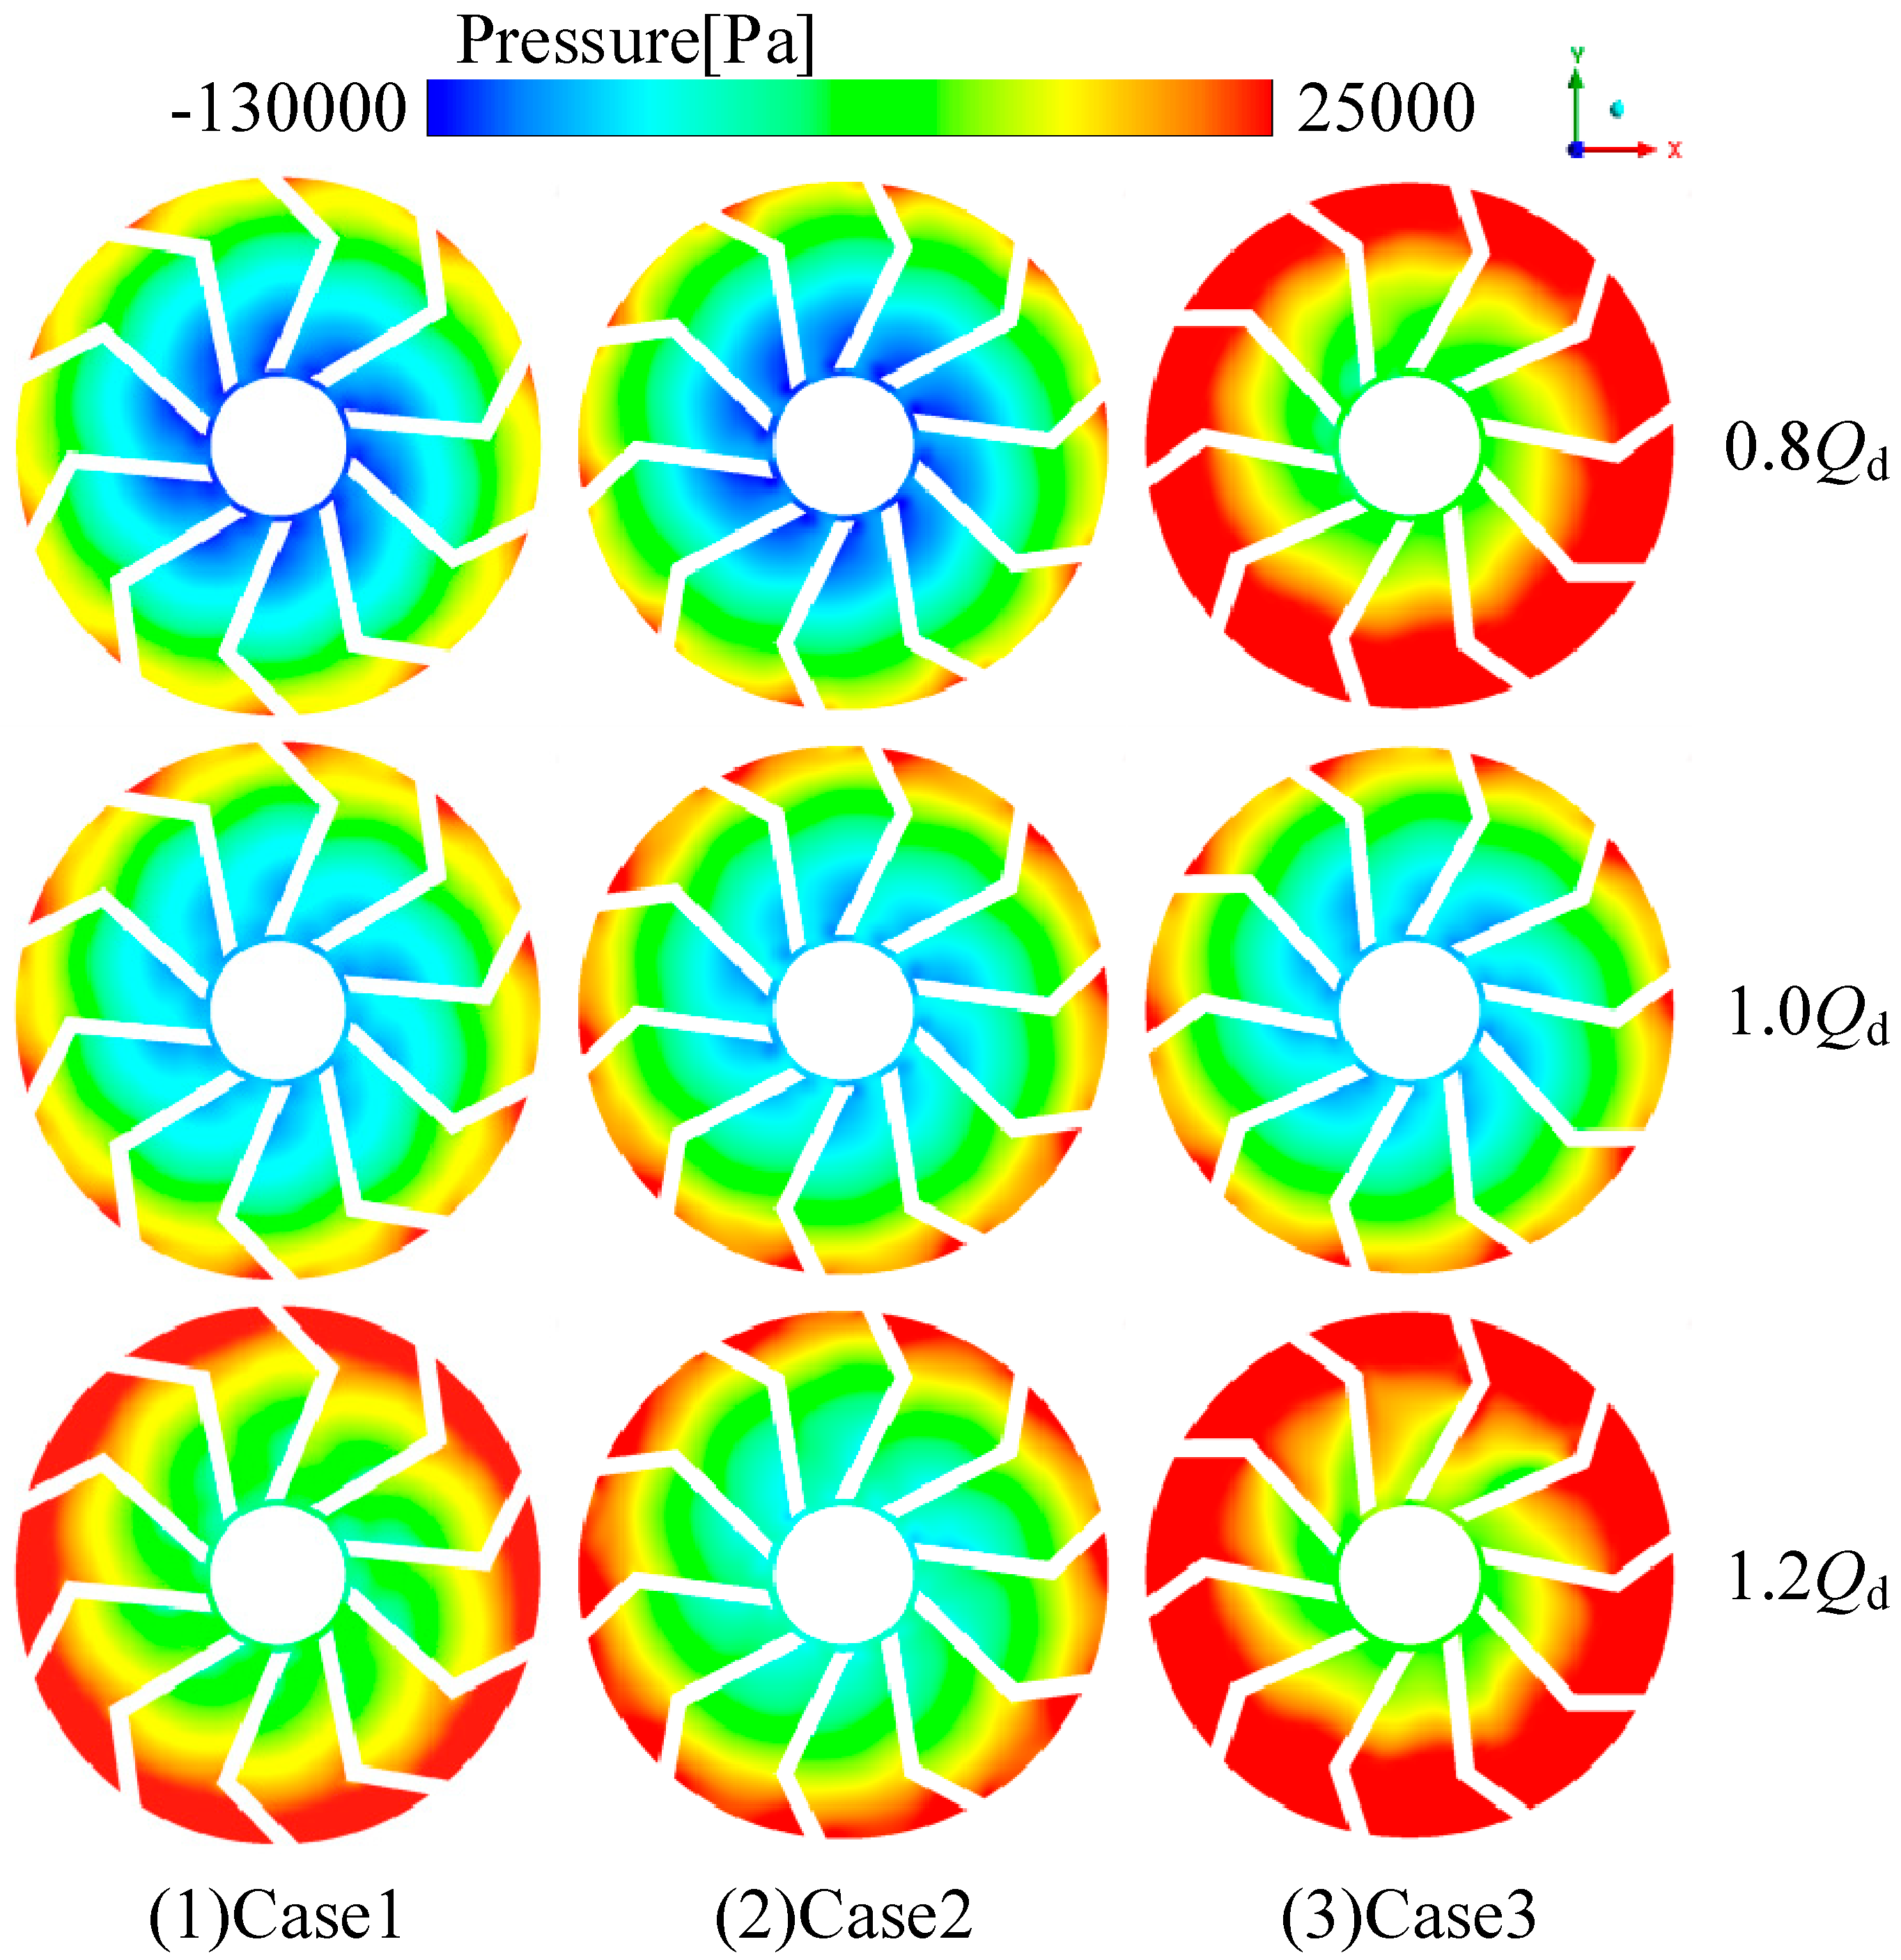
Figure 9 illustrates the pressure contours in the flow passages under different outlet angles and operating conditions. For Case 1, under all operating conditions, the pressure within the passage exhibits a smooth transition from the low-pressure region at the center toward the medium-high-pressure region near the periphery. The pressure difference between the pressure side and suction side of the blade remains below 10,000 Pa, indicating a stable pressure field distribution.
For Case 2, the low-pressure region near the center shrinks, while the medium-high-pressure region near the periphery becomes more pronounced. The pressure gradient increases, and the local pressure difference rises to approximately 15,000 Pa. For Case 3, pressure fluctuations intensify markedly. Under the 0.8Qd condition, the pressure in the peripheral region of the passage rapidly increases to a concentrated high-pressure zone of about 25,000 Pa, and the maximum pressure difference between the pressure side and suction side exceeds 30,000 Pa. Under the 1.2Qd condition, the flow passage is almost entirely occupied by high-pressure regions, and significant pressure distribution differences emerge among different blade passages.
The underlying reason is that, with increasing blade outlet angle from Case 1 to Case 3, the available discharge space for the fluid is increasingly compressed. This leads to local fluid accumulation effects, causing simultaneous increases in pressure gradients and pressure differences.
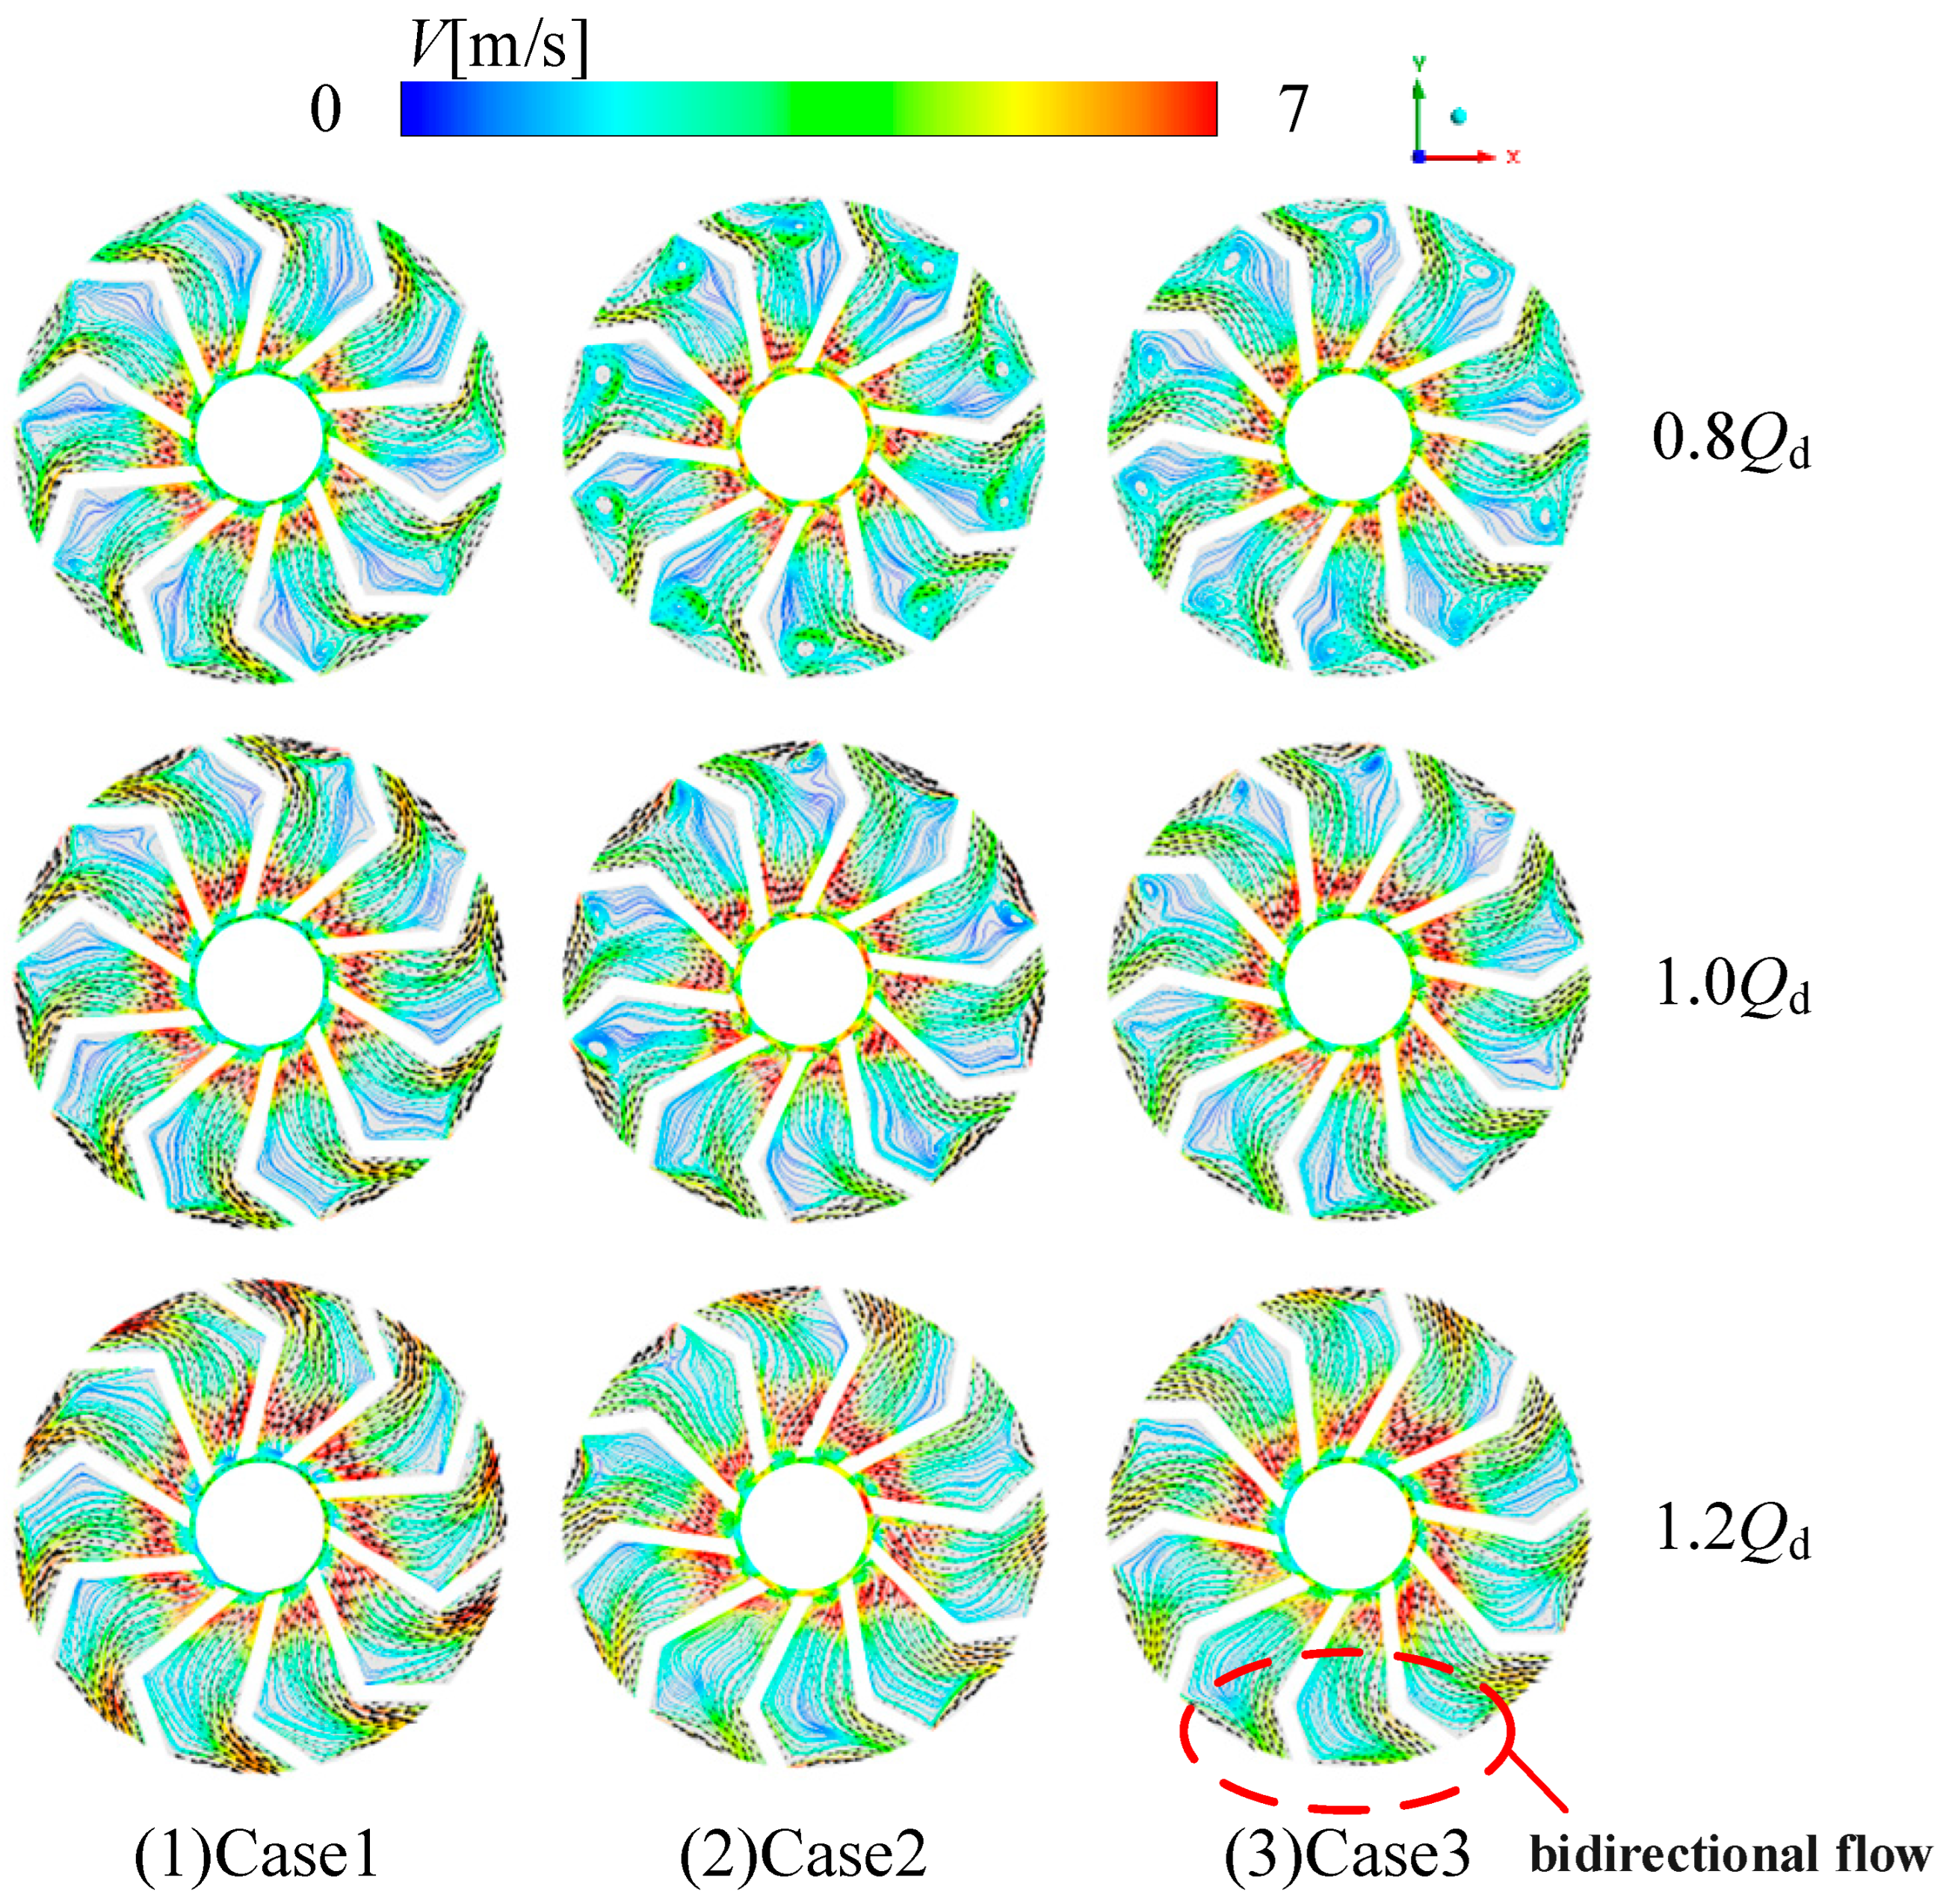
Figure 10 presents the velocity vector distributions under different outlet angles and operating conditions. Velocity vector diagrams provide a clearer visualization of fluid motion trajectories and vortex distribution characteristics within the flow passages. For Case 1, under all operating conditions, velocity vectors extend radially outward along the flow passages with relatively uniform vector density. Only minor directional deviations are observed near the blade tips, and vortex structures are almost entirely suppressed, indicating good flow coherence.
For Case 2, small vortex regions begin to appear on the blade suction surface under 0.8Qd and 1.2Qd conditions, occupying approximately one-fifth of the passage cross-sectional area. The deviation of fluid trajectories increases moderately. For Case 3, vortex regions expand significantly. Under the 0.8Qd condition, vortex regions occupy approximately one-third of the passage cross-section, while under the 1.2Qd condition, vortices directly cover the middle and rear sections of the blade passages. In some regions, bidirectional flow phenomena are even observed, which is caused by the combined effect of excessive flow passage expansion, weakened blade guiding capability, and enhanced interaction between through-flow and circulating flow. This bidirectional flow intensifies energy losses by promoting turbulence fluctuation via shear between forward and reverse flows, inducing flow separation and vortex shedding, and reducing effective flow area to increase frictional loss.
These results indicate that, from Case 1 to Case 3, increasing blade outlet angle weakens the guiding capability of the flow passage. Consequently, under off-design conditions, fluid trajectories deviate increasingly from the ideal path, ultimately inducing flow separation and flow field disorder.
Overall, the blade outlet angle plays a decisive role in regulating pump performance and internal flow characteristics. From the perspective of external characteristics, increasing the outlet angle leads to an overall reduction in head under 0.8Qd and 1.0Qd conditions, with a more pronounced decrease at the small-flow-rate condition of 0.8Qd. In terms of efficiency, under the design condition (1.0Qd), efficiency decreases with increasing outlet angle, while under off-design conditions (0.8Qd and 1.2Qd), pumps with larger outlet angles exhibit poorer efficiency stability and are more prone to significant fluctuations.
From the perspective of internal flow fields, increasing the outlet angle directly deteriorates flow uniformity and stability. For velocity distribution, small outlet angles result in velocity differences within 2 m/s, whereas large outlet angles under off-design conditions lead to concentrated high-velocity regions and pronounced low–high velocity fluctuations. For pressure distribution, small outlet angles produce smooth pressure transitions from central low-pressure regions to peripheral regions, whereas large outlet angles generate higher pressure gradients, pronounced peripheral high-pressure zones, and maximum pressure differences exceeding 30,000 Pa. In terms of vortex characteristics, large outlet angles cause vortices to expand from localized regions to the middle and rear blade passages, inducing flow separation and flow field disorder. Ultimately, increasing the blade outlet angle degrades external pump performance by disrupting flow uniformity and intensifying flow instability.

4.3. Effect of Blade Outlet Angle on Entropy Production

4.3.1. Entropy Production Theory

For investigating energy losses within vortex pumps, entropy production analysis is one of the most effective approaches. Its primary advantage lies in its ability to quantitatively reflect actual energy losses and visualize their spatial distribution. In this study, water is used as the working fluid. Given its relatively high specific heat capacity, temperature variations during pump operation are negligible, allowing the internal flow to be approximated as isothermal. Therefore, entropy production caused by temperature variation is neglected.
Only three types of entropy production are considered: direct dissipation entropy production, turbulent dissipation entropy production, and wall entropy production. The total entropy production is expressed as:
S p r o = S p r o , D ¯ + S p r o , D + S p r o , W
where S p r o is the total entropy production, S p r o , D ¯ is direct dissipation entropy production, S p r o , D is turbulent dissipation entropy production, and S p r o , W is wall entropy production.
The entropy production rate is defined as:
S ˙ p r o = Q ˙ T
where T ˙ is temperature and Q ˙ is the energy dissipation rate.
The calculation methods for direct dissipation entropy production rate and turbulent dissipation entropy production rate are given by Equations (9) and (10), respectively:
S ˙ p r o , D ¯ = 2 μ T u ¯ x 2 + v ¯ y 2 + w ¯ z 2 + μ T v ¯ x + u ¯ y 2 + w ¯ x + u ¯ z 2 + v ¯ z + w ¯ y 2
S ˙ p r o , D = 2 μ T u x 2 + v y 2 + w z 2 + μ T v x + u y 2 + w x + u z 2 + v z + w y 2
where μ is the dynamic viscosity; u ¯   v ¯   w ¯ are the mean velocity components; and u   v   w are the fluctuating velocity components.
Since the SST kω model is adopted, the fluctuating velocity components cannot be directly obtained. Following Kock’s approach, the entropy production rate induced by velocity fluctuations is related to ω yielding:
S ˙ p r o , D = α ρ ω k T
where the constant is 0.09; ω is the specific turbulence dissipation rate; K is turbulent kinetic energy; and ρ is fluid density.
Considering the strong wall effects on entropy production, wall entropy production is also included. The wall entropy production rate is calculated as:
S ˙ p r o , W = τ v T
where τ is wall shear stress and v is near-wall velocity.
S p r o , D ¯ = V S ˙ p r o , D ¯   d V
S p r o , D = V S ˙ p r o , D   d V
S p r o , W = A S ˙ p r o , W   d A
where A is the wall area and V is the volume of the computational domain.

4.3.2. Entropy Production Analysis Under Different Flow Conditions

In vortex pumps, the distribution of entropy production reflects their unique internal flow mechanisms. Entropy production does not only occur inside the impeller but is more prominently manifested in the regenerative region formed by the impeller outer periphery and the pump casing, as this annular area may experience intense interaction between through-flow and circulating flow that forms strong shear layers and turbulence fluctuations to enhance turbulent dissipation entropy production, the annular structure and volute-induced pressure gradient may easily trigger flow separation and large-scale vortices whose rotation and dissipation convert mechanical energy into thermal energy, and the high circumferential velocity of the circulating flow may generate greater wall shear stress compared to the impeller internal passage, increasing wall entropy production.
This region serves as a critical zone for energy transfer and dissipation. As a key design variable, the blade outlet angle directly controls the velocity vector of the discharged fluid and thus governs both the macroscopic flow structure and the microscopic turbulence intensity in this core region. The selection of the blade outlet angle plays a decisive role in determining the overall entropy production level inside the pump. By applying CFD techniques, the transient internal flow fields corresponding to different outlet angles can be accurately reconstructed, the generation and evolution of vortex structures can be clearly captured, and the spatial distributions of entropy production rates can be directly obtained. This approach enables a quantitative diagnosis of the sources and magnitudes of energy losses associated with different design Cases, thereby providing strong theoretical foundations and data support for refined and low-loss impeller and flow-passage design.
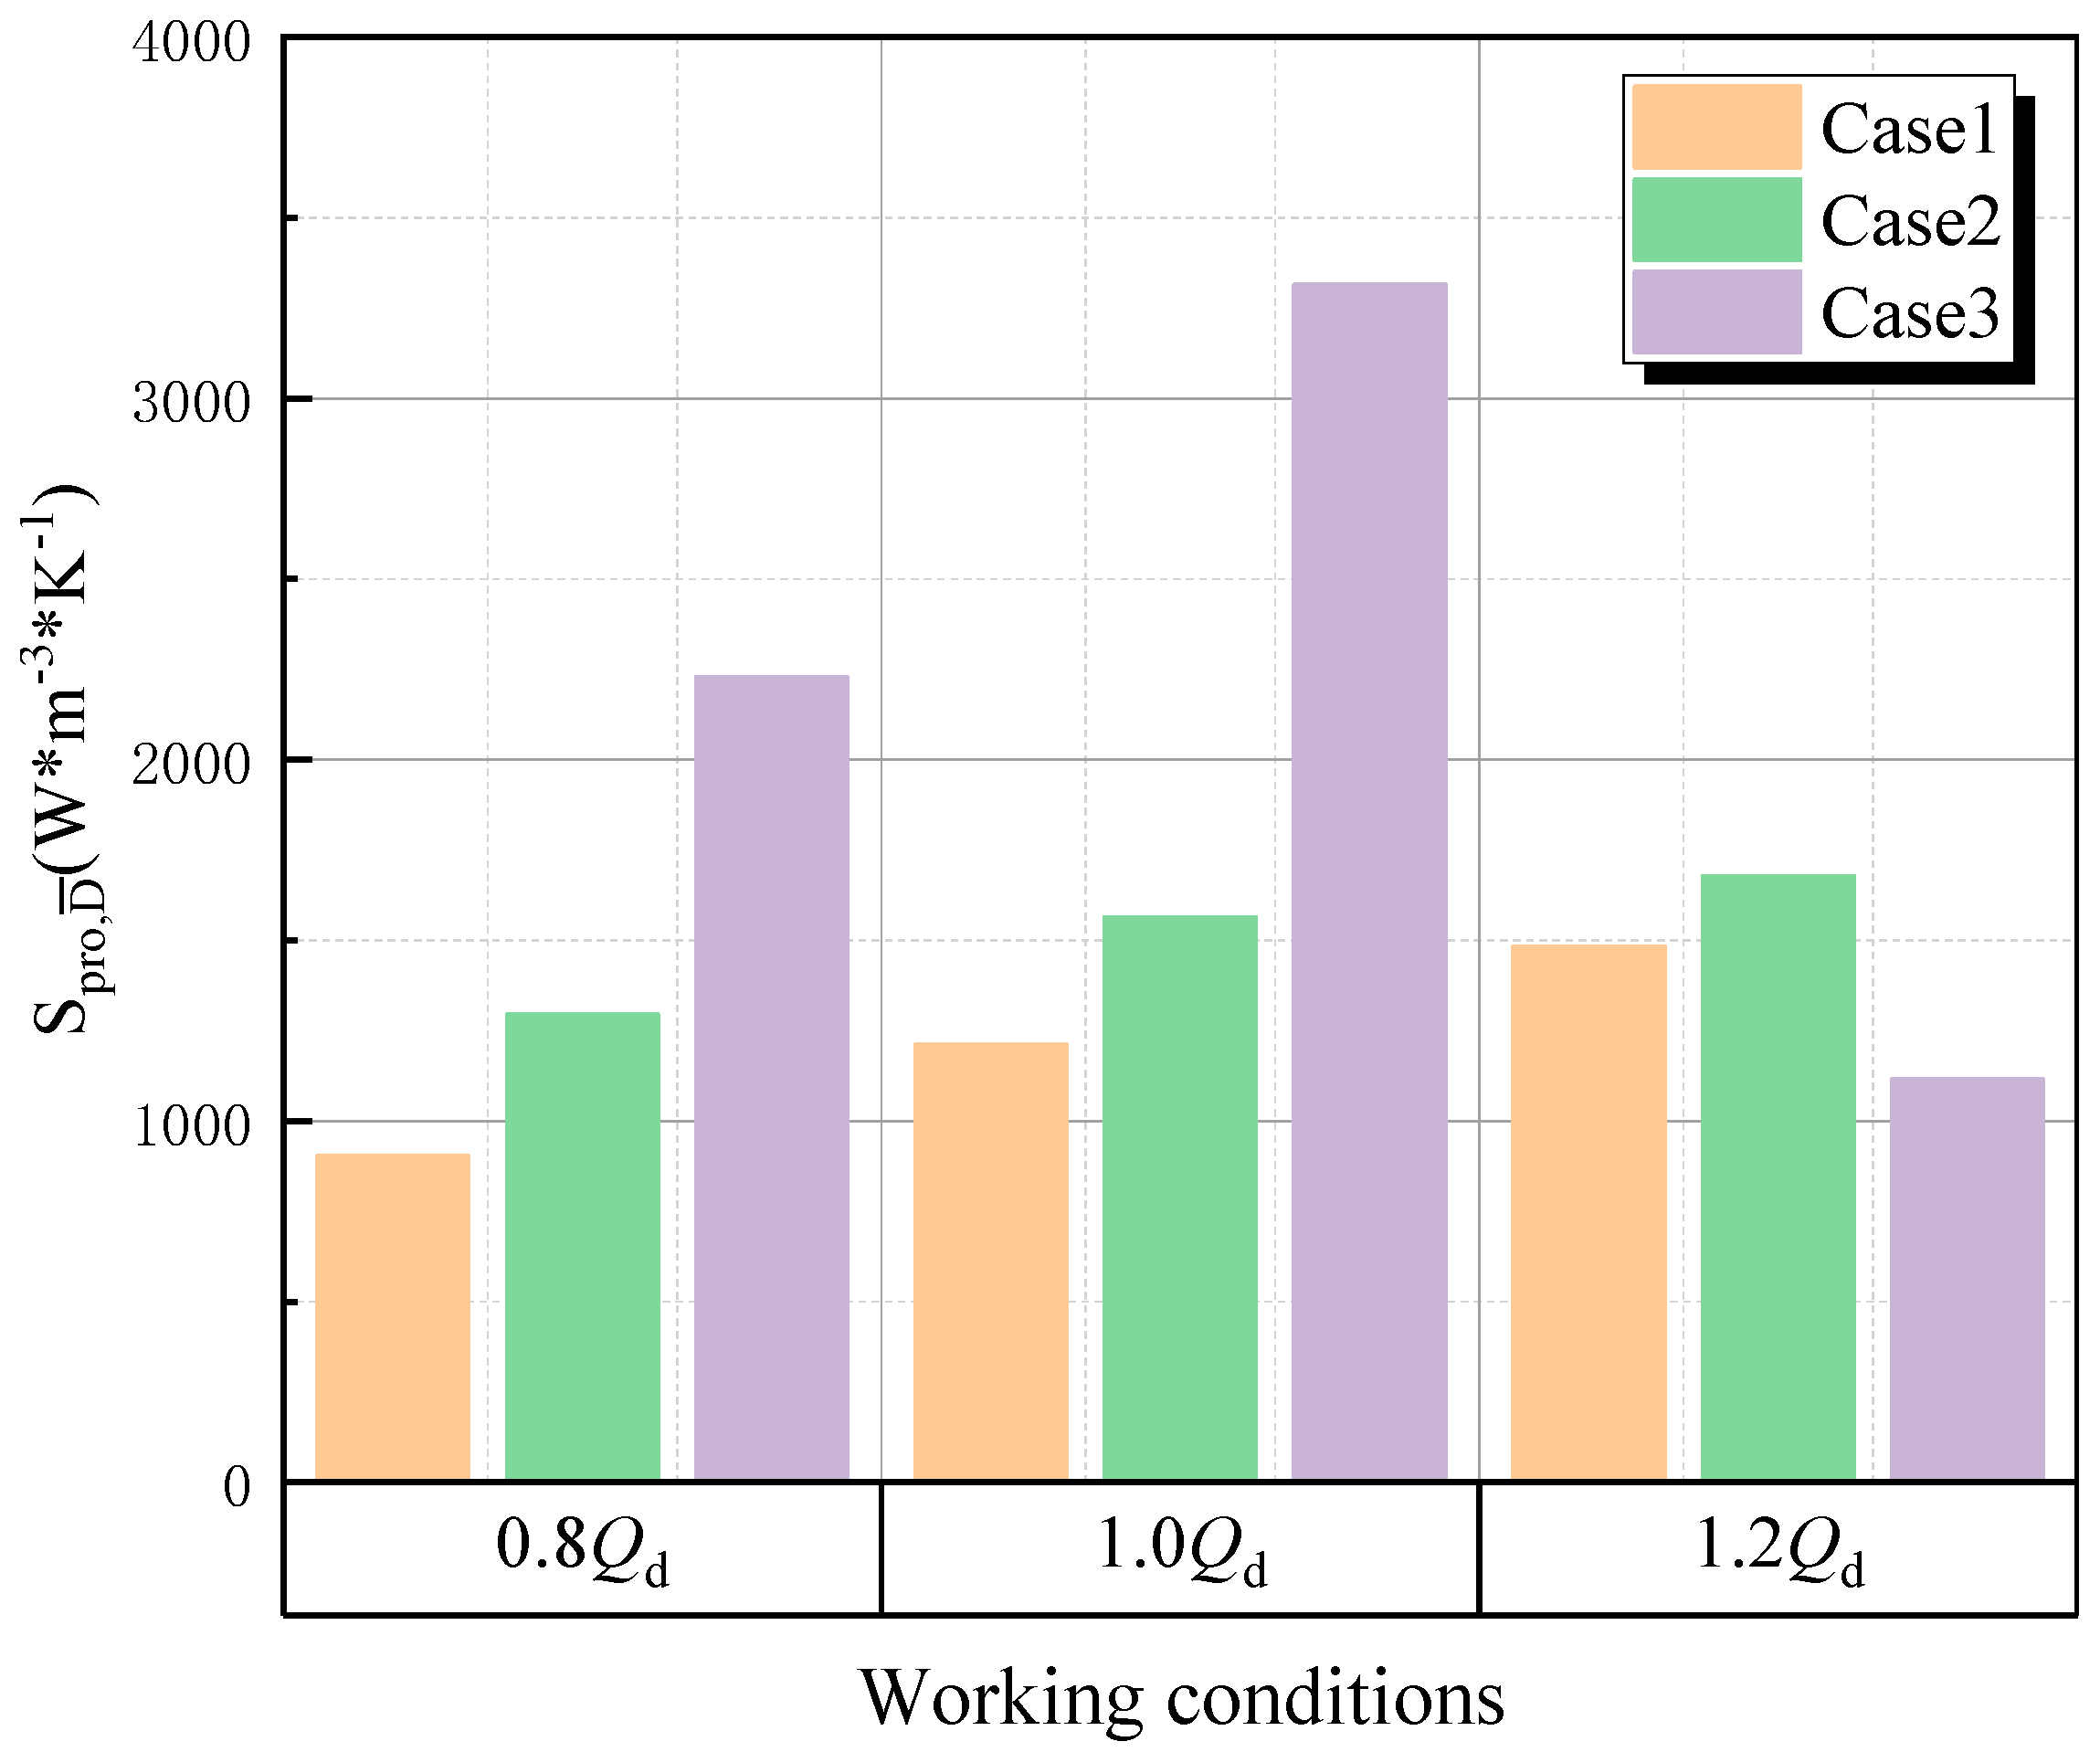
As shown in Figure 11, under the 0.8Qd and 1.0Qd operating conditions, the direct entropy production increases monotonically with increasing blade outlet angle. Under the 1.2Qd condition, however, S p r o , D ¯ exhibits a trend of first increasing and then decreasing, with the value for Case 2 being higher than that for Case 3. From the perspective of operating-condition variation at a fixed outlet angle, S p r o , D ¯ in Case 1 increases gradually as the operating condition changes from 0.8Qd to 1.2Qd, while S p r o , D ¯ in Case 2 shows a continuous and steady increase. In Case 3, S p r o , D ¯ rises sharply from 0.8Qd to 1.0Qd and then decreases slightly from 1.0Qd to 1.2Qd. Overall, under the 0.8Qd and 1.0Qd conditions, S p r o , D ¯ is positively correlated with the blade outlet angle, whereas the 1.2Qd condition represents a special critical point at which S p r o , D ¯ no longer increases once the outlet angle exceeds 60° but instead shows a slight reduction.
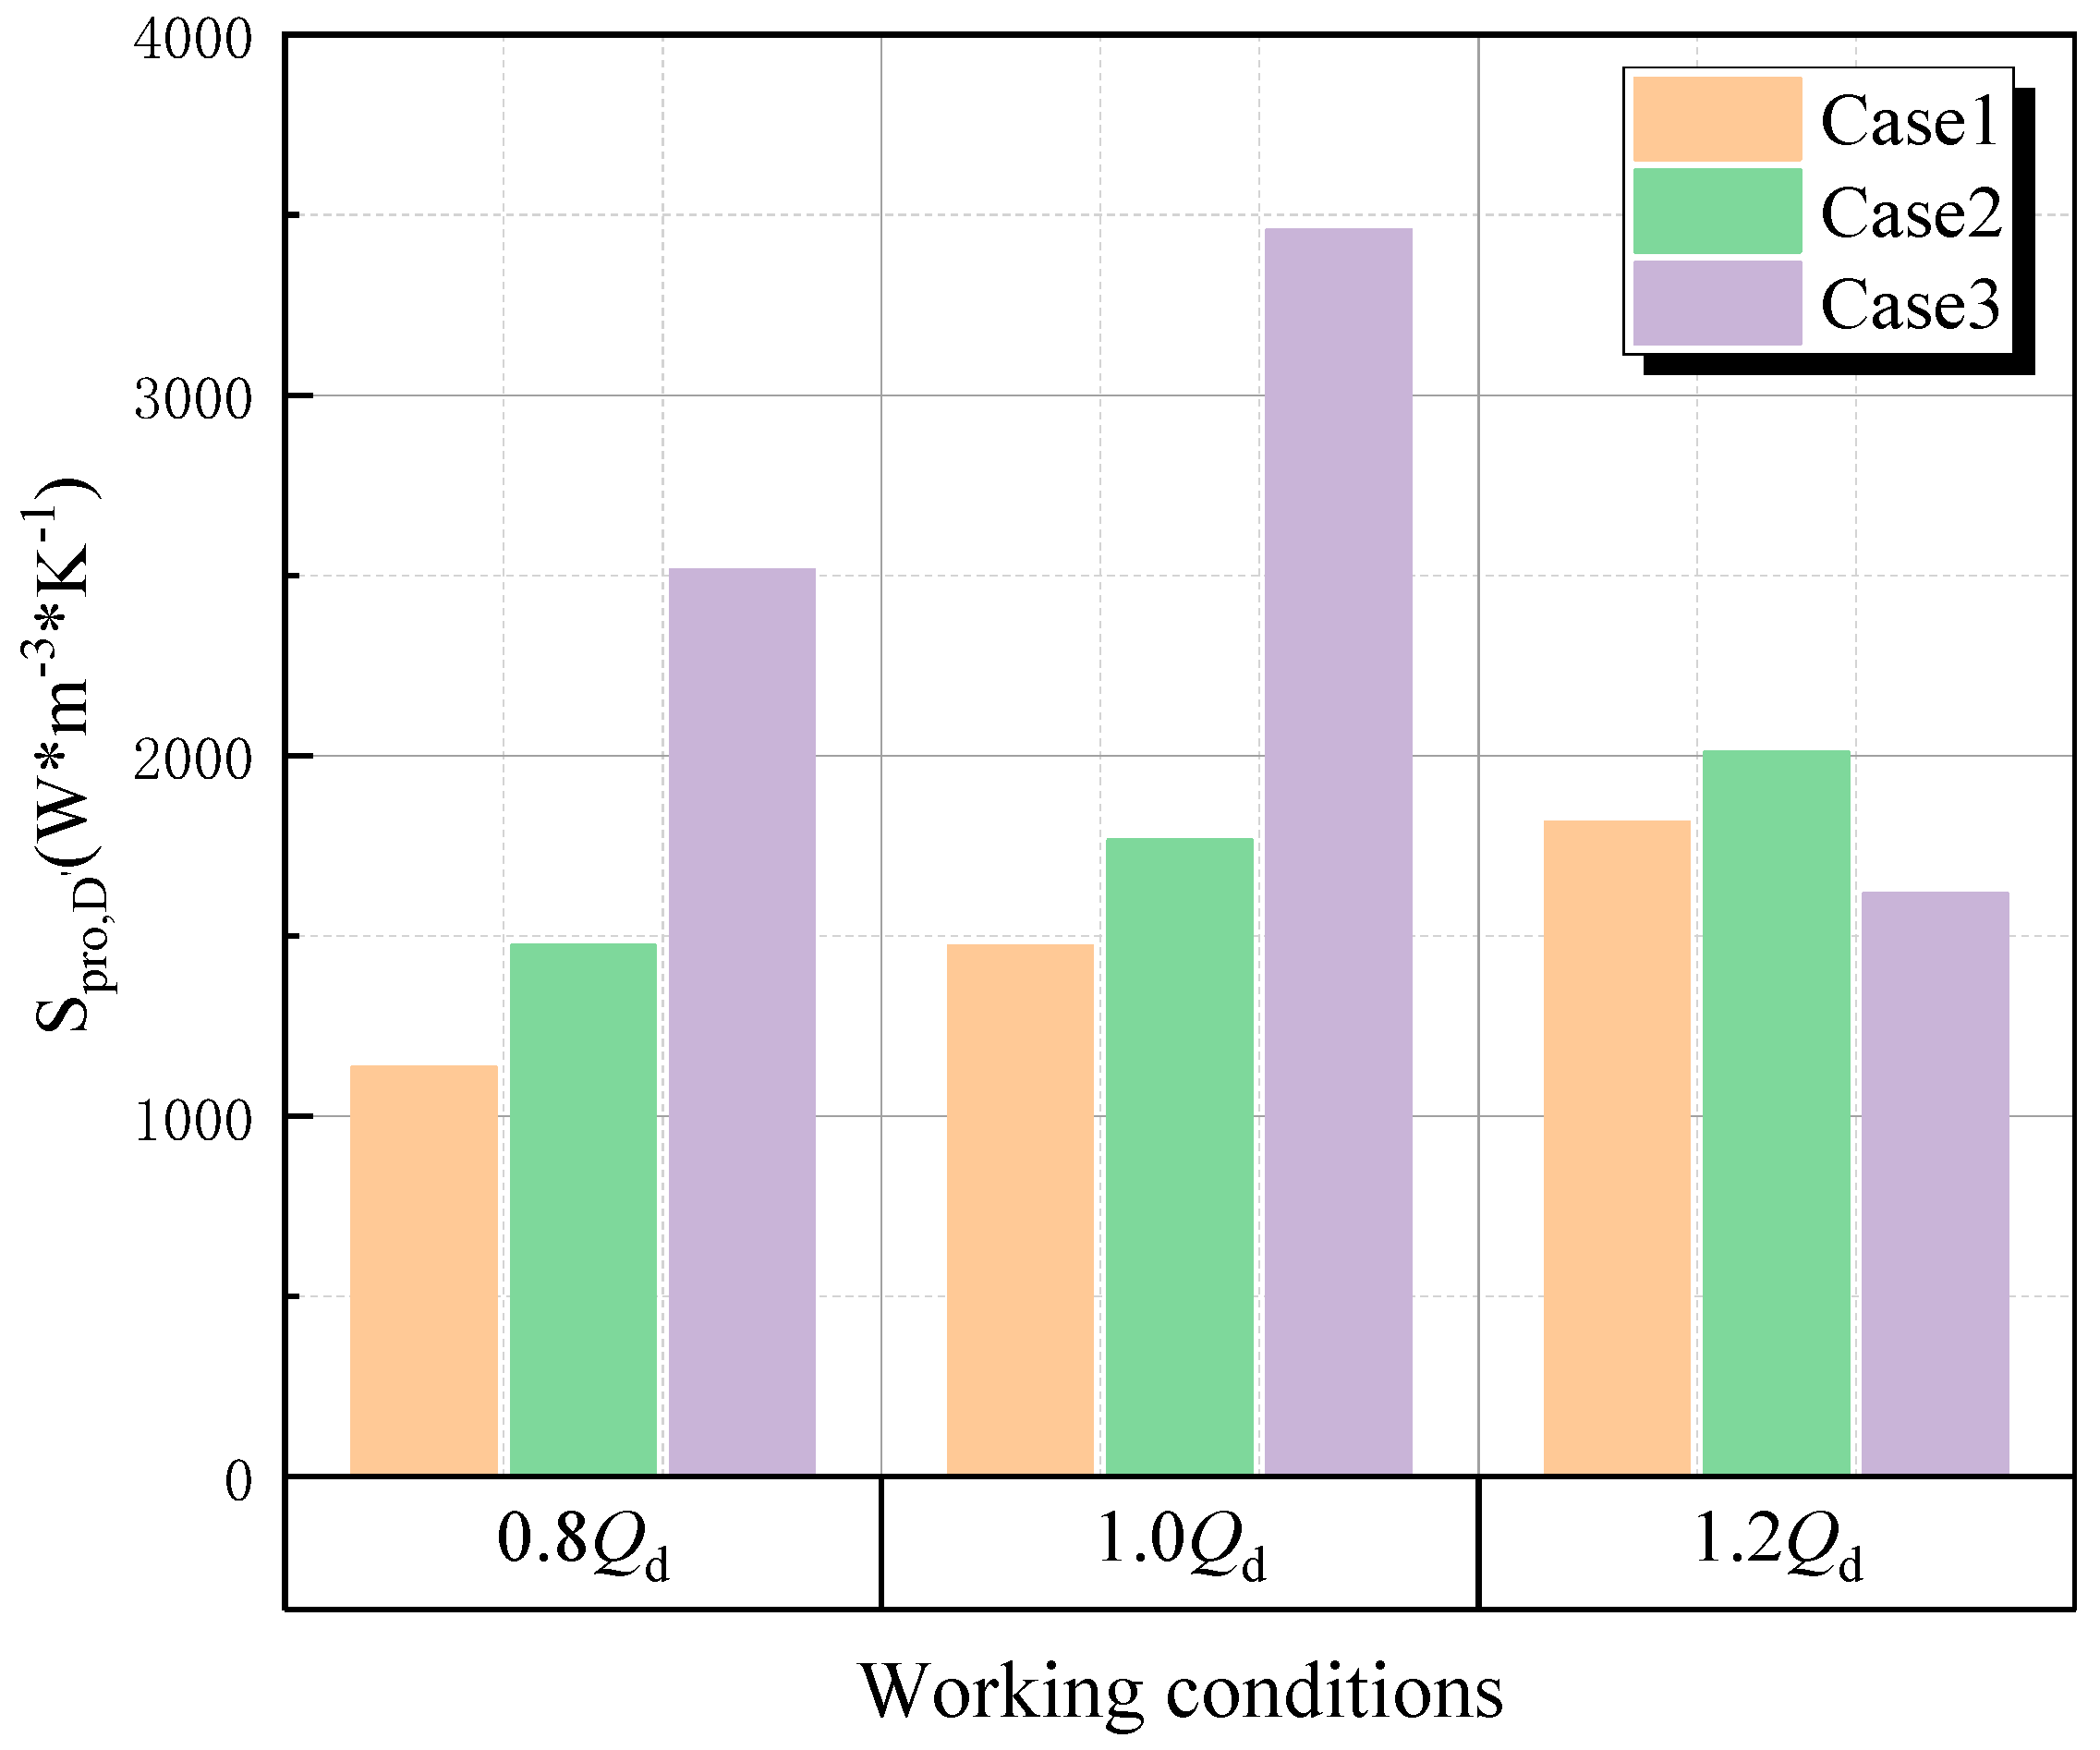
As illustrated in Figure 12, under the 0.8Qd and 1.0Qd operating conditions, the turbulent entropy production increases continuously with increasing blade outlet angle for each operating condition. Under the 1.2Qd condition, however, S p r o , D follows the trend of Case 1 < Case 3 < Case 2, with the value for Case 2 being higher than that for Case 3. From the perspective of operating-condition variation at a fixed outlet angle, S p r o , D in Case 1 increases gradually as the flow rate changes from 0.8Qd to 1.2Qd. In Case 2, S p r o , D increases steadily and reaches its maximum at 1.2Qd. In contrast, S p r o , D in Case 3 rises sharply from 0.8Qd to 1.0Qd and then decreases significantly from 1.0Qd to 1.2Qd. In general, under the 0.8Qd and 1.0Qd conditions, S p r o , D is positively correlated with the blade outlet angle, while the 1.2Qd condition represents a critical operating point beyond which further increases in outlet angle no longer lead to higher turbulent entropy production.
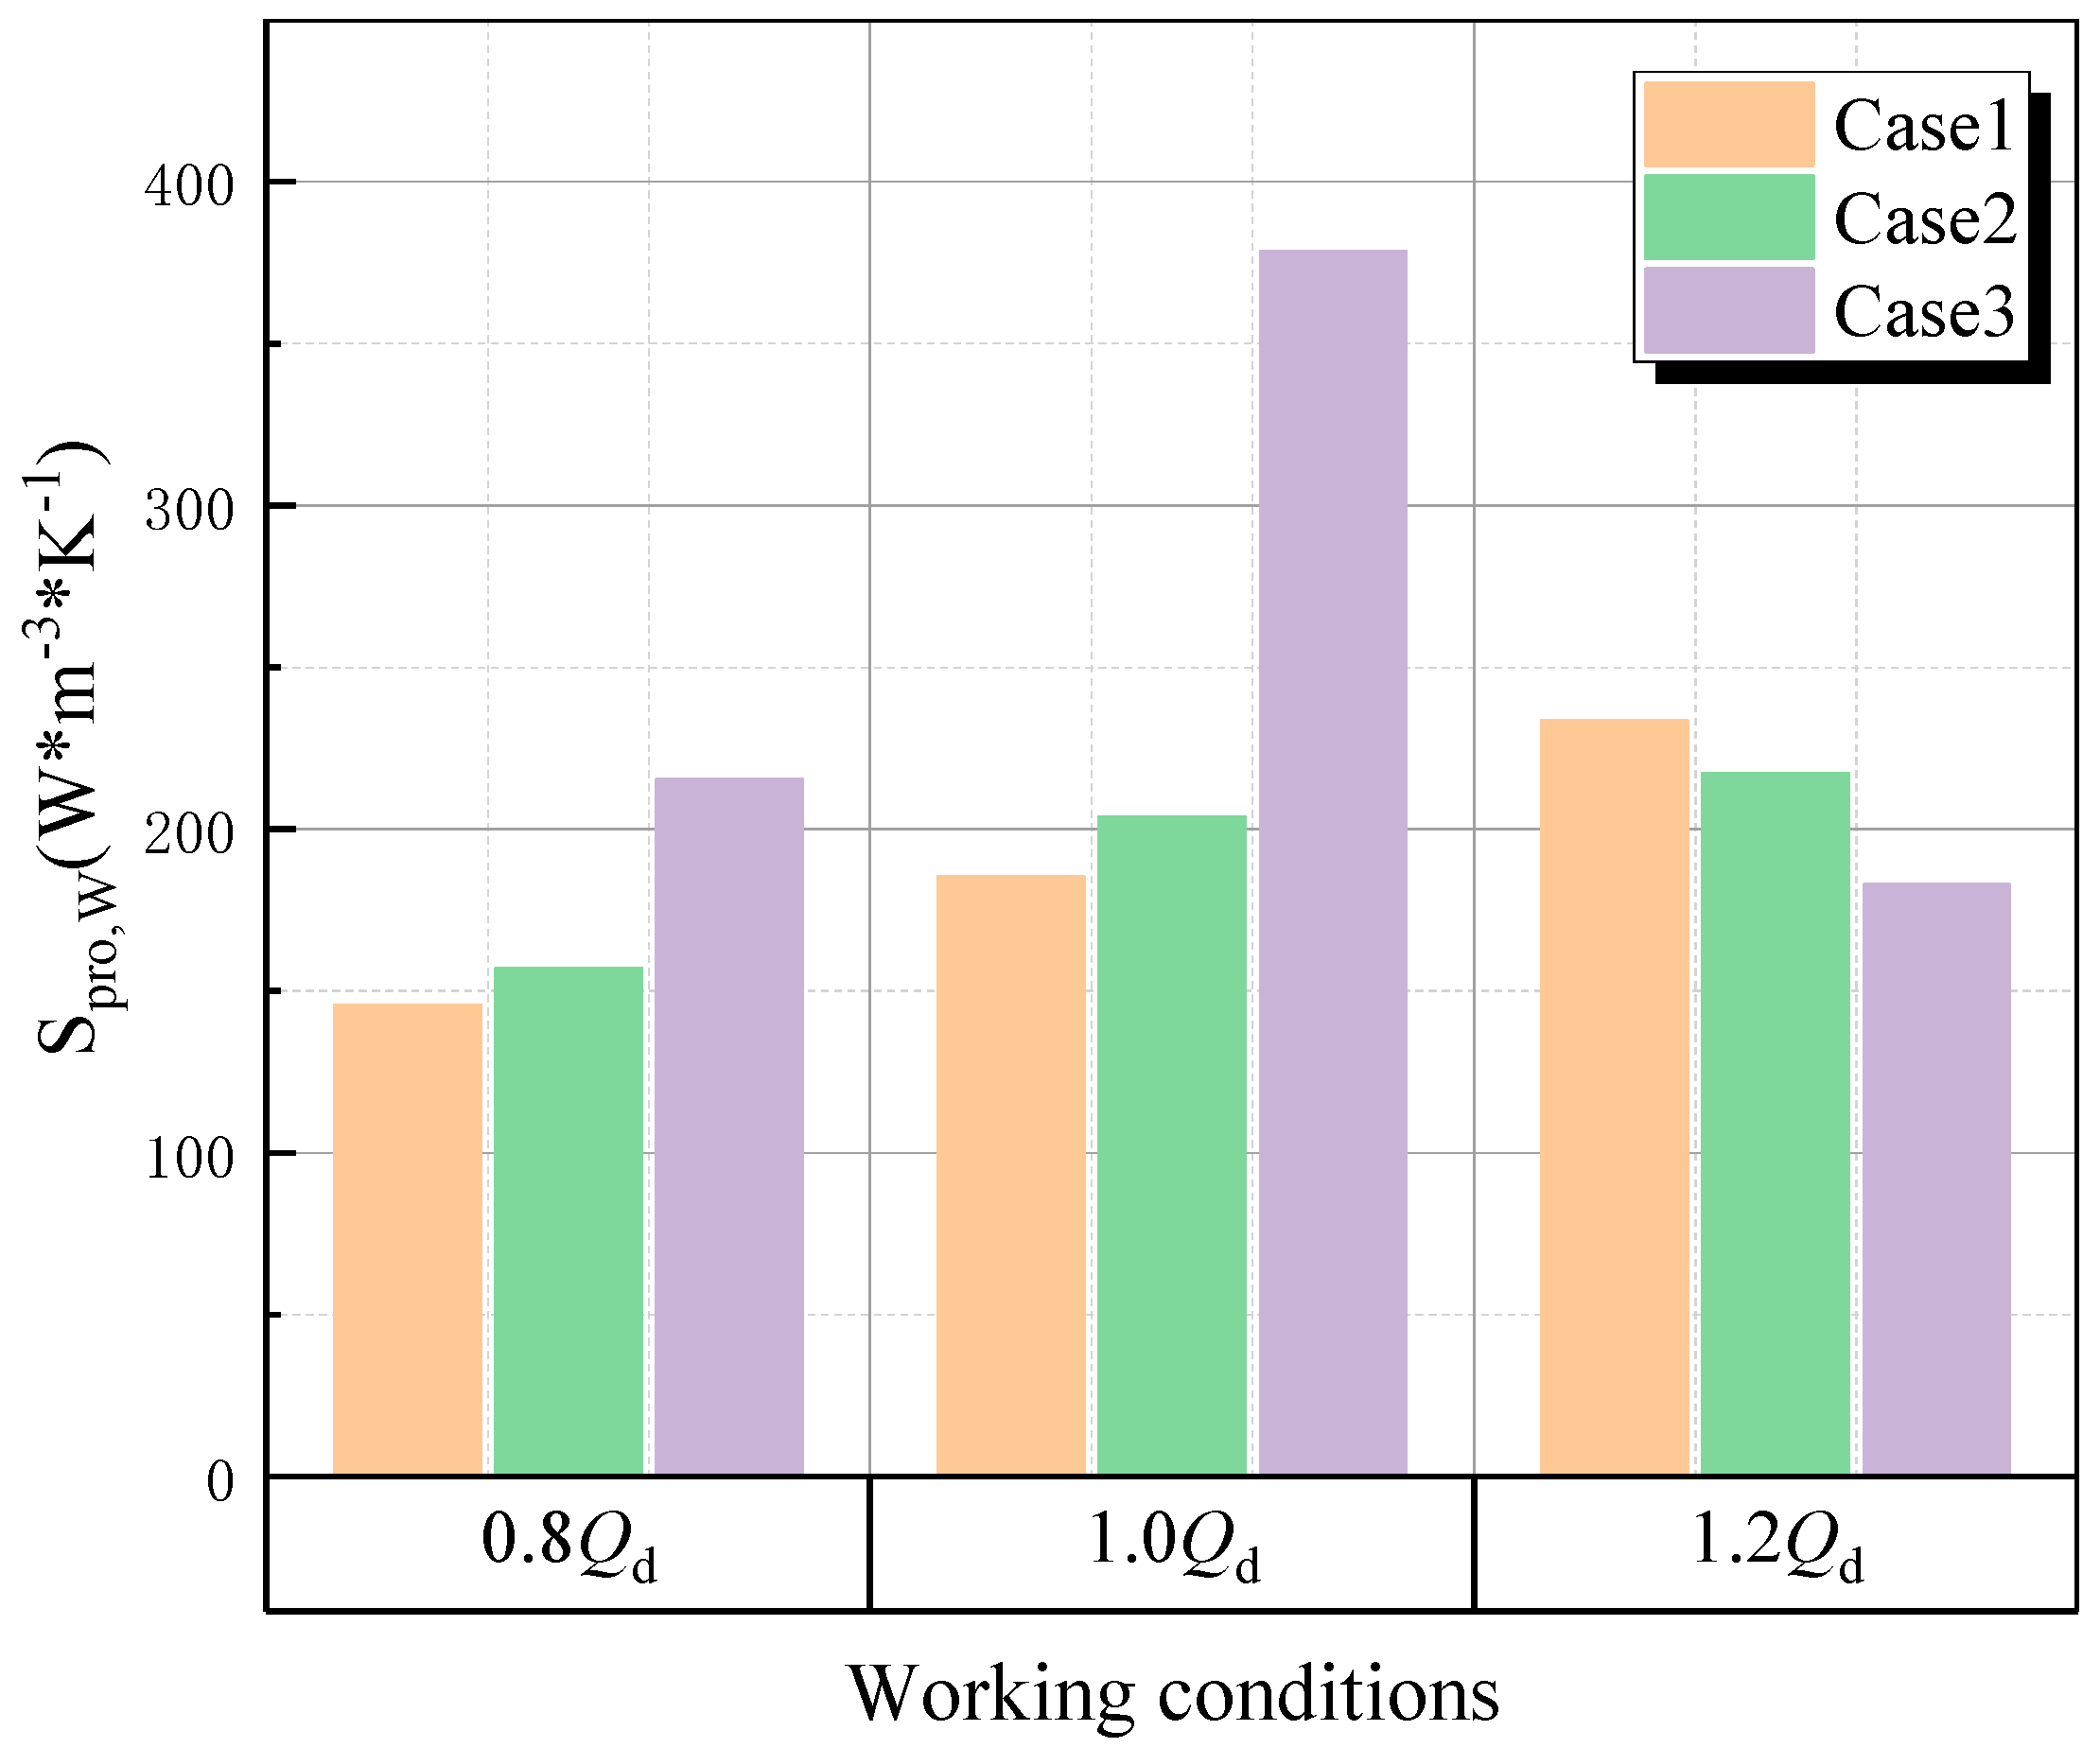
Figure 13 presents the variation characteristics of wall entropy production. Under the 0.8Qd and 1.0Qd operating conditions, S p r o , W increases continuously with increasing blade outlet angle for each operating condition. Under the 1.2Qd condition, however, the trend reverses, following the order Case 3 < Case 2 < Case 1, indicating that the wall entropy production of the largest outlet angle (Case 3) is instead lower than those of Case 1 and Case 2. From the perspective of operating-condition variation at a fixed outlet angle, S p r o , W in Case 1 increases gradually as the operating condition shifts from 0.8Qd to 1.2Qd, while S p r o , W in Case 2 exhibits a steady increase. In Case 3, S p r o , W increases sharply from 0.8Qd to 1.0Qd, reaches its peak, and then decreases markedly from 1.0Qd to 1.2Qd, with a reduction magnitude far exceeding that of the other two cases. Overall, under the 0.8Qd and 1.0Qd conditions, wall entropy production is positively correlated with the blade outlet angle, whereas the 1.2Qd condition represents a clear turning point at which wall entropy production corresponding to large outlet angles decreases significantly.
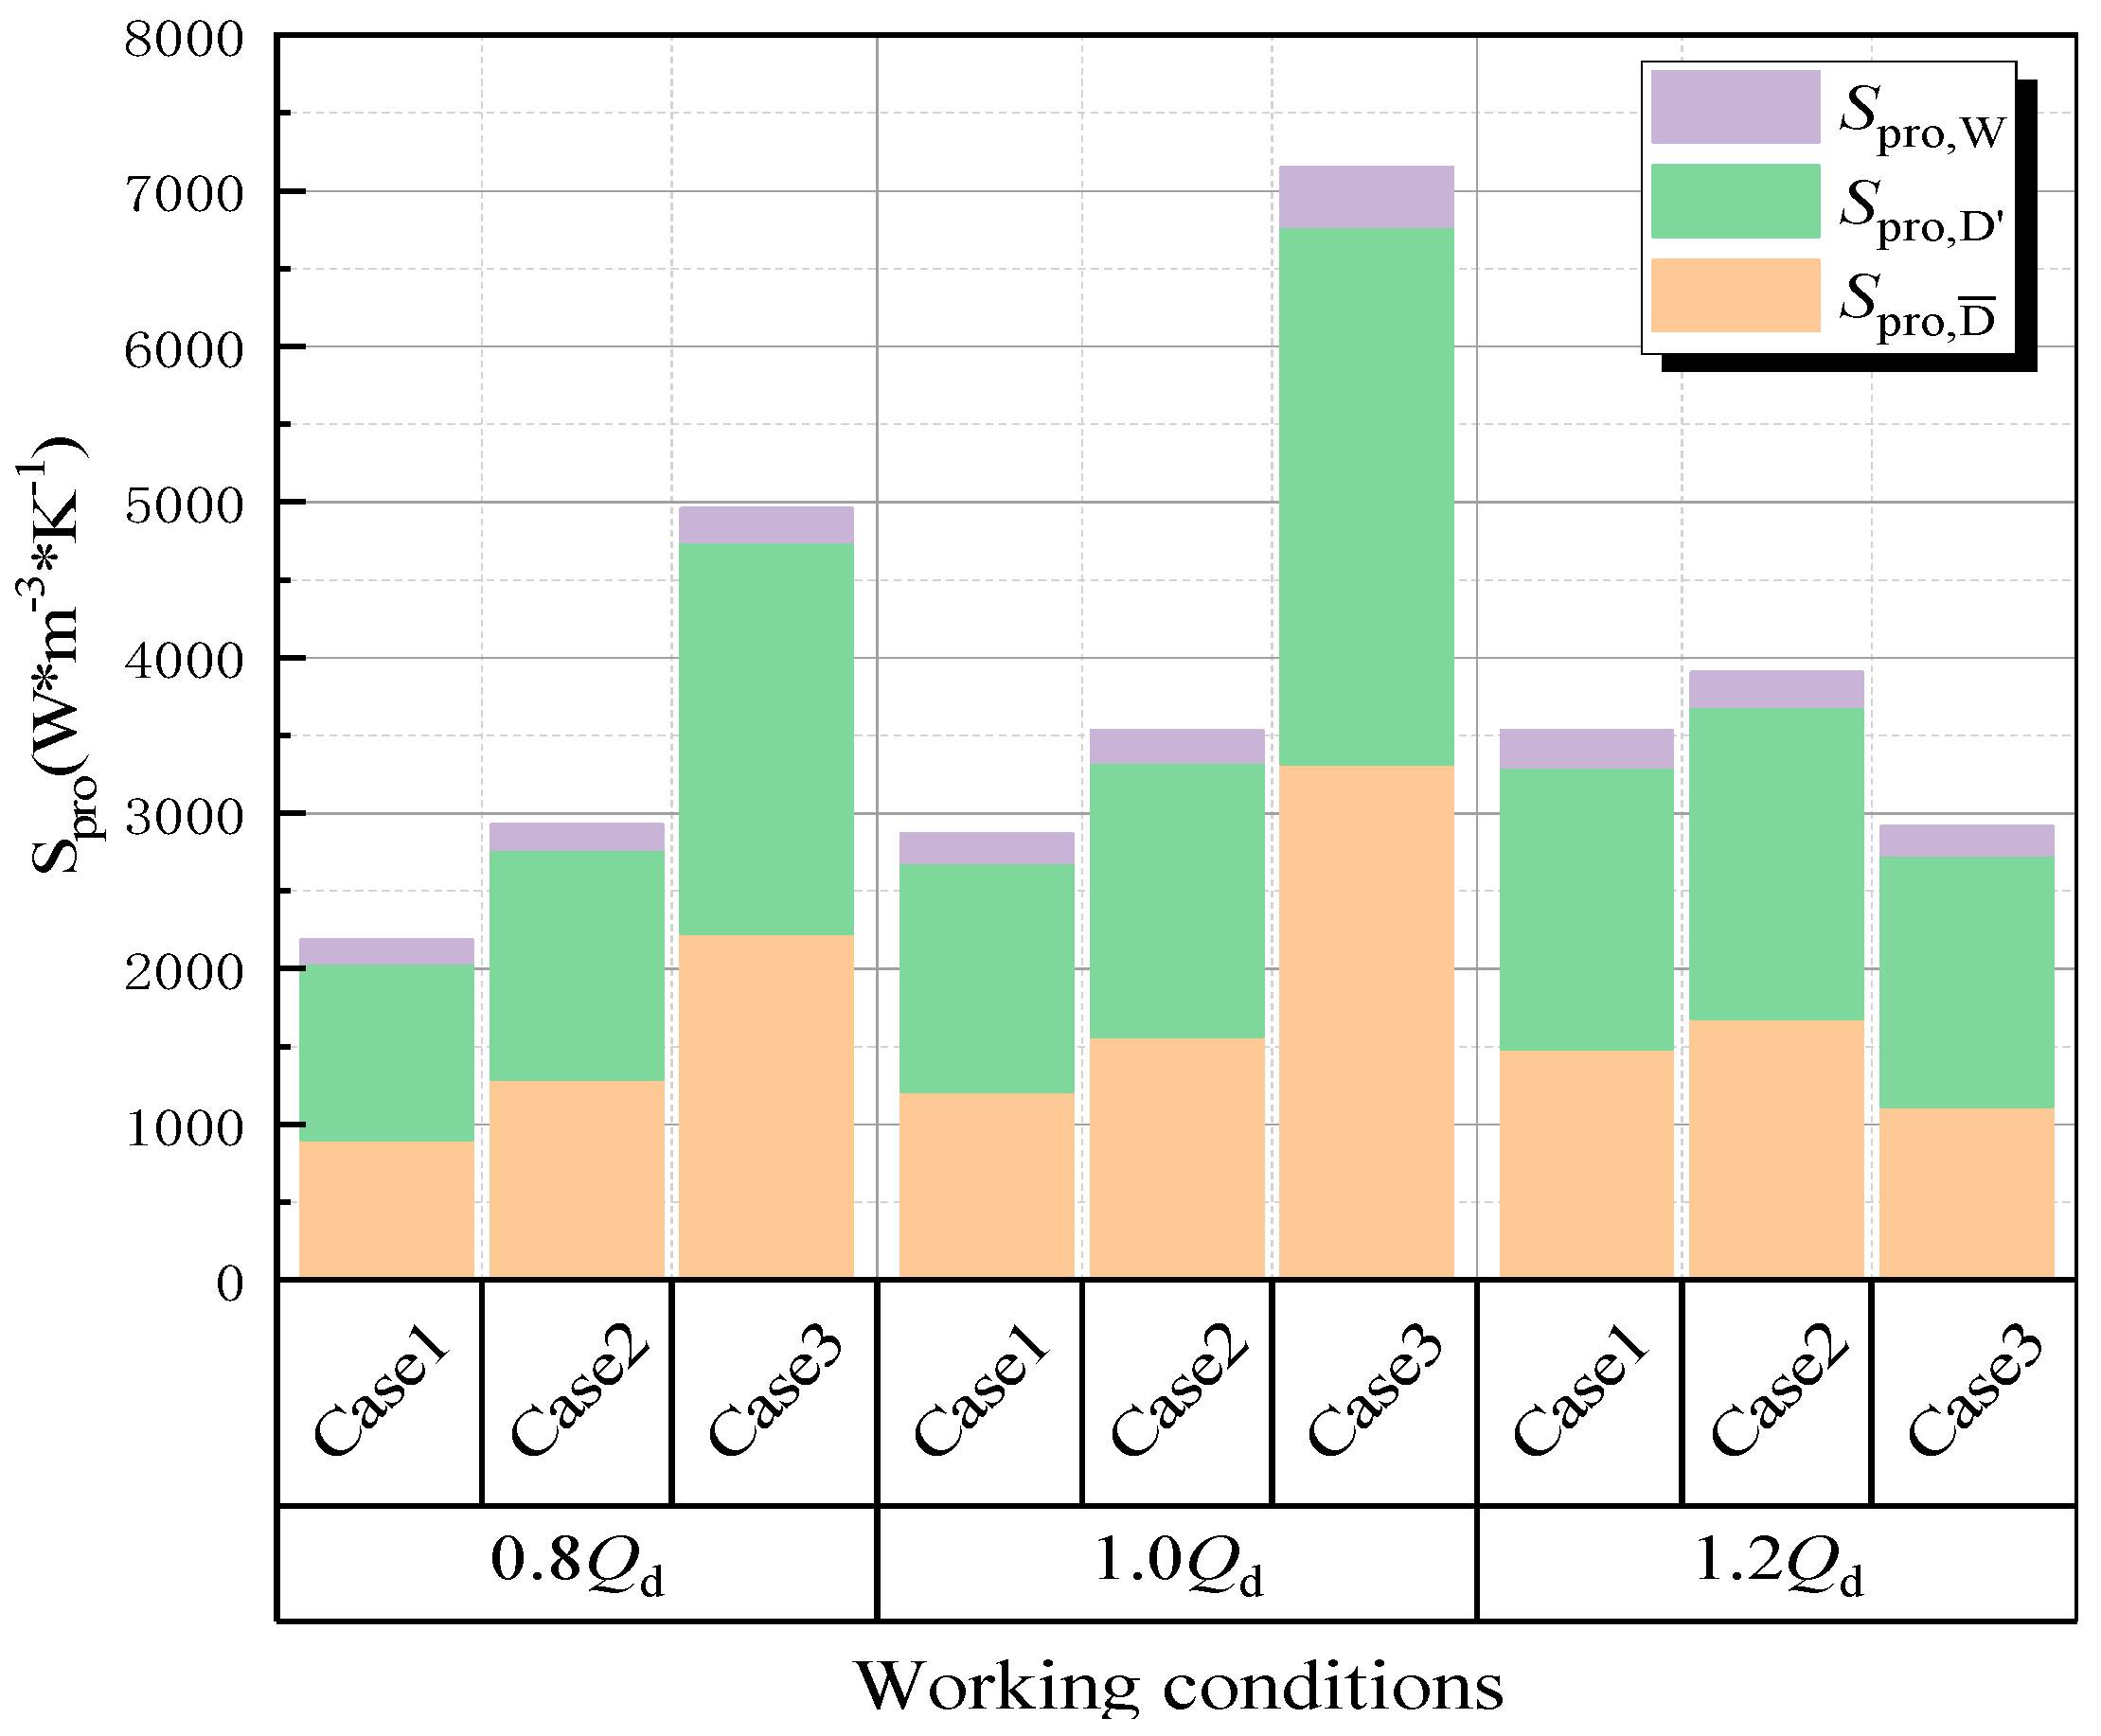
As shown in Figure 14, quantitative analysis of the total entropy production of centrifugal pumps with different outlet angles under the three typical operating conditions of 0.8Qd, 1.0Qd, and 1.2Qd indicates that total entropy production exhibits a pronounced differential response resulting from the coupled effects of outlet angle and operating condition. The interaction between these two factors constitutes one of the core determinants governing the degree of irreversible energy dissipation inside the pump. Under identical operating conditions, the total entropy production increases clearly with increasing impeller outlet angle. This trend is particularly evident under the design condition, where the total entropy production of Case 3 is significantly higher than that of Case 1, directly reflecting that large outlet-angle flow passages are more prone to inducing flow-field distortion and flow separation, thereby intensifying irreversible losses and leading to a substantial increase in energy dissipation.
For centrifugal pumps with a fixed outlet angle, when the operating condition deviates from the design point, the variation in total entropy production exhibits distinct angle-dependent characteristics. Pumps with small outlet angles show only a slight increase in total entropy production under off-design conditions, indicating stronger flow stability and adaptability. In contrast, pumps with large outlet angles experience a pronounced increase in total entropy production under both 0.8Qd and 1.2Qd conditions, demonstrating a higher sensitivity of the internal flow field to operating-condition deviation, as well as more severe degradation in operational stability and energy utilization efficiency.
From the perspective of entropy production composition, the relative contributions of different entropy components vary significantly with outlet angle and operating condition. Under the design condition, the proportion of turbulent entropy production in pumps with large outlet angles increases markedly and becomes the dominant source of energy loss. This mechanism can be attributed to the enhanced turbulence fluctuation intensity and increased spatiotemporal disorder of the flow induced by large outlet angles, which ultimately leads to a substantial increase in irreversible energy dissipation.
Overall, the design operating condition represents the most sensitive regime in terms of total entropy production with respect to outlet-angle variation, where even small changes in the outlet-angle parameter can result in significant fluctuations in energy dissipation. Pumps with small outlet angles not only maintain lower total entropy production levels over the entire operating range but also exhibit smaller entropy-production fluctuations, thereby offering more pronounced engineering advantages in controlling energy losses under variable operating conditions.
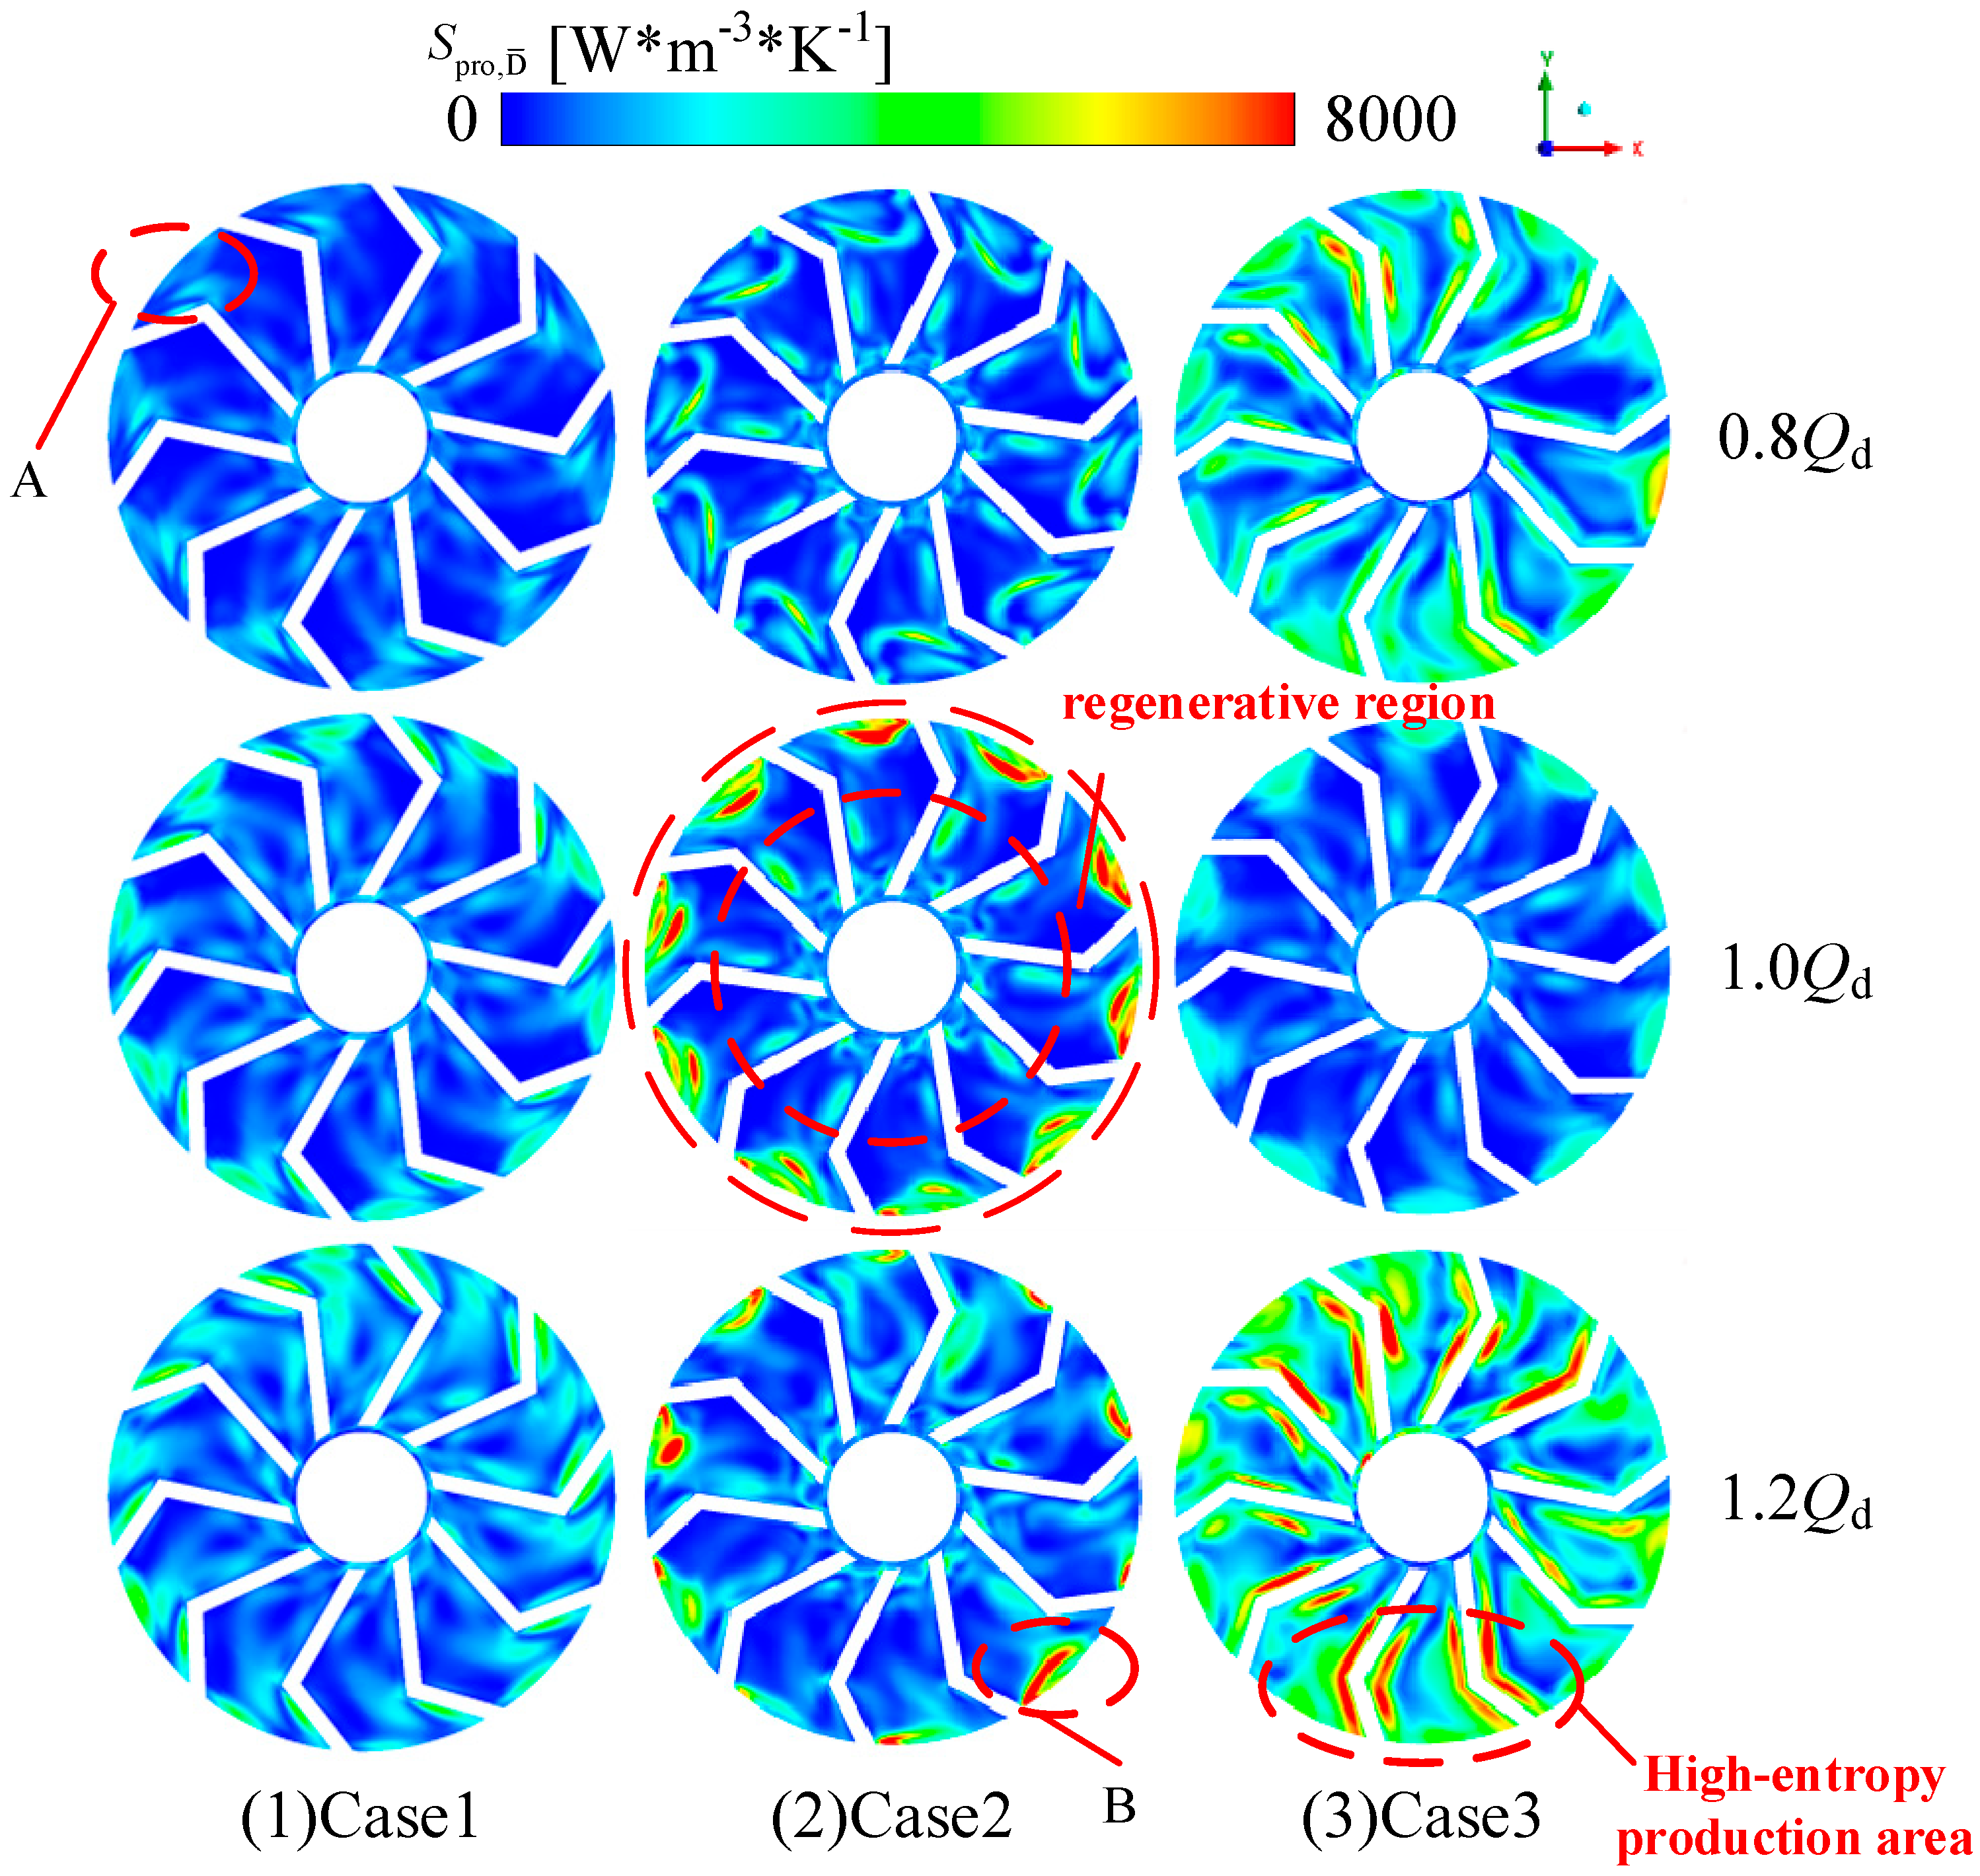
Figure 15 illustrates the distribution and variation characteristics of direct entropy production in centrifugal pumps under different operating conditions and blade outlet angles. Combined with the quantitative distributions of direct entropy production contours, it can be observed that the influence of the three outlet angles on direct entropy production exhibits a clear gradient differentiation. The coupled effects of outlet angle and operating condition directly determine the spatial distribution patterns and intensity levels of direct entropy production.
For the small outlet-angle pump, high direct-entropy-production regions are confined to sporadic localized patches on the blade surfaces across all operating conditions, while the main flow passage remains dominated by low entropy production. Even when the operating condition deviates from the design point, both the spatial extent and intensity of direct entropy production change only slightly, indicating that the flow structure of small outlet-angle passages is less disturbed by operating-condition variations and that the associated energy losses remain relatively stable across the full operating range. The medium outlet-angle pump exhibits transitional characteristics: under the design condition, high entropy production regions begin to expand along the blade surfaces, and the proportion of medium-loss regions increases. When the operating condition deviates from the design point, high-value regions further extend toward the blade midsection, accompanied by increases in both loss coverage and entropy-production intensity, indicating a higher sensitivity to operating-condition variation compared with the small outlet-angle configuration. The large outlet-angle pump shows the most severe direct entropy production among the three configurations. Under all operating conditions, it exhibits the widest high-entropy-production coverage, and when the operating condition deviates from the design point, both the coverage and intensity of high-loss regions within the blade passages increase substantially. Local peak values approach 8000 W·m−3·K−1, which is mainly due to the significant deterioration of flow uniformity under off-design conditions: the mismatch between flow rate and passage structure induces intense flow separation, sharp velocity gradients, and enhanced viscous shear, all of which intensify direct dissipation entropy production. For large outlet-angle passages, the inherent expansion of the flow channel further amplifies this flow inhomogeneity under off-design conditions, leading to more pronounced direct entropy production peaks.
Overall, the spatial extent, loss intensity, and operating-condition adaptability of direct entropy production are strongly correlated with blade outlet angle. Larger outlet angles result in wider high-entropy-production regions, higher local loss intensities, and poorer adaptability to operating-condition variation, whereas small outlet-angle pumps maintain low direct entropy production over the entire operating range and exhibit superior energy-loss control performance under variable operating conditions.
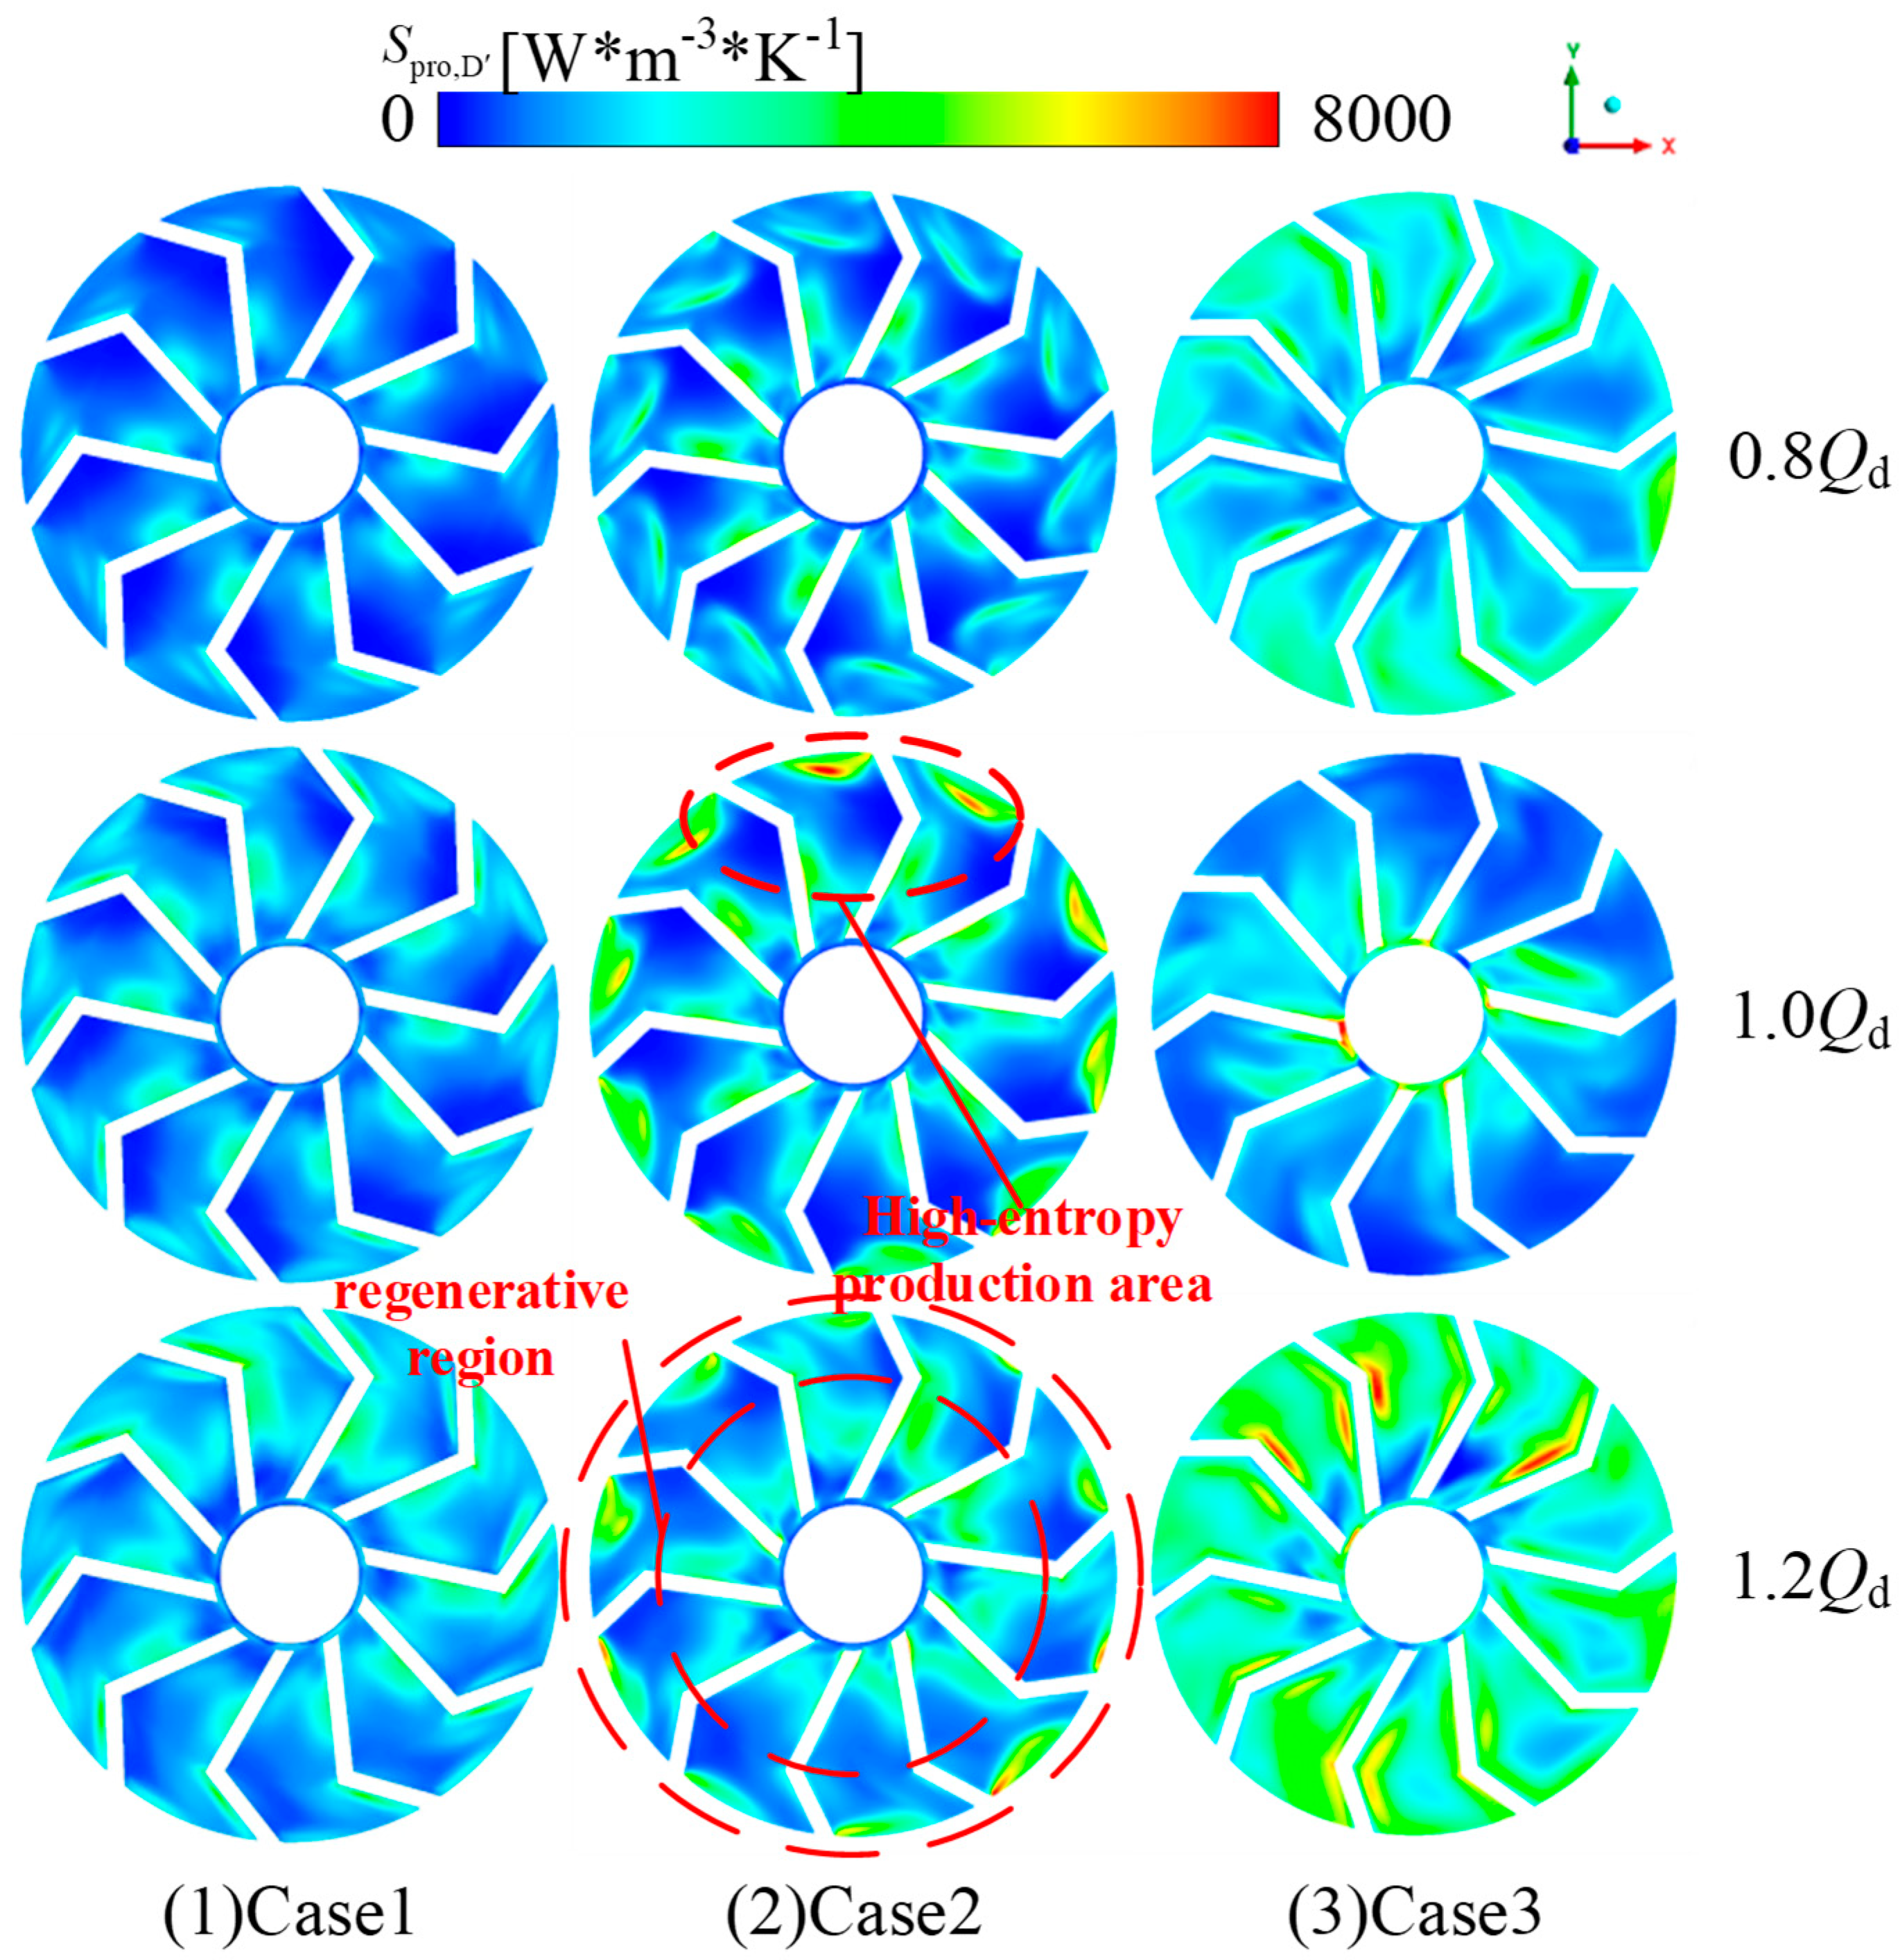
As shown in Figure 16, based on the quantitative distributions of turbulent entropy production contours, the turbulent entropy production of centrifugal pumps with different outlet angles exhibits a pronounced positive correlation with outlet angle, whereby increasing the outlet angle directly promotes higher levels of irreversible turbulent energy dissipation. For the small outlet-angle pump, turbulent entropy production remains dominated by low-loss regions under all operating conditions, with only limited weak transitional loss regions appearing near blade edges. Even when the operating condition deviates from the design point, both the spatial extent and intensity of turbulent entropy production remain almost unchanged, indicating that the flow state in small outlet-angle passages is closer to being orderly, with turbulence fluctuations effectively suppressed and turbulent energy losses maintained at low levels across the entire operating range.
The medium outlet-angle pump exhibits transitional behavior in turbulent entropy production. Under the design condition, moderate-intensity high-entropy-production regions already appear within the blade passages. When the operating condition deviates from the design point, the coverage of these regions increases slightly, but the increase in loss intensity remains limited, and the overall turbulent energy dissipation is still significantly lower than that of the large outlet-angle configuration. This indicates that the medium outlet-angle passage provides an intermediate level of constraint on turbulence fluctuations between small and large outlet-angle designs.
The large outlet-angle pump exhibits the most pronounced turbulent entropy production among the three configurations. Under the design condition, distinct high-entropy-production regions are already present within the blade passages. When the operating condition deviates from the design point, these regions expand further and the loss intensity increases significantly, with local peak turbulent entropy production values far exceeding those of the small and medium outlet-angle cases. This phenomenon indicates that the flow structure of large outlet-angle passages is extremely sensitive to operating-condition variation, and that deviations from the design point directly intensify turbulence fluctuations and lead to a substantial increase in irreversible energy dissipation.
In summary, the spatial coverage, loss intensity, and operating-condition adaptability of turbulent entropy production are all strongly dependent on blade outlet angle. Larger outlet angles result in broader high-entropy-production regions, higher local turbulent losses, and poorer adaptability to operating-condition variation, whereas small outlet-angle pumps maintain low turbulent entropy production levels across the entire operating range and demonstrate superior suppression of turbulence fluctuations, offering clear advantages in controlling turbulent energy losses under variable operating conditions.

4.4. Effect of Blade Outlet Angle on Rigid-Body Vorticity

4.4.1. Vortex Identification Theory

Vortices are fundamental flow structures that exert a decisive influence on the performance of fluid machinery. A prerequisite for understanding vortex evolution mechanisms is accurate identification and characterization of vortex structures. Vorticity is a key physical quantity describing rotational motion and plays a central role in vortex dynamics [41,47,48,49].
In the work of Liu et al. [47], the rotational component of vorticity was further developed into the Liutex vector. The Liutex vector provides a mathematical representation of rigid-body rotation within fluid motion. Specifically, its direction is determined by the real eigenvector of the velocity gradient tensor, while its magnitude corresponds to the angular velocity of rigid-body rotation of the fluid element about that direction. The explicit formulation is given as:
R = ( ω r ) ( ω r ) 2 4 λ c i 2
where r is the real eigenvector of v ; λ c i is the imaginary part of the complex conjugate eigenvalue of v .

4.4.2. Vortex Analysis in the Impeller Flow Domain

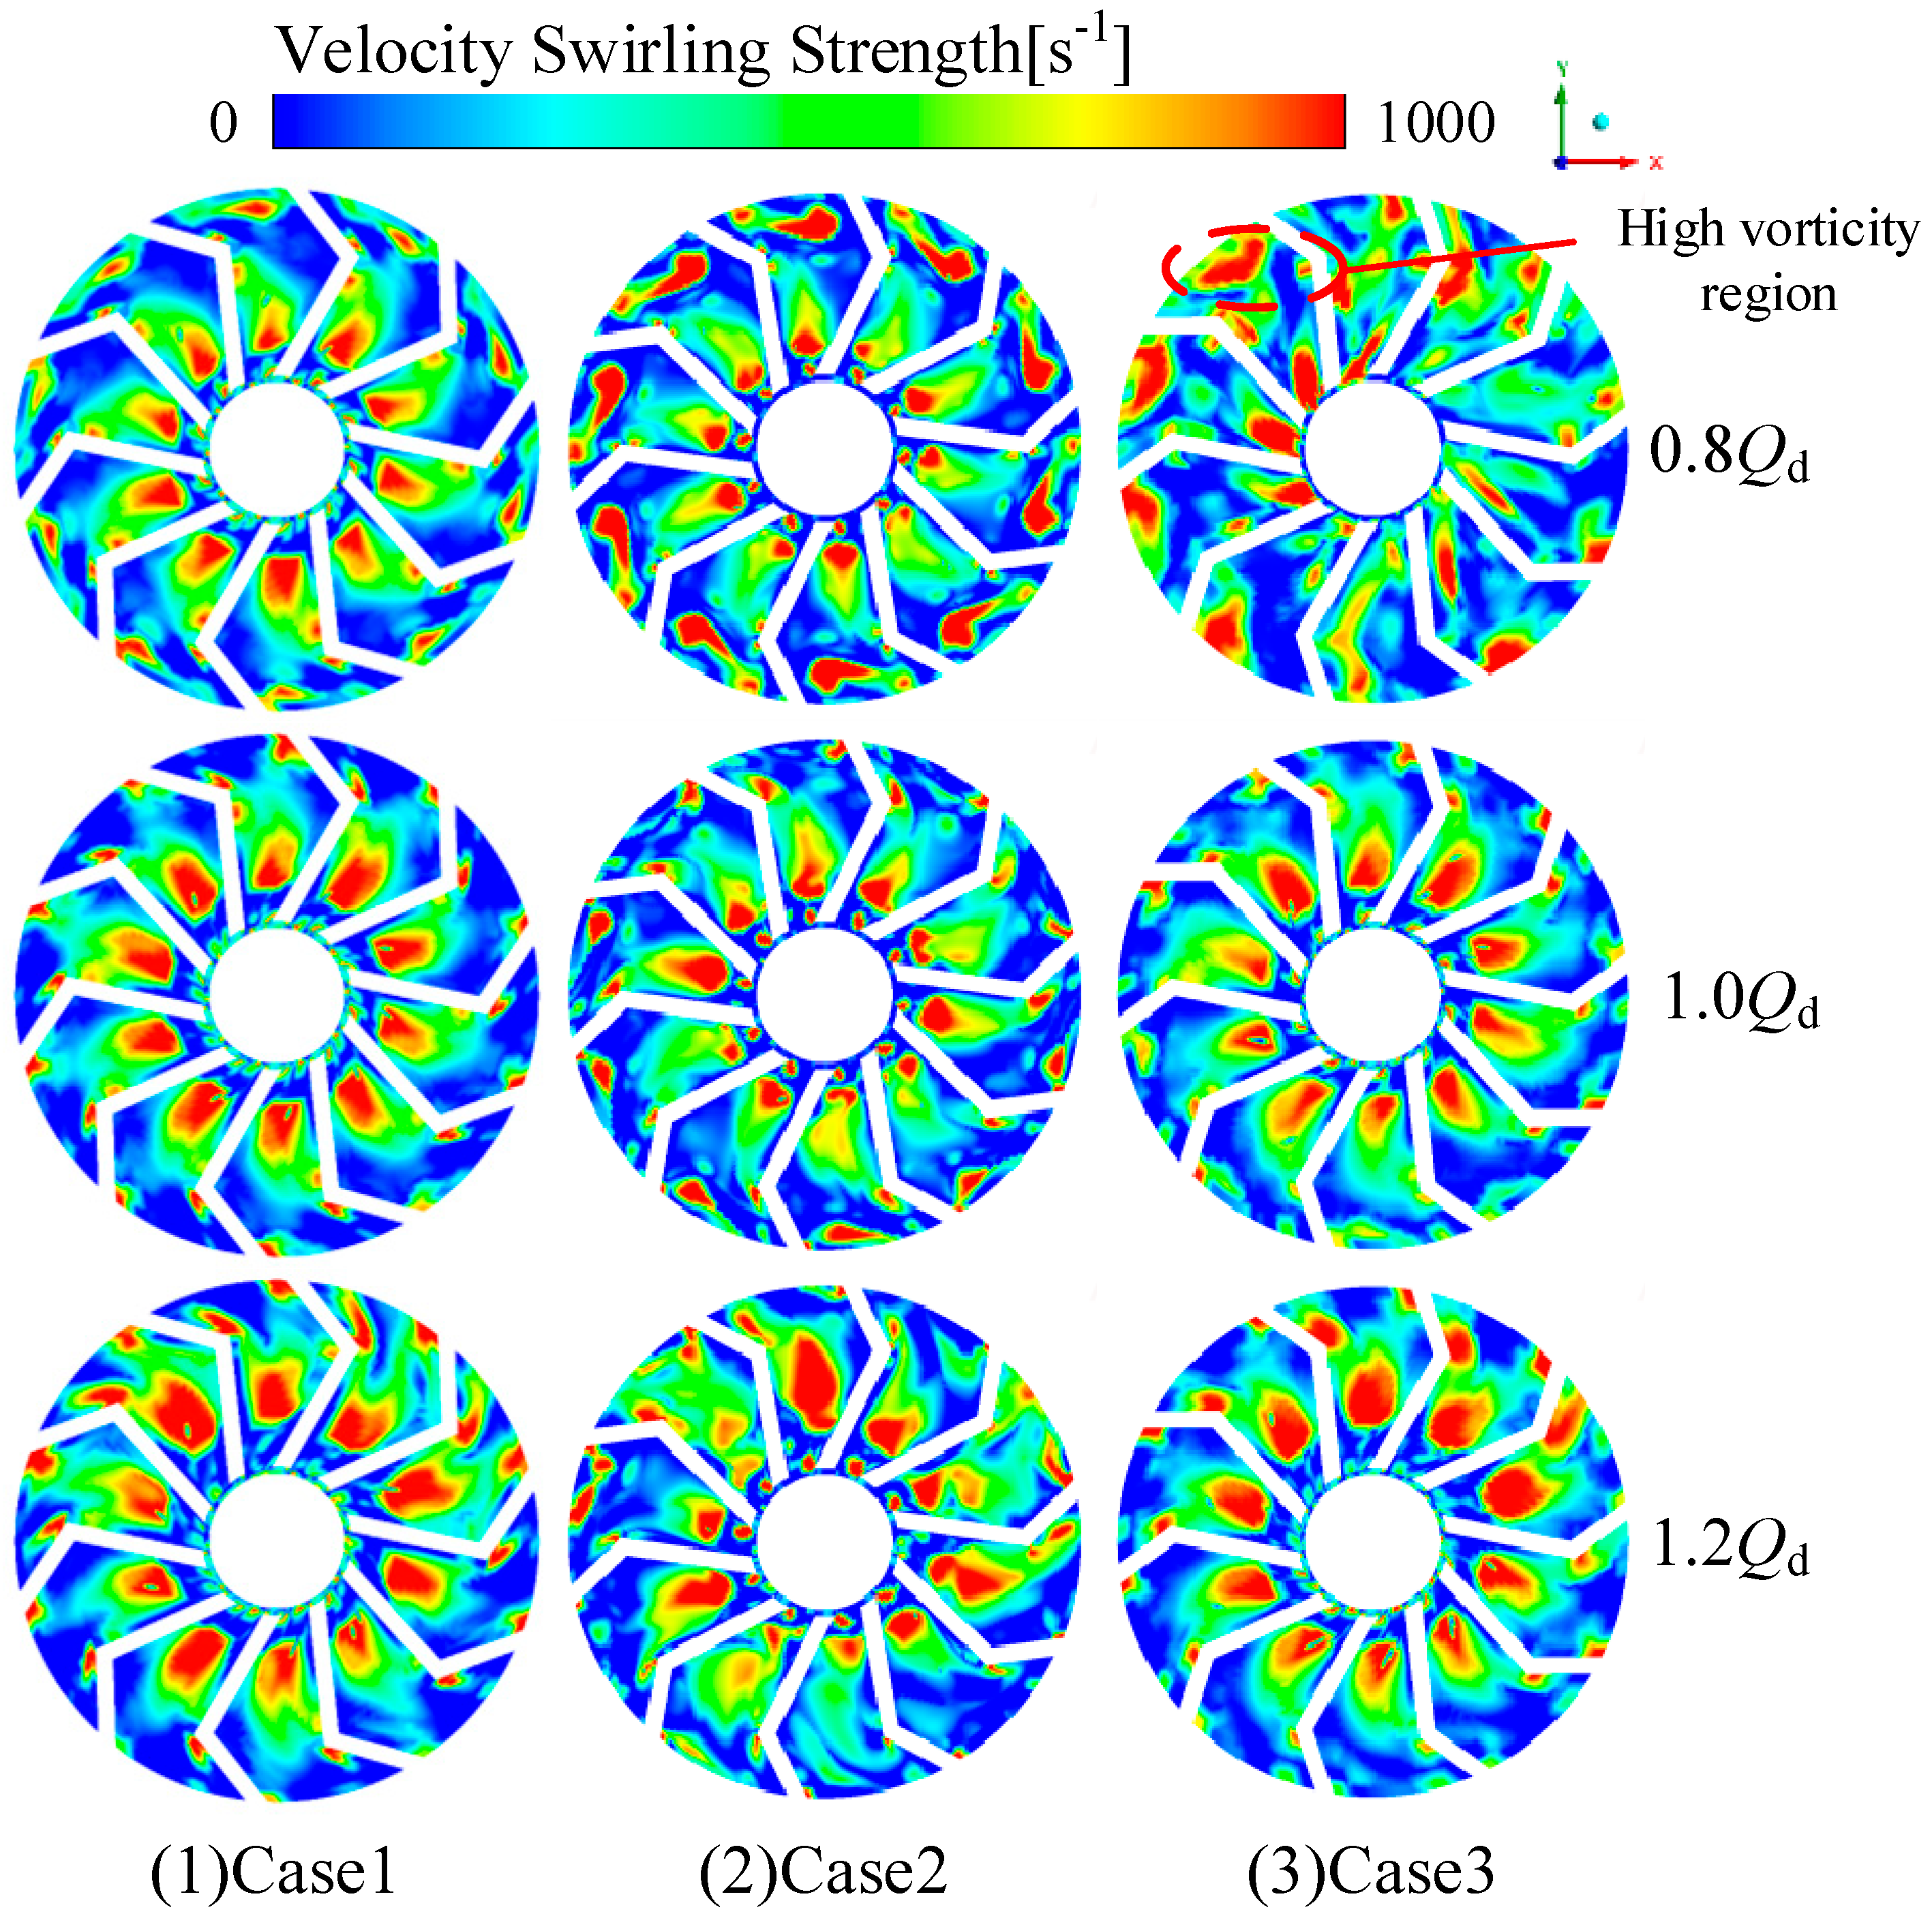
As shown in Figure 17, under a fixed flow rate, increasing the blade outlet angle results in a gradual expansion of high rigid-body vorticity regions within the flow passage, accompanied by increased vorticity intensity. Taking the design flow rate of 1.0Qd as an example, high-vorticity regions in Case 1 are localized mainly in the central region of the passage, whereas in Case 3, high-vorticity regions extend toward the near-wall region with a more pronounced peak intensity. This behavior arises because larger outlet angles enhance swirl motion within the passage, intensifying velocity gradients and shear effects, thereby increasing rigid-body vorticity.
For a given outlet angle, deviation of flow rate from the design value reduces the uniformity of rigid-body vorticity distribution. However, larger outlet angles such as Case 3 maintain relatively stronger rigid-body vorticity under off-design conditions. Under the small-flow-rate condition of 0.8Qd, the high-vorticity region in Case 3 is significantly larger than that in Case 1, indicating a compensatory effect of large outlet angles on swirl intensity under off-design operation.
The blade outlet angle is therefore a key structural parameter for regulating rigid-body vorticity in vortex pump flow passages. Larger outlet angles enhance swirl characteristics and increase both the intensity and spatial extent of rigid-body vorticity. At the same time, they provide stronger adaptability to flow rate deviation, maintaining relatively stable swirl intensity under variable operating conditions—an important feature for off-design performance of vortex pumps.

4.4.3. Evolution of Rigid-Body Vortices in Vortex Pump Flow Passages

Under fixed flow rate conditions, increasing the blade outlet angle drives the evolution of vortex structures from localized concentration to global expansion. For the small outlet angle Case 1, vortex structures are dominated by isolated small-scale vortices, with high-vorticity regions dispersed mainly in the central passage due to localized velocity gradients, exhibiting weak spatial continuity. For the medium outlet angle Case 2, vortex structures transition toward continuous vortex bands, with high-vorticity regions extending radially along the passage and both vortex scale and intensity increasing simultaneously. For the large outlet angle Case 3, vortex structures evolve into globally distributed strong swirl vortices, with high-vorticity regions spanning from near-wall regions to the passage core, achieving maximum continuity and intensity.
This evolution is driven by the enhancement of circumferential velocity induced by increasing outlet angle. Larger outlet angles impart greater circumferential momentum to the fluid, expanding shear layers and ultimately promoting the transformation of vortex structures from localized and discrete to globally continuous and intense.
When the flow rate deviates from the design value, vortex structures undergo a “distortion–reconstruction” evolution. For a given outlet angle, deviation from the design condition causes vortex structures to evolve from uniform distribution to asymmetric distortion and finally to localized reconstruction. Under the design condition, vortex structures are relatively uniformly distributed circumferentially. Under small-flow-rate conditions (e.g., Case 1), asymmetric vortex distortion occurs, with high-vorticity regions shifting toward the pressure side and vortex fragmentation taking place. Under large-flow-rate conditions, vortex structures are reconstructed near the wall, with high-vorticity regions concentrated on the suction side. This behavior is attributed to the increased axial velocity component at high flow rates and the coupling between circumferential swirl and axial flow, which alters shear layer locations.
Overall, Liutex-based analysis demonstrates that larger blade outlet angles lead to stronger rigid-body vorticity and broader high-vorticity regions under fixed flow rates, with a compensatory effect under off-design conditions. For a given outlet angle, deviation from the design flow rate induces vortex evolution from uniform distribution to distortion and reconstruction. Notably, rigid-body vorticity is closely correlated with entropy production: larger outlet angles enhance swirl motion and vorticity intensity, which may amplify velocity gradients, shear effects, and turbulence fluctuations. These flow characteristics further promote direct dissipation, turbulent dissipation, and wall entropy production, forming a potential coupling mechanism of “vorticity intensification → flow inhomogeneity → energy loss increase.” This correlation is a key factor explaining the lower hydraulic efficiency of large outlet-angle configurations, as intensified rigid-body vorticity-induced flow disorder directly aggravates irreversible energy losses quantified by entropy production.

5. Conclusions

The blade outlet angle is a critical design parameter of a vortex pump impeller, exerting a decisive influence on the flow direction at the impeller outlet, the efficiency of fluid momentum transfer, and the overall hydraulic performance of the pump. By adopting three different blade outlet setting angles and combining numerical simulations with experimental investigations, the effects of the outlet angle on the hydraulic performance, internal flow characteristics, entropy generation, and rigid vorticity of the vortex pump were systematically analyzed. Compared with previous studies mainly focused on centrifugal pumps, this work provides a systematic investigation tailored to the unique flow characteristics of vortex pumps. The main conclusions are summarized as follows.
  • Increasing the blade outlet angle leads to lower head and efficiency, as well as poorer operational stability. Under all operating conditions, the pump head decreases gradually with an increase in the blade outlet angle. For a given outlet angle, both the head and efficiency initially increase and then decrease with increasing flow rate, reaching their maximum values at the design flow rate of 1.0Qd. Pumps with smaller blade outlet angles exhibit higher head, higher hydraulic efficiency, and better operational stability over the entire operating range. This finding exhibits a certain difference from the trend that the head of a centrifugal pump increases with the blade outlet angle while its efficiency first rises and then decreases as the flow rate increases, which may be attributed to the structural differences between the two [30,34].
  • Larger blade outlet angles deteriorate the uniformity and stability of the internal flow field. When the blade outlet angle is small, the pressure field within the pump is relatively uniform. As the outlet angle increases, the pressure gradient becomes more pronounced, and high-pressure regions appear near the passage boundaries, with the maximum pressure difference exceeding 30,000 Pa. Entropy generation analysis indicates that, under 0.8Qd and 1.0Qd operating conditions, all three components of entropy production increase with increasing blade outlet angle. Pumps with smaller outlet angles exhibit lower entropy generation and smoother variations across the full operating range, indicating reduced hydraulic losses. This finding is basically consistent with that in centrifugal pumps, i.e., increasing the blade outlet angle leads to an increase in entropy generation [31].
  • Larger blade outlet angles result in poorer vorticity distribution uniformity. When the blade outlet angle is 50°, regions of high vorticity are mainly concentrated in the central region of the flow passage, and the vorticity distribution remains relatively uniform.

Author Contributions

Conceptualization, L.H. and X.F.; methodology, J.L. and C.Y.; software, X.L., Z.N. and C.L.; validation, X.F., J.L. and C.Y.; formal analysis, X.L., Z.N. and C.L.; investigation, L.H.; resources, L.H.; data curation, X.L.; writing—original draft preparation, Z.N.; writing—review and editing, L.H.; visualization, C.L.; supervision, L.H.; project administration, X.F., C.Y.; funding acquisition, L.H. and J.L. All authors have read and agreed to the published version of the manuscript.

Funding

This work was supported by the Guangxi Science and Technology Base and Talent Special Project (Grant No. GUIKE AD23026010), the Young and Middle-aged Teachers’ Scientific Research Basic Ability Improvement Project of Guangxi Universities—“Study on the Prediction and Evaluation of Hydraulic Excitation Characteristics in Pumped Storage Units” (Grant No. 2023KY1129), and the Guangxi Water Resources Science and Technology “Research-through-Project” Program (Grant No. SK-2023-40).

Data Availability Statement

The data presented in this study are available on request from the corresponding author; the data are not publicly available due to they are generated from an ongoing model development project.

Conflicts of Interest

Author Xiaofu Fan was employed by the company Guangxi Datengxia Gorge Water Conservancy Development Co., Ltd. The remaining authors declare that the research was conducted in the absence of any commercial or financial relationships that could be construed as a potential conflict of interest.

Abbreviations

AbbreviationParameterUnit
QFlow ratekg/s
QdDesign flow ratekg/s
HHeadm
ηEfficiency%
ECombined uncertainty/
ERRandom uncertainty/
ESSystematic uncertainty/
S p r o Total entropy production rateW/K
S p r o , D ¯ Direct dissipation entropy production rateW/K
S p r o , D Turbulent dissipation entropy production rateW/K
S p r o , W wall entropy productionW/K
TTemperatureK
Q ˙ Energy dissipation rateW/m3
ρ Dynamic densitykg/m3
kTurbulent kinetic energym2/s2
τ Wall shear stressPa
v Near-wall velocitym/s
ωTurbulent vortex viscous rates−1
AComputational domain wall surface aream2
VComputational domain volumem3
μ Fluid viscosityPa·s
u Velocity componentm/s
τ i j Stress tensor/
β2Blade outlet angle°
B2Blade widthmm

References

  1. Duan, A.Q.; Lin, Z.; Chen, D.S.; Li, Y. A review on the hydraulic performance and erosion wear characteristic of the centrifugal slurry pump. Particuology 2024, 95, 370–392. [Google Scholar] [CrossRef]
  2. Banka, J.; Rai, A.K. Erosion and flow visualization in centrifugal slurry pumps: A comprehensive review of recent developments and future outlook. Part. Sci. Technol. 2024, 42, 427–459. [Google Scholar] [CrossRef]
  3. Wang, C.N.; Yang, F.C.; Nguyen, V.T.T.; Vo, N.T.M. CFD Analysis and Optimum Design for a Centrifugal Pump Using an Effectively Artificial Intelligent Algorithm. Micromachines 2022, 13, 1208. [Google Scholar] [CrossRef]
  4. Hao, Y.; Tan, L. Symmetrical and unsymmetrical tip clearances on cavitation performance and radial force of a mixed flow pump as turbine at pump mode. Renew. Energy 2018, 127, 368–376. [Google Scholar] [CrossRef]
  5. Li, W.; Yang, Q.Y.; Yang, Y.; Ji, L.L.; Shi, W.D.; Agarwal, R. Optimization of pump transient energy characteristics based on response surface optimization model and computational fluid dynamics. Appl. Energy 2024, 362, 123038. [Google Scholar] [CrossRef]
  6. Zhou, H.; Zhou, P.; Meng, L.; Li, J.; Xiang, C.; Qian, H. Numerical Analysis of the Inlet and Outlet Diameter Effects on Pulsation Dynamics and Cavitation in the Lobe Pump. J. Appl. Fluid Mech. 2025, 18, 1189–1204. [Google Scholar] [CrossRef]
  7. Zhou, P.J.; Zeng, W.T.; Zhang, W.W.; Zhou, C.G.; Yao, Z.F. Multi-cavitation states identification of a sewage pump using CEEMDAN and BOA-SVM. J. Water Process Eng. 2024, 61, 105299. [Google Scholar] [CrossRef]
  8. Wen, Z.P.; Zhou, P.J.; Wu, Y.Z.; Yao, Z.F.; Wu, D.H.; He, M. Multi-objective optimization design of a centrifugal pump with vaned diffuser based on improved whale optimization algorithm and back propagation neural network. Phys. Fluids 2025, 37, 075119. [Google Scholar] [CrossRef]
  9. Jia, X.Q.; Zhang, Y.; Lv, H.; Zhu, Z.C. Study on external performance and internal flow characteristics in a centrifugal pump under different degrees of cavitation. Phys. Fluids 2023, 35, 014104. [Google Scholar] [CrossRef]
  10. Repsa, E.; Kronbergs, E. Investigation of centrifugal pump characteristics. In Proceedings of the 20th International Scientific Conference, Engineering for Rural Development, Jelgava, Latvia, 26–28 May 2021; pp. 26–28. [Google Scholar]
  11. Kondić, Ž.; Medić, S.; Kondić, V.J.T.v. Experimental and Numerical Investigation of Centrifugal Vortex Pump Operating Benefits for Energy Efficient Systems. Teh. Vjesn. 2020, 27, 1519–1523. [Google Scholar]
  12. Wang, Y.; Zhou, P.; Zhou, C.; Zhou, W.; Li, J. Analysis of Cavitation-induced Vibration Characteristics of a Vortex Pump Based on Adaptive Optimal Kernel Time-frequency Representation. J. Appl. Fluid Mech. 2024, 17, 591–603. [Google Scholar] [CrossRef]
  13. Zeng, W.; Zhou, P.; Wu, Y.; Wu, D.; Xu, M.J.I.S.J. Multi-cavitation states diagnosis of the vortex pump using a combined DT-CWT-VMD and BO-LW-KNN based on motor current signals. IEEE Sens. J. 2024, 24, 30690–30705. [Google Scholar] [CrossRef]
  14. Fecser, N.; Lakatos, I. Cavitation Measurement in a Centrifugal Pump. Acta Polytech. Hung. 2021, 18, 63–77. [Google Scholar] [CrossRef]
  15. Guo, X.M.; Zhu, Z.C.; Cui, B.L.; Shi, G.P. Effects of the number of inducer blades on the anti-cavitation characteristics and external performance of a centrifugal pump. J. Mech. Sci. Technol. 2016, 30, 3173–3181. [Google Scholar] [CrossRef]
  16. Li, Z.K.; Ding, H.C.; Shen, X.; Jiang, Y.M. Performance Optimization of High Specific Speed Centrifugal Pump Based on Orthogonal Experiment Design Method. Processes 2019, 7, 728. [Google Scholar] [CrossRef]
  17. Hao, Y.; Hao, J.; Zuchao, Z.; Xianghui, S.; Wenqi, L.; Gruszczynski, M.; Qiangmin, D.; Panlong, G. Review of the hydraulic and structural design of high-speed centrifugal pumps. Front. Energy Res. 2022, 10, 899093. [Google Scholar] [CrossRef]
  18. Li, W. Vortex pump as turbine—A type turbine for energy generation or recovery based on computational fluid dynamics prediction. J. Fluids Eng. 2019, 141, 101105. [Google Scholar] [CrossRef]
  19. Gerlach, A.; Thamsen, P.U.; Wulff, S.; Jacobsen, C.B. Design Parameters of Vortex Pumps: A Meta-Analysis of Experimental Studies. Energies 2017, 10, 58. [Google Scholar] [CrossRef]
  20. Ju, Y.P.; Liu, S.; Zhang, C.H. Effect of blade shape on hydraulic performance and vortex structure of vortex pumps. J. Hydrodyn. 2018, 30, 499–506. [Google Scholar] [CrossRef]
  21. Gu, Y.Q.; Zhang, W.Q.; Mou, J.G.; Zheng, S.H.; Zhou, P.J.; Fan, T.X. Effect of bionic mantis shrimp groove volute on vortex pump pressure pulsation. J. Cent. South Univ. 2018, 25, 2399–2409. [Google Scholar] [CrossRef]
  22. Han, X.D.; Kang, Y.; Li, D.; Zhao, W.G. Impeller Optimized Design of the Centrifugal Pump: A Numerical and Experimental Investigation. Energies 2018, 11, 1444. [Google Scholar] [CrossRef]
  23. Wu, T.X.; Wu, D.H.; Ren, Y.; Song, Y.; Gu, Y.Q.; Mou, J.G. Multi-objective optimization on diffuser of multistage centrifugal pump base on ANN-GA. Struct. Multidiscip. Optim. 2022, 65, 182. [Google Scholar] [CrossRef]
  24. Wang, Y.Q.; Zhou, L.X.; Zheng, S.M. Multi-Objective Optimization Design of Low Specific Speed Centrifugal Pumps Based on Genetic Algorithm. IEEE Access 2023, 11, 97896–97908. [Google Scholar] [CrossRef]
  25. Nourbakhsh, A.; Safikhani, H.; Derakhshan, S. The comparison of multi-objective particle swarm optimization and NSGA II algorithm: Applications in centrifugal pumps. Eng Optim. 2011, 43, 1095–1113. [Google Scholar] [CrossRef]
  26. Lin, G.; Zhou, P.; Wu, Y.; Yao, Z.; Wu, H. A Heterogeneous Multi-Model Stacking Framework for Predicting Pump Complete Characteristic Curves. Energy 2025, 342, 139639. [Google Scholar] [CrossRef]
  27. Luo, H.; Zhou, P.; Cui, J.; Wang, Y.; Zheng, H.; Wang, Y. Energy performance prediction of centrifugal pumps based on adaptive support vector regression. Eng. Appl. Artif. Intell. 2025, 145, 110247. [Google Scholar] [CrossRef]
  28. Xu, Y.; Gan, X.; Pei, J.; Wang, W.; Chen, J.; Yuan, S. Applications of artificial intelligence and computational intelligence in hydraulic optimization of centrifugal pumps: A comprehensive review. Eng. Appl. Comput. Fluid Mech. 2025, 19, 2474675. [Google Scholar] [CrossRef]
  29. Gan, X.; Xu, Y.; Pei, J.; Wang, W.; Yuan, S. Approaching a modified adaptive swarm intelligence to energy efficiency enhancement of an inline pump. Energy 2025, 325, 136207. [Google Scholar] [CrossRef]
  30. Muslim, N.H.; Yousif, A.R. Experimental and Theoretical Study of Angles and Blade Number Effect on the Movable Energy and Efficiency of Centrifugal Pumps. Instrum. Mes. Métrologies 2025, 24, 143. [Google Scholar] [CrossRef]
  31. Sakran, H.K.; Aziz, M.S.A.; Khor, C.Y. Blade exit angle impact on centrifugal pump performance: Entropy generation and fluid–structure interaction analysis. Arab. J. Sci. Eng. 2025, 50, 2509–2525. [Google Scholar] [CrossRef]
  32. Han, C.; Liu, J.; Yang, Y.; Chen, X. Influence of Blade Exit Angle on the Performance and Internal Flow Pattern of a High-Speed Electric Submersible Pump. Water 2023, 15, 2774. [Google Scholar] [CrossRef]
  33. Ding, H.C.; Chang, T.; Lin, F.Y. The Influence of the Blade Outlet Angle on the Flow Field and Pressure Pulsation in a Centrifugal Fan. Processes 2020, 8, 1422. [Google Scholar] [CrossRef]
  34. Ding, H.C.; Li, Z.K.; Gong, X.B.; Li, M.S. The influence of blade outlet angle on the performance of centrifugal pump with high specific speed. Vacuum 2019, 159, 239–246. [Google Scholar] [CrossRef]
  35. Guan, H.; Jiang, W.; Yang, J.; Wang, Y.; Zhao, X.; Wang, J. Energy loss analysis of the double-suction centrifugal pump under different flow rates based on entropy production theory. Proc. Inst. Mech. Eng. Part C-J. Mech. Eng. Sci. 2020, 234, 4009–4023. [Google Scholar] [CrossRef]
  36. Huang, P.; Appiah, D.; Chen, K.; Zhang, F.; Cao, P.; Hong, Q. Energy dissipation mechanism of a centrifugal pump with entropy generation theory. AIP Adv. 2021, 11, 045208. [Google Scholar] [CrossRef]
  37. Jia, X.-Q.; Zhu, Z.-C.; Yu, X.-L.; Zhang, Y.-L. Internal unsteady flow characteristics of centrifugal pump based on entropy generation rate and vibration energy. Proc. Inst. Mech. Eng. Part E-J. Process Mech. Eng. 2019, 233, 456–473. [Google Scholar] [CrossRef]
  38. Li, D.; Wang, H.; Qin, Y.; Han, L.; Wei, X.; Qin, D. Entropy production analysis of hysteresis characteristic of a pump-turbine model. Energy Convers. Manag. 2017, 149, 175–191. [Google Scholar] [CrossRef]
  39. Shi, G.; Hao, Z.; Peng, X.; Wen, H.; Lv, W.; Fu, J. Analysis of vortex characteristics in the S-shaped region of a reversible Pump-Turbine with different guide vane openings based on Omega vortex identification method. J. Energy Storage 2024, 84, 110921. [Google Scholar] [CrossRef]
  40. Alvarez, O.; Ma, C.; Aberson, S.; Liu, C. Vortex visualization of tropical cyclones by Liutex. J. Hydrodyn. 2025, 37, 239–245. [Google Scholar] [CrossRef]
  41. Zhou, P.J.; Wen, Z.P.; Wang, Y.; Wu, Y.Z.; Wu, D.H.; Huang, R.F.; Yao, Z.F. Improving the energy performance of vortex pump based on whale optimization algorithm. Eng. Appl. Comput. Fluid Mech. 2025, 19, 2441344. [Google Scholar] [CrossRef]
  42. Ullah, T.; Ahmad, F.; Siddiqi, M.U.R.; Hanif, M.I.; Irfan, M.; Khan, A.H.; Ali, S. Blade meridional profile optimization for novel high-pressure ratio centrifugal compressor design using numerical simulations. In Proceedings of the 2020 3rd International Conference on Computing, Mathematics and Engineering Technologies (iCoMET), Sukkur, Pakistan, 29–30 January 2020; pp. 1–9. [Google Scholar]
  43. Khan, A.; Irfan, M.; Niazi, U.M.; Shah, I.; Legutko, S.; Rahman, S.; Alwadie, A.S.; Jalalah, M.; Glowacz, A.; Khan, M.K.A. Centrifugal compressor stall control by the application of engineered surface roughness on diffuser shroud using numerical simulations. Materials 2021, 14, 2033. [Google Scholar] [CrossRef]
  44. Yang, F.; Xie, C.; Liu, C.; Yuan, Y.; Shi, L. Research progress of computational model for rotating turbulent flow in fluid machinery. Trans. Chin. Soc. Agric. Mach. 2016, 47, 1–14. [Google Scholar]
  45. Kraichnan, R.H. Eddy viscosity in two and three dimensions. J. Atmos. Sci. 1976, 33, 1521–1536. [Google Scholar] [CrossRef]
  46. Liu, C.; Vafidis, C.; Whitelaw, J. Flow characteristics of a centrifugal pump. J. Fluids Eng. 1994, 116, 303–309. [Google Scholar] [CrossRef]
  47. Liu, C.Q.; Gao, Y.S.; Dong, X.R.; Wang, Y.Q.; Liu, J.M.; Zhang, Y.N.; Cai, X.S.; Gui, N. Third generation of vortex identification methods: Omega and Liutex/Rortex based systems. J. Hydrodyn. 2019, 31, 205–223. [Google Scholar] [CrossRef]
  48. Zhou, P.J.; Li, J.; Wu, Y.Z.; Wang, Y.T.; Zhou, X.K.; Wen, Z.P.; Zhao, H.B. Study of cavitation-induced flow characteristics of a vortex pump based on coherence analysis. Phys. Fluids 2025, 37, 033318. [Google Scholar] [CrossRef]
  49. Cai, S.T.; Huang, R.F.; Qian, Z.H.; Luo, X.W.; Wang, Y.W. Unsteady flow characteristics of backflow vortices in an axial-flow pump at low flow rates. J. Hydrodyn. 2025, 37, 359–376. [Google Scholar] [CrossRef]
Figure 1. Three impeller designs with different blade outlet angles.
Energies 19 00758 g001
Figure 2. Three-dimensional full-flow-field model of the vortex pump.
Energies 19 00758 g002
Figure 3. Location of the analysis section.
Energies 19 00758 g003
Figure 4. External performance test system of the vortex pump.
Energies 19 00758 g004
Figure 5. Hydraulic performance test of the vortex pump.
Energies 19 00758 g005
Figure 6. Comparison of experimental and numerical external characteristics of the original model. (a) Head; (b) Efficiency.
Energies 19 00758 g006
Figure 7. Head and efficiency under different outlet angles and operating conditions. (a) Head; (b) Efficiency.
Energies 19 00758 g007
Figure 8. Velocity contours under different outlet angles and operating conditions.
Energies 19 00758 g008
Figure 9. Pressure contours under different outlet angles and operating conditions.
Energies 19 00758 g009
Figure 10. Velocity vector distributions under different outlet angles and operating conditions.
Energies 19 00758 g010
Figure 11. Variation in direct entropy production under different operating conditions and blade outlet angles.
Energies 19 00758 g011
Figure 12. Variation in turbulent entropy production under different operating conditions and blade outlet angles.
Energies 19 00758 g012
Figure 13. Variation in wall entropy production under different operating conditions and blade outlet angles.
Energies 19 00758 g013
Figure 14. Variations in direct, turbulent, and wall entropy production under different operating conditions and blade outlet angles.
Energies 19 00758 g014
Figure 15. Distribution and variation in direct entropy production under different operating conditions and blade outlet angles. A: Small-scale export corner high-entropy production area; B: High-entropy production area in the central export corner.
Energies 19 00758 g015
Figure 16. Distribution and variation in turbulent entropy production under different operating conditions and blade outlet angles.
Energies 19 00758 g016
Figure 17. Rigid-body vorticity distributions under different operating conditions and outlet angles.
Energies 19 00758 g017
Table 1. Design parameters of the vortex pump.
Design ParametersNumerical ValueSymbol/Unit
Blade outlet angle60β2
Blade inlet angle55β1
Blade width32B2/mm
Blade thickness4T/mm
Number of blades10-
Impeller diameter132D2/mm
Table 2. External characteristics under different grid numbers.
Group NumberNumber of Grids/105Head/mEfficiency/%Shaft Power/kwHead Variation Rate/%Rate of Change in Efficiency/%Shaft Power Variation Rate/%
11.622.5757.4615,397.56
22.322.5857.4715,401.710.040.030.03
33.522.7557.9815,381.170.70.880.13
44.423.0358.0115,562.421.20.051.16
55.322.9758.1515,484.510.30.040.50
66.623.0558.2015,525.090.30.060.26
Table 3. Group 4.5.6 Grid convergence index.
Evaluation Parameters (f)Convergence AccuracyGCI12 (%)GCI23 (%)
Head9.851.222.24
Efficiency16.600.170.06
Table 4. Parameters of experimental instruments.
Instrument TypeInstrument ModelInstrument Parameters
Imported pressure sensorCerbar S PMC71 (Endress+Hauser Automation Instruments Ltd., Reinach, Switzerland)0–400 KPa
Export pressure sensorCerbar S PMP710–4 MPa
FlowmeterProline Promag L 400 (Endress+Hauser Flow Technology (Suzhou) Co., Ltd., Suzhou, China)0–150 m3/h
Three-phase asynchronous motorYE3-112M-2 (Shanghai Dongfang Weier, Shanghai, China)0–2890 r/min
Table 5. Comparison of experimental and numerical external characteristics of the original model.
Q / Q d Simulation Efficiency/(%)Test
Efficiency/(%)
Discrepancy in Head/(%)Test Head/(m)Simulation Head/(m)Discrepancy in Efficiency/(%)
0.652.0951.940.29%24.1123.193.82%
0.856.3955.262.00%23.1522.373.37%
1.057.4857.050.75%21.7820.774.64%
1.256.2955.990.53%19.8719.193.42%
1.451.5250.462.06%18.1117.413.87%
Table 6. Head and efficiency under different outlet angles and operating conditions.
Operating
Conditions
0.8Qd1.0Qd1.2Qd
Exit Angle Head/mEfficiency/%Head/mEfficiency/%Head/mEfficiency/%
Case150°14.0443.3715.7654.2312.4146.43
Case260°13.6543.1514.8251.1712.0334.25
Case365°8.3526.3514.2748.7510.3344.21
Disclaimer/Publisher’s Note: The statements, opinions and data contained in all publications are solely those of the individual author(s) and contributor(s) and not of MDPI and/or the editor(s). MDPI and/or the editor(s) disclaim responsibility for any injury to people or property resulting from any ideas, methods, instructions or products referred to in the content.