Abstract
In new distribution systems with high penetration of renewable energy, inverter-based sources exhibit significant differences in fault characteristics compared to traditional power sources due to the absence of a constant electromotive force and their operation under nonlinear control links, rendering conventional fault current calculation methods inadequate. To address these challenges, a full-time-domain analysis-based method for modelling and calculating fault transient characteristics is proposed. First, a dynamic model of inverter-based sources accounting for current loop saturation effects is established, and phase plane analysis is employed to resolve nonlinear control regions. On this basis, a full-time-domain fault current calculation method is proposed, wherein the steady-state operating point after a fault is determined by iteratively solving the network node voltage equations. By integrating control strategies and derived transient differential equations, the fault current expression across the full-time-domain scope is formulated. Furthermore, a multi-objective optimization control strategy is proposed to achieve effective fault current suppression, and an improved Simulated Annealing-Particle Swarm Optimization (SA-IPSO) hybrid algorithm is adopted for efficient solution. Finally, SIMULINK-based simulation experiments validate the accuracy and effectiveness of the proposed method in transient characteristic analysis and current suppression.
1. Introduction
As a key carrier for large-scale renewable energy integration, the new distribution system serves as a critical support for the evolution of the power grid and plays an indispensable role in achieving the dual carbon goals. In this study, the new distribution system is defined as a network architecture where traditional synchronous generators are predominantly replaced by inverter-interfaced renewable energy sources, including photovoltaics and wind turbines. Consequently, the system exhibits unique characteristics such as low inertia and nonlinear fault responses that are dominated by control logic rather than physical electromotive forces. However, with the continuous increase in the penetration of renewable energy units such as wind and solar power, the fault transient response characteristics of the grid have undergone significant changes [1,2]. Consequently, traditional calculation methods are increasingly revealing technical limitations in this evolving context, underscoring the urgent need to develop fault analysis methods applicable to new distribution systems [3].
Addressing the adaptability issue where traditional calculation methods struggle to accurately describe the fault characteristics of new distribution systems due to differences in transient characteristics between renewable energy sources and synchronous machines, there is an urgent need to develop transient analysis calculation methods suitable for high penetration of renewable energy integration. Renewable energy inverter-based sources, represented by photovoltaic power units and permanent magnet direct-drive wind turbines, exhibit current source characteristics [4]. However, because their core energy conversion stages universally employ power electronic conversion devices, their fault response characteristics differ markedly from those of synchronous generators. These differences are specifically manifested in the non-constant subtransient electromotive force and impedance values before and after faults, and the absence of a linear mapping relationship between the short-circuit current provided by the inverter and its terminal voltage [5]. This urgently necessitates innovative research on short-circuit current calculation theories for power grids incorporating new power electronic devices.
For the research on the transient characteristic analysis of new energy inverter power supply networks, ref. [6] proposed a short-circuit calculation approach for grids with a high proportion of inverter-interfaced generator stations, addressing the limitations of traditional capacity optimization schemes in medium- and low-voltage distribution networks. For systems with clustered inverter-based resources, recent studies [7,8] have established differentiated fault models under decoupled sequential control, dividing the fault transient process into subtransient and transient stages to better capture dynamic behaviors. Addressing the challenges of negative-sequence current calculation under asymmetric faults, ref. [9] analyzed the fault current characteristics of inverter-interfaced renewable energy generators based on sequence component decomposition, avoiding deviations caused by nonlinear responses. Refs. [10,11] aimed to improve the speed and accuracy of transient component calculation by performing analysis of the full transient process through computationally intensive Electromagnetic Transient (EMT) simulations or sophisticated advanced analytical models. Ref. [12] addressed this complexity by dividing the transient process into different calculation stages; this method faces the limitation of overly cumbersome equation solving in multi-source scenarios, thereby underscoring the urgent need for more efficient full-time-domain approaches. However, the aforementioned studies have characterized the transient behavior of inverter-based sources, but they have not fully considered the influence of nonlinear dynamics such as saturation and limiting in the inverter control loop, which could potentially lead to deviations in subsequent fault voltage and current analysis.
To clarify the technical positioning of the proposed method, it is compared with prevalent methodologies, specifically the detailed EMT simulation represented by Reference [10] and the multi-stage analytical method in Reference [12]. While EMT models offer high fidelity, they are characterized by substantial computational requirements that limit their applicability for large-scale system optimization. Conversely, multi-stage analytical methods improve calculation speed but may introduce mathematical discontinuities and have limitations in resolving nonlinear dynamics during mode transitions. Table 1 provides a summary of these differences. Within this context, the accuracy metric is defined as the ratio of the simulation or experimental value to the theoretically calculated value. The accuracy of the proposed method is determined by the ratio of the experimental results to the theoretical derivations presented in Section 4. The values for References [10,12] are average accuracies calculated based on the data reported in the respective studies.

Table 1.
Comparative analysis of different models.
The issue of short-circuit current exceeding safe limits, caused by the increasing grid-connected capacity of renewable energy units, may lead to electrical equipment damage, system instability, and even cascading failures, significantly raising system security risks. To address this problem, there is an urgent need to conduct research on short-circuit current optimization control technologies. Ref. [13] analyzed the short-circuit current characteristics in power grids with high renewable penetration and proposed conventional grid structure adjustments to address over-limit problems. Focusing on the source model, ref. [14] derived an approximate expression for the short-circuit current of permanent magnet direct-drive wind turbines based on the mathematical model of the grid-side converter. Ref. [15] proposed a robust calculation method for the peak short-circuit current of new energy units that minimizes dependence on specific converter parameters, facilitating practical engineering applications. Existing research primarily focuses on analyzing the impact of renewable energy unit integration on grid short-circuit current and developing calculation methods for grid short-circuit current that consider renewable energy units. However, it has not incorporated the adjustment of renewable energy unit control parameters into short-circuit current control measures, thereby failing to leverage the flexible regulation capabilities of the massive number of renewable energy units.
To address the aforementioned challenges, this paper proposes a fault calculation method for new distribution systems based on full-time-domain analysis. In this context, full-time-domain analysis is defined as a methodology that derives a unified and continuous analytical expression for the fault current spanning the entire duration from fault inception to the steady state. This approach overcomes the limitations of traditional multi-stage methods by ensuring mathematical continuity and avoiding the complexity of segmented calculations. The proposed approach explicitly accounts for the nonlinear saturation characteristics of inverter-based sources by constructing differential equations governed by fault boundary conditions. By leveraging the mapping relationship between pre-fault and post-fault steady-state operating points, the short-circuit current is solved analytically across the entire time domain. Furthermore, an optimized control strategy is developed to achieve effective suppression of fault currents. Finally, the feasibility and effectiveness of the proposed method are comprehensively verified through simulation experiments.
2. Fault Characteristic Analysis of New Distribution Systems
2.1. Analysis of Fault Characteristics in Inverter-Based Sources Considering Current Loop Saturation Effects
In large-scale renewable-integrated new distribution system networks, the nonlinear characteristics of power electronic device failures present significant challenges for transient analysis. This study proposes a transient current calculation method applicable to inverter-based power supply faults, specifically addressing nonlinear issues caused by saturation limiting mechanisms in control systems. Utilising phase plane analysis, the methodology resolves fault-induced transient currents under both saturated and unsaturated operating conditions, effectively overcoming the difficulties in handling nonlinear saturation elements and analyzing transient processes.
The dynamic response characteristics of the output current of inverter-based sources exhibit a significant correlation with the given current command value. Based on the voltage at the point of common coupling (PCC) and the output current, the output power equation of the inverter can be derived as:
where represents the active power of the converter, and denotes the reactive power of the converter.
In the rotating reference frame, achieving precise decoupled control of four-degree-of-freedom current components requires the addition of two independent constraint conditions to the system’s average component basis. The physical implications of these constraints correspond to specific control objectives. To construct a unified multi-objective control model, this method introduces a three-state control factor , with each state, respectively, targeting active power fluctuation suppression, reactive power regulation, and negative-sequence current mitigation. By establishing an extended power balance equation to form the Jacobian matrix and performing matrix inversion operations, the derived analytical expression for current-loop reference commands with explicit physical significance is obtained as follows [16]:
where and represent the positive- and negative-sequence d-axis voltage components at the inverter grid connection point, while and denote the positive- and negative-sequence q-axis voltage components at the same location.
The current reference command expression derived from the integration of axes in combined positive-negative sequence coordinate systems is formulated as follows:
During grid fault transient processes, the output current of inverter-based power sources exhibits characteristic dynamic transitional behavior. When post-fault voltage fluctuations at the grid connection point remain within limited magnitudes, the system can establish a steady-state operating point, allowing the actual output current to be analytically modeled as a step-input response under such operational conditions.
The control equation for the current inner loop is formulated as:
where and respectively denote the proportional and integral coefficients of the current loop, while and represent the d-axis and q-axis current reference values at the inverter grid connection point.
The control system of the inverter power converter regulates the inverter terminal voltage through PWM modulation to achieve current control. By eliminating the inverter terminal voltage from the aforementioned equation, the current differential equation can be derived as follows:
The equations derived in this paper primarily characterize the transient behavior within the control bandwidth of the inverter, typically ranging from tens to hundreds of Hertz. Consequently, this model excludes high-order dynamics exceeding 1000 Hertz, such as LCL filter resonance, as well as nonlinear factors like transformer saturation. This omission constitutes a conventional approximate method in fault analysis research and is substantiated by structural nonlinearity identification theories, which indicate that high-frequency distortions exert negligible influence on the fundamental response trajectory within the primary excitation bandwidth. Although this approximation may result in a slight deviation between the instantaneous current waveform and the actual situation within the first one to two milliseconds at the initial stage of the fault, these high-frequency components decay rapidly due to the effect of system damping and filter resistors [17]. Thus, their influence on the calculation of fundamental frequency fault current components and their effective values can be considered negligible.
During transient fault conditions, the current reference command value undergoes an abrupt change:
Based on the aforementioned theoretical derivations, the general analytical expressions for current components in the rotating coordinate system can be solved.
Under overdamped conditions, the solution to the above equation is:
The undetermined coefficient in the above equation satisfies:
The specific variable meanings in Equations (1)–(10) are provided in Table 2.
Table 2.
Concise nomenclature table of Equations (1)–(10).
2.2. Current Response Analysis Based on the Phase Plane Method
The preceding linear analysis does not account for control system nonlinearities, specifically the saturation modules required to limit signal amplitudes. These constraints introduce phase lags in regulator outputs, which cause actual transient waveforms to deviate from idealized linear predictions. To address this, phase plane analysis is employed to characterize the dynamic response under saturation mechanisms. The methodological justification for this approach lies in its ability to provide a clear geometric interpretation of the switching conditions induced by saturation logic. Unlike numerical integration methods that treat saturation as an implicit algorithmic constraint, phase plane analysis explicitly delineates the system state trajectories across distinct linear and saturated regions. This graphical characterization confirms that the system dynamics remain piecewise linear and enables the derivation of closed-form analytical solutions without compromising physical fidelity.
The operational modes of the system control state-space model are constrained by both the output quantity of the PI regulator and its saturation limit thresholds. The parameter is defined as the discriminant variable for system operating modes, enabling the division of the system into linear regulation and saturated limitation regions. The current tracking errors and are selected as phase variables to characterise the temporal response curve. The schematic diagram of the phase plane trajectory is shown in Figure 1.
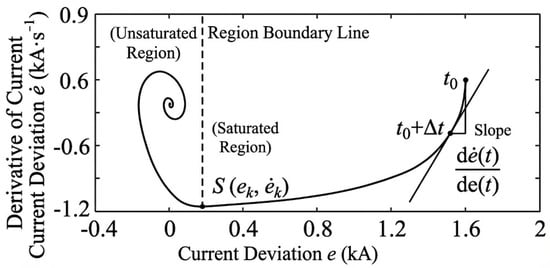
Figure 1.
Schematic diagram of the phase plane trajectory.
(1) Saturation Region
When , the system operates in saturation mode. The phase trajectory curve of the system satisfies:
It is evident that the trajectory forms a straight line, where the current deviation quantity and its derivative adhere to a precise derivative relationship.
(2) Unsaturated Region
When , the system operates in the unsaturated state, the corresponding trajectory in the unsaturated region approximates a straight line, with the linear equation expressed as:
Through phase plane analysis, it has been demonstrated that in practical systems, the current deviation signal and its derivative strictly adhere to a linear relationship within the saturation region, while exhibiting approximate linearity in the unsaturated region. By leveraging these linear relationships identified in the phase plane, the inherent challenges of handling saturation nonlinearities and resolving transient process complexities have been effectively resolved.
The robustness of the proposed method to control structure variations is substantiated by recent stability mechanism analyses of hybrid power generation systems containing both grid-forming and grid-following units [18]. Research indicates that although the small-signal impedance characteristics of these inverters differ significantly, their transient behaviors under fault conditions are universally governed by the saturation nonlinearities of the control loops. Consequently, the phase plane analysis method, which explicitly resolves these nonlinear saturation constraints, is applicable to grid-forming or hybrid inverter controls by reconstructing the differential equations to reflect the specific voltage or frequency regulation dynamics.
2.3. Fault Calculation Method for New Distribution Systems Based on Full-Time-Domain Analysis
Based on the equivalent modelling of power sources in the new distribution system network described above and combined with the known network topology, a network state analytical model is further constructed to study the transient current calculation method. During the transient process of renewable energy inverter-based sources, the relationship between current and time satisfies the mathematical characteristics of a second-order differential equation, which fundamentally represents a dynamic transition between two steady-state operating points. Considering that the transient regulation mechanism does not alter the operational objectives of the control system, the steady-state current analysis after a fault can be performed using pre-fault steady-state current calculations. Therefore, a current calculation method for the transient process based on the full-time-domain analysis method is proposed.
2.3.1. Calculation Method for Current in Steady-State Processes
First, the current variation during the steady-state process of the system is analysed. Considering the integration of large-scale renewable energy inverter-based sources in the new distribution system, the relationship between the output current of the voltage-controlled current source and the voltage at the PCC is not linear. If the traditional superposition theorem is applied for network decomposition, the state of the renewable energy sources in the fault component network would vary with the voltage at the PCC, making it impossible to represent these sources with constant voltage or current sources. Therefore, the node voltage equations are formulated for the entire network:
where represents the measured node and denotes the total number of nodes. Impedance (j, k = 1,2,…n, with j ≠ k) corresponds to the mutual impedance between nodes j and k in the nodal impedance matrix, while indicates the self-impedance of node j. The parameter signifies the voltage phasor at node j, and represents the current phasor at the fault location.
For the new distribution system integrated with renewable energy, the injection currents are formed by the combined action of the constant current sources from synchronous generators and the inverter-based sources. Specifically, the values of the synchronous generator sources are derived from the subtransient electromotive force parameters converted via the Norton equivalent model, while the output current values of the inverter-based sources are regulated by the voltage at the PCC. The node voltage phasors are obtained by solving the full network equations collectively, which in turn are used to recursively update the current output values of the inverter-based sources. This enables dynamic correction of the injection current column vector in the above equation. The node voltage parameters are continuously checked until all system nodes converge to the steady-state operating point. The calculation flowchart for system steady-state voltage and current is shown in Figure A1.
2.3.2. Calculation Method for Current During the Transient Process
First, analyzing the three-phase short-circuit fault scenario, based on the precise calculation results of the node voltages mentioned above, the short-circuit currents on each line in the new distribution system can be accurately calculated. For lines directly connected to renewable energy inverter-based sources, the calculation can be performed using the current command expression established in Equation (4), based on their dynamic coupling characteristics with controlled sources. The expression for calculating the short-circuit current in lines not directly connected to renewable energy sources is as follows:
where represents the line impedance between nodes and , and denotes the line current phasor between the nodes.
Further analyzing asymmetric short-circuit fault scenarios, the physical interpretation of Norton equivalent models becomes ambiguous for new distribution networks integrating renewable energy sources under dynamic sequence network interactions during asymmetrical faults. When control strategies lack negative-sequence current suppression configurations, the nonlinear dynamic characteristics of inverter-based power supplies permeate into negative-sequence networks, causing incompatibility issues in equivalent model formulations for the new distribution system. Consequently, adopting analytical principles similar to three-phase fault scenarios, the system admittance matrix prior to considering fault boundary conditions is expressed as:
where , and respectively denote the positive-sequence, negative-sequence, and zero-sequence nodal voltage phasor matrices; , and represent the positive-sequence, negative-sequence, and zero-sequence injected nodal current phasor matrices; while , , and correspond to the positive-sequence, negative-sequence, and zero-sequence nodal admittance matrices.
Considering the electrical interconnections between sequence networks and the fault location, the node admittance matrix is augmented with two additional nodes—a ground node and a fault node—to represent boundary relationships. This expands the node voltage equation to a 3 × (n + 2) dimensional system. Subsequently, the zero-potential reference point in the positive-sequence network is eliminated to remove admittance matrix singularity, resulting in a final node voltage equation of dimension [3 × (n + 2) − 1], expressed as follows:
where (, ) represents the inter-sequence nodal admittance matrix, and denotes the intra-sequence nodal admittance matrix.
The computational processing after obtaining the network nodal voltage equations follows procedures similar to three-phase short-circuit fault analysis. Initial nodal voltage assumptions are made to determine the positive/negative sequence current outputs from renewable energy sources. Using the k-th iteration nodal voltages, the -th nodal injection currents are calculated. Combined with the nodal admittance matrix, these values compute the ( + 1)-th nodal voltages. This iterative process continues until all nodal voltages converge to specified precision thresholds. Although the matrix dimension is large, the inherent sparsity of the nodal admittance matrix and its invariance during iterations enable efficient computation. The process only requires a single matrix inversion calculation, achieving accelerated solving speeds through factorization table optimization techniques.
After iterating the nodal voltages to convergence precision, the fault current can be calculated using the above equation. The total current is then obtained by synthesising the sequence components.
where represents the sequence components of the line current phasor between nodes and ; and respectively denote the sequence components of the voltage phasors at nodes and ; while signifies the sequence impedances of the line between nodes and .
It is evident that the fault current expressions under asymmetric short-circuit fault scenarios exhibit formulation consistency with those under three-phase symmetrical fault conditions.
The short-circuit current obtained through the aforementioned analysis and calculation represents the steady-state current value after the fault. By substituting the current value during normal network operation before the fault and the steady-state current command value after the fault into Equation (8), the fault current of the new distribution system during the transient regulation process can be determined.
The full-time-domain analysis method proposed in this paper is applicable to High-Impedance Fault (HIF) scenarios. In HIF scenarios, the fault impedance exceeds three times the system’s zero-sequence impedance, resulting in a limited fault current magnitude. Furthermore, the voltage dip at the inverter’s PCC is minor, and the system voltage is maintained at a relatively high level, close to the pre-fault normal operating point [19]. Consequently, during the solution process, the initial and final values of the differential equations are similar, leading to high accuracy. The risks of oscillation and divergence during the solving process are low, and the proposed method demonstrates high convergence, enabling it to effectively describe the system’s transient process.
3. Short-Circuit Current Control Optimization
Based on the analysis of the transient characteristics of the new distribution system and the obtained fault current expression, it is necessary to further optimise the control of the new distribution system to limit the impact of short-circuit currents on the system. Conventional short-circuit current control measures often constrain the power transmission capacity of regional grids after implementation, thereby incurring additional system operational costs. While directly adjusting the control parameters of renewable energy units can avoid operational costs, it may weaken the system’s reactive power support capability, potentially compromising the transient voltage stability of the post-fault system. To this end, this paper comprehensively considers the adjustment amounts of the reactive current coefficient, the adjustment amounts of the maximum overloading factor for reactive current, and the dynamic active power regulation capability to construct a multi-objective control optimization decision model for short-circuit current.
3.1. Objective Function
The objective function of the multi-objective control optimization decision model for short-circuit current is shown in Equation (A1) in Appendix A. When solving multi-objective optimization problems, the weighting method is typically employed to transform them into a single-objective function for simplified resolution. However, when the numerical magnitudes of different objective functions differ significantly, a simple weighted summation may cause the objective with the larger magnitude to dominate the optimization direction, while the objective with the smaller magnitude may be weakened or even neglected. Therefore, it is necessary to first perform normalisation on each objective function to ensure all objective function values are within the same magnitude, thereby improving the effectiveness of weight allocation [20].
where denotes the normalised value of the -th sub-objective function; and represent the maximum and minimum values of the -th sub-objective function, respectively.
After normalising the different sub-objective functions, the corresponding weights need to be determined to obtain the final objective function. Common weight determination approaches include subjective and objective weighting methods. Subjective weighting methods [21] allow for the incorporation of expert experience, although they may arguably introduce a certain level of subjective bias. On the other hand, objective weighting methods [22] primarily rely on data properties to maintain objectivity, though they might not always fully capture specific decision-making intents and can be influenced by sample characteristics.
To achieve a better balance between subjective assessment and objective data analysis, this paper proposes an integrated weighting method combining the Fuzzy Analytic Hierarchy Process (FAHP) and the entropy weight method, aiming to address the varied nature of the optimization objectives. Considering that short-circuit current suppression is closely linked to grid safety, FAHP is utilized to prioritize system security based on expert judgment. Meanwhile, objectives regarding control costs and dynamic regulation capabilities are processed using the entropy weight method, which objectively captures the information from data distribution across different fault scenarios. This integrated approach seeks to harmonize safety considerations with the statistical attributes of the system state. The weight expression is as follows:
where denotes the weight determined by the Fuzzy Analytic Hierarchy Process; represents the weight determined by the entropy weight method; indicates the final weight obtained through the integrated weighting method. denotes the sensitivity factor.
Thus, the final objective function expression for the short-circuit current control optimization decision is obtained as:
where , , represent the normalised adjustment amount of the reactive current coefficient, the normalised adjustment amount function of the maximum overloading factor for reactive current, and the dynamic active power regulation capability.
3.2. Constraint Conditions
(1) Short-Circuit Current Safety Constraints
where denotes the short-circuit current of the line between nodes , ; represents the rated breaking current of the circuit breaker between nodes , ; indicates the set of system nodes.
(2) Renewable Energy Control Parameter Constraints
During the adjustment process, the reactive current coefficient and the maximum overloading factor for the reactive current of renewable energy units must be constrained within their allowable adjustable ranges.
where denotes the reactive current coefficient of the -th renewable energy unit to be adjusted; denotes the maximum overloading factor for reactive current of the -th renewable energy unit to be adjusted;
(3) Transient Node Voltage Stability Constraints
Following a transient fault in the system, the short-circuit current control measures adopted must ensure that node voltage requirements are met during both the transient process and the medium-to-long-term process after the disturbance.
where and denote the upper and lower limits of the voltage magnitude at the -th node, respectively.
3.3. Optimization Solution
The optimization of the short-circuit current control decision objective function derived in Equation (A1) constitutes a non-convex problem characterized by multiple local optima. Traditional intelligent algorithms such as Genetic Algorithm (GA) and Particle Swarm Optimization (PSO) are prone to premature convergence and frequently become entrapped in local extremums during the solution process. This limitation results in low computational efficiency, which fails to meet the stringent requirements of short-circuit current calculations. To address these challenges, this paper proposes an Improved Simulated Annealing-Particle Swarm Optimization (SA-IPSO) algorithm. By integrating the Metropolis acceptance criterion into the particle update mechanism, the proposed strategy enables the probabilistic acceptance of inferior solutions during the search. This stochastic feature effectively preserves population diversity and facilitates the escape from local optima, thereby ensuring convergence to the global optimum for accurate fault current suppression.
The Particle Swarm Optimization algorithm searches for the particle position that best satisfies the optimization objectives by means of particle movement within the feasible region. The velocity update formula for each particle is expressed as:
In the equation, denotes the inertia weight set during iteration; , represent the current velocity and updated velocity of the particle, respectively; , indicate the current position and updated position of the particle, respectively; , denote the learning factors of the particle.
The setting of particle velocity significantly influences the convergence speed of the algorithm. When the velocity value is large, the convergence speed increases, but it may overshoot the global optimal solution. Conversely, excessively small velocity may lead to slow convergence and a tendency to fall into local optima. To prevent the algorithm from becoming trapped in local optima, the Metropolis criterion of the Simulated Annealing (SA) algorithm is introduced to improve the algorithm. The criterion expression is as follows:
where denotes the difference between the objective function values of feasible solutions from two consecutive calculations.
To further enhance the convergence speed and precision of the algorithm, an adaptive inertia weight mechanism is introduced to replace the fixed inertia weight used in the traditional particle swarm optimization algorithm. The inertia factor reflects the degree of influence of the particle’s historical velocity on the current velocity update. The value of this factor directly affects the balance between the algorithm’s global exploration and local exploitation capabilities. Its expression is as follows:
where and denote the maximum and minimum values of the adaptive inertia weight; indicates the maximum number of iterations.
When a particle’s fitness exceeds the group’s average adaptive inertia weight, the inertia weight can be appropriately increased to enhance its independent search capability. Conversely, if a particle’s fitness is lower than the average adaptive inertia weight, its inertia weight is reduced, making it more inclined to follow the group in searching. During the initial iterations of the algorithm, a higher inertia weight can be set to maintain a strong global search capability. As iterations proceed, the group’s average fitness gradually increases and may even converge. At this point, appropriately reducing the inertia weight enhances the algorithm’s local search capability, further improving convergence precision and efficiency.
In summary, the SA-IPSO algorithm was developed. This algorithm is employed for the optimised control of short-circuit currents in the new distribution system, with its flowchart illustrated in Figure A2.
The control parameters optimized for the most severe operating conditions inherently provide a safety margin, ensuring that the short-circuit current remains continuously suppressed within safe limits even when fault impedance varies. Through the analysis using the phase plane method in Section 2.2, it can be observed that when the system operates within the stable region, its stability exhibits low sensitivity to minor variations in both steady-state current amplitude and proportional-integral parameters.
4. Simulation
To systematically validate the applicability and effectiveness of the proposed calculation method, a simulation benchmark representing a typical new distribution system was constructed in SIMULINK, as illustrated in Figure 2. This network topology serves as a foundational test platform for assessing fault transient characteristics under high renewable penetration. The specific system components are defined as follows: represents the system potential; denotes the photovoltaic generation unit; signifies the wind turbine generation unit; and corresponds to the system load.
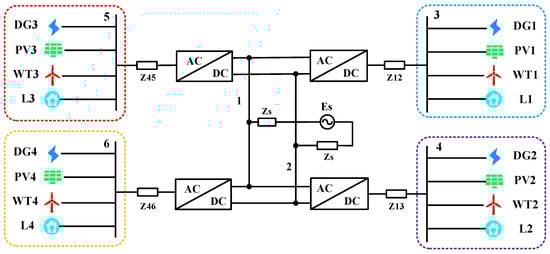
Figure 2.
New distribution system network topology diagram.
The new distribution system is tested based on a 10 kV voltage level and a 50 Hz power frequency standard. The AC inverter-based sources are modelled using an ideal balanced node model; under fault conditions, they are equivalently represented by a subtransient model. The system is configured with four photovoltaic generation units and four wind power generation units, each with a rated capacity of 1 MW. The control system adopts a d-axis oriented control strategy based on the voltage at the PCC, with the objective of complete suppression of negative-sequence current. Detailed electrical parameters of the system components are listed in Table 3.
Table 3.
Network System Parameters.
When performing transient analysis on the new distribution system, it is necessary to first conduct a power flow calculation for the new distribution network, as key parameters such as the subtransient electromotive force of synchronous generators need to be determined based on steady-state conditions, and the transient response characteristics of renewable energy inverter-based sources are directly related to their steady-state operating conditions. During the power flow calculation, both renewable energy inverter-based sources and system loads are modelled as PQ nodes. The system power flow, computed using a MATLAB program, converges after 6 iterations, with the results presented in Table 4. In the table, and represent the calculated and simulated root-mean-square (RMS) values of nodal voltages, respectively; denotes the nodal voltage error (all values in per-unit system); and correspond to the calculated and simulated values of nodal voltage phase angles, respectively.
Table 4.
Steady-State Calculated vs. Simulated Results.
A three-phase short-circuit fault with a transition resistance of 3.8 Ω was set at Node 3, and an iterative calculation model was employed for analysis on the MATLAB platform. With the convergence threshold set at the 10−4 level, the node voltages across the entire network reached a converged state after 6 iterations. A comparative analysis of the MATLABR2022b numerical solutions and SIMULINKR2022b transient simulation results is presented in Table 5 and Table 6. The voltage magnitude deviations at all nodes in the network did not exceed 0.02 per unit, and the branch current errors were controlled within 0.15 per unit. The simulation data demonstrate that the proposed algorithm achieves high computational accuracy, meeting the requirements for engineering analysis.
Table 5.
Calculated and Simulated Voltage Results During a Three-Phase Short-Circuit at Node 3.
Table 6.
Calculated and Simulated Current Results During a Three-Phase Short-Circuit at the Bus of Node 3.
To verify the applicability of the proposed calculation method under severe black swan event scenarios in the new distribution system, a line break fault was set at the PCC of Node 4, causing Node 4 to operate in an islanded state. Based on this condition, a single-phase short-circuit fault was set at the photovoltaic grid connection point of Node 4. Following the method proposed earlier, iterative calculation was performed for the islanded system at Node 4. Using the same calculation parameters as before, the voltages of the busbars and grid connection points within the system converged after 4 iterations. This allowed for the calculation of the short-circuit current value at the photovoltaic grid connection point. To visually corroborate the analytical accuracy, the trajectories of the short-circuit current command, simulation results, and calculated values in the coordinate system were plotted, as shown in Figure 3. This comparative analysis serves to validate the consistency between the theoretical model and the simulation benchmark under islanded conditions.
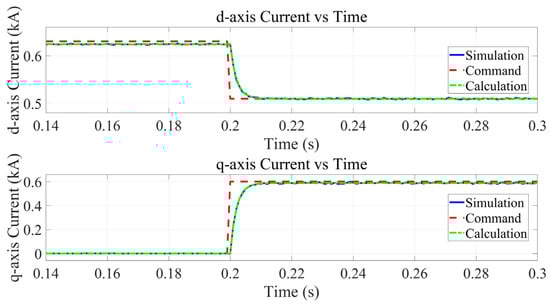
Figure 3.
Transient current characteristics at the PV grid connection point in an islanded system.
As can be observed from the figure, at the fault occurrence time of 0.2 s, the current command value undergoes a step change. The actual output short-circuit current converges exponentially toward the command value. The simulated and calculated values of the short-circuit current achieve high-precision fitting, verifying the applicability of the proposed method in islanding scenarios of the new distribution system.
According to the mathematical derivations in Section 2.2, the phase trajectory of the error signal is theoretically characterized by a linear function. To validate this, the time-domain waveforms of the -axis current deviations were obtained through simulation, as shown in Figure 4. These deviation signals serve as the necessary input for the phase plane reconstruction. Subsequently, the signals were denoised and differentiated to generate the phase plane plot depicted in Figure 5. The resulting trajectory reveals a distinct linear relationship between the deviation and its derivative, which empirically confirms the consistency between the simulation results and the theoretical conclusions derived in Section 2.2.
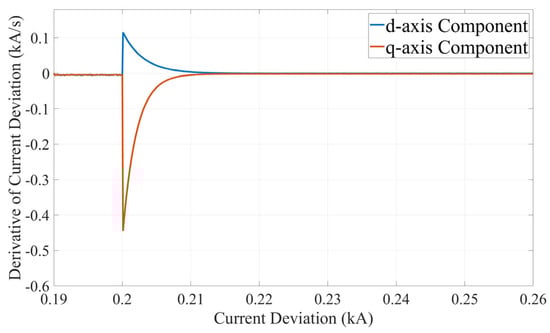
Figure 4.
Waveform diagram of current deviation pre-/post-fault.
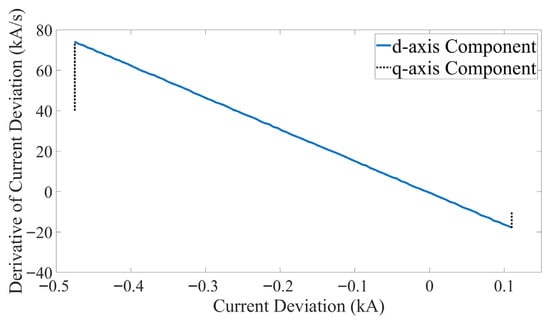
Figure 5.
Phase plane diagram of current deviation and its derivative.
To assess the algorithm performance under different fault conditions, a composite fault scenario was simulated at the grid connection point of the Node 5 wind turbine. The sequence involved a single-phase-to-ground fault at 0.05 s, followed by a two-phase short-circuit-to-ground fault with transition impedance at 0.28 s. The resulting bus voltage waveform at Node 5 is shown in Figure 6. As observed, after the single-phase fault at 0.05 s, the voltage of the non-faulted phases rises to approximately 1.73 times the nominal value, which is consistent with the theoretical characteristics of effectively grounded systems. Additionally, the minor waveform distortion appearing after 0.28 s corresponds to the random fluctuations in transition resistance. These observations verify that the model effectively captures voltage dynamics during complex fault sequences. Subsequently, the investigation was extended to High-Impedance Fault scenarios characterized by weak currents. Given that such faults predominantly manifest as single-phase grounding events [19], the simulations were configured with typical transition resistances of 1000 Ω and 3000 Ω. As detailed in Table 7, the resulting fault current magnitudes decreased significantly to approximately 0.10 p.u. and 0.035 p.u., respectively. Crucially, the minimal voltage sag at the PCC during these events ensures that the system voltage remains close to pre-fault levels and the inverter control system operates within a near-linear region. This condition facilitates rapid algorithmic convergence, enabling the full-time-domain method to maintain exceptional accuracy with absolute errors within 0.002 p.u., despite the weak signal intensity.
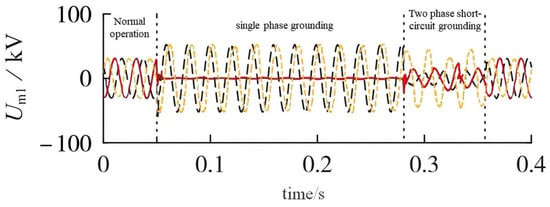
Figure 6.
Bus voltage waveform diagram of Node 5.
Table 7.
Calculated and Simulated Current Results of Bus 5 Under Various Short-Circuit Faults.
To further accurately characterise the dynamic characteristics of short-circuit currents in new energy inverter-based power supplies, it is necessary to extend the analysis beyond steady-state fault conditions and perform transient current tracking. Experimental parameters were configured with the current inner loop proportional coefficient = 0.018 Ω, integral coefficient = 0.042 Ω/s, fault duration set to 0.6 s, and PWM carrier frequency adjusted to 6 kHz. Given that transient power references are determined by the depth of voltage sag at the grid connection point, and current references are jointly resolved from power commands and real-time voltage measurements, the voltage outer loop parameters exhibit negligible influence on transient current characteristics.
To analyze the dynamic characteristics of current responses in the synchronous rotating coordinate system, a synchronized comparison framework for d-q axis current command values, simulated values, and theoretical values was established, as shown in Figure 7. The control system achieves real-time current command reconstruction based on power-voltage coupling relationships, with the SIMULINK simulation data exhibiting exponential dynamic tracking characteristics. The current trajectories calculated by the proposed algorithm correspond closely to the transient process measurement data, indicating that the method effectively characterizes the transient evolution patterns of fault currents.
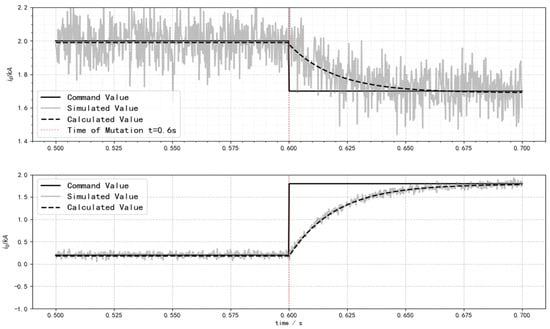
Figure 7.
Dynamic characteristics of transient current curves.
In order to assess the scalability and real-time feasibility of the proposed method in larger grids, comparative tests on computational efficiency were conducted against the traditional EMT simulation method using distribution networks ranging from 6 to 33 nodes. The topology of the test networks is consistent with the structure shown in Figure 2. Figure 8 illustrates the computation time required by both methods across different node scales. It can be observed that as the system size expands, the computation time for the traditional EMT method exhibits an exponential growth trend, which is primarily attributable to the increased computational load of step-by-step numerical integration. In contrast, the proposed full-time-domain analysis method maintains a stable and moderate linear increase in calculation time. Regardless of the node expansion, the total execution time remains within a manageable range. These results indicate that the proposed method effectively reduces computational complexity, supporting its feasibility for real-time applications in large-scale distribution networks.
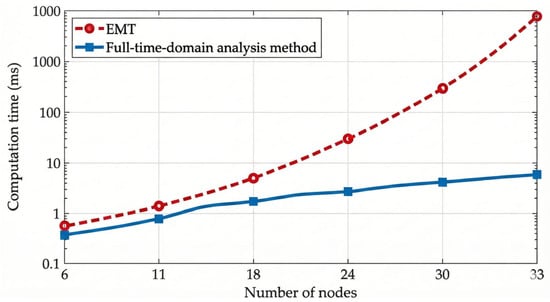
Figure 8.
Efficiency Comparison of Different Transient Calculation Methods.
To further optimize the control of the new distribution system and mitigate the impact of short-circuit currents, a sensitivity adjustment factor was introduced into the comprehensive weight calculation to regulate the final weight allocation and identify the optimal control strategy. Figure 9 illustrates the variation in the suppressed short-circuit current amplitude with respect to this sensitivity factor. It can be observed that the optimal suppression effect is attained when the factor is approximately 0.48. At this specific operating point, the reactive current coefficient is configured as 1.4, the maximum overloading factor for reactive current is set to 1.2, and the system dynamic active power regulation coefficient is 1.04. This optimized control configuration was applied to the transient short-circuit currents listed in Table 7, with the detailed results presented in Table 8.
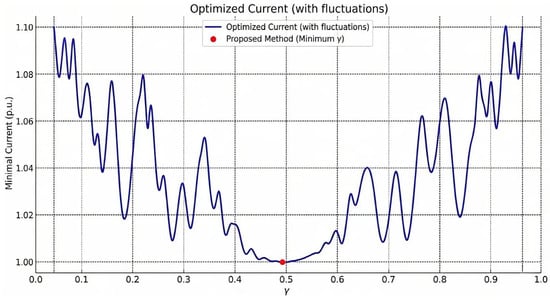
Figure 9.
The per-unit value of post-control short-circuit current under different sensitivity factors.
Table 8.
The result of short-circuit current optimization control.
As can be seen from Table 8, through the optimised control of the new distribution system, the transient short-circuit currents under different operating conditions are significantly reduced, validating the effectiveness of the proposed optimization control method. Meanwhile, it is noted that even as the factor deviates from the optimal point, the overall control performance exhibits high stability; the fluctuation in the short-circuit current amplitude remains limited, not exceeding 1.1 times the minimum value. These results indicate that the proposed optimization strategy maintains effective control performance despite parameter variations, thereby substantiating the robustness of the weight determination method.
To quantitatively evaluate the optimization performance of the proposed SA-IPSO algorithm, a comparative analysis was performed against the traditional GA and the standard PSO. The test scenario was configured as a single-phase fault occurring at 0.06 s, which is consistent with the conditions listed in Table 7. As evidenced by the convergence trajectories in Figure 10, the proposed SA-IPSO algorithm demonstrates superior search efficiency, particularly characterized by rapid convergence during the initial iterative phase. While standard PSO algorithms often risk premature stagnation due to diminishing population diversity, the SA-IPSO strategy effectively mitigates this issue through the Metropolis acceptance criterion derived from simulated annealing. This mechanism enables the algorithm to probabilistically escape local optima, facilitating more robust global exploration and ultimately yielding a more favorable objective function value. Collectively, these results indicate that the SA-IPSO algorithm outperforms traditional GA and PSO methods in terms of both solution accuracy and convergence stability.
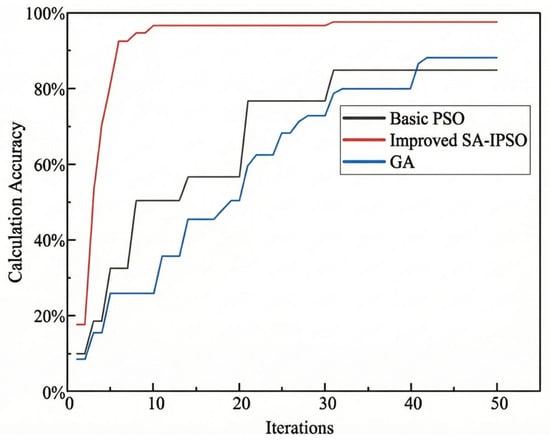
Figure 10.
Accuracy Comparison of Transient Current Control Algorithms.
For the purpose of assessing the practical applicability and real-time performance of the proposed algorithm, a Controller-Hardware-in-the-Loop (CHIL) test platform based on RTDS was established, as illustrated in Figure 11. The experimental configuration is consistent with the scenarios described in Figure 6. Specifically, a single-phase-to-ground fault was initiated at the grid connection point of the wind turbine at Node 5 at 0.05 s, followed by a two-phase short-circuit-to-ground fault involving transition impedance at 0.28 s. The dynamic bus voltage waveforms captured from the hardware-in-the-loop (HIL) test are presented in Figure 12. It can be observed that the voltage trajectories measured in the hardware environment exhibit a high degree of consistency with the software simulation results under different fault conditions. These results support the validity of the proposed full-time-domain calculation method and suggest its capability to maintain computational accuracy within real-time hardware constraints.
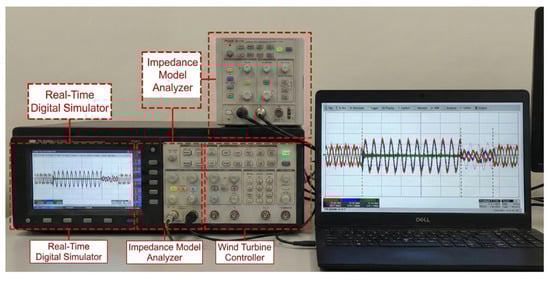
Figure 11.
CHIL test system.
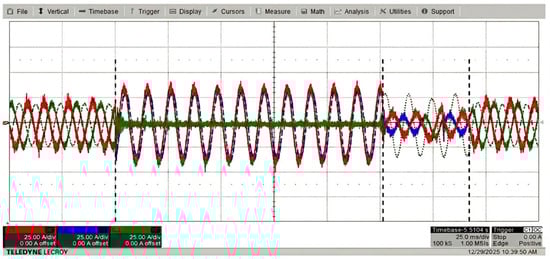
Figure 12.
HIL Testing Waveform Verification Diagram.
5. Conclusions
To address the applicability issues of traditional short-circuit current calculation methods in new distribution systems, this paper proposes a transient current calculation method for new distribution systems based on a full-time-domain analysis approach. This method utilises phase plane analysis to resolve the nonlinear control regions of inverter-based sources within the system, constructs the transient current expression across the full-time-domain scope by integrating control strategies and transient characteristic differential equations, and further implements optimization control. Through theoretical analysis and simulation verification, the following conclusions can be drawn:
(1) A dynamic model of renewable energy inverter-based sources accounting for current loop saturation effects was established. This model can effectively analyse the transient characteristics in the nonlinear regions of the new distribution system, resolving the challenge that traditional methods face in handling nonlinear components.
(2) A fault current calculation method based on full-time-domain analysis was proposed. By iteratively solving the steady-state operating point after a fault and combining control strategies with transient differential equations, an analytical expression for the fault current covering the entire time domain was constructed, achieving accurate calculation of the fault current in renewable energy distribution systems.
(3) Addressing the need for short-circuit current suppression, a multi-objective optimization control strategy involving renewable energy units was proposed. An optimization model balancing current limitations and system stable operation was established, and an Improved Simulated Annealing-Particle Swarm Optimization (SA-IPSO) hybrid algorithm was adopted for efficient solution, forming a feasible coordinated control scheme. The magnitude of the optimised system short-circuit current was significantly reduced.
Author Contributions
Conceptualization, W.S.; Methodology, D.J. and K.L.; Software, K.L.; Validation, C.L.; Formal analysis, X.Y.; Resources, K.L.; Data curation, X.Y.; Writing—original draft, W.S.; Writing—review and editing, W.S.; Visualization, Q.H.; Funding acquisition, D.J. All authors have read and agreed to the published version of the manuscript.
Funding
This research was funded by State Grid Corporation of China under grant number 5400-202355767A-3-5-YS.
Data Availability Statement
Data is contained within the article.
Conflicts of Interest
Authors Wanxing Sheng, Xiaoyu Yang, Dongli Jia and Keyan Liu were employed by the China Electric Power Research Institute. The remaining authors declare that the research was conducted in the absence of any commercial or financial relationships that could be construed as a potential conflict of interest.
Appendix A

Figure A1.
Steady-State Voltage and Current Calculation Flowchart.

Figure A2.
Algorithm Optimization Solution Flowchart.
References
- Xiao, Q.; Woo, J.; Song, L.; Xu, B.; Lubkeman, D.; Lu, N.; Mohammed, A.S.; Enslin, J.; Chacko, C.D.; Sico, K.; et al. Assessment of Transmission-level Fault Impacts on 3-phase and 1-phase Distribution IBR Operation. In Proceedings of the 2024 IEEE Power & Energy Society General Meeting (PESGM), Seattle, WA, USA, 21–25 July 2024. [Google Scholar] [CrossRef]
- Sun, S.; Zhou, G.; Song, Y.; Tang, X.; Zhou, Y.; Yuan, Z. Research on Measures to Limit Short-Circuit Current by Changing the Structure of the Power Grid. Energies 2025, 18, 2098. [Google Scholar] [CrossRef]
- Alaraifi, S.; Djouadi, S.; El Moursi, M.S. Domain of Stability Characterization for Power Systems: A Novel Individual Invariance Method. IEEE Trans. Power Syst. 2024, 39, 14–27. [Google Scholar] [CrossRef]
- Fresia, M.; Minetti, M.; Bonfiglio, A.; Procopio, R. Short circuit analysis and voltage support needs in power systems with relevant share of inverter-based resources. Sustain. Energy Grids Netw. 2025, 44, 102055. [Google Scholar] [CrossRef]
- Son, D.; Han, S. Development of Bus and Line Control Method for Short-Circuit Current Reduction Using Genetic Programming. Energies 2022, 15, 678. [Google Scholar] [CrossRef]
- Tang, Y.; Luo, G.; Pu, Y. Short-circuit calculation approach of grids with high proportion of inverter-interfaced generator stations. Electr. Power Syst. Res. 2025, 241, 111407. [Google Scholar] [CrossRef]
- Wang, Z.; Huang, R.; Wu, Z.; Dong, C.; Xu, X.; Chen, Y. Modeling and Analysis of Transient Synchronous Stability for Grid-Forming Inverter. In Proceedings of the 2024 IEEE 8th Conference on Energy Internet and Energy System Integration (EI2), Shenyang, China, 29 November–2 December 2024. [Google Scholar] [CrossRef]
- Qin, B.; Liu, W.; Li, H.; Ding, T.; Ma, K.; Liu, T. Impact of System Inherent Characteristics on Initial-Stage Short-Circuit Current of MMC-Based MTDC Transmission Systems. IEEE Trans. Power Syst. 2022, 37, 3913–3922. [Google Scholar] [CrossRef]
- He, Q.; He, G.; Li, Z.; Lin, M.; Zhang, G.; Li, X. Pilot Protection Based on Zero-Sequence Current Resistance-Capacitance Component for Large-Scale Inverter-Interfaced Power Stations. Sustainability 2022, 14, 13268. [Google Scholar] [CrossRef]
- Sheng, Y.; Wang, B.; Yu, H.; Li, L.; Liu, Y.; Zhang, L. An Overview of Fault Identification Techniques in Power Distribution Networks: Methods and Models. IET Conf. Proc. 2023, 2023, 192–198. [Google Scholar] [CrossRef]
- Sun, J.; Sun, H.; Jiang, J. An improved modulation method for low common-mode current non-isolated series simultaneous power supply dual-input inverters for new energy generation applications. Electr. Eng. 2024, 106, 5153–5163. [Google Scholar] [CrossRef]
- Niu, S.; Wu, J.; Li, C.; Duan, C.; Hao, Z. Optimizing Fault-Ride-Through Strategies of Renewable Generation for the Enhancement of Power System Transient Stability and Security. Energies 2025, 18, 5986. [Google Scholar] [CrossRef]
- Xin, M.; Li, H.; Lv, S.; Zheng, C. Analysis of the impact of large-scale centralized integration of grid-forming energy storage system on short-circuit currents. Zhejiang Electr. Power 2024, 43, 58–66. [Google Scholar] [CrossRef]
- Xu, W.; Li, Y.; Liu, C.; Xiang, Z.; Han, B. Peak short-circuit current calculation of PMSG considering PI controller saturation characteristic. CSEE J. Power Energy Syst. 2024, 1–11, Early Access. [Google Scholar] [CrossRef]
- Ke, I.A.; Ying, L.I.; Jiajing, K.O. Fault Dynamic Behaviors Analysis and Practical Peak Short-circuit Current Calculation of Wind and Solar Power Sources. Dianwang Jishu/Power Syst. Technol. 2024, 48, 830–840. [Google Scholar]
- Jia, J.; Yang, G.; Nielsen, A.H.; Rønne-Hansen, P. Impact of vsc control strategies and incorporation of synchronous condensers on distance protection under unbalanced faults. IEEE Trans. Ind. Electron. 2018, 66, 1108–1118. [Google Scholar] [CrossRef]
- Carrella, A.; Ewins, D.J. Identifying and quantifying structural nonlinearities in engineering applications from measured frequency response functions. Mech. Syst. Signal Process. 2011, 25, 1011–1027. [Google Scholar] [CrossRef]
- Guo, X.; Yang, G.; Zhang, Y.; Yan, X.; Zhou, Y.; Zang, T. Impedance Modeling and Small-signal Stability Mechanism Analysis of Grid-forming Energy Storage and Grid-following PV Hybrid Power Generation System. J. Electr. Eng. 2025, 20, 299–308. [Google Scholar] [CrossRef]
- Reiz, C.; Leite, J.B. Hardware-In-the-Loop Simulation to Test Advanced Automation Devices in Power Distribution Networks. IEEE Trans. Power Deliv. 2020, 36, 2194–2203. [Google Scholar] [CrossRef]
- Tanyimboh, T.T.; Czajkowska, A. Self-Adaptive Solution-Space Reduction Algorithm for Multi-Objective Evolutionary Design Optimization of Water Distribution Networks. Water Resour. Manag. 2018, 32, 3337–3352. [Google Scholar] [CrossRef]
- Bin, C.; Xiaohui, L.; Haowu, L.; Leijiao, G. Hybrid subjective and objective evaluation method of the equipment for first class distribution network. Energy Procedia 2019, 158, 3452–3457. [Google Scholar] [CrossRef]
- Liu, Z.; Xie, Q.; Dai, L.; Wang, H.; Deng, L.; Wang, C.; Zhang, Y.; Zhou, X.; Yang, C.; Xiang, C.; et al. Research on comprehensive evaluation method of distribution network based on AHP-entropy weighting method. Front. Energy Res. 2022, 10, 975462. [Google Scholar] [CrossRef]
Disclaimer/Publisher’s Note: The statements, opinions and data contained in all publications are solely those of the individual author(s) and contributor(s) and not of MDPI and/or the editor(s). MDPI and/or the editor(s) disclaim responsibility for any injury to people or property resulting from any ideas, methods, instructions or products referred to in the content. |
© 2026 by the authors. Licensee MDPI, Basel, Switzerland. This article is an open access article distributed under the terms and conditions of the Creative Commons Attribution (CC BY) license.