Abstract
This paper presents a comprehensive techno-economic assessment of a community battery energy storage system (BESS) participating concurrently in energy arbitrage and frequency control ancillary services (FCAS) markets, while also providing customer savings through coordinated demand management. The proposed framework employs a mixed-integer linear programming (MILP) model to co-optimize the charging, discharging, and reserve scheduling of the battery under dynamic market conditions. The model explicitly incorporates key operational and economic factors such as round-trip efficiency, degradation cost, market-participation constraints, and revenue from multiple value streams. By formulating the optimization problem within this MILP structure, both the operational feasibility and the economic profitability of the system are evaluated over annual market cycles. Simulation results demonstrate that integrating FCAS participation with conventional energy arbitrage substantially enhances total revenue potential and improves asset utilization, compared with single-service operation. Furthermore, the coordinated management of community demand contributes to additional cost savings and supports local grid reliability. The findings highlight the critical role of co-optimized control and multi-market participation strategies in improving the financial viability and grid-support capabilities of community-scale BESS deployments.
1. Introduction
Community battery energy storage systems (BESS) are emerging as a flexible and cost-effective solution to support distribution networks with high penetrations of rooftop photovoltaic (PV) generation. Renewable energy sources such as solar and wind are inherently variable and intermittent, which can lead to mismatches between generation and local demand, and pose challenges for grid stability. By integrating BESS with renewable energy, excess generation can be stored during periods of high output and discharged when demand is high or generation is low. This improves the utilization rate of renewable energy, ensures more stable and reliable electricity supply, and supports grid services such as frequency regulation and peak demand management [1]. Unlike utility-scale storage assets, community batteries are strategically located within residential neighbourhoods, enabling direct interaction with both wholesale electricity markets and local customers. This dual role positions community batteries as a promising mechanism for enhancing local reliability, reducing household electricity costs, and unlocking new market value streams such as energy arbitrage and frequency control ancillary services (FCAS).
With increasing variability in electricity prices and tightening requirements for frequency support, there is growing interest in optimizing BESS participation across multiple markets simultaneously.
Previous studies have explored BESS participation in energy arbitrage (EA) and frequency regulation (FCAS) using various optimization and control approaches. Multi-time-scale dynamic programming (DP) frameworks explicitly model the nested decision-making of EA and FCAS [2], but suffer from the dimensionality problem, high computational burden, and simplified battery models that may not fully capture degradation or efficiency nonlinearities. Deep reinforcement learning (DRL) and PPO-based RL approaches extend DP to handle stochastic, multi-timescale problems and can learn joint bidding strategies that increase profitability compared to separate markets [3,4]. However, RL methods require large training datasets, may overfit historical patterns, and often model battery degradation only partially, limiting real-world applicability.
Empirical analyses using real market data, such as grid-scale BESS in the Australian NEM, demonstrate that FCAS can dominate revenue in some regions while energy arbitrage is more lucrative in others [5,6]. These studies are often policy-focused or rely on pre-defined strategies rather than fully optimized or learned control policies, constraining their generalizability. Other optimization-based approaches, such as genetic algorithms (GA) for PV-battery systems, allow co-optimization of arbitrage and frequency containment reserve while considering battery ageing and PV degradation [7]. GA and other heuristic methods can be computationally expensive and sensitive to assumptions regarding battery cost, market prices, and charging constraints.
Several studies investigate multi-service and hybrid storage systems, highlighting the benefits of co-optimization across arbitrage, regulation, peak shaving, and contingency reserve. Surveys and reviews provide the conceptual framework for multi-use storage [8,9] but do not provide detailed operational strategies. Specific approaches include hybrid energy storage scheduling for peak shaving and frequency regulation [10], co-located behind-the-metre storage optimization for multiple services [11], and M5Use, a multi-use scheduling framework for large-scale BESS beyond just EA and FCAS [12]. While these frameworks demonstrate the potential for flexible multi-service operation, they often rely on simplified battery models, stylized market assumptions, or lack validation with real data.
Other studies show practical strategies for joint operation: peak shaving combined with frequency regulation can achieve superlinear gains, where the combined benefit exceeds the sum of individual services [13]. Co-optimization frameworks analyzing cost versus FCAS trade-offs using Pareto fronts provide insights for system operation decisions [14], while methods incorporating contingency reserve alongside energy arbitrage adjust dispatch and SOC constraints to ensure reliability [15]. Advanced BESS optimization techniques provide guidance on trade-offs and operational constraints across multiple markets [16], though some abstract away detailed market mechanisms or focus broadly on “smart” BESS operation rather than specific EA and FCAS co-optimization.
Despite these advances, three critical gaps remain:
- Existing frameworks rely on computationally intensive methods (e.g., DP, GA, DRL) or simplified battery models that do not explicitly internalize degradation cost and efficiency losses, limiting operational tractability for long-horizon planning.
- Prior studies predominantly focus on grid-scale or behind-the-metre systems, rarely quantifying the economic interaction between wholesale market participation and coordinated community-level demand management.
- Many empirical analyses are descriptive or policy-oriented and do not provide a unified, optimization-based framework capable of simultaneously scheduling arbitrage, FCAS reserves, and community-demand services under realistic operational constraints.
This study advances the state of knowledge by addressing these gaps through the development of a scalable mixed-integer linear programming (MILP) framework that co-optimizes energy arbitrage, FCAS provision, and coordinated community demand management within a single operational model. Unlike DP-, GA-, or DRL-based approaches, the proposed MILP formulation is computationally tractable for long-horizon annual studies, explicitly incorporates battery efficiency and degradation cost, and captures multi-market participation constraints in a unified decision-making structure. Furthermore, this work quantitatively demonstrates how a community-scale BESS can simultaneously generate wholesale market revenue and deliver measurable customer-level savings, thereby linking system-level profitability with end-user value. The results provide new empirical evidence on the super-additive benefits of co-optimized multi-service operation for community batteries, offering a practical pathway for market-ready deployment and regulatory evaluation. To reflect real-world deployment conditions, the framework is formulated under a commercially driven third-party ownership model, capturing the operational incentives, revenue streams, and cost responsibilities that such operators face in deploying community-scale batteries.
2. Commercially Driven Third-Party Ownership of Community Batteries
In this study, the BESS is owned and managed by a private commercial operator whose primary objective is profit maximization. The system is dispatched purely to exploit market price volatility across energy and FCAS markets, with no direct consideration of community cost savings or equitable benefit distribution. The optimization framework for this model focuses on maximizing total annual revenue while accounting for degradation costs, efficiency losses, and market participation fees. This scenario represents a fully market-driven deployment pathway, providing insight into the commercial attractiveness of community-scale batteries when operated under competitive conditions and without regulatory or social constraints.
3. Methodology
3.1. Battery Energy Storage Modelling
Battery degradation in lithium-ion systems arises from both cycling and calendar ageing, reducing usable capacity over time. The linear degradation formulation adopted in this study is intended as an economic proxy for battery ageing rather than a detailed electrochemical model. Its primary advantage is computational tractability: by expressing capacity fade as a linear function of energy throughput and time, the degradation process can be directly embedded within a mixed-integer linear programming framework without introducing non-convexities or additional state variables. This is essential for solving year-long, multi-market co-optimization problems involving energy arbitrage, FCAS provision, and coordinated community demand management. However, this approach does not explicitly capture nonlinear ageing effects such as rate-dependent degradation, temperature dependence, SOC-window stress, or accelerated fade at high C-rates that are represented in physics-based or temperature-coupled ageing models. As such, the model should be interpreted as a first-order approximation suitable for techno-economic analysis and comparative studies, rather than a high-fidelity lifetime prediction tool. Future work will extend the framework to incorporate SOC- and temperature-dependent degradation functions while maintaining computational scalability. A robust parameter estimation framework for batteries can provide a computationally efficient solution for lithium battery nonlinear degradation modelling. Although the proposed framework considers only steady-state power constraints, the actual delivery of FCAS relies on the fast dynamic response of the power electronic interface. Future work can integrate advanced inverter control strategies, such as voltage–power self-coordinating control methods, to enhance sub-second regulation accuracy, improve frequency support performance, and reduce the risk of grid voltage fluctuations during FCAS operation.
3.1.1. Cycle-Based Degradation
The cycling-induced degradation is modelled by mapping the energy throughput to Remaining Useful Life (RUL) loss. At each hour , the incremental RUL loss is computed as
where is the total number of cycles to reach the end-of-life (EOL) at a given Depth of Discharge (DOD), and is the nominal battery capacity. The cumulative RUL loss is then converted into capacity fade:
Here, is the battery capacity at EOL, set at 80% of the nominal capacity to reflect the onset of accelerated degradation.
A sensitivity analysis was conducted to evaluate the impact of battery cycle life () on end-of-year state of health (SOH), degradation cost, and net profit. As increased from 3000 to 7000, SOH improved from 96.28% to 98.41%, while degradation cost decreased from AUD 116,056 to AUD 49,740. Correspondingly, net profit rose from AUD 429,420 to AUD 495,735. This trend occurs because a higher cycle life spreads the degradation over more energy throughput, reducing the marginal cost of cycling and allowing more aggressive market participation. The analysis indicates that a cycle life of 5000 strikes a practical balance, as it maintains a realistic end-of-year SOH of approximately 97.8% close to the typical operational threshold for avoiding accelerated degradation while achieving strong economic performance. These relationships are clearly illustrated in the sensitivity plot in Figure 1, where net profit and SOH both increase with , highlighting the trade-off between operational revenue and battery longevity.
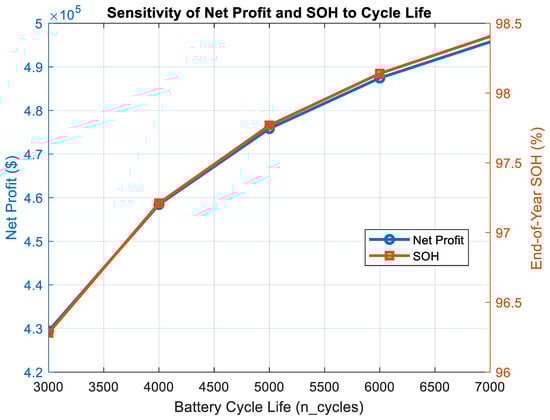
Figure 1.
Effect of battery cycle life ( on net profit and end-of-year SOH.
3.1.2. Calendar Degradation
In addition to cycling, calendar ageing is incorporated to account for capacity loss when the battery is idle. Experimental studies indicate that Li-ion batteries stored at approximately 40–50% SOC lose about 0.005% of their nominal capacity per day. This fixed daily degradation is applied uniformly, contributing to the total capacity fade and influencing operational decisions that balance revenue generation against ageing.
where is the initial battery capacity.
3.1.3. Total Degradation
The total capacity fade at each time step is the sum of cycle and calendar contributions:
The battery’s State of Health (SOH) at the end of the scheduling horizon is
where includes both cycle and calendar degradation, and is the initial capacity.
The end-of-horizon SOH is monetised as a degradation cost term:
where is the replacement or augmentation cost of the battery. This degradation cost is incorporated into the objective function to ensure that lifetime usage of the battery is optimally balanced against short-term revenue maximization.
3.2. Battery Energy Storage CAPEX Assessment
The capital expenditure (CAPEX) of the battery energy storage system (BESS) is estimated based on the installed energy capacity and unit cost , expressed as
For lithium-ion batteries, a representative cost of AUD 780/kWh is considered [17] including balance of system cost (BOS). An interest rate of 8% per annum is used for annualized capital cost calculations [18]. This reflects expected financing costs for grid-scale BESS projects. The 10-year life assumption provides a baseline for modelling revenue, degradation, and operational costs, while longer project lifetimes (e.g., 20 years) may be achieved through capacity maintenance agreements or upgrades [19]. The total CAPEX is annualized over the expected battery lifetime using the capital recovery factor (CRF), which incorporates the interest or discount rate :
operational expenditure (OPEX) for the battery is modelled as a fixed annual cost per unit of installed energy capacity. Following Australian project practice and prior community battery studies, an OPEX of AUD 16/kWh is adopted [20] which includes both maintenance and dynamic response-related operational costs.
3.3. FCAS Price Formulation
The community battery can generate income by participating in Frequency Control Ancillary Services (FCAS) markets. FCAS provides compensation for the battery’s ability to rapidly adjust its power output to support grid frequency stability. The two primary categories of FCAS are Raise (increase generation or reduce demand during frequency drops) and Lower (reduce generation or increase demand during frequency rises).
All energy and FCAS market data used in this study were obtained from the Australian Energy Market Operator (AEMO) public datasets for the Queensland (QLD) region for the 2024 calendar year. The dataset includes Raise 6 s, Raise 60 s, Raise 5 min, and their corresponding Lower services [21]. For each interval, the total Raise and Lower FCAS prices were calculated by summing the respective market components. While each market is cleared independently in the NEM, batteries can technically offer capacity in multiple FCAS markets simultaneously, subject to operational constraints such as available charge/discharge capacity and state-of-charge limits. This aggregation provides a tractable estimate of the total revenue potential from FCAS participation.
For each time interval, the available discharge and charge capacities are defined as
where is the battery’s rated power, and and are the scheduled discharge and charge powers, respectively. These expressions ensure that the sum of energy and FCAS dispatches does not exceed the technical limits of the system.
The corresponding FCAS revenues are then computed by multiplying the available reserve capacity with the market clearing price for each service and integrating over time:
There, and denote the Raise and Lower FCAS prices at time , and is the simulation time step (30 min in this study). The total FCAS revenue is then obtained as
3.4. Energy Arbitrage (EA)
The community battery participates in energy arbitrage by buying and selling electricity with both the wholesale grid and local customers. Specifically, the battery can discharge energy to the grid () or to local customers (), and charge from the grid () or from customers with excess PV generation (), The total revenue from energy arbitrage, , is therefore expressed as
There, and are the energy prices for the grid and local customers, respectively; and represent additional network or local tariffs applied to energy flows.
This formulation captures the bidirectional flow of energy, allowing the battery to maximize revenue by charging when prices are low and discharging when prices are high, both at the grid and community-level transactions. Wholesale energy prices are obtained at 5 min resolution and aggregated to a half hourly time step prior to optimization to align with the scheduling horizon [22].
3.5. Network Support Revenue
Community batteries can provide network support by reducing peak demand on the distribution system, thereby deferring network upgrades and reducing associated costs. The battery achieves this by discharging during periods of high local demand, effectively lowering the net load seen by the network operator.
The revenue from network support, , is estimated as
where is the reduction in peak demand achieved by the battery; is the avoided cost of network capacity; is the number of peak hours over the considered period.
3.6. Battery Throughput Incentives
Battery throughput incentives reward the total energy cycled through the storage system, promoting operational flexibility and asset utilization. In this study, throughput revenue is calculated based on the battery’s energy flows both to and from the grid and local customers. The total throughput incentive revenue is computed as
where is the incentive rate. In this study, an incentive rate of AUD 3/MWh is assumed.
This formulation captures all energy movements into and out of the battery, reflecting the full operational activity. Applying a throughput incentive ensures the battery is actively cycled, which can enhance revenue from energy arbitrage and ancillary services by maintaining system flexibility.
3.7. Regulatory and Market Fees
The Australian Energy Market Operator (AEMO) recovers the costs of operating the National Electricity Market through regulated participant fees (), including market customer fees levied on a per-MWh and per-connection-point basis, wholesale participant allocations, and ancillary service-related cost-recovery mechanisms. According to AEMO’s FY26 Budget and Fees determination, total NEM core revenue requirements exceed AUD 220 million annually and are allocated across energy and ancillary service market participants in proportion to their level of participation [23]. While the exact regulatory cost borne by a community battery depends on its market participation pathway (e.g., direct registration or via an aggregator), these fees represent an unavoidable recurring cost of market operation. Consistent with AEMO’s cost recovery framework and prior battery techno-economic studies, regulatory and market fees are therefore modelled in this work as a fixed proportion of gross battery revenue, assumed to be approximately 3–4%, to reflect the aggregate impact of market access, settlement, compliance, and system operation charges.
3.8. Optimization Framework
The operational scheduling of the community battery is formulated as a mixed-integer linear programming (MILP) problem to maximize the annual net profit while satisfying all technical and operational constraints. The optimization framework has considered multiple value streams, including energy arbitrage, FCAS participation, network support revenue, and battery throughput incentives, offset by capital, operational, and regulatory costs.
The optimization problem is expressed as
subject to the following operational and physical constraints:
- State of Charge (SOC) dynamics:
- 2.
- Energy capacity limits:
- 3.
- Power limits:
- 4.
- Charge–discharge exclusivity:
- 5.
- Initial and terminal conditions:
3.9. Customer-Level Value Assessment
Assessing the customer-level value of a community battery is crucial for understanding the direct benefits to participating households and for evaluating the economic case for deployment. The community battery enables customers to store surplus solar photovoltaic (PV) generation during the day for later use, effectively providing a form of local demand management. This arrangement allows participants to offset grid electricity consumption by utilizing their own stored solar energy, resulting in direct financial savings whenever the cost of stored energy is lower than grid-supplied electricity. In the modelling framework, customers are compensated for their excess PV generation at the prevailing spot market price, which serves as an analogue to the retail feed-in tariff (FiT). In practice, the specific FiT rate depends on the retailer and regulatory arrangements, with state governments typically defining a minimum FiT that retailers must offer. To promote participation and strengthen a sense of shared ownership, the community battery operator could adjust FiT payments or tariff structures to reward local energy contribution.
The total cost to a customer without the battery, , is calculated as the sum of the product of the retail electricity price and the net load at each time step:
where is the retail price at time t and is the net electricity demand of 800 households, each with an annual consumption of 5500 kWh without the battery. This represents the baseline cost the customer would incur in the absence of a shared battery. The Community Distributed Model (CDM) quantifies the annual electricity cost savings achieved by the community through coordinated operation of rooftop PV and the community battery under Queensland time-of-use (ToU) tariffs. For the simulations, the following QLD retail ToU prices were applied:
- Shoulder: 19:00–09:00 at 0.3012 AUD/kWh
- Off-peak: 09:00–16:00 at 0.2756 AUD/kWh
- On-peak: 16:00–19:00 at 0.4365 AUD/kWh
A fixed feed-in tariff (FiT) of 0.08 AUD/kWh was assumed for exported PV energy. A fixed feed-in tariff (FiT) of 0.08 AUD/kWh was assumed for exported PV energy, representing a conservative, policy-aligned baseline that is lower than typical retail electricity prices. While this FiT level ensures a cautious estimate of customer-level savings, higher FiTs would increase the financial benefits of contributing excess PV generation to the community battery and may strengthen participation incentives. Conversely, lower FiTs would reduce the attractiveness of PV export, highlighting the sensitivity of customer savings to FiT assumptions.
When a community battery is installed, the cost to the customer, , accounts for energy supplied by the battery as well as any exported PV energy:
Here, represents a local use-of-system discount (LuOS) applied when customers purchase energy from the community battery, is the grid energy consumption after accounting for battery discharges, is the feed-in tariff for exported PV energy, and is the exported PV energy at time t. This equation captures the net cost after accounting for battery charging/discharging and PV exports. Finally, the customer savings, also referred to as the value of coordinated demand management (CDM), is computed as the difference between the cost without the battery and the cost with the battery:
This represents the financial benefit customers receive by accessing the community battery, including avoided grid purchases and revenues from PV exports.
Payback Period
A simple payback period is calculated as
4. Simulation Setup
The proposed MILP optimization framework is evaluated using a 2 MW/4 MWh community battery operating over a full calendar year with a 30 min resolution, consistent with Australian NEM dispatch and FCAS settlement intervals. Using MATLAB’s 2024a intlinprog solver, the optimization with ~70,000 decision variables converge reliably in approximately 5 min on a standard workstation (Intel i7, 32 GB RAM) to the requested relative gap tolerance of 1 × 10⁻⁴. This demonstrates that the framework is computationally tractable for full-year scheduling without requiring decomposition or heuristic methods. Network support revenue is modelled based on the battery’s ability to reduce local peak demand during critical network loading periods. In this study, a conservative peak demand reduction of MW is assumed for the community battery. The avoided network capacity cost is taken as AUD 200/MWh, representing the deferred cost of distribution network augmentation. Australian distribution network augmentation costs have been reported to range from approximately AUD 960,000 to AUD 4.6 million per MW of capacity, depending on network conditions and location; using an annualized avoided cost of around 200 AUD/MWh provides a conservative estimate of the economic value of deferring such upgrades through demand reduction by DERs like community batteries [24]. The battery is assumed to provide peak support for h per day over the entire year, corresponding to typical evening peak demand windows, resulting in a total of 1460 peak-support hours annually. Battery operational constraints include a maximum charge/discharge power of 2 MW, a depth-of-discharge limit of 80%, and round-trip efficiencies of 95% for both charging and discharging. State-of-charge (SOC) is tracked as a fraction of nominal capacity, with initial SOC set to 20%. Degradation is modelled as a combination of cycling (throughput-dependent) and calendar ageing.
Figure 2 illustrates the optimal operation of the 2 MW/4 MWh community battery over the first five days of simulation. The top two panels show the charging and discharging power schedules, indicating that the battery predominantly charges during low-price periods and discharges during high-price periods. The third panel presents the corresponding state-of-charge (SOC) trajectory, which remains within operational limits and reflects repeated daily cycling driven by market conditions. The bottom panel shows the wholesale energy price profile used by the optimization.
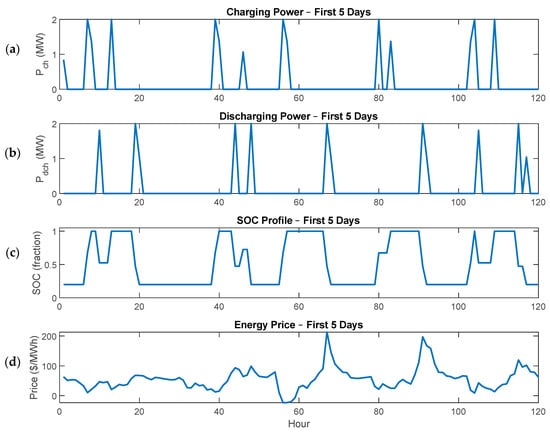
Figure 2.
Five-day dispatch overview showing (a) battery charging power Pch, (b) discharging power Pdch, (c) state of charge (SOC) as a fraction of total capacity, and (d) corresponding energy price (AUD/MWh).
Over the full simulation horizon, the battery performs approximately 5000 equivalent full cycles, indicating an intensive utilization strategy consistent with revenue-maximizing operation in energy arbitrage and ancillary service markets. The SOC evolution in the first five days is representative of this high-cycling regime, demonstrating that the optimization balances market revenues against operational constraints while accounting for battery lifetime usage.
Figure 3 illustrates the relationship between market price and the net dispatch of the community battery. A distinct price-responsive behaviour is observed. When prices are low or close to zero, the battery shows a strong charging response (negative net dispatch), indicating that the MILP controller exploits low-price periods to store energy. As prices increase to moderate levels, dispatch transitions toward zero, signalling periods where the battery holds energy to preserve headroom for future high-price events or FCAS commitments. At very high prices—particularly during extreme price spikes (>AUD 5000/MWh)—the battery consistently discharges at or near its maximum power rating. This demonstrates the optimization framework’s ability to capture high-value arbitrage opportunities. The concentration of points at the charge and discharge limits also confirms that the battery cycles strategically rather than continuously, preserving SOC for high-value intervals. Overall, the pattern validates the expected economic behaviour: charge during low-price periods, discharge extensively during price spikes, and remain neutral during moderate-price conditions.
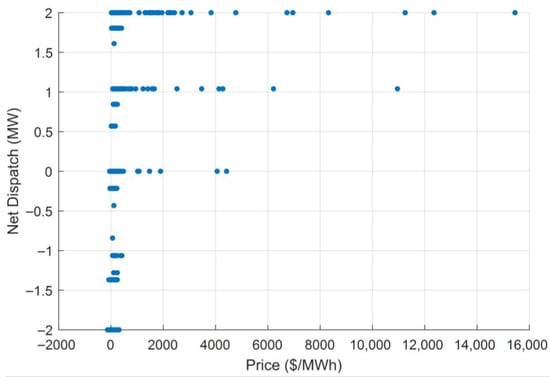
Figure 3.
Relationship between market price (AUD/MWh) and net battery dispatch (MW).
Figure 4 presents the annual state-of-charge (SOC) heatmap of the community battery, expressed as a fraction of its maximum energy capacity. A clear and consistent operational pattern is observed across the year. The battery reaches a high SOC between approximately 10:00 and 17:00 each day, driven by low midday wholesale prices and, in practical settings, coinciding with peak rooftop PV generation. Conversely, the SOC drops to lower levels during the early morning (00:00–06:00) and evening peak periods (18:00–23:00), reflecting the battery’s strategic discharge to capture higher energy prices, reduce local demand, and provide FCAS capacity. While some variability appears across seasons due to fluctuations in demand and market conditions, the dominant charge–discharge rhythm remains stable throughout the year. This daily cycling behaviour demonstrates that the co-optimized energy FCAS scheduling framework effectively utilizes the battery, maintaining regular operation close to its optimal revenue-generating profile.

Figure 4.
Annual state-of-charge (SOC) heatmap of the community battery.
Figure 5a shows box plots of the remaining energy of the battery, measured in MWh, which corresponds to the SOC fraction when normalized by the battery’s nominal capacity of 4 MWh. Across all months, the battery generally operates between 0.4 MWh (≈10% SOC) and 2 MWh (≈50% SOC), reflecting a strategy that preserves mid-range SOC to enable both upward and downward FCAS response. The median remaining energy remains relatively stable between 0.88 MWh (≈22% SOC) and 1.08 MWh (≈27% SOC) for most months, indicating consistent baseline operational conditions. During August and September, the range of remaining energy narrows slightly, with both minimum and median values elevated, reflecting periods of high or volatile market prices where the battery maintains higher energy levels to enable profitable discharge or FCAS Raise provision. Conversely, shoulder-season months such as March and April exhibit wider energy swings, indicating more frequent cycling driven by price-responsive energy arbitrage. Overall, these distributions confirm that the MILP controller dynamically adjusts battery energy levels to balance arbitrage opportunities with FCAS reserve obligations. Figure 5b shows the monthly net dispatch variability that illustrates the battery consistently cycles between 2 MW (charging) and 2 MW (discharging), which corresponds to its power rating constraints. Each month exhibits a dense cluster around zero net dispatch, reflecting the presence of idle periods where neither charging nor discharging is economically beneficial. Charging events (negative dispatch) occur more frequently in low-price months, while high-price intervals particularly in mid-year months cause the battery to discharge at its power limit. The upper whisker values near +2 MW highlight that the battery routinely exploits high-value price spikes, while the negative extremes indicate opportunistic charging during low-price intervals or zero/negative energy prices.
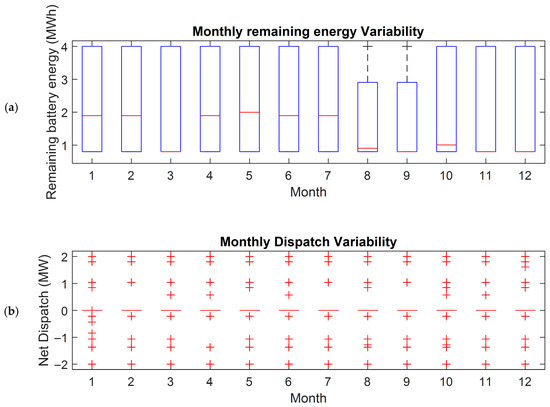
Figure 5.
Monthly variability of battery operation (a) Box plots of remaining battery energy in MWh (b) Box plots of net dispatch (MW).
The symmetric distribution around zero also confirms that the battery is not biassed toward only charging or discharging but instead maintains a balanced operational pattern consistent with maximizing revenue across both energy and FCAS markets.
Figure 6 presents the monthly revenue distribution of the 2 MW/4 MWh community battery over the simulation year. The results show pronounced seasonal and temporal variability in revenue, reflecting changes in wholesale electricity prices, FCAS availability, and network support opportunities across months. Higher revenues are observed in selected months (e.g., early and late in the year), which correspond to periods of increased price volatility and system stress, while lower revenues occur in months with flatter price profiles and reduced arbitrage margins. This variation highlights that battery profitability is not uniformly distributed over the year but is driven by a limited number of high-value operating periods. The figure underscores the importance of strategic dispatch and market participation, as a significant share of annual revenue is captured during months with favourable market conditions rather than through continuous operation.
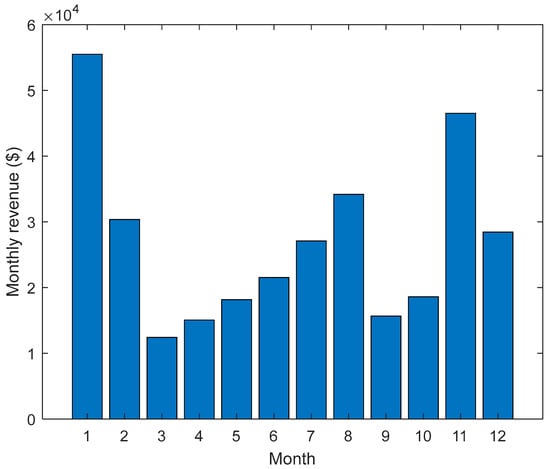
Figure 6.
Monthly battery revenue over the year.
The battery operation generates total revenue of AUD 1,074,447, driven primarily by energy arbitrage (AUD 574,668) and FCAS (AUD 434,675), with additional contributions from network support (AUD 58,400) and throughput incentives (AUD 6704). The costs include CAPEX (AUD 464,972), OPEX (AUD 64,000), and degradation-related expenses (AUD 139,270). After accounting for these costs, the net profit is AUD 373,972, while the Customer Value Assessment (CVA), representing avoided energy costs to the community, totals AUD 822,969. These results indicate that the battery provides both substantial economic benefits and value to end-users through energy cost savings. An annual financial performance summary is provided in Table 1.

Table 1.
Annual financial performance summary of 2 MW/4 MWh community battery.
To quantify the incremental value of multi-service operation, three scenarios are analyzed in Table 2:
Table 2.
Scenario-based financial performance comparison.
- Energy arbitrage-only: Battery participates only in wholesale energy arbitrage.
- FCAS-only: Battery provides FCASs only.
- Combined services: Battery simultaneously participates in energy arbitrage, FCAS, and network support using the proposed MILP framework.
The results show that operating the battery in a single market yields limited profitability, with FCAS-only operation barely covering costs. In contrast, the proposed co-optimized multi-service strategy increases total revenue by more than 85% compared to EA-only operation and more than triples net profit. This demonstrates that the value of a community battery is not additive but synergistic, where coordinated participation across energy, FCAS, and network support services significantly enhances overall economic performance.
5. Conclusions
This paper presented a comprehensive techno-economic assessment of a community battery energy storage system participating concurrently in energy arbitrage, FCAS markets, and network support services under a commercially driven third-party ownership model. A mixed-integer linear programming framework was developed to co-optimize battery charging, discharging, and reserve scheduling while explicitly accounting for operational constraints, efficiency losses, degradation, capital recovery, and regulatory costs. Simulation results for a 2 MW/4 MWh community battery using real 2024 Queensland AEMO market data demonstrated strong price-responsive behaviour, with systematic charging during low-price periods and aggressive discharging during high-price events. High annual utilization and stable daily cycling patterns were observed, confirming that the co-optimized strategy effectively balances arbitrage revenue, FCAS provision, and network support services.
The scenario comparison further showed that multi-service participation delivers substantially higher profitability than energy-arbitrage-only or FCAS-only operation, validating the economic case for integrated market participation by community-scale batteries. These results provide practical insights for battery operators, distribution network service providers, and policymakers seeking to evaluate the role of community batteries in enhancing grid flexibility and delivering end-user value.
Nevertheless, several limitations should be acknowledged. First, the optimization framework relies on perfect foresight of prices and demand and therefore does not explicitly capture forecast uncertainty. Second, battery degradation is represented using a simplified linear throughput-based model, which does not consider nonlinear effects such as temperature dependence, SOC window stress, or C-rate sensitivity. Third, the deterministic MILP formulation does not account for stochastic market conditions or the potential strategic interactions among multiple distributed batteries operating in the same network region.
Future work will address these limitations by incorporating uncertainty-aware optimization, such as stochastic or robust MILP formulations, to explicitly model price and demand forecast errors. Integration of data-driven methods, including deep reinforcement learning for bidding and dispatch under uncertainty, is another promising direction. Finally, extending the framework to coordinate multiple community batteries and evaluate system-wide impacts will provide further insights into the scalable deployment of community energy storage in future distribution networks.
Author Contributions
Conceptualization, U.M.; Methodology, U.M. and A.I.; Software, A.I.; Validation, U.M. and A.I.; Formal analysis, U.M. and A.I.; Investigation, U.M.; Resources, U.M. and S.A.; Writing—original draft, U.M.; Writing—review & editing, U.M. and A.I. and S.A.; Supervision, S.A. All authors have read and agreed to the published version of the manuscript.
Funding
This research was funded by Advanced Queensland Industry Research Fellowship program and grant number AQIRF105-2022RD5.
Data Availability Statement
The data presented in this study are available in online repository.
Conflicts of Interest
The authors declare no conflict of interest.
References
- Worku, M.Y. Recent advances in energy storage systems for renewable source grid integration: A comprehensive review. Sustainability 2022, 14, 5985. [Google Scholar] [CrossRef]
- Cheng, B.; Powell, W.B. Co-optimizing battery storage for the frequency regulation and energy arbitrage using multi-scale dynamic programming. IEEE Trans. Smart Grid 2016, 9, 1997–2005. [Google Scholar] [CrossRef]
- Miao, Y.; Chen, T.; Bu, S.; Liang, H.; Han, Z. Co-Optimizing Battery Storage for Energy Arbitrage and Frequency Regulation in Real-Time Markets Using Deep Reinforcement Learning. Energies 2021, 14, 8365. [Google Scholar]
- Anwar, M.; Wang, C.; De Nijs, F.; Wang, H. Proximal policy optimization based reinforcement learning for joint bidding in energy and frequency regulation markets. In Proceedings of the 2022 IEEE Power & Energy Society General Meeting (PESGM), Denver, CO, USA, 17–21 July 2022; pp. 1–5. [Google Scholar]
- Rangarajan, A.; Foley, S.; Trück, S. Assessing the impact of battery storage on Australian electricity markets. Energy Econ. 2023, 120, 106601. [Google Scholar] [CrossRef]
- Bayborodina, E.; Negnevitsky, M.; Franklin, E.; Washusen, A. Grid-scale battery energy storage operation in australian electricity spot and contingency reserve markets. Energies 2021, 14, 8069. [Google Scholar] [CrossRef]
- Dufo-López, R.; Lujano-Rojas, J.M.; Artal-Sevil, J.S.; Bernal-Agustín, J.L. Optimising grid-connected PV-battery systems for energy arbitrage and frequency containment reserve. Batteries 2024, 10, 427. [Google Scholar] [CrossRef]
- Aslam, M.U.; Shakhawat, N.S.B.; Shah, R.; Amjady, N.; Miah, M.S.; Amin, B.R. Hybrid energy storage modeling and control for power system operation studies: A survey. Energies 2024, 17, 5976. [Google Scholar] [CrossRef]
- Garttan, G.; Alahakoon, S.; Emami, K.; Jayasinghe, S.G. Battery energy storage systems: Energy market review, challenges, and opportunities in frequency control ancillary services. Energies 2025, 18, 4174. [Google Scholar] [CrossRef]
- Wang, Y.; Zhao, X.; Huang, Y. Joint scheduling method of peak shaving and frequency regulation using hybrid energy storage considering degeneration characteristic. IET Renew. Power Gener. 2024, 18, 3765–3775. [Google Scholar] [CrossRef]
- Fan, F.; Nwobu, J.; Campos-Gaona, D. Co-located battery energy storage optimisation for dynamic containment under the UK frequency response market reforms. CSEE J. Power Energy Syst. 2023, 11, 340–351. [Google Scholar]
- Cortés, M.C.; Nsir, N.; Koltermann, L.; Zurmühlen, S.; Van Ouwerkerk, J.; Sauer, D.U. M5Use: An Optimization Framework for the Multi-Use Operation Scheduling of Large-Scale Battery Storage Systems. In Proceedings of the 2024 IEEE PES Innovative Smart Grid Technologies Europe (ISGT EUROPE), Dubrovnik, Croatia, 14–17 October 2024; pp. 1–5. [Google Scholar]
- Shi, Y.; Xu, B.; Wang, D.; Zhang, B. Using battery storage for peak shaving and frequency regulation: Joint optimization for superlinear gains. IEEE Trans. Power Syst. 2017, 33, 2882–2894. [Google Scholar] [CrossRef]
- Lyu, C.; Wang, W.; Wang, J.; Bai, Y.; Song, Z.; Wang, W.; Meng, J. The role of co-optimization in trading off cost and frequency regulation service for industrial microgrids. Appl. Energy 2024, 375, 124131. [Google Scholar] [CrossRef]
- Jhan, J.-Z.; Tai, T.-C.; Chen, P.-Y.; Kuo, C.-C. Research on dynamic reserve and energy arbitrage of energy storage system. Appl. Sci. 2022, 12, 11953. [Google Scholar] [CrossRef]
- Song, H.; Liu, C.; Amani, A.M.; Gu, M.; Jalili, M.; Meegahapola, L.; Yu, X.; Dickeson, G. Smart optimization in battery energy storage systems: An overview. Energy AI 2024, 17, 100378. [Google Scholar] [CrossRef]
- Graham, P.; Hayward, J.; Foster, J. GenCost 2024-25; CSIRO: Canberra, Australia, 2025. [Google Scholar]
- Oxford Economics Australia. Discount Rates for Energy Infrastructure; Oxford Economics Australia: Sydney, Australia, 2024. [Google Scholar]
- Cole, W.; Ramasamy, V.; Turan, M. Cost Projections for Utility-Scale Battery Storage: 2025 Update; NREL/TP-6A40-93281; National Renewable Energy Laboratory: Golden, CO, USA, 2025. Available online: https://docs.nrel.gov/docs/fy25osti/93281.pdf (accessed on 7 July 2025).
- Shaw, M.; Sturmberg, B.; Mediwaththe, C.; Ransan-Cooper, H.; Taylor, D. Community Batteries: A Cost/Benefit Analysis. Technical Report. 2020. Available online: https://arena.gov.au/knowledge-bank/community-batteries-a-cost-benefit-analysis/ (accessed on 15 August 2025).
- Australian Energy Market Operator. Volume Weighted FCAS Prices; Australian Energy Market Operator (AEMO): Melbourne, Australia, 2025; Available online: https://www.aemo.com.au/energy-systems/electricity/national-electricity-market-nem/data-nem/market-management-system-mms-data/volume-weighted-fcas-prices (accessed on 24 February 2025).
- Australian Energy Market Operator. Aggregated Price and Demand Data; Australian Energy Market Operator (AEMO): Melbourne, Australia, 2025; Available online: https://www.aemo.com.au/energy-systems/electricity/national-electricity-market-nem/data-nem/aggregated-data (accessed on 4 March 2025).
- Australian Energy Market Operator. AEMO Budget and Fees 2025–26; Australian Energy Market Operator (AEMO): Melbourne, Australia, 2025. [Google Scholar]
- Australian Energy Market Operator. 2025 Electricity Network Options Report; Australian Energy Market Operator : Melbourne, Australia, 2025; Available online: https://www.aemo.com.au/-/media/files/stakeholder_consultation/consultations/nem-consultations/2025/2025-electricity-network-options-report/final/2025-electricity-network-options-report.pdf?la=en (accessed on 24 September 2025).
Disclaimer/Publisher’s Note: The statements, opinions and data contained in all publications are solely those of the individual author(s) and contributor(s) and not of MDPI and/or the editor(s). MDPI and/or the editor(s) disclaim responsibility for any injury to people or property resulting from any ideas, methods, instructions or products referred to in the content. |
© 2026 by the authors. Licensee MDPI, Basel, Switzerland. This article is an open access article distributed under the terms and conditions of the Creative Commons Attribution (CC BY) license.