Article

Method of Evaluation of Potential Location of EV Charging Stations Based on Long-Term Wind Power Density in Poland


by
Olga Orynycz
1,*,
Magdalena Zimakowska-Laskowska
2,*,
Paweł Ruchała
3,
Piotr Laskowski
4,
Jonas Matijošius
5,
Stefka Fidanova
6,7,
Olympia Roeva
7,8,
Edgar Sokolovskij
9,* and
Maciej Menes
10
1
Department of Production Management, Faculty of Engineering Management, Bialystok University of Technology, Wiejska Street 45A, 15-351 Bialystok, Poland
2
Environment Protection Centre, Motor Transport Institute, 03-301 Warsaw, Poland
3
Łukasiewicz Research Network—Institute of Aviation, Aerodynamics Department, Al. Krakowska 110/114, 02-256 Warszawa, Poland
4
Faculty of Automotive and Construction Machinery Engineering, Warsaw University of Technology, 84 Narbutta Str., 02-524 Warsaw, Poland
5
Mechanic Science Institute, Vilnius Gediminas Technical University, Plytinės Str. 25, LT-10105 Vilnius, Lithuania
6
Institute of Information and Communication Technology, Bulgarian Academy of Sciences, 1113 Sofia, Bulgaria
7
Center of Excellence in Informatics and Information and Communication Technologies, 1113 Sofia, Bulgaria
8
Institute of Biophysics and Biomedical Engineering, Bulgarian Academy of Sciences, 1113 Sofia, Bulgaria
9
Department of Automobile Engineering, Faculty of Transport Engineering, Vilnius Gediminas Technical University, Plytinės g. 25, LT-10105 Vilnius, Lithuania
10
Transport Telematics Centre, Motor Transport Institute, 80 Jagiellońska Str., 03-301 Warsaw, Poland
*
Authors to whom correspondence should be addressed.
Energies 2026, 19(2), 434; https://doi.org/10.3390/en19020434
Submission received: 11 December 2025 / Revised: 4 January 2026 / Accepted: 13 January 2026 / Published: 15 January 2026
(This article belongs to the Special Issue Optimal Control of Wind and Wave Energy Converters: 2nd Edition)

Abstract

The rapid development of electromobility increases the need for fast, accessible and robust charging stations devoted to EVs (electric vehicles). Planning a network of such stations poses new challenges—amongst others, a power supply that may power such chargers. One major concept is to utilise wind energy as a power source. The paper analyses meteorological data gathered since 2001 in several stations across Poland to achieve quantitative indexes, which summarise (a) wind power density (WPD) as a metric of energy amount, (b) long-term (multiannual) time trends of amount of energy, (c) short-term stability (and thus predictability) of the wind power. The indexes that cover the abovementioned factors allow the authors to answer the research questions, where the local wind conditions allow the authors to consider the integration of a wind powerplant and a network of EV chargers. Additionally, we investigated locations where the amount of available energy is sufficient, but the variability of wind power impedes its practical exploitation. In such cases, the power system may be extended by an energy storage system that acts as a buffer, smoothing power fluctuations and thereby improving the robustness and reliability of downstream charging systems.

1. Introduction

An increasing amount of renewable energy sources, as well as rapid transformation of the branch of transportation, challenge European countries in terms of planning and stability of energy systems. The development of infrastructure for EV charging is increasing, but its operation is dependent on power sources that must be stable and accessible locally—both in terms of presence and costs. Therefore, the identification of locations where renewable energy resources are not only abundant but also stable over long time horizons has become a key planning challenge for EV charging infrastructure. In many countries, including Poland, wind power plays a key role in this process as a pillar of balanced energy mix and is treated as the main factor that enables a reduction in CO2 emissions and divergence from fossil fuels [1,2].
The importance of wind power in the context of electromobility increases not only due to its low emissions but also because of the possibility of partially balancing local power consumption. As the EV fleet expands, the demand for electric power increases accordingly. Eventually, the demand for effective and affordable systems of electric energy distribution will explode, mainly in cities and agglomerations as well as in areas of uneven daily consumption. The integration of charging infrastructure with local power sources (including wind turbines) and energy storage systems is believed to be one of most effective ways of (a) improving resistance to overloading and (b) reducing energy costs, both for suppliers and consumers [3].
Despite the rapidly growing number of analyses covering energy production forecasting and modelling, as well as cost assessments and statistical analyses of wind speed, only a few studies have focused on charging infrastructure planning in relation to local wind energy conditions. Most of available studies cover one of two following topics [4,5]:
  • Modelling the production of wind energy around a country or a region.
  • Analysis of the optimal location of charging stations, including spatial, economic and environmental constraints.
There still is a lack of comprehensive studies that join both approaches, the so-called ‘wind-first’ approach. In this case, resources of wind energy dictate the potential location of charging stations, not reversely. Essentially, it means including several factors, including year-to-year wind speed variation, local topographic conditions, itineracy of resources and limitation of power network integration, amongst others. Another advantage of the wind-first approach is related to the increasing variability of electricity prices in Europe, including Poland. Fluctuations in energy costs, including the growth of wholesale prices during recent energy crises (since 2021) and the widening gap between peak and off-peak prices, support the direct use of renewable energy in charging infrastructure, which may result in significant economic benefits.
Many researchers emphasize that the integration of electric vehicles and renewable energy sources is one of the most promising ways to improve the energy efficiency of such systems, as it can reduce transmission losses and minimize emissions. [6].
In relation to Poland conditions, it is also crucial to include the spatial distribution and time variation in wind energy resources. Northern regions of the country are characterized by a high and stable wind energy potential, whereas southern regions exhibit greater variability in wind conditions. Due to this unevenness, performing detailed studies for specific locations is needed, which cover not only yearly averaged energy resources but also parameters of wind for specific for months, decades or seasons, respectively [7]. This allows us to identify whether a given location can be supplied with wind-powered chargers alone or whether additional support in the form of energy storage systems or grid connection is required.
Some positions from this topic of the literature indicate the growing importance of synthetic quantitative parameters, e.g., Wind Stability Index (WSI) or Seasonal Stability Index (SSI), which evaluate long-term aspects of the stability of energy resources [8]. These indexes gather information about the wind speed, its variation and power density, which eventually lead to objective evaluation of the proposed location.
Although the concept of joining EVs and local wind turbines has gained popularity, there still is a lack of long-term analyses including data gathered for over two decades. Recent studies have demonstrated that long-term meteorological data analysis constitutes a reliable basis for optimising wind energy generation and strategic energy planning, particularly when multiannual variability and trends are explicitly considered [9]. Such analyses should present the impact of climate change, anomalous seasons, extreme years, and long-term trends on the stability of wind energy resources and, consequently, on infrastructure planning. The goal of the present paper is to fill this knowledge gap by an analysis of wind energy trends in Poland since 2001 and by evaluation of the quality of some selected locations in terms of EV charging stations and energy storage systems. This research is based on data gathered by IMGW for 15 meteorological stations. For each station, the yearly and seasonal wind power density (WPD) for the altitude of 100 m above ground level has been calculated. The synthetic indexes of resource stability have been obtained as well. These parameters help to indicate which locations have the most beneficial conditions to integrate EV charging stations and wind turbines.
The novelty of this study lies in integrating two usually separated research domains: long-term wind energy assessment and spatial planning of EV charging infrastructure. Unlike previous works, which either analyse wind resources or optimise charger locations in isolation, this paper applies a wind-first approach based on 24 years of high-resolution meteorological data from IMGW. By calculating multiannual WPD trends, resource stability indicators (CV, deficit index) and two synthetic siting metrics (WSI and SSI), we provide the first long-term, data-driven ranking of sites in Poland suitable for wind-powered EV chargers and energy storage systems. This comprehensive methodology enables the identification of locations where wind resources are not only abundant but also sufficiently stable to support practical electromobility needs, a perspective previously absent in earlier studies.

2. Literature Review

The dynamic growth in the number of EVs caused an explosion in demand for densely distributed, robust and evenly exploited networks of charging stations. The development of such networks is a complex optimisation problem, which must include investment and operational costs, users’ comfort, energy network limits and environmental factors [10,11,12]. The multicriteria models utilised for this purpose rely on, e.g., genetic algorithms, mixed-integer linear programming and greedy algorithms based on submodular set functions. These models most often integrate road maps, electric energy distribution infrastructure and forecasts of charger’s demand into one data frame [13,14,15]. The analyses based on GIS (Geographic Information System) clearly show spatial unevenness—the charging stations are concentrated in city centres and along main transport routes. Meanwhile, suburban areas are not sufficiently covered by the chargers [16,17,18]. It is seen that the broad spread of EVs may increase the peak power of electric systems by tens of percent, especially in the evenings when domestic chargers are dominant [19,20]. Eventually, the importance of advanced power demand forecasting methods will increase, along with the development of smart charging strategies that reduce grid overload and improve voltage stability [21,22]. The challenge of variability and noise in energy-related time series has also been highlighted in studies on electrical load forecasting, where robust statistical models are required to ensure reliable system operation under fluctuating conditions [23]. Simultaneously, researchers are extensively developing concepts of charging infrastructure and renewables, mostly hybrid PV–wind–energy storage systems and micro networks with local energy management systems [24,25]. It is shown that correctly designed systems may significantly reduce network energy consumption, exploitation costs and CO2 emissions—especially if V2G technology and advanced control algorithms are applied [26,27].
In this context, wind energy is one of the major components in the Polish energy mix and the greatest single source among renewables, with the participation of 10–12% in electric energy generation [28,29]. The most beneficial wind conditions appear along the seashore and in north-western Poland, whereas in southern regions one may observe lower but usually more stable energy potential [30,31]. ERA5 data has been found useful to characterise the wind climate on the country scale and confirmed significant seasonality—wind energy amount is greater in winter than in summer [32].
In the case of Europe and the world, numerous papers indicate significant spatial and time variation in the wind power density (WPD), a so-called stilling phenomenon partially modified by climate changes and modification of terrain coverage [33,34,35]. Climate simulations suggest a decrease in global WPD in many areas of Europe, with increased seasonal variability; however, perspectives for the Baltic Sea region are relatively favourable [36,37].
Polish power systems already undergo issues related to consuming an increasing amount of wind-produced energy—episodes of high production, especially in winter, may not be synchronised with peak energy demand, which leads to a reduction in energy production or forces the system to export excessive energy [38,39]. The literature suggests the development of a hybrid solar–wind energy storage as a solution, as well as improving the connection of wind sources with local energy receivers, including EV charging infrastructure [40,41].
Previous studies of wind power focused mainly on the prediction of available power, assessment of energy resources and optimisation of design and location of powerplants. One may observe a rapid development of algorithms that rely on machine learning and deep learning, exploiting measurement data and reanalyses (ERA5, WRF) to improve predictions accuracy in different time horizons [42,43,44]. Simultaneously, the broad literature covering aspects of EV charger planning is available. The studies include multicriteria models, GIS analyses and integration with photovoltaics and energy storages [18,24,25,45].
On the other hand, there still is a lack of studies where a long-term analysis of wind power resources would be utilised for charging infrastructure planning. Typically, researchers treat wind energy as one of the inputs for renewables network optimisation, but they do not assess possible locations based on stability and efficiency of wind resources [42,46,47]. The concept of siting suitability index was developed mostly for wind farms and PV devices, but they rarely include specific requirements of EV charging infrastructure, which must include wind resources, road network, local energy demands and power system constrains [48,49]. Moreover, there is a lack of studies which consider specific conditions of energy transformation in Poland and utilise multiannual timings of wind power density obtained for specific locations to calculate siting suitability indexes and eventually assess and select the most beneficial locations in the country or region [29,38]. Most studies that are concerned with the integration of renewables and EV chargers rely on PV profiles or generic charging profiles, without including time and spatial variation in WPD explicates [24,50]. The analysis proposed in the present paper fills this gap using the wind-first approach: multiannual meteorological data have been used to calculate WPD in several locations across Poland. This was used to achieve siting suitability (WSI/SSI type) indexes and eventually to grade included locations as possible locations of EV charging infrastructure or energy storage systems, in the context of the stability and efficiency of wind power usage as well as energy costs. Such an approach allows us to switch the classical question ‘where the energy is needed and how to supply it’ into ‘where the wind conditions are most beneficial to locate charging infrastructure’. It means a qualitatively new step into the integration of wind powerplants with electromobility needs.

3. Materials and Methods

3.1. Input Data and Included Locations

The paper exploits long-term meteorological data gathered by IMGW (Instytut Meteorologii i Gospodarki Wodnej, Institute of Meteorology and Water Management) between 2001 and 2024 in several selected locations, limited to possible wind powerplant locations placed in different areas of Poland.
Problem formulation: The problem addressed in this study is to identify locations in Poland where wind resources can support wind-powered EV charging infrastructure.
Hypothesis: We hypothesise that sites with high wind energy potential and favourable long-term trends are more suitable for wind-powered charging. In contrast, sites with high interannual variability and scarcity risk require energy storage to ensure reliable operation.
Solution approach: The solution is obtained by calculating wind power density (WPD) and trend/stability indicators from long-term measurements, standardising the inputs, and constructing two synthetic indices (WSI and SSI) used to rank the analysed locations.
In each point, the following parameters were measured or calculated:
  • Wind speed;
  • Air temperature;
  • Atmospheric pressure (at elevation of the station and at mean sea level);
  • Air density;
  • Wind power density.
The analysis included wind speed data gathered directly at the station level, without elevation reduction. We did so to obtain representative data for local wind conditions in measurement points.
For each included station, a set of indexes, which describe level, stability and time trend of wind energy resources, as well as the energetic and economic efficiency, has been calculated.
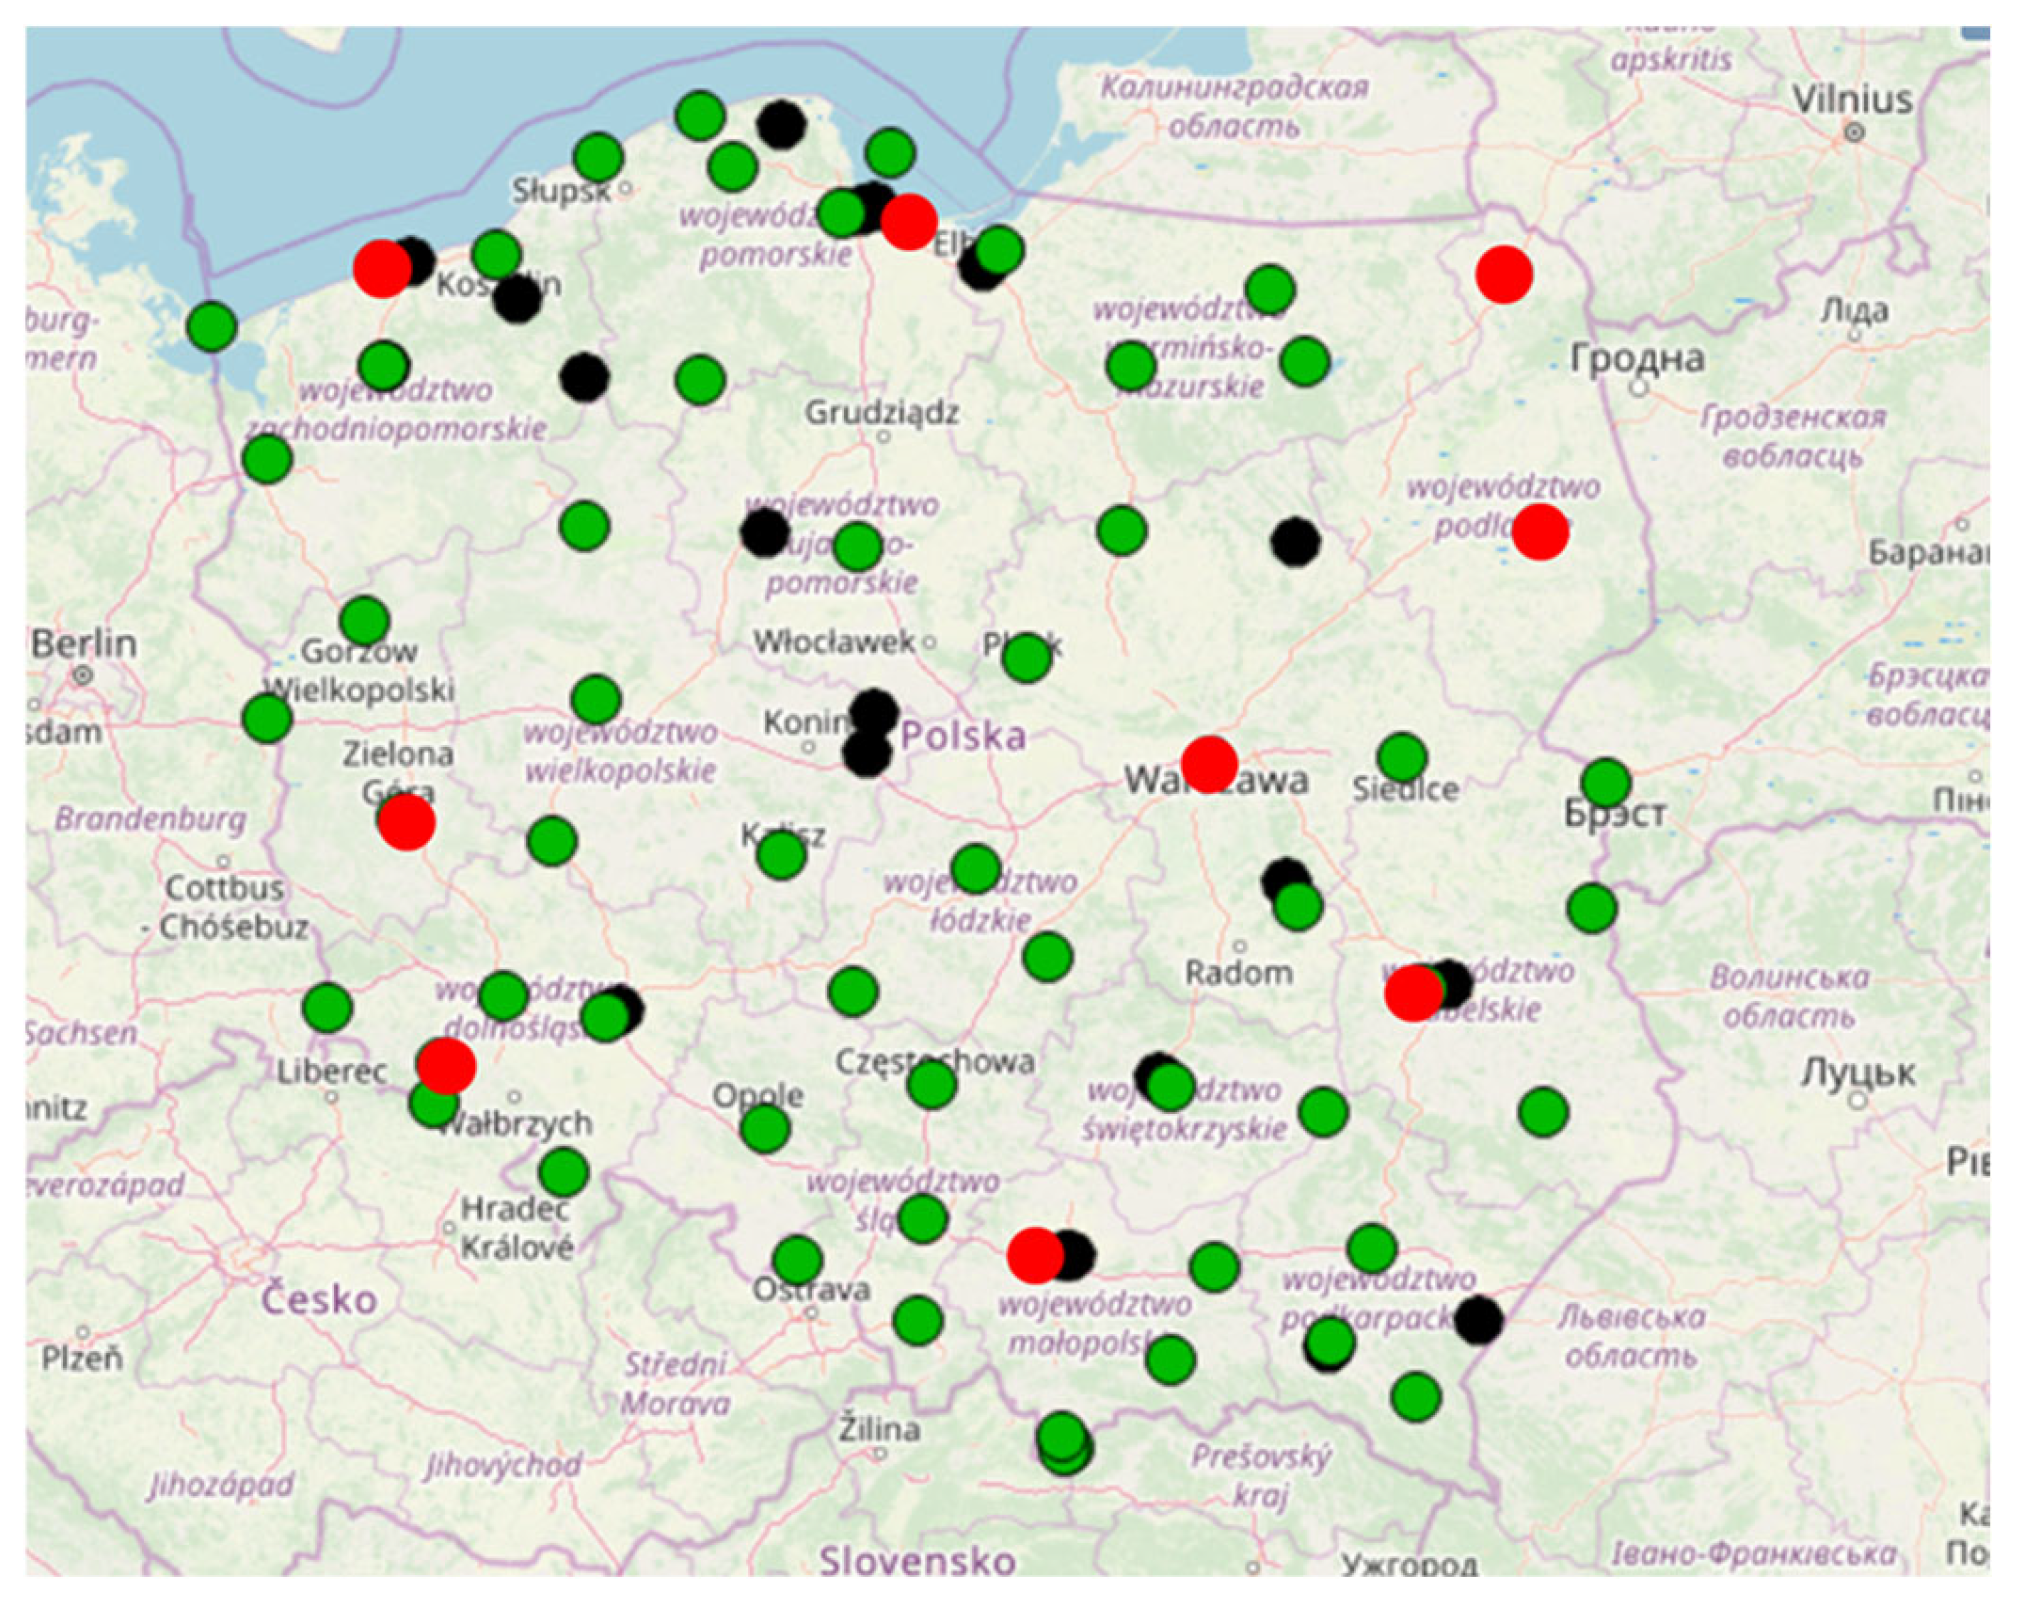
The locations included in the present paper are the following: Białystok, Gdańsk–Świbno, Jelenia Góra, Katowice-Muchowiec, Kołobrzeg–Dźwirzyno, Kraków–Balice, Krosno, Lublin–Radawiec, Łódź-Lublinek, Mława, Piła, Suwałki, Zielona Góra, Warszawa–Okęcie and Wieluń. The map of analysed stations is presented in Figure 1.
The data gathered for each station were logged every 1 h.

3.2. Calculation of Wind Power Density

The amount of kinetic energy is typically defined with the wind power density (WPD), which is defined as a power of the flow passing through a unitary area [52]:
W P D   =   P A   =   0 0.5 × ρ V 3 × f ( V )   d V
where
V—wind speed;
ρ—air density;
f(V)—probability density of the wind speed.
Commonly, the probability density of given wind speed V can be expressed using the Weibull distribution [53]:
f ( V )   =   k c ( V c ) k 1 × e x p ( ( V c ) k )
where
k—shape parameter;
c—scale parameter.
Thus, Equation (1) may be re-formulated to combine WPD with parameters of the Weibull distribution of the wind speed [54]:
W P D   =   0.5 × ρ c 3 × Γ ( 1   +   3 k )
The WPD values have been obtained for each measurement station for each year since 2001.
We used data gathered in weather reports using the following approach:
We calculated wind speed at the elevation of 100 m above ground level, using Hellman’s law:
V s t a t i o n _ e l e v a t i o n V 100 m   =   ( s t a t i o n _ e l e v a t i o n   100 ) α
where the value of α = 0.17 has been set, which, according to Polish standards [55], represents an open terrain with low vegetation and isolated obstacles like trees or houses.
  • We found the Weibull distribution of the wind speed at 100 m, using the same method as in previous studies [53], i.e., maximum likelihood estimation (MLE).
  • We calculated air density at the station level using the ideal gas equation:
ρ = p r T
where p is the atmospheric pressure and T is the air temperature. We assumed that both these parameters are the same at the station level and the elevation of 100 m. In Equation (3), the annually averaged air density was used.
A reference height of 100 m was adopted to ensure consistency across all locations. The assessment of other hub heights (e.g., 80 m and 120 m) was beyond the scope of this study and is identified as a direction for future research.
Furthermore, we calculated indices describing the mean level of energy resources, their temporal trends, and their stability, which are discussed in the following sections.

3.3. Calculation of Wind Energy Resources Indexes

For each location, we obtain a set of the following indexes, gathering yearly WPD values in the years 2001–2024.
The annual mean wind power density for station s is calculated as follows.
WPD a v , s = 1 N s t = 1 N s W P D s , t
where
N s —number of samples (years) available for station s.
(1)
Coefficient of variance (CV)
C V s = σ ( W P D s ) WPD a v , s
where
σ ( W P D s ) —standard deviation of yearly WPD values for station s.
(2)
Scarcity
s c a r c i t y s = WPD a v , s   m i n t W P D s , t WPD a v , s
Higher values of scarcity mean increased risk of years with reduced wind energy potential.
(3)
Yearly amount of wind energy per 1 m2 (reference energy)
E s = W P D s , 2024 × 8760 / 1000
(4)
Economic value of wind energy
V a l u e s =   E s × C
where C—average energy cost in Poland in 2024.

3.4. Calculation of WSI and SSI Indexes

The purpose of synthetic indexes was to create objective, quantitative measures of location quality:
WSI (Wind Siting Index)—assessment of location suitability in the context of wind-powered EV chargers.
SSI (Storage Suitability Index)—assessment of location suitability to install energy storage combined with local wind powerplant.
The weighting factors used in the WSI and SSI were selected to reflect the relative importance of energy availability, long-term reliability and short-term variability from the perspective of EV charging infrastructure planning. Long-term trends were assigned higher weights, as they directly influence future resource availability. In contrast, variability-related parameters were emphasised in the SSI to capture the operational need for energy storage. The adopted weights follow a pragmatic engineering approach commonly applied in multi-criteria assessments, prioritising robustness and interpretability over formal optimisation.
In both cases, a set of parameters defining mean level of parameter, its variation and long-term time trends is used. To make a direct comparison between different parameters and stations possible, a z-score standardisation of all inputs has been performed.
(5)
WSI
W S I s = z ( W P D s , l a t e s t ) + 0.5 × z ( s l o p e s ) 0.3 × z ( C V s )
The WSI includes three key parameters which characterise the possibility of EV charging with the use of wind power:
  • Resource level W P D s , l a t e s t
  • Multiannual trend s l o p e s
  • Annual variation C V s that should be treated as a factor that reduces source stability.
The greatest WSI values indicate the most useful location of wind-powered EV chargers.
(6)
SSI
S S I s = 0.8 × z ( C V s ) + 0.6 × z ( s c a r c i t y s ) + 0.2 × z ( s l o p e s )
The value of the SSI shows these locations, where significant variation or deep suppression of wind energy causes increased need to supply the wind turbine with energy storage. The greatest values indicate the locations, where the energy storage
  • is most reasonable in operational meaning;
  • compensates scarcity and fluctuation of energy resource at most.
A qualitative sensitivity analysis, performed by varying the weighting factors within ±20%, confirmed that the ranking of the highest-scored locations remains stable.

3.5. Trend Analysis and Standardisation

Long-term trends have been obtained for each station with the use of linear regression fit of yearly WPD values:
W P D s , t = s l o p e s t   + b s
where
s l o p e s —average year-to-year difference in wind power density for station s.
All parameters used to obtain indexes presented above, ( W P D s , l a t e s t ), s l o p e s , C V s , s c a r c i t y s , have been standardised with the z-score transform:
z ( x ) = x μ σ
The purpose of the z-score normalisation was to ensure comparability of parameters expressed in different units and ranges. This transformation does not alter the relative ordering of locations for individual indicators but only rescales them to a standard, dimensionless form. The validity of the normalised parameters was verified by confirming the consistency of rankings and qualitative interpretations before and after standardisation, ensuring that the applied normalisation did not affect the study’s conclusions.
That allows us to directly compare values achieved for different stations, which are significantly different in terms of energy resource and stability.

3.6. Ranking of Locations

Based on values of the WSI and SSI, two rankings have been prepared:
Ranking of potential locations of EV chargers—sorted by WSI (advantageous, stabile wind conditions);
Ranking of locations preferred to install energy storages—sorted by SSI (strongly variable wind conditions—produced energy should be stored to increase robustness and performance).

3.7. Comparison of Energetic Potential and Its Economic Value

To estimate practical usefulness of wind energy resources, we analysed the relations between the following:
  • Yearly energy potential of a given location (measured by amount of energy per 1 m2 of wind turbine);
  • Selling price of this energy.
This relation shows how much the WPD brings in income in the case of local wind-powered EV chargers or energy storage. Moreover, this relation enables the following:
Finding locations with the greatest economic potential;
Assessment of resources stability and risks of scarcity to estimate the possibility of continuous work.

4. Results

4.1. Energy Indexes

As previously mentioned, to comprehensively analyse the usefulness of included points as EV charger locations, we calculated a set of indexes that describe the amount of wind energy (WPD) and its variation and stability.
We included the following:
  • Latest value of yearly WPD from reference year (2024);
  • Mean value of WPD, averaged from the period 2001–2024;
  • Trend slope, obtained with the least squares method;
  • Coefficient of variation;
  • Scarcity risk;
  • Yearly amount of produced energy (per 1 m2 of turbine area);
  • Selling prices of produced energy (per 1 m2 of turbine area).
These parameters were used to construct WSI and SSI. Table 1 summarises the calculated parameters for each analysed location.
All parameters presented in Table 1 were calculated according to Equations (1)–(5) and (7)–(13) described in Section 3.
For selected stations, missing or incomplete long-term datasets prevented the calculation of some indicators; such cases are marked as “nan” in Table 1 and were excluded from the ranking analysis.
To illustrate the practical meaning of the proposed indices, two representative numerical examples are provided. Kraków–Balice station is characterised by a high mean wind power density (93.9 W/m2), moderate interannual variability (CV = 0.99), and a stable long-term trend, resulting in one of the highest values of the Wind Siting Index (WSI = 1.802). This combination indicates that local wind resources are both sufficient and stable enough to support wind-powered EV charging infrastructure without the necessity of additional energy storage.
In contrast, Kołobrzeg–Dźwirzyno station exhibits substantial interannual variability (CV = 1.574) and a high scarcity index (0.991), resulting in a high Storage Suitability Index value (SSI = 1.814). Although the available wind energy is non-negligible, the strong fluctuations and risk of energy deficits suggest that integrating an energy storage system is required to ensure the reliable and robust operation of EV charging stations.
In economic terms, the contrast is equally pronounced: Kraków–Balice achieves an annual economic value of approximately 588 PLN/m2, compared to less than 20 PLN/m2 for the majority of the remaining locations, indicating differences exceeding one order of magnitude.
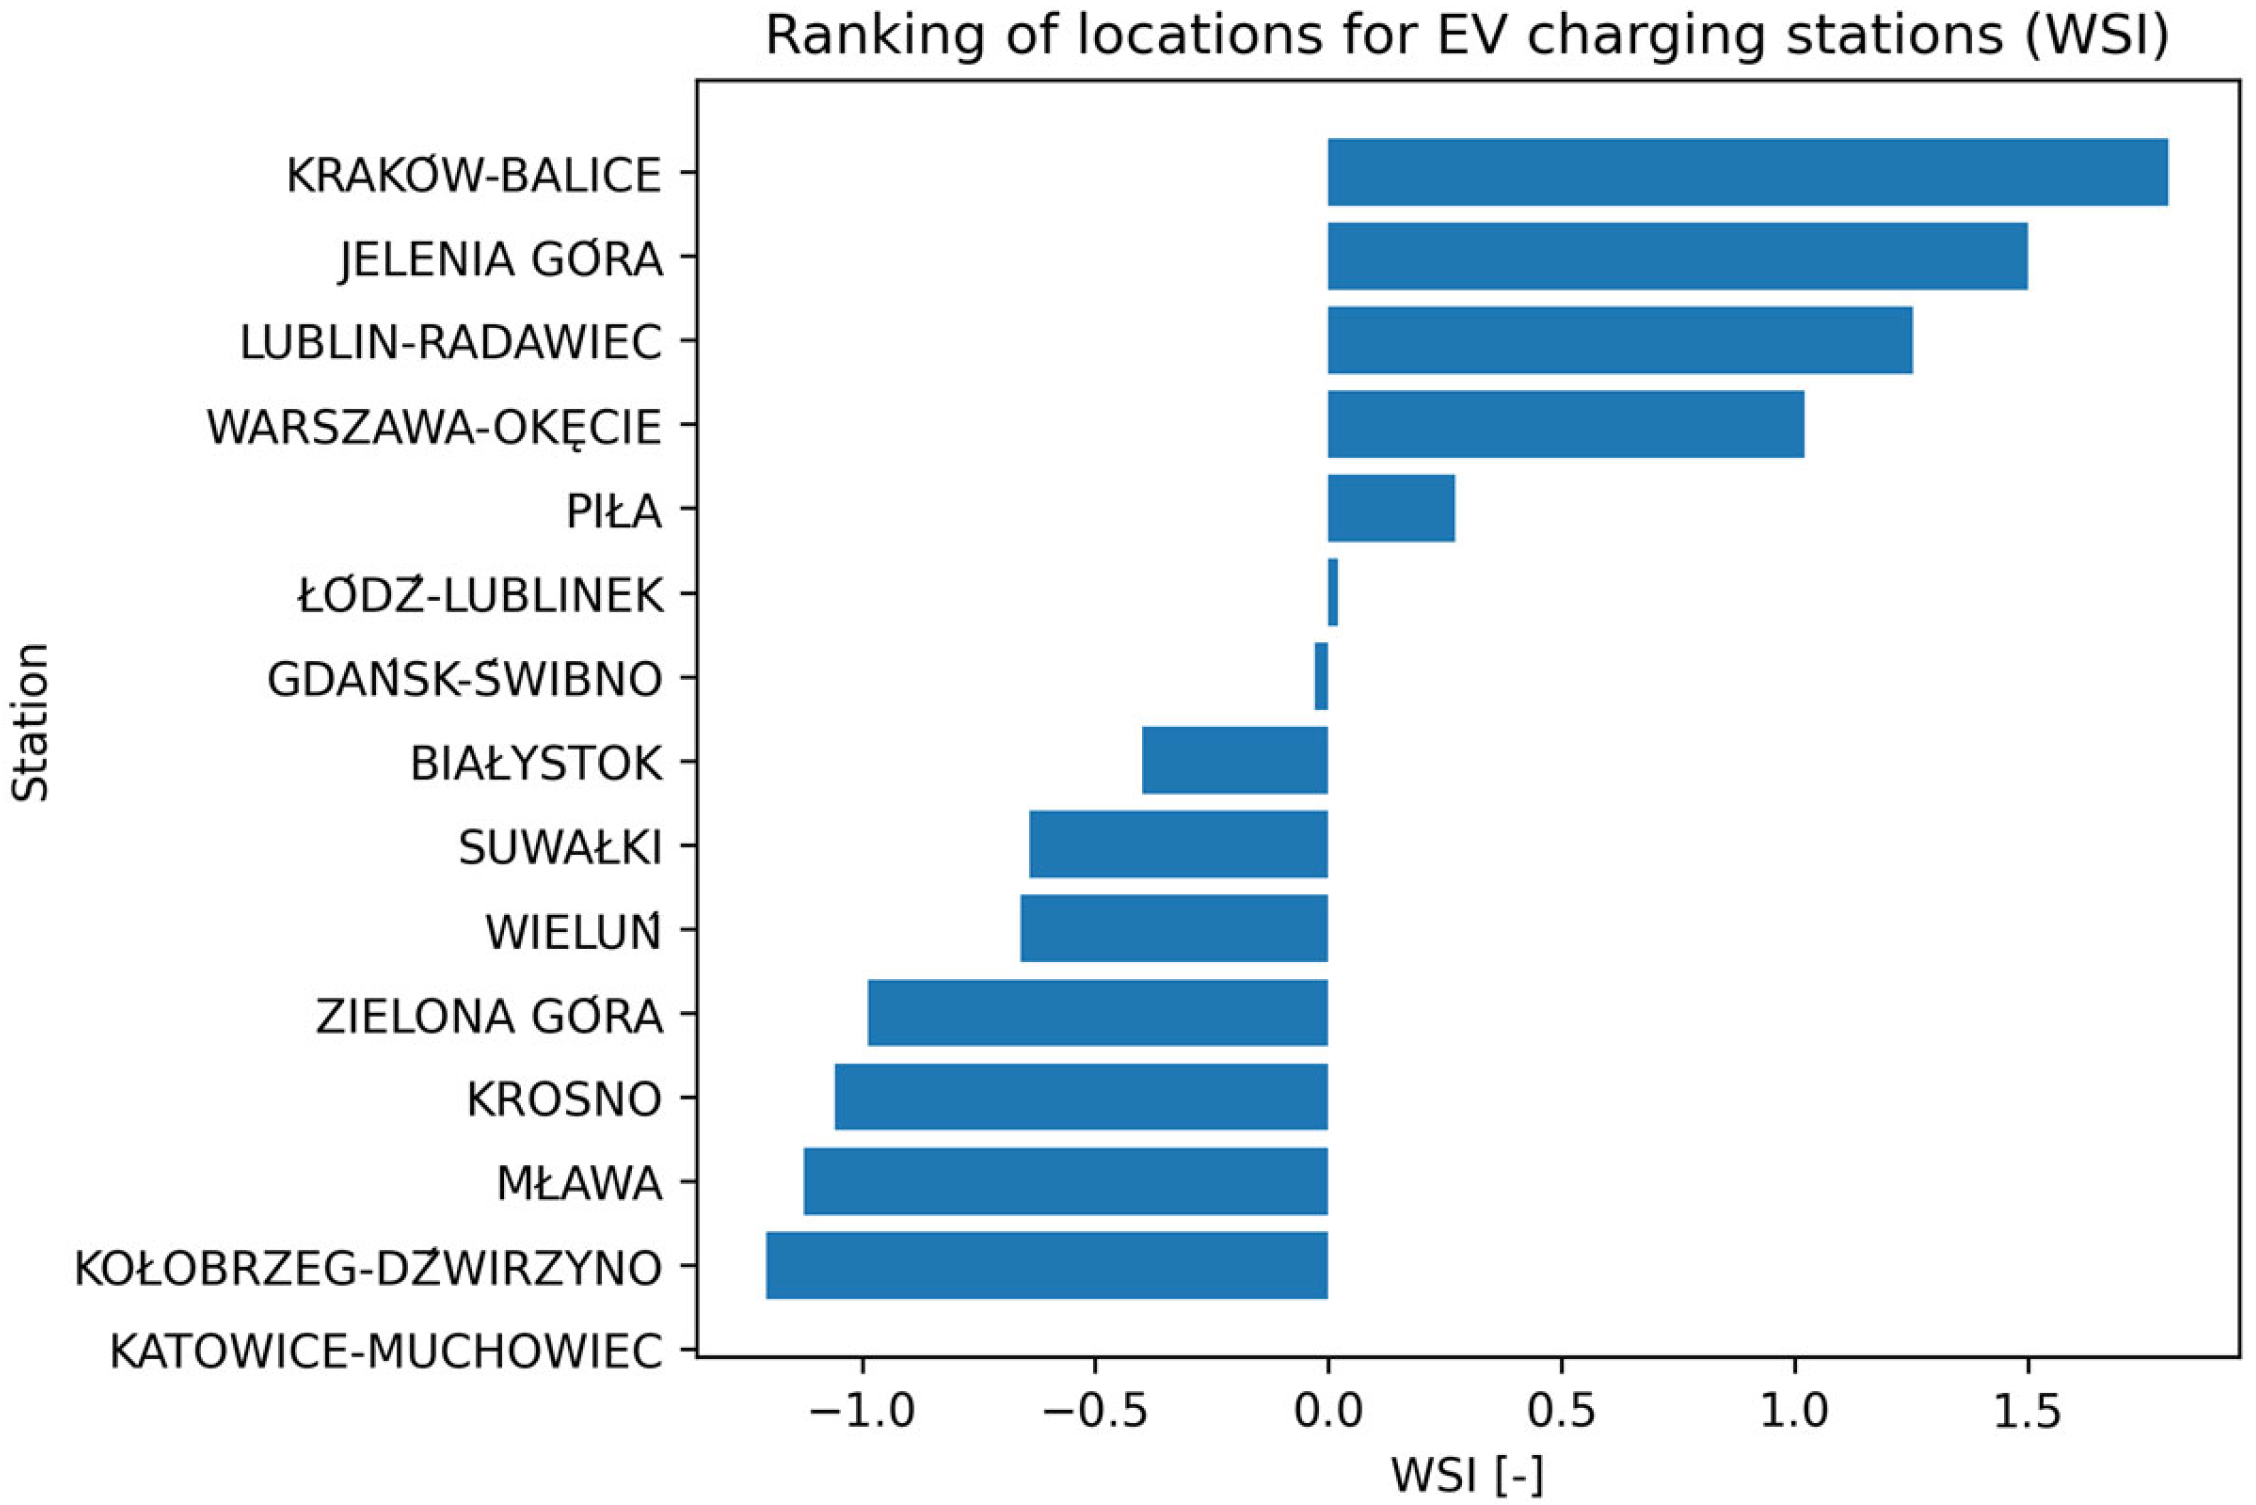
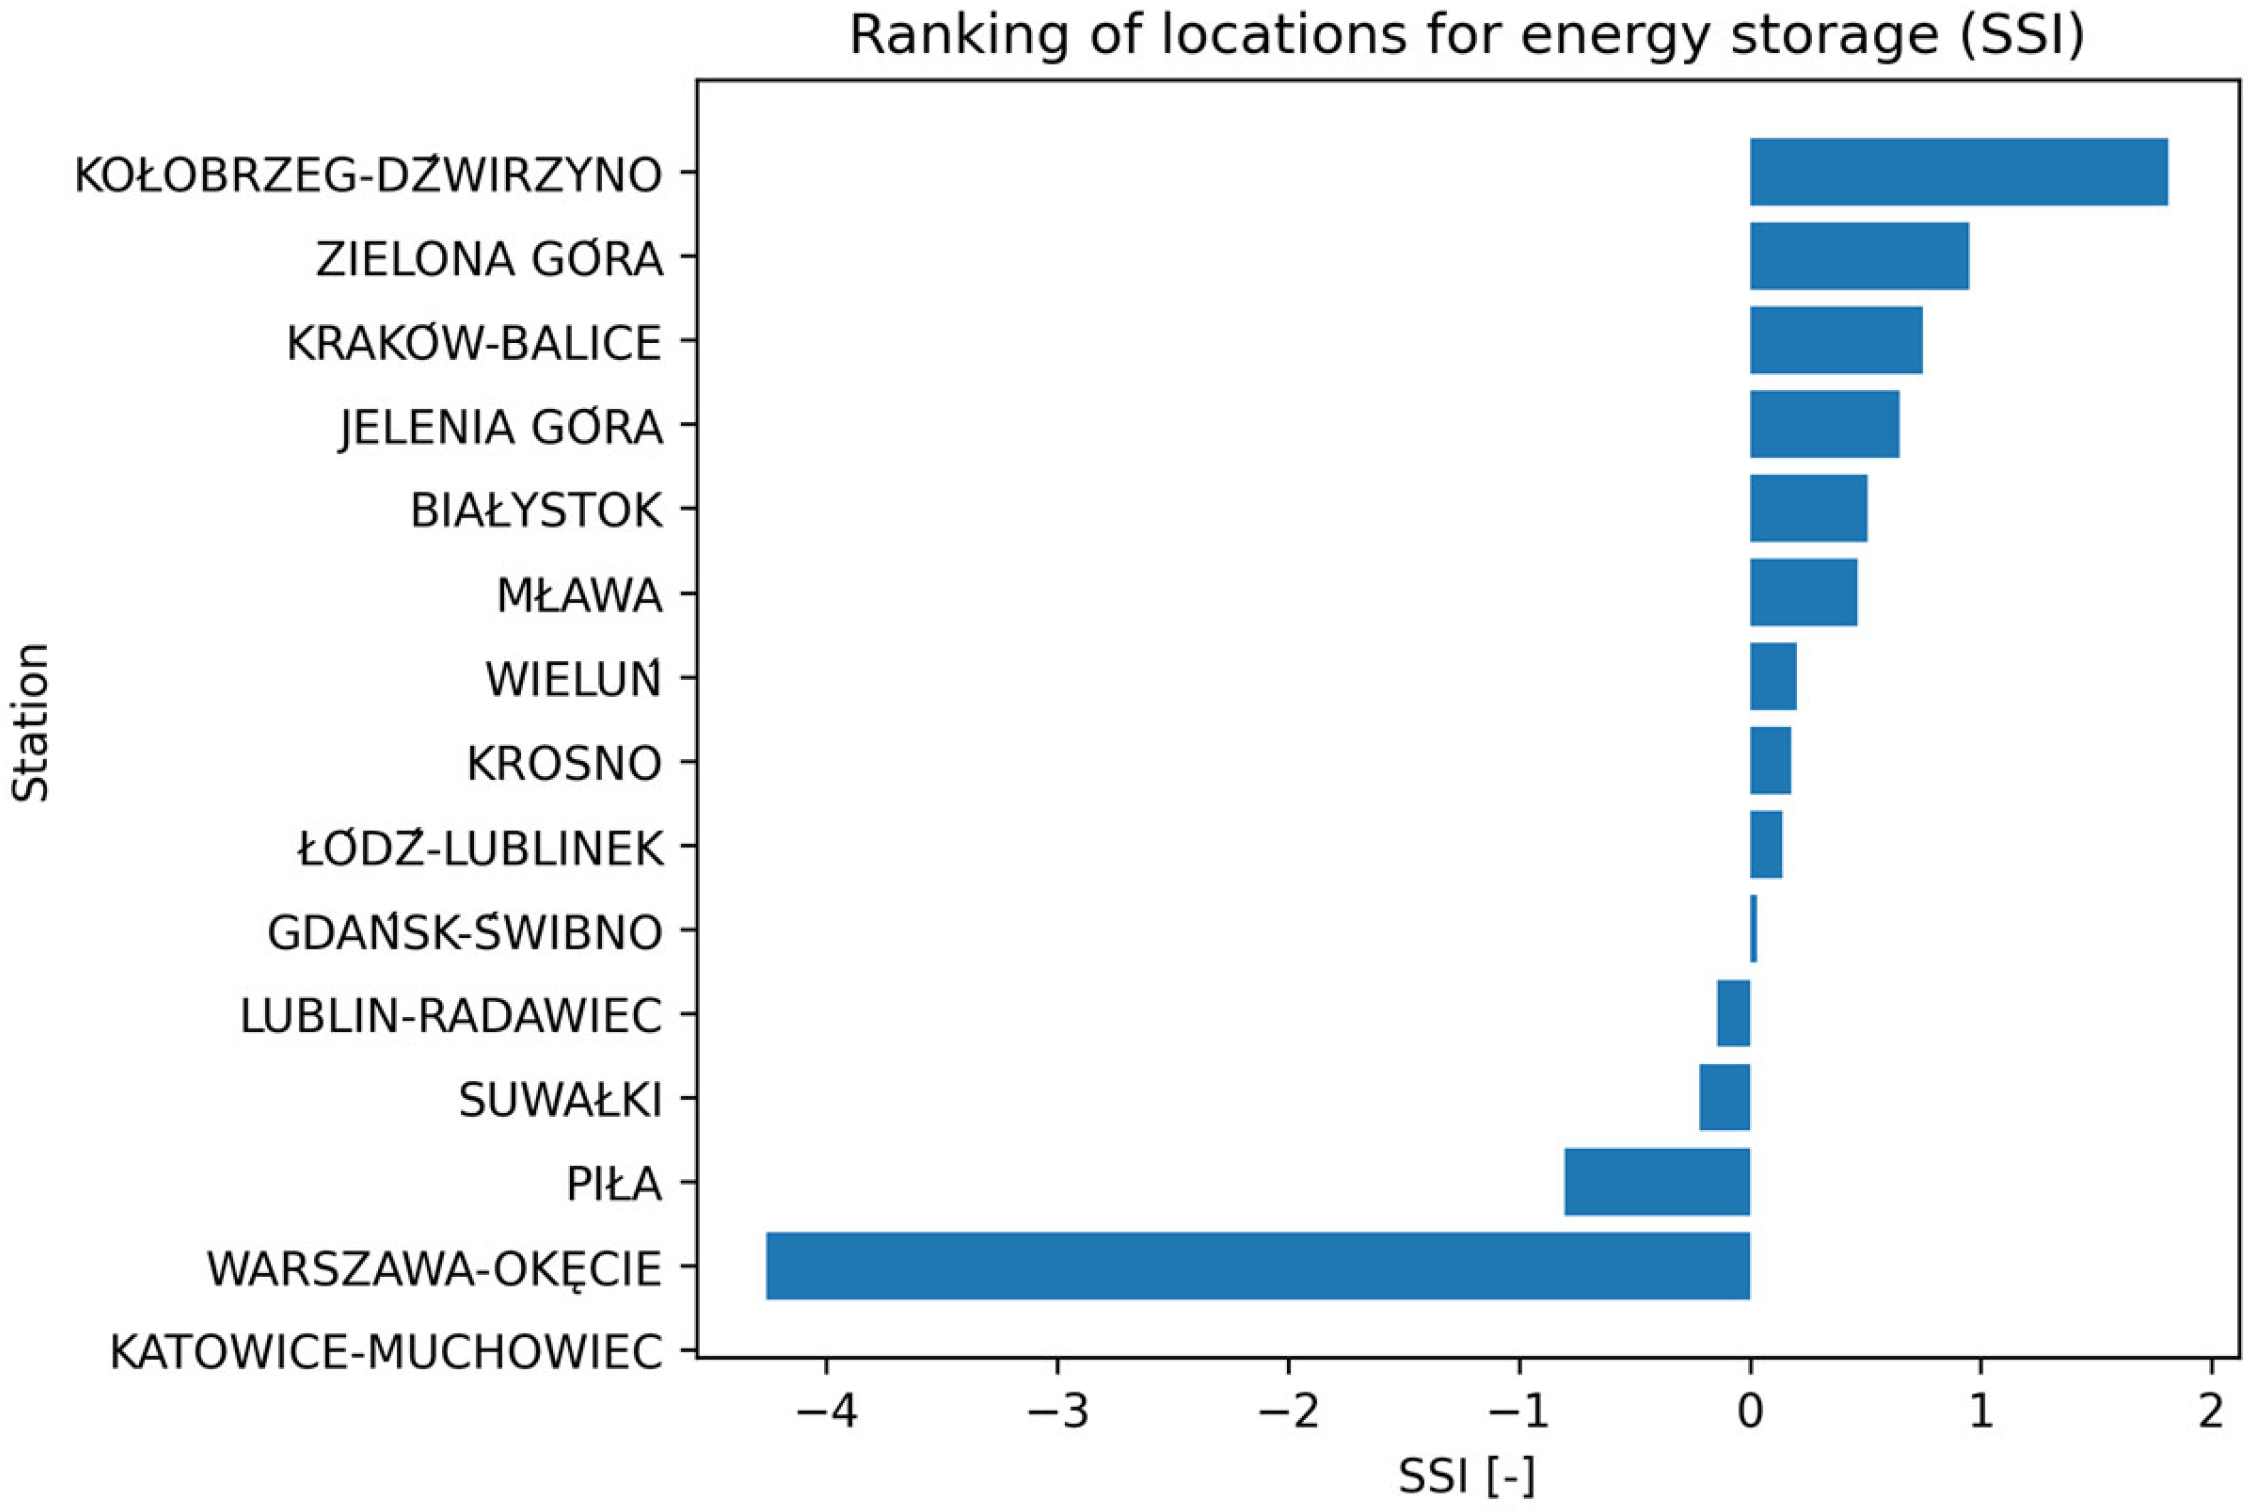
Presented results show significant differences in energy potential between covered locations. The greatest energetic and economic parameters have been observed in Kraków-Balice, Jelenia Góra and Lublin-Radawiec stations, where both averaged WPD and yearly produced energy are significantly higher than for other stations. The WSI, which joins amount of wind energy, its stability and time trend, achieved the greatest values for Kraków-Balice (1.802), Jelenia Góra (1.499), Lublin-Radawiec (1.253) and Warszawa-Okęcie (1.021), indicating that these stations are the most promising locations for wind-powered EV charging stations. On the other hand, the greatest values of the SSI, which indicate the need for energy storage due to increased fluctuations and risk of energy scarcity, have been observed for Kołobrzeg-Dźwirzyno (1.814), Zielona Góra (0.949) and Kraków-Balice (0.75). On the opposite end of the spectrum, where the lowest values have been observed, one may place Warszawa-Okecie (−4.257).

4.2. Wind Power Parameters

The results presented in Figure 2, Figure 3, Figure 4, Figure 5 and Figure 6 were obtained using the equations described in Section 3, including wind power density calculation (Equations (1)–(3)), trend estimation (Equation (13)), variability indicators (Equations (7) and (8)) and synthetic indices WSI and SSI (Equations (11) and (12)).
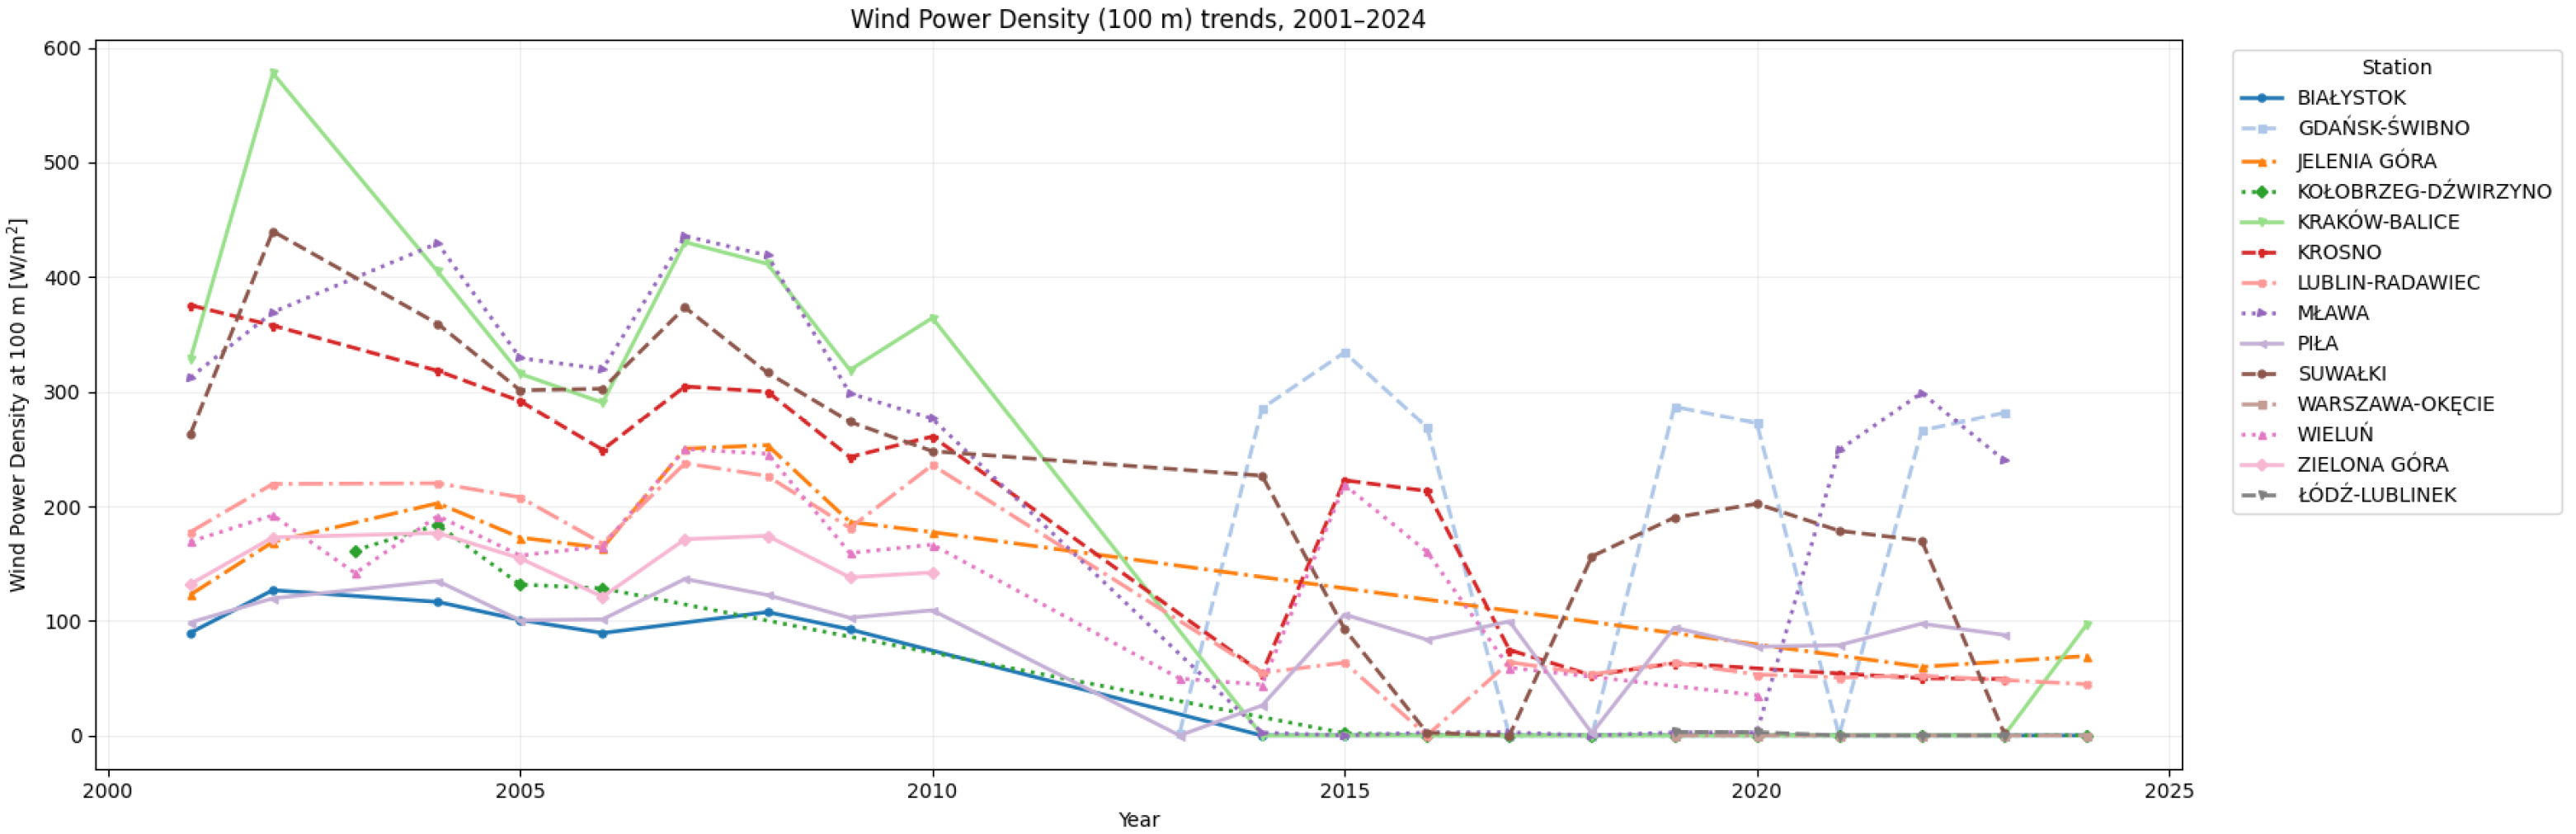
Figure 2 shows the yearly averaged WPD levels for all included stations over the entire study period (2001–2024).One may observe a clearly decreasing trend, especially since 2010, when most of the stations indicate WPD reduction of 30–60% in relation to initial values. The greatest amount of wind power density in first decade of the 21st century is observed, amongst others, in Jelenia Góra, Kraków-Balice, Lublin-Radawiec and Kołobrzeg-Dźwirzyno, but since 2010 the WPD in these stations has been reduced as well. That reflects both climate changes and increased yearly variation of wind change. On the other hand, Warszawa-Okęcie, Zielona Góra and Jelenia Góra are characterised by relatively stable but lower, as in previous years, amount of WPD. That confirms higher resilience for seasonal variation in wind speed.
Generally, the plots present that despite an overall decreasing trend for all included locations, a difference between respective stations remains. That justifies the implementation of the WSI and SSI and ranking the respective locations.
In the years 2001–2010, most of the included locations indicated relatively high and stabile values of wind power density, with a clearly visible maximum in the years 2004–2007. Since 2012, one may observe a clear reducing trend, especially in lowlands. This also reflects higher values of scarcity, which means an increasing risk of a lack of energy. In the whole analysed set of locations, one may pay attention to Jelenia Góra and Kraków-Balice, where the WPD level is the greatest and most resistant to losses. Warszawa-Okęcie and Zielona Góra also show beneficial wind conditions. Meanwhile, Katowice-Muchowiec, Łódź-Lublinek and Kielce indicate a significant reduction in energy resources.
The WSI was implemented as a comprehensive metric of usefulness of a given location as a wind-powered EV charger. The rank of analysed location, presented in Figure 3, clearly identifies places where the local amount of wind may be successfully utilised as a power supply of EV charging stations, without loading the electric power network. The highest values of the WSI correspond to high wind power density combined with low fluctuations and a favourable economic profile, which makes such locations particularly attractive for practical implementation.
The rankings show that Kraków-Balice and Jelenia Góra dominates. It is worth seeing the following at Warszawa-Okęcie: despite moderate amount of energy, this location has a good WSI result due to very good stability and almost no long-term changing. In contrast, Kołobrzeg and Mława have negative WSI—strong fluctuations and adverse trends strongly reduce the possibility of using wind-powered EV chargers.
Another analysis is focused on the SSI. In contrary to WSI, this index grants highly predictable and a stable amount of generated energy and a low risk of a steep reduction in generated energyIn such cases, the energy storage system can operate under stable conditions, without undergoing deep charge–discharge cycles. Eventually, the SSI will indicate locations with the greatest robustness and work regularity in the long term.
The SSI rankings show (Figure 4) Kołobrzeg-Dźwirzyno as a location where energy storage may be most beneficial. In this case, it is a result of high fluctuations of energy and deep, periodic losses of WPD that—ironically—becomes an advantage: more ‘fickle’ wind means a greater need of storing energy and entails better work conditions (low risk of deep discharge or overload). High SSI values have also been calculated for Zielona Góra and Kraków-Balice, where variation and character of oscillations create advantageous conditions of storage work that favour effective balancing of short losses of generated energy. Essentially, it means that these locations are most promising if a local wind powerplant powers the receivers in a stable manner and the storage plays the role of a filter.
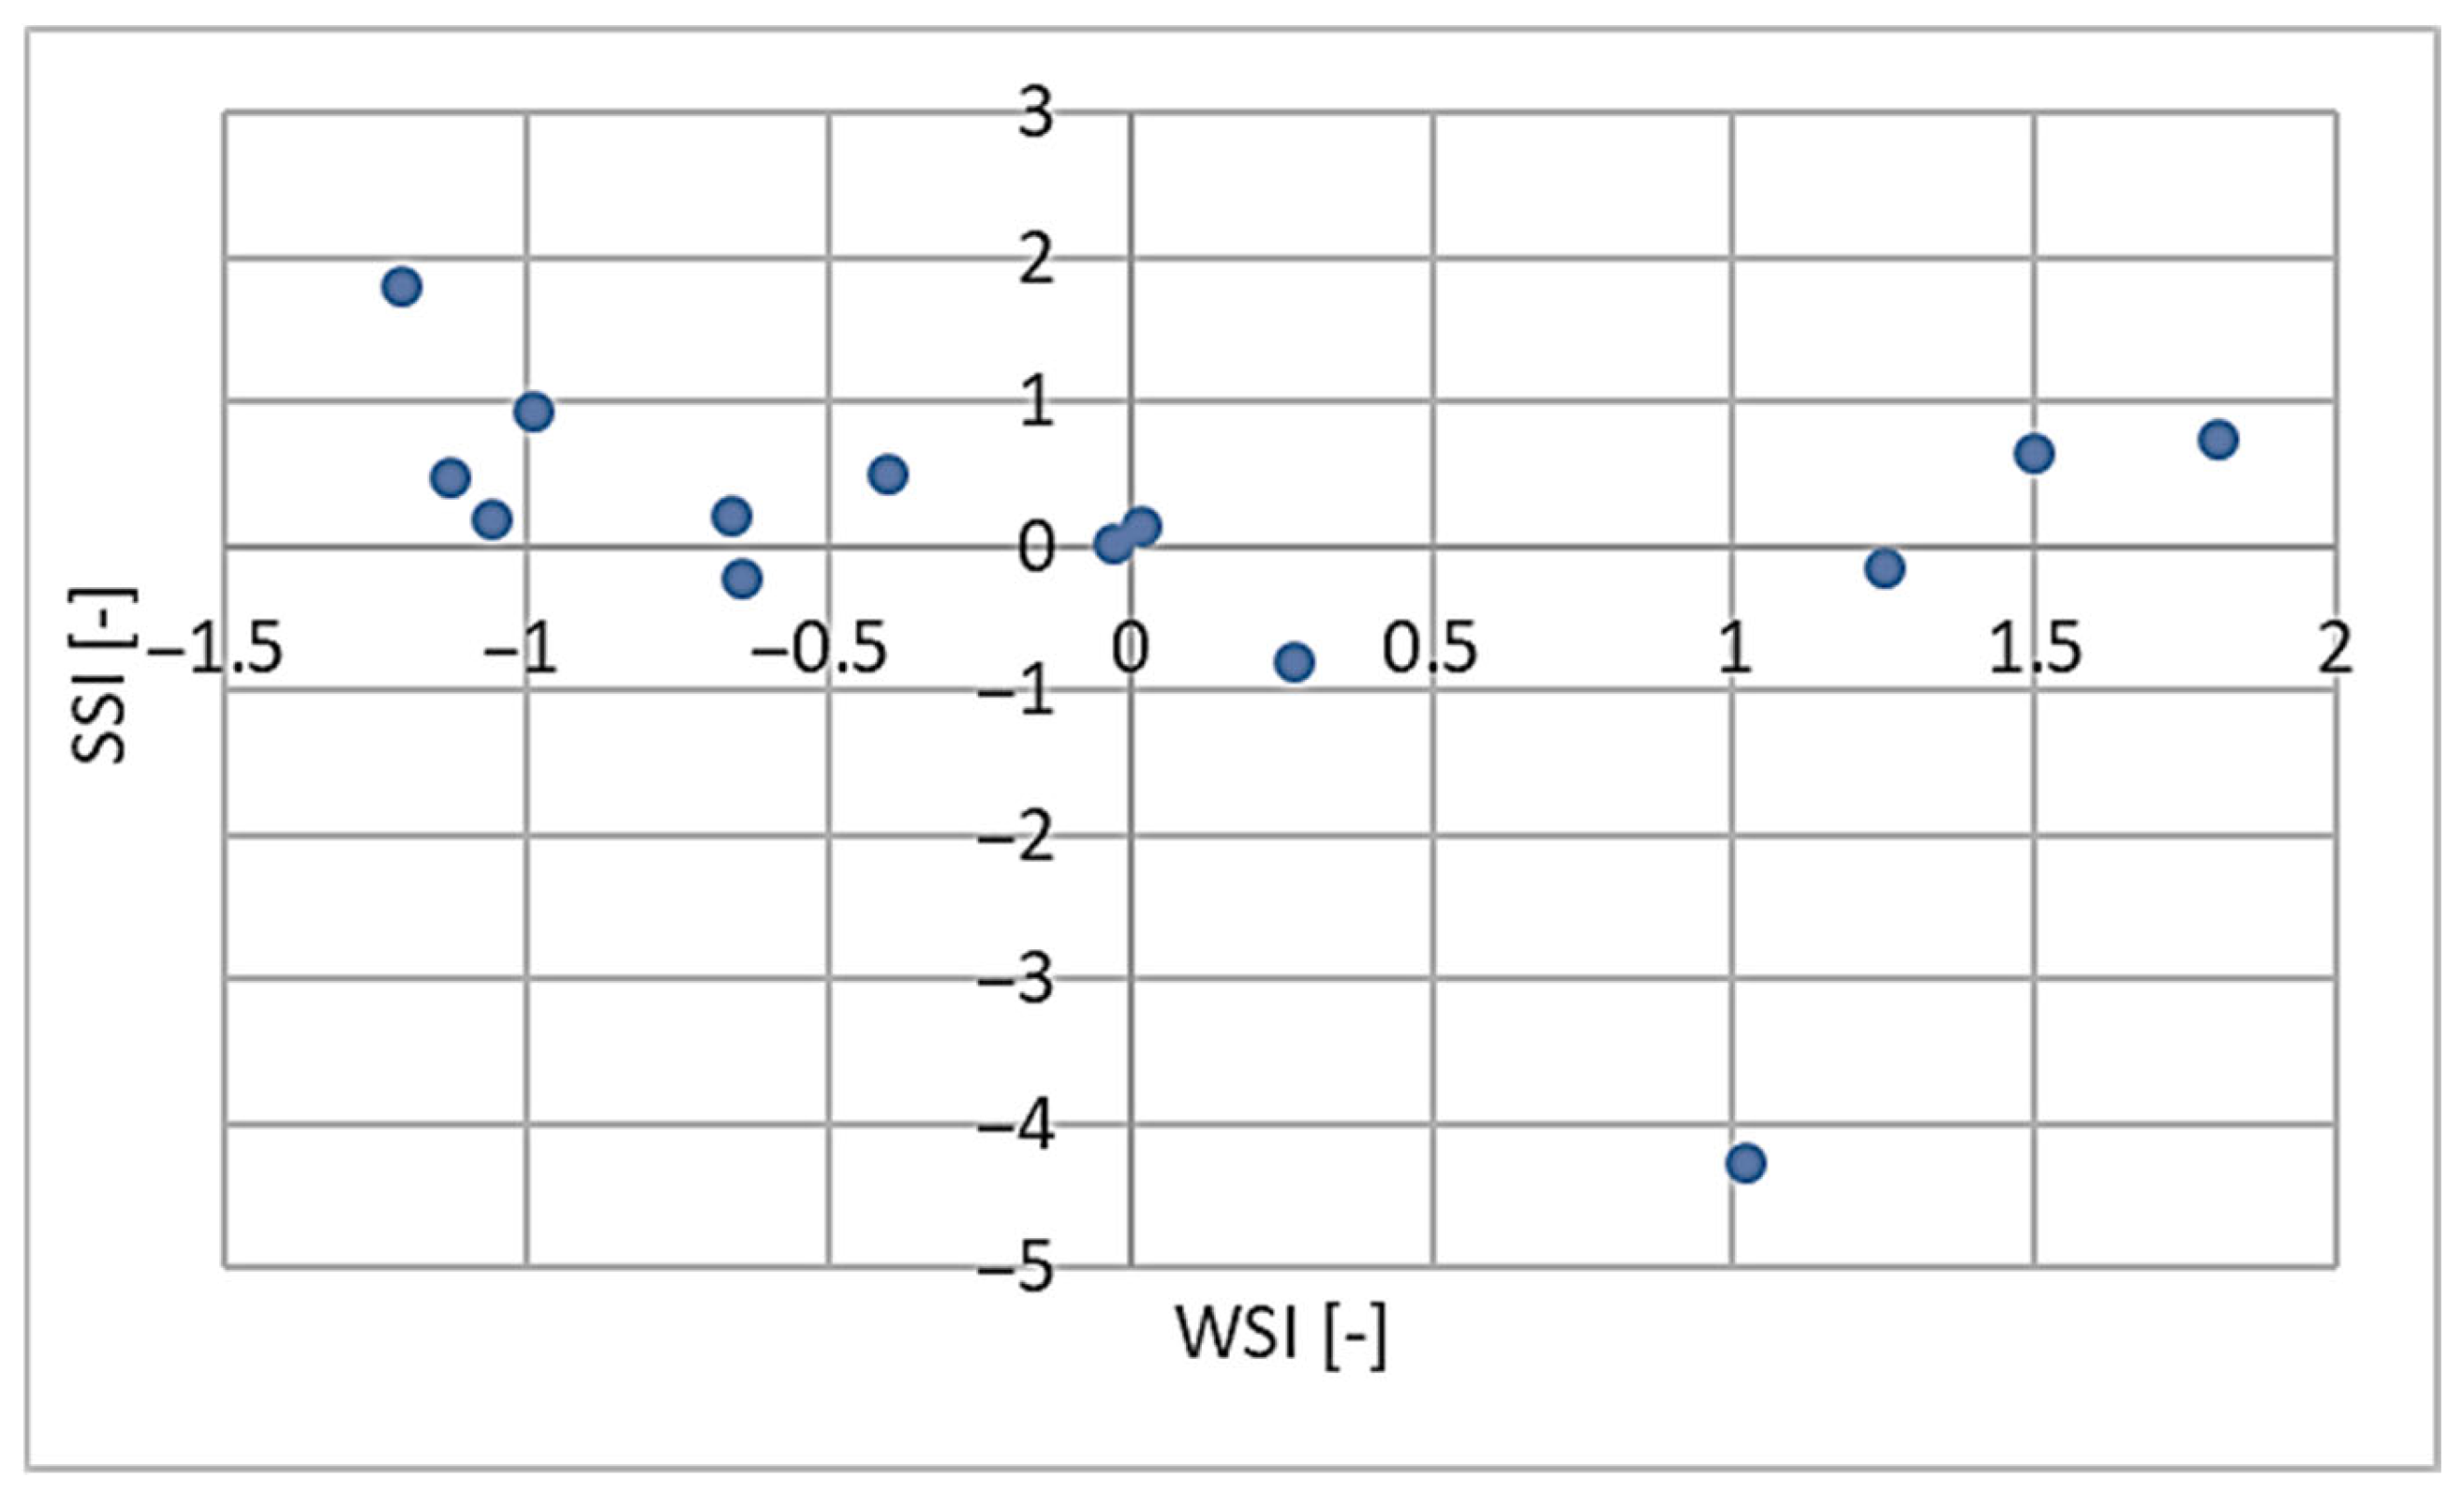
To analyse both indexes together, we put them in common plot (see Figure 5). It shows which locations offer the greatest amount of energy (points shifted to the right—high WSI values) and best stability (points shifted downwards—least SSI indexes). Points located in the lower-right part of the plot represent locations with both high wind energy suitability and low variability, whereas points shifted upwards indicate an increasing need for energy storage to ensure reliable operation. One may see that the SSI has much less discrepancy that the WSI. This leads to the conclusion that the stations that are characterised by the highest wind energy offer also good stability—no energy storage is necessary.
Higher WSI values indicate locations with high wind energy potential and stability suitable for wind-powered EV charging stations, while higher SSI values indicate locations where significant variability and scarcity of wind resources justify the use of energy storage systems.
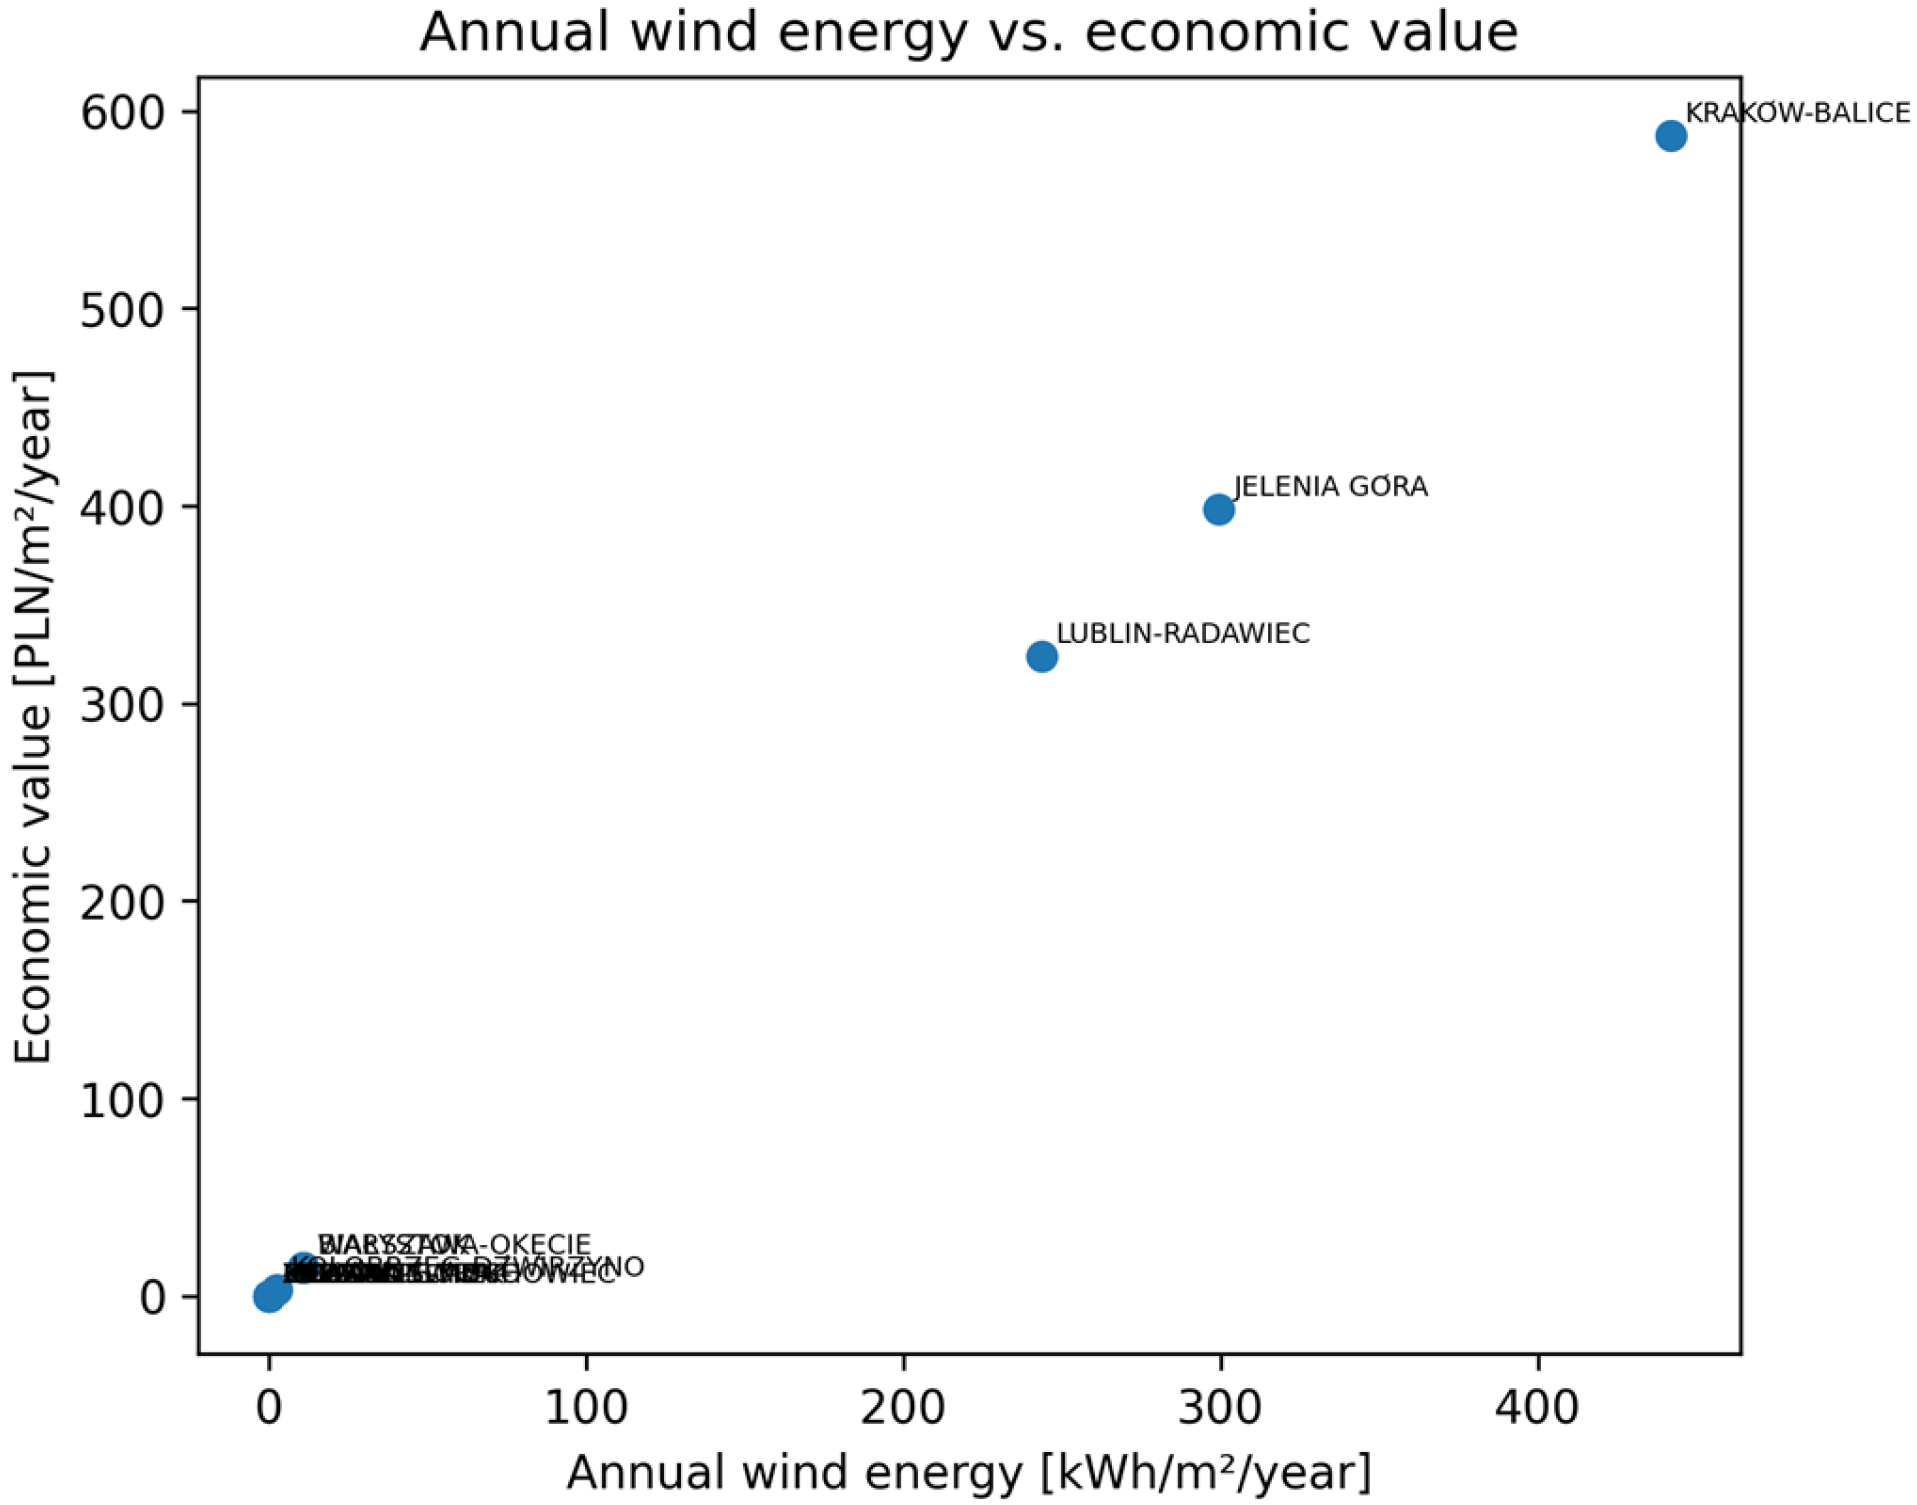
A dependency between yearly energy potential and economical value of generated energy is a pillar to judge the profitability of wind energy in electromobility solutions. Even despite similar levels of WPD, a difference in energy fluctuations may lead to a difference in achieved economical profits. A similar effect concerns local prices of energy or structural differences in seasonal timings of WPD. Figure 5 illustrates the relationship between energetic potential and the economic value of the generated energy available for charging stations or energy storage systems, allowing beneficial and unstable locations to be identified.
Figure 6 is based on analytically calculated annual wind energy per unit area and its corresponding economic value, derived according to Equations (9) and (10); no external simulation software or numerical solver was used.
Figure 6 clearly shows the dominancy of three points, Kraków-Balice, Jelenia Góra and Lublin-Radawiec, where both the greatest amount of energy and the highest potential incomes have been achieved. It means that it generates the amount of energy which allows us to practically apply it into empowering EV charging stations. In contrast, most of the included stations achieved much lower results, with annual energy below 20 kWh/m2/year and with economical value below 20 PLN/m2/year. These results indicate that, in other locations, the available energy is insufficient for practical solutions supporting electromobility, regardless of local electricity prices or other site-specific constraints.

5. Conclusions

The analysis of long-term wind energy resources in Poland in 2001–2024 clearly show that local wind conditions are significantly diversified both in time and space domains. Most stations exhibit a decreasing trend in wind energy since 2010, which confirms the stalling phenomenon described in the literature, as well as an increase in seasonal variability of wind resources. Despite this trend, energetic potential in many locations is sufficient to empower the EV chargers or local energy storage.
Most beneficial wind conditions—both in terms of wind power density and yearly averaged energy per 1 m2—have been achieved in the cases of Kraków-Balice, Jelenia Góra and Lublin-Radawiec meteorological stations. These locations consequently dominate the rankings: they achieve the highest WSI values, are most resistant for seasonal fluctuations and generate economically useful amounts of wind energy. Moreover, in the context of integration with the electric network, such powerplants may play the role of a local energetic hub that reduces loading of the network and supports electromobility.
Meanwhile, the SSI shows three of the most advantageous locations in terms of energy storage: Kołobrzeg–Dźwirzyno, Zielona Góra and (again) Kraków–Balice. In this case, strong fluctuations and significant WPD losses occur; therefore, energy storage is required to efficiently support the overall performance and robustness of the system. It should be underlined then that a location with irregular wind energy resources is typically rejected, but if a proper supporting infrastructure could be included, they could be effectively exploited.
The relationship between energetic potential and economic value indicates that, in most of the analysed locations, the available energy is insufficient to supply EV chargers independently. Most of the locations lie below the 20 kWh/m2/year threshold, which in practice means limited usefulness. On the other hand, three dominant stations generate values above this level, which suggests that they may be considered to implement in solutions based on EV–wind energy integration.
In general, the achieved results confirm that long-time meteorological data may become a valuable base to select a location of charging infrastructure and energy storage. The wind-first approach proposed in this paper, which combines the analysis of WPD, energy variation and its time trend, as well as its selling price, allows us to identify locations where wind resources may effectively support energetic transform and electromobility development. The results presented in this paper are a starting point to further research, aimed at integration with the electric power network, modelling of the energy storage work and optimisation of charging points in local and mesoscale approaches.

Author Contributions

Conceptualization, O.O., M.Z.-L., P.R., P.L., S.F., O.R., J.M., E.S. and M.M.; methodology O.O., M.Z.-L., P.R., P.L., S.F., O.R., J.M., E.S. and M.M.; software, O.O., M.Z.-L., P.R., P.L., S.F., O.R., J.M., E.S. and M.M.; validation, O.O., M.Z.-L., P.R., P.L., S.F., O.R., J.M., E.S. and M.M.; formal analysis, O.O., M.Z.-L., P.R., P.L., S.F., O.R., J.M., E.S. and M.M.; resources, O.O., M.Z.-L., P.R., P.L., S.F., O.R., J.M., E.S. and M.M.; writing—original draft preparation, O.O., M.Z.-L., P.R., P.L., S.F., O.R., J.M., E.S. and M.M.; writing—review and editing, O.O., M.Z.-L., P.R., P.L., S.F., O.R., J.M., E.S. and M.M.; visualization, O.O., M.Z.-L., P.R., P.L., S.F., O.R., J.M., E.S. and M.M.; supervision O.O., M.Z.-L., P.R., P.L., S.F., O.R., J.M., E.S. and M.M.; funding acquisition, O.O. All authors have read and agreed to the published version of the manuscript.

Funding

This research was carried out as part of work no. WZ/WIZ-INZ/2/2025 at the Bialystok University of Technology and financed from a research subsidy provided by the minister of science (Olga Orynycz).

Data Availability Statement

The original contributions presented in this study are included in the article. Further inquiries can be directed to the corresponding authors.

Conflicts of Interest

The authors declare no conflicts of interest.

Abbreviations

The following abbreviations are used in this manuscript:
EVElectric Vehicle
WPDWind Power Density
CVCoefficient of Variation
WSIWind Siting Index
SSIStorage Suitability Index
IMGWInstitute of Meteorology and Water Management
PVPhotovoltaics
V2GVehicle-to-Grid
GISGeographic Information System

References

  1. Kubiak, M.; Bugała, A.; Bugała, D.; Czekała, W. Simulation Analysis of Onshore and Offshore Wind Farms’ Generation Potential for Polish Climatic Conditions. Energies 2025, 18, 4087. [Google Scholar] [CrossRef]
  2. Barzehkar, M.; Parnell, K.; Soomere, T.; Koivisto, M. Offshore Wind Power Plant Site Selection in the Baltic Sea. Reg. Stud. Mar. Sci. 2024, 73, 103469. [Google Scholar] [CrossRef]
  3. Liu, J.; Yang, X.; Zhuge, C. A Joint Model of Infrastructure Planning and Smart Charging Strategies for Shared Electric Vehicles. Green Energy Intell. Transp. 2024, 3, 100168. [Google Scholar] [CrossRef]
  4. Cheng, Q.; Xiong, Y.; Liu, J. The Impact of Electric Vehicle Adoption on Regional Energy Market Integration in China. Asian Econ. J. 2025, 39, 217–244. [Google Scholar] [CrossRef]
  5. Zhao, H.; Lu, C.; Zhang, Y. Optimal Site Selection for Wind-Photovoltaic-Complemented Storage Power Plants Based on Geographic Information System and Grey Relational Analysis-Group Criteria Importance Through Inter Criteria Correlation-Interactive and Multicriteria Decision Making: A Case Study of China. J. Energy Storage 2024, 92, 112148. [Google Scholar] [CrossRef]
  6. Ruan, P.; Su, Q.; Zhang, L.; Luo, J.; Diao, Y.; Xie, L.; Zheng, H. Optimal Siting and Sizing of Hybrid Energy Storage Systems in High-Penetration Renewable Energy Systems. Energies 2025, 18, 2196. [Google Scholar] [CrossRef]
  7. Li, S.; Zhao, P.; Gu, C.; Li, J.; Cheng, S.; Xu, M. Battery Protective Electric Vehicle Charging Management in Renewable Energy System. IEEE Trans. Ind. Inform. 2023, 19, 1312–1321. [Google Scholar] [CrossRef]
  8. Zhang, Y.; Zhang, P.; Du, S.; Dong, H. Economic Optimal Scheduling of Integrated Energy System Considering Wind–Solar Uncertainty and Power to Gas and Carbon Capture and Storage. Energies 2024, 17, 2770. [Google Scholar] [CrossRef]
  9. Orynycz, O.; Ruchała, P.; Tucki, K.; Wasiak, A.; Zöldy, M. A Theoretical Analysis of Meteorological Data as a Road towards Optimizing Wind Energy Generation. Energies 2024, 17, 2765. [Google Scholar] [CrossRef]
  10. Zhang, Y.; Li, R.; Zhang, J. Optimization Scheme of Wind Energy Prediction Based on Artificial Intelligence. Environ. Sci. Pollut. Res. 2021, 28, 39966–39981. [Google Scholar] [CrossRef]
  11. LaMonaca, S.; Ryan, L. The State of Play in Electric Vehicle Charging Services—A Review of Infrastructure Provision, Players, and Policies. Renew. Sustain. Energy Rev. 2022, 154, 111733. [Google Scholar] [CrossRef]
  12. Golsefidi, A.H.; Hipolito, F.; Pereira, F.C.; Samaranayake, S. Incremental Expansion of Large Scale Fixed and Mobile Charging Infrastructure in Stochastic Environments: A Novel Graph-Based Benders Decomposition Approach. Appl. Energy 2025, 380, 124985. [Google Scholar] [CrossRef]
  13. Awasthi, A.; Venkitusamy, K.; Padmanaban, S.; Selvamuthukumaran, R.; Blaabjerg, F.; Singh, A.K. Optimal Planning of Electric Vehicle Charging Station at the Distribution System Using Hybrid Optimization Algorithm. Energy 2017, 133, 70–78. [Google Scholar] [CrossRef]
  14. Woo, H.; Son, Y.; Cho, J.; Kim, S.-Y.; Choi, S. Optimal Expansion Planning of Electric Vehicle Fast Charging Stations. Appl. Energy 2023, 342, 121116. [Google Scholar] [CrossRef]
  15. Kumar, A.; Semwal, P.R. Strategic Design of Electric Vehicle Charging Stations within Power Distribution Networks. e-Prime—Adv. Electr. Eng. Electron. Energy 2025, 12, 100965. [Google Scholar] [CrossRef]
  16. Kang, J.; Kong, H.; Lin, Z.; Dang, A. Mapping the Dynamics of Electric Vehicle Charging Demand within Beijing’s Spatial Structure. Sustain. Cities Soc. 2022, 76, 103507. [Google Scholar] [CrossRef]
  17. Esmaili, A.; Oshanreh, M.M.; Naderian, S.; MacKenzie, D.; Chen, C. Assessing the Spatial Distributions of Public Electric Vehicle Charging Stations with Emphasis on Equity Considerations in King County, Washington. Sustain. Cities Soc. 2024, 107, 105409. [Google Scholar] [CrossRef]
  18. Soczówka, P.; Lasota, M.; Franke, P.; Żochowska, R. Method of Determining New Locations for Electric Vehicle Charging Stations Using GIS Tools. Energies 2024, 17, 4546. [Google Scholar] [CrossRef]
  19. Straub, F.; Streppel, S.; Göhlich, D. Methodology for Estimating the Spatial and Temporal Power Demand of Private Electric Vehicles for an Entire Urban Region Using Open Data. Energies 2021, 14, 2081. [Google Scholar] [CrossRef]
  20. Powell, S.; Cezar, G.V.; Min, L.; Azevedo, I.M.L.; Rajagopal, R. Charging Infrastructure Access and Operation to Reduce the Grid Impacts of Deep Electric Vehicle Adoption. Nat. Energy 2022, 7, 932–945. [Google Scholar] [CrossRef]
  21. Miraftabzadeh, S.M.; Longo, M.; Foiadelli, F. Estimation Model of Total Energy Consumptions of Electrical Vehicles under Different Driving Conditions. Energies 2021, 14, 854. [Google Scholar] [CrossRef]
  22. Mohammed, A.; Saif, O.; Abo-Adma, M.; Fahmy, A.; Elazab, R. Strategies and Sustainability in Fast Charging Station Deployment for Electric Vehicles. Sci. Rep. 2024, 14, 283. [Google Scholar] [CrossRef]
  23. Chodakowska, E.; Nazarko, J.; Nazarko, Ł. ARIMA Models in Electrical Load Forecasting and Their Robustness to Noise. Energies 2021, 14, 7952. [Google Scholar] [CrossRef]
  24. Domínguez-Navarro, J.A.; Dufo-López, R.; Yusta-Loyo, J.M.; Artal-Sevil, J.S.; Bernal-Agustín, J.L. Design of an Electric Vehicle Fast-Charging Station with Integration of Renewable Energy and Storage Systems. Int. J. Electr. Power Energy Syst. 2019, 105, 46–58. [Google Scholar] [CrossRef]
  25. Ganesh, P.A.; Subhash, S.O.; Sonu, P.D.; Rajendra, W.G.; Dattatray, B.T. Development of Electrical Vehicle Charging Station with Renewable Energy Integration. Int. J. Adv. Res. Sci. Commun. Technol. 2025, 5, 139–142. [Google Scholar] [CrossRef]
  26. Singh, S.; Chauhan, P.; Jap Singh, N. Feasibility of Grid-Connected Solar-Wind Hybrid System with Electric Vehicle Charging Station. J. Mod. Power Syst. Clean Energy 2021, 9, 295–306. [Google Scholar] [CrossRef]
  27. Güven, A.F.; Ateş, N.; Alotaibi, S.; Alzahrani, T.; Amsal, A.M.; Elsayed, S.K. Sustainable Hybrid Systems for Electric Vehicle Charging Infrastructures in Regional Applications. Sci. Rep. 2025, 15, 4199. [Google Scholar] [CrossRef]
  28. Marks-Bielska, R.; Bielski, S.; Pik, K.; Kurowska, K. The Importance of Renewable Energy Sources in Poland’s Energy Mix. Energies 2020, 13, 4624. [Google Scholar] [CrossRef]
  29. Kryszk, H.; Kurowska, K.; Marks-Bielska, R.; Bielski, S.; Eźlakowski, B. Barriers and Prospects for the Development of Renewable Energy Sources in Poland during the Energy Crisis. Energies 2023, 16, 1724. [Google Scholar] [CrossRef]
  30. Zalewska, J.; Damaziak, K.; Malachowski, J. An Energy Efficiency Estimation Procedure for Small Wind Turbines at Chosen Locations in Poland. Energies 2021, 14, 3706. [Google Scholar] [CrossRef]
  31. Jurasz, J.; Mikulik, J.; Dąbek, P.B.; Guezgouz, M.; Kaźmierczak, B. Complementarity and ‘Resource Droughts’ of Solar and Wind Energy in Poland: An ERA5-Based Analysis. Energies 2021, 14, 1118. [Google Scholar] [CrossRef]
  32. Bochenek, B.; Dąbek, P.; Ostraszewski, M.; Ustrnul, Z.; Jurasz, J. Circulation Types and Their Relationship with Extreme Wind Energy Generation Events in Poland. Meteorol. Hydrol. Water Manag. 2024, 12. [Google Scholar] [CrossRef]
  33. Wu, J.; Zha, J.; Zhao, D.; Yang, Q. Changes in Terrestrial Near-Surface Wind Speed and Their Possible Causes: An Overview. Clim. Dyn. 2018, 51, 2039–2078. [Google Scholar] [CrossRef]
  34. Martinez, A.; Iglesias, G. Climate-Change Effects on Wind Resources in Europe and North America Based on the Shared Socioeconomic Pathways. J. Sustain. Dev. Energy Water Environ. Syst. 2024, 12, 1–16. [Google Scholar] [CrossRef]
  35. Feng, S.; Song, Z.; Yang, Q.; Hou, Y.; Wang, Z.; Liu, F.; Wang, B.; Wang, W. Long-term Changes of Wind Resources and Its Impact on Wind Power Development under Climate Change in China. Energy Internet 2024, 1, 52–62. [Google Scholar] [CrossRef]
  36. Reyers, M.; Moemken, J.; Pinto, J.G. Future Changes of Wind Energy Potentials over Europe in a Large CMIP5 Multi-model Ensemble. Int. J. Climatol. 2016, 36, 783–796. [Google Scholar] [CrossRef]
  37. Hahmann, A.N.; García-Santiago, O.; Peña, A. Current and Future Wind Energy Resources in the North Sea According to CMIP6. Wind Energy Sci. 2022, 7, 2373–2391. [Google Scholar] [CrossRef]
  38. Robak, S.; Raczkowski, R.; Piekarz, M. Development of the Wind Generation Sector and Its Effect on the Grid Operation—The Case of Poland. Energies 2023, 16, 6805. [Google Scholar] [CrossRef]
  39. Graczyk, D.; Pińskwar, I.; Choryński, A.; Stasik, R. Less Power When More Is Needed. Climate-Related Current and Possible Future Problems of the Wind Energy Sector in Poland. Renew. Energy 2024, 232, 121093. [Google Scholar] [CrossRef]
  40. Bochenek, B.; Jurasz, J.; Jaczewski, A.; Stachura, G.; Sekuła, P.; Strzyżewski, T.; Wdowikowski, M.; Figurski, M. Day-Ahead Wind Power Forecasting in Poland Based on Numerical Weather Prediction. Energies 2021, 14, 2164. [Google Scholar] [CrossRef]
  41. Caban, J.; Małek, A.; Šarkan, B. Strategic Model for Charging a Fleet of Electric Vehicles with Energy from Renewable Energy Sources. Energies 2024, 17, 1264. [Google Scholar] [CrossRef]
  42. Gualtieri, G. A Comprehensive Review on Wind Resource Extrapolation Models Applied in Wind Energy. Renew. Sustain. Energy Rev. 2019, 102, 215–233. [Google Scholar] [CrossRef]
  43. Wan, C.; Cui, W.; Song, Y. Machine Learning-Based Probabilistic Forecasting of Wind Power Generation: A Combined Bootstrap and Cumulant Method. IEEE Trans. Power Syst. 2024, 39, 1370–1383. [Google Scholar] [CrossRef]
  44. Abad-Santjago, Á.; Peláez-Rodríguez, C.; Pérez-Aracil, J.; Sanz-Justo, J.; Casanova-Mateo, C.; Salcedo-Sanz, S. Hybridizing Machine Learning Algorithms With Numerical Models for Accurate Wind Power Forecasting. Expert Syst. 2025, 42, e13830. [Google Scholar] [CrossRef]
  45. Zhang, Y.; Wang, Y.; Li, F.; Wu, B.; Chiang, Y.-Y.; Zhang, X. Efficient Deployment of Electric Vehicle Charging Infrastructure: Simultaneous Optimization of Charging Station Placement and Charging Pile Assignment. IEEE Trans. Intell. Transp. Syst. 2021, 22, 6654–6659. [Google Scholar] [CrossRef]
  46. Pelser, T.; Weinand, J.M.; Kuckertz, P.; McKenna, R.; Linssen, J.; Stolten, D. Reviewing Accuracy & Reproducibility of Large-Scale Wind Resource Assessments. Adv. Appl. Energy 2024, 13, 100158. [Google Scholar] [CrossRef]
  47. Metais, M.O.; Jouini, O.; Perez, Y.; Berrada, J.; Suomalainen, E. Too Much or Not Enough? Planning Electric Vehicle Charging Infrastructure: A Review of Modeling Options. Renew. Sustain. Energy Rev. 2022, 153, 111719. [Google Scholar] [CrossRef]
  48. Elkadeem, M.R.; Younes, A.; Sharshir, S.W.; Campana, P.E.; Wang, S. Sustainable Siting and Design Optimization of Hybrid Renewable Energy System: A Geospatial Multi-Criteria Analysis. Appl. Energy 2021, 295, 117071. [Google Scholar] [CrossRef]
  49. Agliata, R.; Busato, F.; Presciutti, A. MCDM-Based Analysis of Site Suitability for Renewable Energy Community Projects in the Gargano District. Sustainability 2025, 17, 6376. [Google Scholar] [CrossRef]
  50. Bilal, M.; Bokoro, P.N.; Sharma, G.; Pau, G. A Cost-Effective Energy Management Approach for On-Grid Charging of Plug-in Electric Vehicles Integrated with Hybrid Renewable Energy Sources. Energies 2024, 17, 4194. [Google Scholar] [CrossRef]
  51. Available online: https://Klimat.Imgw.Pl/Pl/Meta-Dane/ (accessed on 11 November 2025).
  52. Shu, Z.R.; Jesson, M. Estimation of Weibull Parameters for Wind Energy Analysis across the UK. J. Renew. Sustain. Energy 2021, 13, 023303. [Google Scholar] [CrossRef]
  53. Seguro, J.V.; Lambert, T.W. Modern Estimation of the Parameters of the Weibull Wind Speed Distribution for Wind Energy Analysis. J. Wind Eng. Ind. Aerodyn. 2000, 85, 75–84. [Google Scholar] [CrossRef]
  54. Hulio, Z.H.; Jiang, W.; Rehman, S. Techno—Economic Assessment of Wind Power Potential of Hawke’s Bay Using Weibull Parameter: A Review. Energy Strategy Rev. 2019, 26, 100375. [Google Scholar] [CrossRef]
  55. PN-EN 1991-1-4; Impact on Constructions. The Effects of Wind.
Figure 1. Locations of analysed stations [51].
Energies 19 00434 g001
Figure 2. Wind power density trends for 2001–2024.
Energies 19 00434 g002
Figure 3. Ranking of locations for EV charging stations (WSI).
Energies 19 00434 g003
Figure 4. Ranking of storage suitability (SSI).
Energies 19 00434 g004
Figure 5. Combination of WSI and SSI indexes.
Energies 19 00434 g005
Figure 6. Relationship between annual wind energy potential and economic value.
Energies 19 00434 g006
Table 1. Wind energy parameters and indexes for covered location.
StationReference YearWPD (Ref. Year) [W/m2]Mean WPD [W/m2]Trend Slope [W/m2/rok]CV [−]Deficit Index [−]Annual Energy [kWh/m2/rok] |Economic Value [PLN/m2/rok]WSISSI
BIAŁYSTOK20241.22831.172−3.7671.0790.96110.75714.306−0.40.512
GDAŃSK-ŚWIBNO20240.0113.887−1.7780.8741.00.00.0−0.0280.033
JELENIA GÓRA202434.18545.861−4.921.0731.0299.461398.2831.4990.651
KATOWICE-MUCHOWIEC20240.00.00.0nannan0.00.0nannan
KOŁOBRZEG-DŹWIRZYNO20240.29231.201−6.171.5740.9912.5563.399−1.2051.814
KRAKÓW-BALICE202450.43793.907−10.520.990.987441.826587.6281.8020.75
KROSNO20240.0108.82−10.0320.7341.00.00.0−1.0590.181
LUBLIN-RADAWIEC202427.81975.542−6.0460.7050.984243.692324.1111.253−0.141
MŁAWA20240.0121.892−9.670.8721.00.00.0−1.1240.469
PIŁA20240.054.415−1.8840.4961.00.00.00.272−0.801
SUWAŁKI20240.0128.036−7.760.6111.00.00.0−0.641−0.219
WARSZAWA-OKĘCIE20241.2281.233−0.0010.0040.00410.75814.3081.021−4.257
WIELUŃ20240.071.479−6.5770.8311.00.00.0−0.6590.204
ZIELONA GÓRA20240.051.34−6.9861.1551.00.00.0−0.9870.949
ŁÓDŹ-LUBLINEK20240.02.251−1.0270.9411.00.00.00.020.141
Disclaimer/Publisher’s Note: The statements, opinions and data contained in all publications are solely those of the individual author(s) and contributor(s) and not of MDPI and/or the editor(s). MDPI and/or the editor(s) disclaim responsibility for any injury to people or property resulting from any ideas, methods, instructions or products referred to in the content.