Abstract
The rapid expansion of renewable energy has posed significant challenges for the power system, including supply adequacy and operational flexibility. Nuclear power, as a stable and clean baseload source, plays a significant role in developing a new-type power system. However, its weak modulation capabilities significantly constrain its peak shaving and frequency regulation performance. The integrated operation of nuclear power and pumped storage, known as “nuclear-pumped storage integration”, can not only compensate for energy shortages but also provide auxiliary services, making it a viable solution for ensuring regional power supply stability. Nevertheless, a significant problem resides in achieving an appropriate benefit allocation between the two entities. To solve this issue, this research presents a mechanism for measuring and allocating the benefits of “nuclear-pumped storage integration” operation in a diverse power market. First, an integrated operating model is built, together with a joint clearing model encompassing the spot energy market and frequency modulation ancillary service market. A full-chain cost–benefit accounting system is designed to evaluate the value of joint operations accurately. Second, by incorporating indicators such as peak-shaving compensation and participation degree, a benefit allocation correction factor is derived, and an improved Shapley value approach is proposed to enhance the rationality and incentive effect of the allocation scheme. Case study results suggest that the “nuclear-pumped storage integration” operation mode can significantly increase overall benefits. Moreover, compared with existing techniques, the suggested improved Shapley value method provides fairness and rationality in benefit allocation, offering a sound decision-making basis for advancing the “nuclear-pumped storage integration” model.
1. Introduction
Under the goals of carbon peak and carbon neutrality, the continued expansion of installed capacity from wind and photovoltaic power generation has posed significant challenges to power supply adequacy, reliability, and capacity during peak load periods [1]. Nuclear power (NP), as a stable, high-density (an energy form in which a small mass or volume of fuel can release an immense amount of energy), clean energy source, plays a pivotal role in building the new power system. As of June 2024, China maintains global leadership in nuclear construction with 26 reactors (30.3 GW) under development, while its 56 operational units (58.22 GW) rank third worldwide in total capacity [2]. However, from both safety and economic perspectives, NP is better suited for base-load operation and lacks the flexibility required for peak load and frequency modulation. Pumped storage (PS) is widely recognized as a cost-effective solution for peak load modulation, offering advantages including rapid response capability and reliable operation, thereby delivering high-quality ancillary services. By the end of 2024, China’s PS installed capacity had reached 50.64 GW, demonstrating that building a flexibility support system has become a major strategic choice for China’s energy development [3]. Therefore, promoting the coordinated operation of NP and PS systems can help address electricity supply gaps while harnessing PS’s ancillary services to ensure the stability of regional power grids.
The integrated operation of nuclear power and pumped storage holds significant potential, and China has already made substantial progress in the construction and research of related projects. In November 2022, China launched its pioneering “nuclear-pumped storage integration” (NPSI) project. Through coordinated operation of the Fujian Yunxiao pumped storage facility and the Zhangzhou nuclear power plant, the project ensures that nuclear power operates at base load while simultaneously performing grid frequency modulation services [4]. In April 2025, the Jiangsu Lianyungang pumped storage project was commissioned as a complementary facility for the Tianwan nuclear power plant, substantially enhancing the operational stability of NP generation [5]. Rational operational strategies and equitable benefit allocation mechanisms for NPSI are essential for optimizing resource configuration, improving dispatch efficiency, and ensuring cost recovery. Consequently, there is an urgent need to investigate benefit allocation mechanisms for NPSI in multi-market environments.
Currently, scholars worldwide have conducted a series of studies on the operational modes of NP and PS, as well as the quantification of their market value. Regarding operational optimization, Ref. [6] developed an optimization model for NP that adopts the “12-3-6-3” fixed-peak-depth output mode in coordination with wind power. Ref. [7] constructed a dispatch model with NP and PS participating as independent entities. The results demonstrated that PS effectively alleviates the limited peak-shaving flexibility of NP, though the integration mode was not reflected in the model. In terms of market value quantification, Ref. [8] models spot market prices as random variables and analyzes how the revenue of PS participating in the spot market fluctuates with price changes. Ref. [9] assumed the pumping energy of PS is supplied by NP units, developing a market-clearing model for NPSI in electricity markets and calculating corresponding revenues. However, the coupling relationship between NP and storage systems was not adequately represented.
Ref. [10] constructed a multi-stage dynamic benefit evaluation model for PS participating in energy-capacity-ancillary service multi-markets, revealing that ancillary service market participation significantly enhances its overall revenue. Ref. [11] developed a joint clearing model for PS in both energy and ancillary service markets. Further, it analyzed the impacts of different pricing mechanisms on cost recovery in China’s current electricity market environment. Refs. [12,13,14] established clearing models for PS as independent market entities cooperating with renewable energy in joint energy and ancillary service markets. Analysis indicates that through multi-market participation, PS not only achieves cost recovery but also delivers comprehensive benefits, including enhanced system power supply reliability. Overall, existing research primarily focuses on multi-energy coordination models involving either NP or PS, while systematic benefit quantification models for NPSI participating in electricity markets remain notably underdeveloped.
Research on multi-entity benefit allocation in electricity markets predominantly employs clearing models for marginal benefit calculation, with the Shapley value method being a predominant allocation criterion. Ref. [15] addresses the benefit allocation problem for heat and electrical energy providers participating in the electricity market. It incorporates CO2 emission costs into the calculation of costs and benefits and employs the Shapley value to achieve a reasonable benefit distribution. Ref. [16] proposes a cooperative game-theoretic framework for integrated energy systems that achieves both equitable surplus distribution and collective benefit maximization using the Shapley value. Ref. [17] develops a social welfare-maximizing scheduling model that integrates photovoltaic (PV) load and combines the Shapley value and Nucleolus methods for benefit reallocation. For carbon trading markets, Ref. [18] establishes an economic dispatch model that employs the Aumann–Shapley method to allocate source-load cost–benefit shares. A clearing model accounting for uncertainties in joint bidding between wind and storage systems is presented in Ref. [19], which addresses benefit allocation using the Shapley value method. Ref. [20] constructs a multi-period stochastic equilibrium model for integrated wind-PV-storage systems, enhancing the traditional Shapley value method by incorporating curtailment costs to improve revenue distribution. However, these studies often overlook other influencing factors, resulting in suboptimal allocation outcomes. Furthermore, benefit allocation models for NPSI in electricity markets remain significantly understudied.
In summary, recent research on allocation of benefits for NPSI still exhibits the following limitations: (1) In operational modeling, there is a lack of coordinated operation models that fully consider the coupling characteristics of NP and PS; (2) Most market mechanism studies still treat the two as independent entities, lacking joint clearing mechanism designs for multi-market environments; (3) The traditional Shapley value method suffers from incomplete benefit quantification, resulting in insufficient rationality of allocation outcomes.
Addressing these difficulties, this research provides a mechanism for quantifying and allocating benefits from NPSI in multi-market environments:
- First, an integrated operating model coupling NP and PS is developed to precisely assess the enhancement of PS on NP’s grid-delivered electricity.
- Second, a joint clearing model for NPSI engaging in the spot power market and the ancillary service market of frequency modulation is built, accompanied by a specified benefit quantification index system for more complete operational benefit evaluation.
- Finally, based on the standard Shapley value method, an upgraded allocation method that incorporates peak regulation advantages and participation-level indicators is developed to produce more reasonable distribution schemes. Case studies based on the modified IEEE RTS-24 system validate the effectiveness and rationale of the suggested mechanism.
2. NPSI Operation Model
In autonomous operating mode, NP is needed to curb output during low-load periods for peak shaving, and the system operator dispatches PS directly. Conversely, NPSI mode enables the operator to employ PS to meet peak-shaving instructions, thereby considerably reducing the need to reduce NP output and allowing it to operate efficiently as a stable baseload source. The operating principle of this integrated approach and its distinction from the independent mode are presented in Figure 1. As shown in Figure 1, under the independent operation mode, the NP unit alone responds to the system’s peak-shaving instructions during valley periods, resulting in a reduction in its output. In contrast, under NPSI operation mode, NP and PS jointly respond to the system’s output requirements as a single entity. Within the integrated system, NP maintains nearly full output, while PS operates in pumping mode to lower the total output of NPSI.
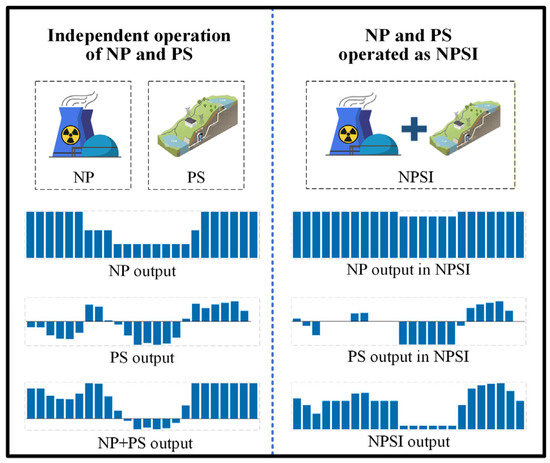
Figure 1.
Output difference between NPSI and the independent mode.
2.1. Nuclear Power Operation Model Considering Deep Peak Shaving
When operating autonomously, the NP station operates in a daily load-following mode to meet system peak-shaving demands. In this mode, the unit maintains full power in the absence of peak-shaving instructions and switches to a low-power state upon receiving such a signal. This operational flexibility allows NP to participate in system dispatch by altering the duration, depth, and rate of peak shaving.
According to Ref. [21], the “12-3-6-3” fixed peak-shaving depth mode for tracking daily load is widely adopted in the operation of nuclear power units in China. Under this operating mode, the output of nuclear power during low-power operation ranges between the rated capacity and the minimum technical output, with this peak-shaving depth generally divided equally into different levels. The low-power output for the s-th peak-shaving depth level is provided by Equation (1).
where i is the index of the NP unit; t is the dispatch time interval; s is the index for the peak-shaving depth level; and are the maximum and minimum output power of unit i, respectively.
When converting between full and low power, the NP unit can operate at three distinct transition speeds. Specifically, a 1 h transition contains no intermediate power; a 2 h transition includes one intermediate power level, set at the average of full and low power; and a 3 h transition employs two intermediate power levels. Consequently, these three speed selections correlate to three distinct intermediate power levels. The j-th intermediate power level for the s-th peak-shaving depth is given by Equation (2).
where j is the index for the intermediate power level. When j takes the values 1, 2, and 3, it represents the lower intermediate power for a 1 h transition, the single intermediate power for a 2 h transition, and the higher intermediate power for a 3 h transition, respectively. To distinguish between various operational states, binary variables are introduced as status flags, with coupling constraints imposed to the flags of adjacent time periods.
During peak-shaving periods, the output of the NP plant in NPSI is increased compared to its independent operation. Simultaneously, the PS unit should pump as much as possible so that the total output of NP and PS meets the system’s peak-shaving requirement. This output increase in NP, denoted as δn, is given by Equation (3). To satisfy the system’s requirement, δn should not exceed the maximum pumping power of the PS unit.
where represents the maximum pumping power of the PS unit; α is the NP output increase coefficient, ranging from 0 to 1. A value of 0 corresponds to the independent operation mode of the NP plant.
2.2. Pumped Storage Operation Model
The operational constraints for the PS unit are given by Equations (4)–(7). Specifically, Equation (4) defines the net power output as the difference between the generation power and the pumping power. Equation (5) represents the reservoir capacity constraint, ensuring the stored water volume remains within its minimum and maximum limits in each period. Equation (6) is the operational mode coupling constraint, indicating that the unit can only operate in one mode (either generating or pumping) at a time. Equation (7) sets the upper and lower output limits for both the generation and pumping modes.
where and represent the generating output and pumping power, respectively, of the PS unit i during period t. Since a PS unit can only operate in one mode (generating or pumping) at a time, at least one of the two values must be zero for any given unit i and period t. Ut is the reservoir storage volume at time t; and are binary variables indicating the generating and pumping modes, respectively; ηd and ηc are the generating and pumping efficiencies; and Umin and Umax are the minimum and maximum storage capacities. In Equation (7), and are the lower and upper limits for power generation, while and are the corresponding limits for the pumping power.
3. Towards Joint Clearing and Benefit Assessment for Integrated Nuclear-Pumped Storage in Spot Energy and Ancillary Service Markets
Building upon the NPSI operation model established in Section 2, this section develops a joint clearing model for their participation in the diversified electricity market. Subsequently, it proposes a corresponding benefit assessment method based on the clearing results.
3.1. Joint Clearing Model for Integrated Nuclear-Pumped Storage Participation in the Spot Energy and Ancillary Service Markets
To minimize the total system electricity procurement cost, a benefit assessment model is constructed in this section to evaluate the economic benefits of the integrated operator in the joint energy and frequency modulation ancillary service markets. The structure of the joint clearing model is illustrated in Figure 2. Figure 2 presents the contributions of the two markets to the objective function and constraints of the joint clearing model, respectively. The “Coupling constraint of unit output between electricity market and frequency modulation market” refers to the requirement that the sum of a unit’s declared capacities in the two markets must not exceed its rated capacity. This constraint reflects the coupling relationship between the two markets within the joint clearing model.
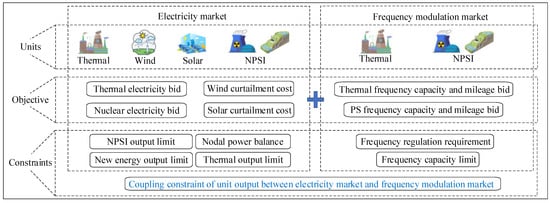
Figure 2.
Schematic diagram of the clearing model for NPSI participation in the spot and frequency modulation markets.
3.1.1. Objective Function
The clearing cost comprises three components: the energy market bidding price, the renewable energy curtailment cost, and the frequency modulation market bidding price. The energy market bidding price includes the operational and start-up costs of thermal power units, as well as the NPSI operator’s operational costs. The frequency modulation bidding price comprises the modulation costs of thermal units and PS units within the NPSI operator. This objective function is formulated in Equation (8).
where F is the total purchase costs of the system; is the energy bidding price of thermal power; is the energy bidding price of NPSI; is the renewable energy curtailment cost; is the frequency modulation bidding price of thermal power; is the frequency modulation bidding price of the NPSI. The calculation methods for the renewable curtailment cost and the bidding price of the market participants will be elaborated in the following sections.
(1) Bidding price of thermal power in energy market
In a competitive electricity market environment, the optimal bidding strategy for generation units is to offer prices based on their marginal generation costs [22]. Therefore, this paper assumes that all generation units submit bids according to their cost curves, without considering strategic bidding behaviors. Thermal power units submit their energy market bids based on their operational and start-up and shutdown costs, calculated as shown in Equation (9).
where “T” represents the total number of time periods in a day; Pi,t is the output power of thermal unit i in period t; ai, bi, and ci are its fuel cost coefficients; and are the unit start-up cost and unit shutdown cost, respectively; and are binary variables indicating the start-up and shutdown status of the unit in period t.
(2) Bidding price of NPSI in energy market
The NPSI operator submits its energy market bidding price based on its operational cost, as defined in Equation (10). In this mode, the NP unit and the PS unit operate as a single entity, with their equivalent output being the sum of their individual outputs ( for NP and for PS).
where and are the power generation cost coefficients of NP unit i.
Suppose the NP and PS units operate independently. In that case, the NPSI bidding price in Equation (10) is replaced by the sum of their independent bidding price, + , as given in Equation (11). When operating alone, the PS unit participates as a price-taker in the energy market, submitting quantity bids without price bids, and profits from peak-valley price differences. Consequently, its bid is not explicitly included in the objective function.
(3) Renewable energy curtailment cost
Wind and PV power plants participate in the market by submitting quantity bids without price bids. Only their curtailment penalty cost is considered, calculated as shown in Equation (12).
where kw is the wind curtailment penalty coefficient; is the curtailed wind power of wind farm i in period t, determined by the difference between its maximum available output and its actual dispatch output ; kv is the PV curtailment penalty coefficient; is the curtailed PV power of PV plant i in period t, determined by the difference between its maximum available output and its actual dispatch output .
(4) Thermal power frequency modulation market bidding price
In the frequency modulation market, the power supply side needs to reserve sufficient frequency modulation reserve capacity to meet potential future frequency modulation demands [23]. The frequency modulation bidding price of a thermal power unit is the product of its offered modulation reserve capacity and its modulation cost coefficient, as expressed in Equation (13). It is worth noting that units participating in the frequency modulation market typically submit separate quotations for modulation capacity and modulation mileage [24]. Moreover, as the demand for modulation mileage must be determined in real time, the clearing time scales for the two also differ. To simplify the model, this paper assumes that the modulation mileage demand is predetermined as a fixed proportion of the capacity demand and is jointly cleared with the modulation capacity. The quoted prices for modulation capacity and mileage of the same unit are thus equivalent to a single quoted price.
where Ng is the total number of thermal units; is the frequency modulation reserve capacity provided by thermal unit i in period t; is the frequency modulation cost coefficient, determined by frequency modulation capacity and mileage bids.
(5) NPSI frequency modulation market bidding price
In the integrated operation mode, frequency modulation is provided solely by the PS unit, with the NP unit not participating. The bidding method is similar to that of thermal power, calculated as the product of the modulation reserve capacity and the cost coefficient, as shown in Equation (14).
where Ns is the number of PS units; is the frequency modulation cost coefficient of PS unit i; is the frequency modulation reserve capacity it provides in period t.
3.1.2. Constraints
(1) Nodal power balance constraint
The nodal power balance constraint, ensuring power injection equals withdrawal at each bus, is given by Equation (15).
where d is the load bus index, l is the transmission line index; is the active power output of conventional thermal unit i; and are the active power outputs of PV plant i and wind farm i, respectively; + , is the equivalent output of the NPSI operator; is the active power flow on line l; Dd,t is the forecasted load demand at bus d in period t; N is the set of units, lines, and loads connected to node i; is the energy clearing price at time t.
(2) System frequency modulation requirement constraint
The total frequency modulation capacity provided must meet the system requirement, as expressed in Equation (16). The clearing prices for frequency modulation capacity and mileage are generally determined based on the shadow prices of the system’s capacity demand constraint and mileage demand constraint, respectively [25]. In this paper, given the assumption of joint clearing for frequency modulation capacity and mileage, the overall clearing price for the frequency modulation market is derived from the shadow price associated with the frequency modulation demand constraint in Equation (16).
The frequency modulation demand of the system is generally positively correlated with the load. In this paper, it is assumed that the frequency modulation demand in a given period is α times the total system load demand in that period, where αf is the system frequency modulation demand coefficient. The right-hand side of the equation represents the total frequency modulation demand of the system in period t; is the clearing price for frequency modulation service (combining capacity and mileage prices) at time t.
(3) Transmission line power flow constraint
The power flow on each transmission line is constrained by its thermal limit and network topology, modeled using the DC power flow approximation, as shown in Equation (17).
where θm,t and θn,t are the voltage phase angles at the sending-end bus m and receiving-end bus n of line l in period t, respectively; θr is the phase angle at the reference bus; xl is the reactance of line l; Plmax is the maximum power transfer limit of line l.
(4) Renewable energy output limit constraints
The output of wind power plants and PV power plants must remain within their forecasted feasible intervals, as specified in Equation (18).
where and are the forecasted maximum available outputs for wind and PV power at time t, respectively.
In addition to the constraints listed above, the model includes standard operational constraints for conventional thermal units (e.g., ramping rates, minimum uptime/downtime), detailed in Ref. [26]. The operational constraints for the NPSI system are defined by Equations (1)–(7).
3.2. Benefit Assessment Model for Integrated Nuclear-Pumped Storage Operation
3.2.1. Cost Calculation for Integrated Nuclear-Pumped Storage Operation
The total cost CI for NPSI operation primarily consists of the operating cost and the “allocated peak-shaving ancillary service cost” Fpk, as shown in Equation (19).
In Equation (19), can be calculated by Equation (11). The second term Fpk, the allocated cost of peak-shaving service, stipulates that the total cost incurred by resources providing peak-shaving service during market-active periods is shared among all power sources in proportion to their cleared output during those periods [27]. The calculation for Fpk is shown in Equation (20). Equation (20) indicates that the peak-shaving ancillary service cost to be allocated primarily originates from thermal power units. This cost is related to the amount by which the actual output of the thermal power unit is reduced below its minimum technical output. Furthermore, the cost allocated to the NPSI is proportional to its output share relative to the total system output.
where is the total cleared output of the NPSI operator; Pt is the total cleared output from all power sources in the system during period t; TP is the total number of periods in which the peak-shaving market is activated; is the minimum technical output of thermal units; αpk is the deep peak-shaving cost coefficient of the thermal power unit.
This mechanism implies that integrated operation helps reduce the NP plant’s allocated cost. The reason is that the peak-shaving market is typically active during valley periods. In integrated operation, the PS unit can shift NP power output from valley periods to peak periods, thereby significantly reducing the NP plant’s bidding output during peak-shaving hours and its corresponding cost allocation share.
3.2.2. Income Assessment for Integrated Nuclear-Pumped Storage Operation
The total income II for the integrated operation includes earnings from the energy market and the ancillary services market for frequency modulation. It is calculated as the sum of the products of the market-clearing prices and the quantities cleared by the NPSI operator in each market, as shown in Equation (21).
This paper assumes that the calculation of revenue uses the average value of all locational marginal prices within a given time period t to approximate the system electricity price at that moment. The net benefit I0 is defined as the difference between total revenue and total cost, given by Equation (22).
Under independent operation, the cost and income structures for NP and PS differ: the NP plant primarily gains income from the energy market and bears corresponding operational costs. In contrast, the PS unit profits from “peak-valley arbitrage” in the energy market and can earn additional revenue by providing frequency modulation services.
Compared to autonomous operation, the NPSI mode displays advantages in three significant aspects: (1) Synergistic Operation: During independent operation, the NP plant must reduce its output to the technical minimum in response to peak-shaving orders. In contrast, NPSI operation allows the NP plant to maintain a high, consistent output level, while the PS unit performs peak shaving through pumping operations. (2) Market Clearing: When operating independently, the PS unit often participates in the energy market as a price taker. Under NPSI, the NP and PS units bid as a single entity, actively participating in market clearing. (3) Cost Allocation and Economic Benefit: Under autonomous operation, the peak-shaving cost is assigned individually depending on their individual output proportions. After integration, the cost is allocated depending on the proportion of their combined production. Since the combined output is significantly lower during low-load periods when the peak-shaving cost is allocated, the integrated approach effectively reduces the total allocated cost and enhances overall economics.
4. Method for Benefits Allocation of “Nuclear-Pumped Storage” Integration Based on an Improving Shapley Value Method
In multi-market environments, the benefits of NP and PS are derived from multiple sources. However, there is currently no comprehensive and accurate index system that can quantitatively evaluate their separate contributions to the total benefits of NPSI, thereby enabling proper benefit allocation. The Shapley value method, based on the benefit evaluation results from the clearing model, directly determines each participant’s marginal benefit as the basis for allocation. This method may appropriately reflect each participant’s contribution to cooperation, which accords with the notion of allocating according to contribution. It serves to encourage market participants to collaborate and promotes the overall operational efficiency of the power market.
However, the classic Shapley value method can only account for the degree of participation in the allocation of partial benefits and struggles to address benefit sources beyond those reflected in the clearing model. The allocation process and limits of the Shapley value method are addressed in Section 4.1, while Section 4.2 presents numerous better indicators based on this foundation to adjust its allocation outcomes.
4.1. Allocation Mechanism Based on the Shapley Value Method
The essential principle of the Shapley value method is to allocate rewards based on each participant’s marginal contribution to the joint operation. The marginal benefit contribution can be assessed by comparing the coalition’s total benefits before and after the participant joins or leaves the coalition [28]. The allocation outcome of participant n, designated as Φn, is stated in Equation (23).
In Equation (23), the first term represents the weighting coefficient, where |Si| and |N| denote the numbers of members included in coalition Si and in the total set N, respectively. The second term, v(Si) − v(Si\n), indicates the marginal benefit contribution of member n, i.e., the difference in the coalition’s overall benefits with and without member n. For example, in this manuscript, the coalition Si refers to NPSI. When entity n is the NP unit, v(Si) denotes the total revenue obtained by NPSI from participating in multiple markets; v(Si\n) denotes the revenue of the remaining members after removing the NP unit from the coalition, which is the revenue from the independent operation of the PS unit. The symbol “!” denotes the factorial operation.
In this work, the participants involved in the benefits allocation are confined to NP and PS. In this scenario, Equation (23) can be condensed into the following allocation approach as shown in Equation (24): Initially, the portion of the integrated total benefit that equals the sum of the independent operation benefits of the two participants is returned to each respective entity, while the remaining component, represented as the benefit surplus δI, is evenly shared between them. The following example briefly explains the allocation results in Equation (24) when only two entities, A and B, are involved: For entity A, the possible coalitions are {A} (with a probability of 0.5) and {AB} (with a probability of 0.5). According to Equation (23), the benefit allocated to A is “0.5[v(A) − 0] + 0.5[v(AB) − v(B)]”, which simplifies to “v(A) + 0.5[v(AB) − v(A) − v(B)]”. The first part “v(A)” is the benefit equivalent to its independent operation, and the second part is the residual benefit—the total benefit minus the sum of all entities’ independent operation benefits.
In Equation (24), Φn denotes the benefit assigned to participant n (NP or PS); In represents its benefit under independent operation.
From Equation (24), the Shapley value method displays the following advantages. First, returning the benefits of independent operation to the corresponding participants illustrates the fundamental principle of allocation by contribution. Second, the equal distribution of the benefit surplus δI embodies the concept of profit sharing and loss sharing: when the integrated operation generates profits (δI > 0), both participants obtain benefits higher than their independent operation levels (Φn > In); conversely, when a loss occurs (δI < 0), both participants share the losses (Φn < In). Third, the aggregate of all allocated benefits equals the entire integrated benefit, assuring complete distribution of the overall gains.
However, the classic Shapley value method also has the following shortcomings. First, the equal allocation of the benefit surplus δI fails to account for the contribution disparities between NP and PS in actual operation. Second, the allocation findings rely exclusively on the benefit evaluation produced by the clearing model, without including other potential sources of value not captured by the model, such as additional remuneration units received for providing peak regulation services.
4.2. Benefits Allocation Model Based on an Improving Shapley Value Method
4.2.1. Improving Indicators of the Shapley Value Method
A reasonable benefit allocation should follow the principle of “benefits follow contributions.” However, the traditional method in Section 4.1 has two main shortcomings. First, averaging the surplus benefit δI lacks justification; its distribution should also be determined based on the actual contributions of each entity. Second, not all benefit contributions can be directly calculated through the market-clearing model (e.g., the peak-shaving compensation received by units). Such benefits should also be reflected in the allocation. To address these limitations, this subsection defines two improvement metrics to refine the traditional method.
(1) Peak-shaving benefit indicator
Based on the study in Section 4.1, certain benefits that cannot be explicitly quantified using the clearing model should also be considered in the benefits allocation. This study focuses on the compensating benefit for peak shaving. In China’s energy markets, to incentivize generators to participate in peak shaving, generating units can earn proportional compensation equal to the reduction in their allotted output power relative to their rated capacity [29].
To include such benefits in the allocation process, this research designs a peak-shaving benefit indicator to alter the allocation results produced by the classic Shapley value method, as shown in Equation (25).
In Equation (25), Tp denotes the set of time periods during peak-shaving periods; β1 represents the peak-shaving benefit indicator of NP, which quantifies its contribution to peak shaving by measuring the reduction in its actual output power relative to the maximum output during low-load periods; and β2 denotes the peak regulation benefit indicator of PS, which reflects its contribution to peak shaving based on the pumping power during those periods.
(2) Contribution indicator
In the classic Shapley value method, the benefit surplus δI is split equally between NP and PS, failing to capture the disparities in their respective contributions appropriately. In NPSI, NP provides the majority of the base advantages, and an equal allocation may diminish its fair share of returns, thereby decreasing collaboration stability.
To address this issue, this study introduces the participation indicators ψ1 and ψ2 for NP and PS, respectively, to quantify their proportional contributions, and further modifies the Shapley value method, as described in Equation (26).
In Equation (26), ψ1 and ψ2 are calculated by the independent incomes of NP and PS, respectively, which characterize their relative contributions in combined operation. It can be observed from Equation (25) that the incomes of the NP unit from independently participating in multi-markets come solely from electricity sales; whereas the NP unit can not only engage in arbitrage between peak and valley periods in the energy market but also earn revenue by providing frequency modulation services. Since the independent operation benefit of NP is often higher than that of PS (I1 > I2), its participation indicator is correspondingly larger, resulting in a higher allocation share of the benefit excess.
4.2.2. Modification of the Traditional Shapley Value Method Based on Improved Indicators
To enhance the benefit allocation results while preserving the advantages of the traditional Shapley value method, the suggested adjustment does not directly alter the final allocation results Φn but instead optimizes the allocation ratio of the benefit surplus δI.
First, the marginal benefit indicators for NP and PS are set to ω1 = 0.5 and ω2 = 0.5, respectively, representing equal allocation of the benefit surplus in the traditional method. Then, three types of indicators—the marginal benefit indicator ω, the peak-shaving benefit indicator β, and the contribution indicator ψ—are each normalized and merged using specified weights to produce the final proportion for allocating the benefit surplus δI, as indicated in Equation (27).
In Equation (27), r1 and r2 denote the final proportionate coefficients of the benefit surplus assigned to NP and PS, respectively; kω, kβ, and kψ represent the weighting factors corresponding to each indication, satisfying kω + kβ + kψ = 1. When kω = 1, the proposed method degenerates into the traditional Shapley value method.
Both NP and PS first receive the amount of benefits equivalent to their independent operating revenues I1 and I2, while the remaining benefit surplus δI is divided proportionally according to the ratio r1: r2, as illustrated in Equation (28).
where ΦI’ represents the final benefit awarded to participant i (NP or PS) based on the improved Shapley value method.
The whole benefits allocation procedure based on the improved Shapley value method is presented in Figure 3. First, after importing parameters such as bids and costs, models are established for the independent operation of NP and PS, as well as for the NPSI system participating in multi-market clearing. The costs and incomes under both operating modes are calculated. Simultaneously, the values of the two improvement indicators are computed based on the clearing model for independent operation. Then, the net benefits of NP independent operation, PS independent operation, and NPSI, as well as the benefit surplus, are calculated from the costs and incomes under both modes. Next, the allocation result based on the traditional Shapley value method is computed. Finally, the result of the traditional method is adjusted according to the values of the improvement indicators, yielding the benefit allocation result based on the improved Shapley value method.
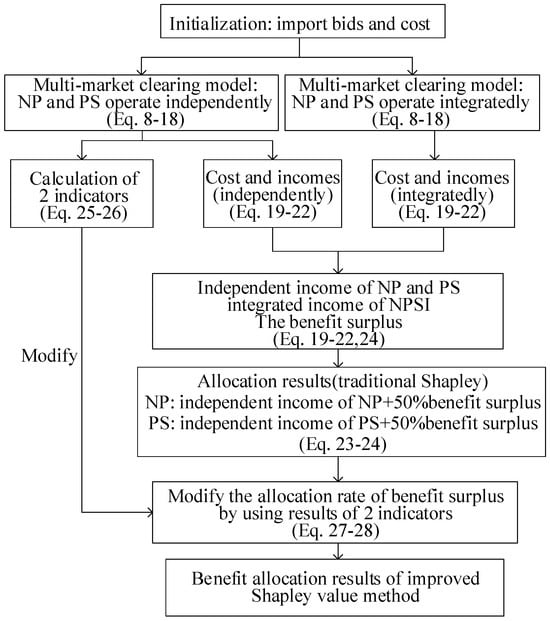
Figure 3.
Flow chart of benefit allocation based on improved Shapley value method.
5. Case Study
5.1. Case Design
To test the efficiency of the proposed NPSI operation model and the improved Shapley value-based benefits allocation method, a coordinated optimization simulation is conducted using the modified IEEE RTS-24 system [30]. The model is built in MATLAB 2023b [31], and the commercial solver Gurobi 11.0 [32] is used for optimization.
The modified IEEE RTS-24 system comprises many types of generation sources, including thermal power, wind power, photovoltaic, and an NPSI station. The installed capacities of each generation source and the PS unit are arranged as follows: 2063 MW for thermal power, 1000 MW for NP, 932 MW for wind power, 1000 MW for photovoltaic, and 600 MW for PS.
5.2. Benefit Evaluation and Clearing Results Analysis
This section compares the benefit evaluation results (per day) between the NPSI operating mode and the independent operation mode, as provided in Table 1. In the case study introduced in this paper, the overall revenue from the NPSI increases by USD 204,000, representing an approximate 28% increase. This demonstrates that the NPSI operation model can significantly enhance the total benefit.

Table 1.
Benefit calculation results.
As shown in Figure 4 and Figure 5, which illustrate the revenues and costs in the spot power market and the ancillary service market for frequency modulation, respectively, the improvement in NPSI operation primarily stems from the significant increase in spot power market revenues. In contrast, the variations in other revenues and costs are relatively minor.
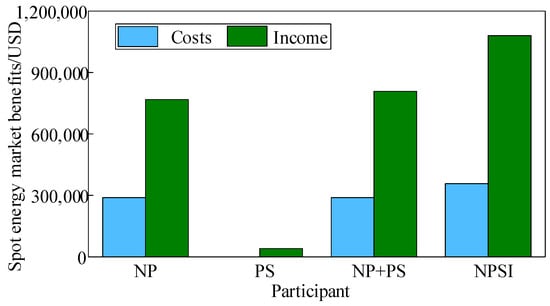
Figure 4.
Spot market earnings and costs.
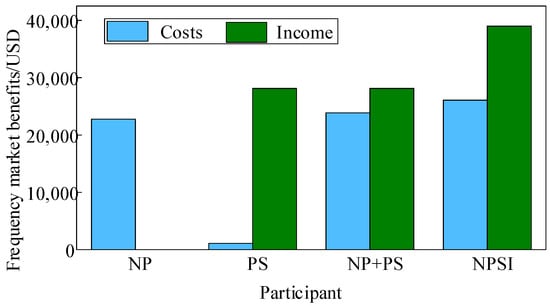
Figure 5.
Frequency modulation market earnings and costs.
The clearing results of the spot power market under the two operation modes are displayed in Figure 6 and Figure 7, while the corresponding clearing prices are illustrated in Figure 8.
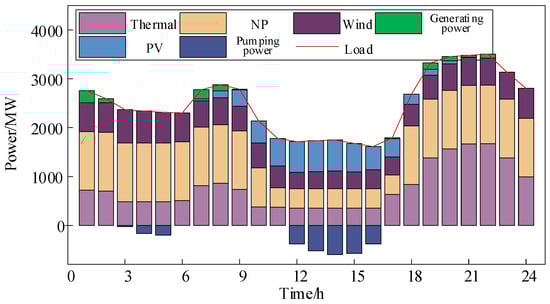
Figure 6.
Independent operation clearing results.
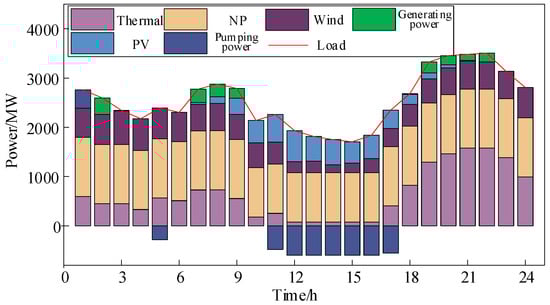
Figure 7.
Integrated operation clearing results.
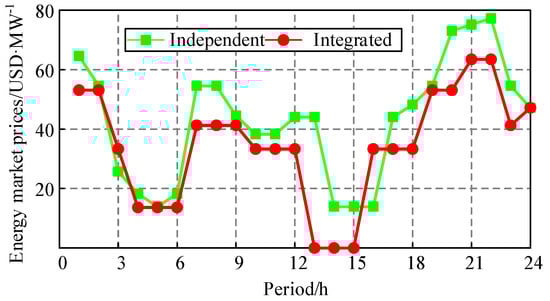
Figure 8.
Clearing prices in the spot market.
From the outputs of NP in Figure 6 and Figure 7, it can be noticed that the electricity delivered to the grid by NP during peak-shaving periods increases under NPSI mode, thereby contributing to the overall revenue growth.
As illustrated in Figure 8, NPSI operation slightly reduces spot power market-clearing prices. This is mainly related to the comparatively low bids of NP units—an increase in their output increases the marginal clearing unit, thereby affecting market-clearing prices.
Therefore, in NPSI operating mode, the growth in the electricity sent to the grid from NP should be adequately controlled to preserve market stability.
5.3. Analysis of Benefits Allocation Results
To validate the rationality and flexibility of the proposed improved Shapley value-based allocation method across diverse scenarios, multiple case studies and allocation strategies are created for comparison.
Conventional allocation methods often rely on predetermined fixed proportions; however, the suggested method dynamically adjusts allocations by combining operational data with multidimensional variables.
The five allocation procedures utilized in this investigation are detailed in Table 2. Strategy 1 employs the fixed-proportion technique; Strategy 2 adopts the classic Shapley value method; Strategies 3–5 are all based on the proposed improved Shapley value method but differ in the weighting settings of the three indicators.
Table 2.
Different strategies for benefits sharing of nuclear-pumped storage integration.
The five case settings are as follows:
Case 1: Uses the standard situation provided in Section 5.2 as the benchmark.
Case 2: Thermal power units exhibit strategic bidding behavior that lowers clearing prices in the spot power market, resulting in lower revenues for NPSI operation than for independent operation; consequently, the benefit surplus turns negative.
Case 3: Extremely hot weather leads to a surge in photovoltaic power, widening the load peak–valley differential. PS gains additional profitability through peak–valley arbitrage and peak-shaving compensation.
Case 4: Only a portion of the PS capacity participates in the markets, thus expanding the revenue gap between the independent operation of NP and PS.
Case 5: The load peak–valley difference reduces dramatically, removing peak-shaving compensation. Meanwhile, the peak–valley arbitrage revenue from PS under autonomous operation declines, leading to a negative net profit.
Based on the analyses in Section 4, the improved Shapley value method refines the allocation of the benefit surplus by introducing two correction indicators—peak-shaving benefit indicators and contribution indicators—based on the benefit calculation. Under the five designed cases, these two indicators are computed and subsequently used to adjust the allocation ratio of the benefit surplus. The results of the indicator calculation and the corresponding allocation ratios are presented in Table 3 and Figure 9, respectively.
Table 3.
Benefits and correction factors calculation results under different cases.
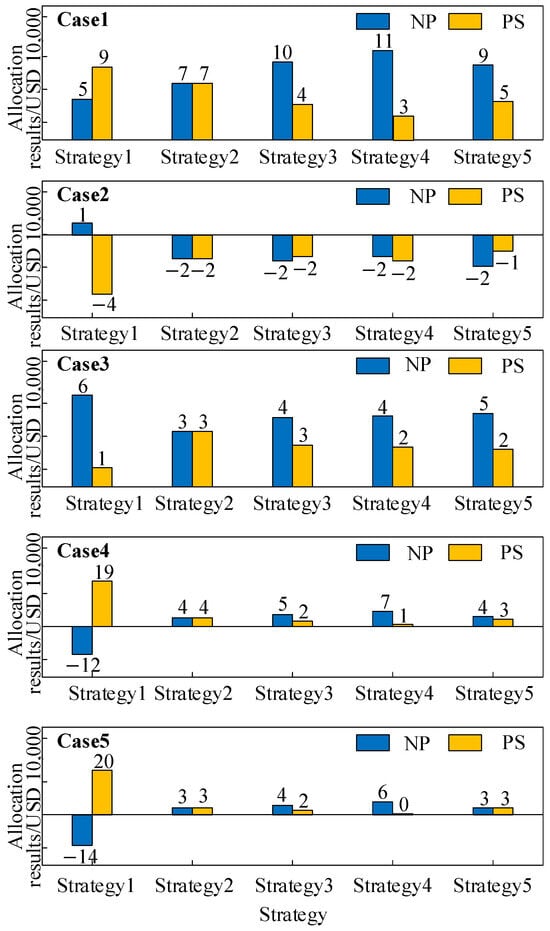
Figure 9.
Benefit allocation results under different cases and benefits sharing strategies.
As demonstrated in Table 3 for Case 1, the independent operation profit of NP (USD 263,000) is much higher than that of PS (USD 44,000). Therefore, NP should fairly receive a larger share of the benefit surplus. The allocation findings of Case 1 in Figure 9 illustrate that all three improved Shapley value methods (Strategies 3–5) reflect this element, although the traditional Shapley method (Strategy 2) still applies an equal split. In comparison, the preset-ratio technique (Strategy 1) allocates a larger share to PS, which is plainly unfair. In Case 2, as indicated in Table 3, the benefit surplus becomes negative (USD −35,000), meaning that both partners should split the cost. Figure 9 indicates that Strategies 2–5 yield an acceptable cost-sharing outcome, but Strategy 1 allocates the full loss to PS, lacking rationale.
In Case 3, the peak-shaving compensation for PS increases significantly, resulting in a higher peak-shaving benefit indicator, as shown in Table 3. Consequently, in Figure 9, Strategy 3—where the peak-shaving indicator is assigned a larger weight—allocates a greater share of the benefit excess to PS, aligning better with its actual contribution. Similarly, in Cases 4 and 5, the disparity in contribution between NP and PS becomes more significant. Strategy 4, which places greater emphasis on the contribution indicator, allocates a larger share of the benefit surplus to NP, demonstrating greater adaptability across diverse situations. Overall, the proposed improved Shapley value-based allocation method not only maintains rationality across various operating conditions but also allows flexible adjustment of indicator weights to accommodate diverse system and market environments, thereby enhancing robustness and fairness in benefit allocation.
5.4. Capacity Ratios Between Nuclear Power and Pumped Storage Based on Benefit Evaluation
To analyze the optimal capacity of PS under different operating modes, this part further examines the influence of capacity allocation between independent and NPSI operations on the overall joint profit. With the total installed capacity of pumped storage constant, the proportion of capacity participating in NPSI operation is gradually increased, and the corresponding overall benefit of NPSI is computed. The results are displayed in Figure 10. Three total capacity scenarios—200 MW, 400 MW, and 600 MW—are simulated in this study.
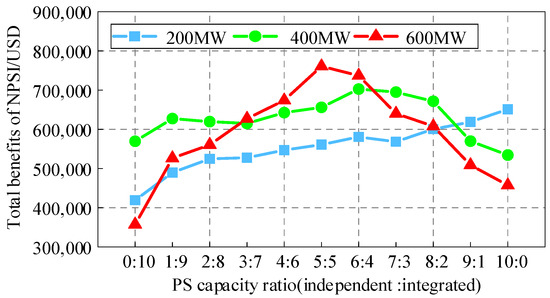
Figure 10.
Benefits under different capacity allocation ratios between joint and independent model.
As shown in Figure 10, when the total PS capacity is 200 MW, the joint benefit of NPSI increases continuously with the fraction of PS used in integrated operation. However, when the overall capacity approaches 600 MW, the total benefit first increases and then drops as the integrated share expands. This phenomenon occurs because, with higher total PS capacity, the increased discharge output tends to lower the marginal clearing price in the spot energy market, thereby reducing overall system profit. Therefore, a suitable allocation of PS capacity between independent and NPSI operation modes is critical to obtaining optimal system performance. In the 600 MW scenario, the joint benefit is maximized when the PS capacity is evenly distributed between the two modes (a 1:1 ratio), corresponding to 300 MW participating in NPSI operation. Given the NP unit’s installed capacity of 1000 MW, the result indicates that the optimal PS capacity in NPSI mode is approximately 30% of the NP unit’s installed capacity.
6. Conclusions
This work presents a benefit allocation technique for integrated nuclear-pumped storage operation based on an improved Shapley value method, which permits fair and rational benefit sharing within the joint company. The primary conclusions are as follows:
- (1)
- Compared with independent operation, the combined nuclear-pumped storage model can significantly raise the overall earnings of both units in multi-market participation. The benefit rise mainly results from the nuclear unit’s higher grid-connected production during low-load periods, which significantly enhances earnings in the spot energy market.
- (2)
- The suggested improved Shapley value allocation method shows better characteristics than the conventional fixed-ratio and classic Shapley methods in terms of fairness and rationality. While maintaining the traditional Shapley principle of risk sharing and profit co-sharing, the revised method integrates customizable weighting of the proposed indicators, thereby allowing allocation results to reflect each participant’s actual operational contributions better.
- (3)
- The allocation of PS capacity between different operational modes has a marked effect on the entire joint benefit of the integrated system. Under a constant total capacity, as the share of PS capacity participating in the integrated operating model increases, the overall profit initially rises and then falls. The highest combined advantage is achieved when the PS capacity in integrated mode reaches about 30% of the nuclear plant’s installed capacity.
Author Contributions
M.Z.: Formal analysis, Methodology, Writing—review and editing. Z.H.: Conceptualization, Methodology, Data curation, Writing—original draft. X.H.: Formal analysis, Methodology, Writing—review and editing. C.W.: Writing—review and editing, Supervision, Project administration. T.M.: Writing—review and editing, Data curation. Y.C.: Writing—original draft, Visualization. Z.Z.: Conceptualization, Supervision, Software. All authors have read and agreed to the published version of the manuscript.
Funding
This research was funded by the Institute of Economics and Technology, State Grid Fujian Electric Power Co., Ltd. for the support of the research project on the research on integrated operation simulation technology and capacity optimization configuration of “nuclear-pumped storage” (52130N23000K) for this paper.
Data Availability Statement
Dataset available on request from the authors.
Conflicts of Interest
Authors Min Zhang, Zhenda Hu and Xin Hu were employed by the Institute of Economics and Technology, State Grid Fujian Electric Power Co., Ltd. The remaining authors declare that the research was conducted in the absence of any commercial or financial relationships that could be construed as a potential conflict of interest. The authors declare that this study received funding from the research project on the research on integrated operation simulation technology and capacity optimization configuration of “nuclear-pumped storage” (52130N23000K). The funder had the following involvement with the study: study design, collection, analysis, interpretation of data.
References
- Wang, Y.; Tan, Q.; Zhao, E.; Tan, Z.; Wu, X. Analysis of Three-Part Tariff Mechanism for Cost Pass-Through of Flexibility-Regulated Coal Power Units. Electr. Power 2025, 58, 217–226. [Google Scholar]
- Cheng, H.; Ye, X.; Liu, X.; Zhang, H.; Zheng, G.; Yang, B.; Wang, T.; Ma, T.; Shi, Q.; Xiong, W. Overview of Analysis and Evaluation Models for China’s Nuclear Energy Development. Energy Strategy Rev. 2025, 60, 101789. [Google Scholar] [CrossRef]
- Liu, F.; Xu, Y.; Tang, C.; Zhu, D.; Wei, S.; Yang, X. Development Status and Future Key Technology Prospects of Cascade Hydro-Pump-Storage-Wind-Photovoltaic Multi-Energy Complementary System: A Case Study of China. Int. J. Electr. Power Energy Syst. 2025, 172, 111215. [Google Scholar] [CrossRef]
- The Lianyungang Pumped Storage Power Station Project Has Officially Commenced. Available online: http://www.js.xinhua.org/20250430/f8e1ed10054d4569b20ad06eaf312e92/c.html (accessed on 10 November 2025).
- China National Nuclear Corporation’s ‘Nuclear-Pumped Storage Integration’ Project Main Construction Commences. Available online: https://www.News.cn/energy/20221114/a3bfa18b5c68471a872c23ac450e94d0/c.html (accessed on 10 November 2025).
- Li, G.; Jin, F.; Liu, J.; Liu, X.; Lu, X.; Tang, M.; Song, Z.; Liu, Z. A Multi-Source Dispatching Model with Considering the Nuclear Power Plants Dispatching and Wind Power Accommodation. In Proceedings of the 2021 IEEE 4th International Electrical and Energy Conference (CIEEC), Wuhan, China, 28–30 May 2021; pp. 1–6. [Google Scholar]
- Peng, Q.; Wei, D.; Li, H.; Liu, G. Research on the Cooperative Operation Model and Benefits of Pumped Storage Power Plants and Nuclear Power Plants in Guangdong Province. In Proceedings of the 2025 IEEE International Conference on Power and Integrated Energy Systems (ICPIES), Haikou, China, 7–9 April 2025; pp. 545–549. [Google Scholar]
- Ak, M.; Kentel, E.; Savasaneril, S. Quantifying the Revenue Gain of Operating a Cascade Hydropower Plant System as A Pumped-Storage Hydropower System. Renew. Energy 2019, 139, 739–752. [Google Scholar] [CrossRef]
- Zhuo, D.; Du, R.; Yang, Y.; Ge, H.; Yang, J.; Xu, Z.; Yi, Y. Nuclear-Pumped Storage Combined Operation Planning Based on Production Simulation and Entropy Weight Method. Electr. Power 2025, 58, 180–187. [Google Scholar]
- Feng, C.; Guo, Q.; Liu, Q.; Jian, F. An Optimized Dynamic Benefit Evaluation Method for Pumped Storage Projects in the Context of the “Dual Carbon” Goal. Energies 2025, 18, 2815. [Google Scholar] [CrossRef]
- Li, Y.; Fan, Y.; Ke, X.; Huo, C.; Zhou, M.; Yang, Y.; Wang, J.; Xin, Y. Cost Recovery for Variable-Speed Pumped Storage Power Plants in the Market Environment. Energies 2025, 18, 153. [Google Scholar] [CrossRef]
- He, Y.; Liu, Y.; Li, M.; Zhang, Y. Benefit Evaluation and Mechanism Design of Pumped Storage Plants under the Background of Power Market Reform—A Case Study of China. Renew. Energy 2022, 191, 796–806. [Google Scholar] [CrossRef]
- Li, H.; Li, X.; Zhang, Y.; Zhao, Y.; Pan, J.; Zhao, H. Declaration Strategy of Wind Power and Pumped Storage Participating in the Power Market Considering Multiple Uncertainties. Energy 2024, 293, 130624. [Google Scholar] [CrossRef]
- Yue, Y.; Guo, S.; Guo, X. Optimization Scheduling of Wind-Photovoltaic-Pumped Hydro Storage Considering the Revenue from Pumped Hydro Storage under Different Electricity Market Mechanisms. In Proceedings of the 2024 IEEE 8th Conference on Energy Internet and Energy System Integration (EI2), Shenyang, China, 29 November–2 December 2024; pp. 1603–1608. [Google Scholar]
- Oleksijs, R.; Sauhats, A.; Olekshii, B. Cooperation in Energy Markets Considering CO2 Emission Costs. In Proceedings of the 2021 IEEE 62nd International Scientific Conference on Power and Electrical Engineering of Riga Technical University (RTUCON), Riga, Latvia, 15–17 November 2021; pp. 1–6. [Google Scholar]
- Liu, H.; Ye, S.; Yin, C.; Wang, L.; Zhang, C. Cooperative Game-Theoretic Scheduling for Low-Carbon Integrated Energy Systems with P2G–CCS Synergy. Energies 2025, 18, 3942. [Google Scholar] [CrossRef]
- Volpato, G.; Carraro, G.; Dal Cin, E.; Rech, S. On the Different Fair Allocations of Economic Benefits for Energy Communities. Energies 2024, 17, 4788. [Google Scholar] [CrossRef]
- Nan, J.; Feng, J.; Deng, X.; Wang, C.; Sun, K.; Zhou, H. Hierarchical Low-Carbon Economic Dispatch with Source-Load Bilateral Carbon-Trading Based on Aumann–Shapley Method. Energies 2022, 15, 5359. [Google Scholar] [CrossRef]
- Chen, Y. Electricity Market Bidding Model for Joint Clearance of Wind Power and Energy Storage Plants. In Proceedings of the 2024 4th International Conference on Intelligent Power and Systems (ICIPS), Yichang, China, 6–8 December 2024; pp. 1101–1106. [Google Scholar]
- Zhang, Z.; Wang, X.; Zhang, S. Equilibrium Analysis of the Electricity Market Considering Strategic Bidding by Coalition of Renewable Energy and Energy Storage. In Proceedings of the 2023 8th International Conference on Power and Renewable Energy (ICPRE), Shanghai, China, 22–25 September 2023; pp. 407–413. [Google Scholar]
- Wu, X.; Chen, K.W.; Guo, Q.S.; Liu, Y.C.; Yue, F.C. A Multi-Source Combined Operation Low Carbon Economy Dispatch Considering Flexible Participation of Nuclear Power in Peaking. Electr. Power Eng. Technol. 2024, 43, 1–11. [Google Scholar]
- De Blauwe, J.; Zhang, X.; Keles, D. Investigating Empirical Bidding Curves in the Electricity Spot Market: Expected Patterns VS. Anomalies. Energy Econ. 2025, 152, 109002. [Google Scholar] [CrossRef]
- Wang, Y.; Gao, J.; Tan, B.; Ling, J.; Gao, X.; Yao, Y. A Clearing Model for Electric Energy-Frequency Regulation Joint Market to Promote Renewable Energy Integration. In Proceedings of the 2025 2nd International Symposium on New Energy Technologies and Power Systems (NETPS), Hangzhou, China, 23–25 May 2025; pp. 491–494. [Google Scholar]
- Wilches-Bernal, F.; Concepcion, R.; Byrne, R. Participation of Electric Storage Resources in the NYISO Electricity and Frequency Regulation Markets. In Proceedings of the 2019 IEEE Power & Energy Society General Meeting (PESGM), Atlanta, GA, USA, 4–8 August 2019; pp. 1–5. [Google Scholar]
- Gupta, A.; Malley, M. Modeling Battery Degradation in Energy and Performance-Based Regulation Markets. In Proceedings of the 2024 IEEE PES Innovative Smart Grid Technologies-Asia (ISGT Asia), Bengaluru, India, 10–13 November 2024; pp. 1–6. [Google Scholar]
- An, Q.; Wang, J.; Wu, Z.; Zhong, H.; Li, G. Benefit Allocation Mechanism Design of Electricity Markets with Penetration of High Proportion of Renewable Energy. Autom. Electr. Power Syst. 2022, 46, 13–22. [Google Scholar]
- Chen, J.; Pan, F.; Lu, R.; Dong, Y. On the Compensation Mechanism of Trans-provincial or Trans-regional Electric Power Auxiliary Service Market. Hydropower New Energy 2025, 39, 1–4+10. [Google Scholar]
- Matsui, K.; Tsuchiya, T. Selecting Nodes to Protect in Interdependent Networks Using Shapley Value Analysis. In Proceedings of the 2024 IEEE 29th Pacific Rim International Symposium on Dependable Computing, Osaka, Japan, 13–15 November 2024; pp. 197–198. [Google Scholar]
- Zhang, L.; Peng, Y.; Miao, C.; Lin, X.; Mu, M.; Song, H. Double-Layer Game Bidding Strategy of VPP in Power Peak-Shaving Market. In Proceedings of the 2025 5th Power System and Green Energy Conference (PSGEC), Hong Kong, 20–23 August 2025; pp. 205–209. [Google Scholar]
- Ahmadi, M.; Van der Sande, R.; Shekhar, A.; Bauer, P. Adequacy of Hybrid AC-DC Grids with Reliability Oriented Modular Multilevel Converter Design—A Case Study Using Modified RTS-24 Network. In Proceedings of the 2024 IEEE 21st International Power Electronics and Motion Control Conference (PEMC), Pilsen, Czech Republic, 30 September–3 October 2024; pp. 1–6. [Google Scholar]
- MATLAB. Available online: https://matlab.mathworks.com (accessed on 16 December 2025).
- Gurobi Optimization. Available online: https://www.gurobi.com (accessed on 16 December 2025).
Disclaimer/Publisher’s Note: The statements, opinions and data contained in all publications are solely those of the individual author(s) and contributor(s) and not of MDPI and/or the editor(s). MDPI and/or the editor(s) disclaim responsibility for any injury to people or property resulting from any ideas, methods, instructions or products referred to in the content. |
© 2025 by the authors. Licensee MDPI, Basel, Switzerland. This article is an open access article distributed under the terms and conditions of the Creative Commons Attribution (CC BY) license.