Abstract
Reliable performance of TRISO (tristructural isotropic) nuclear fuel depends on the interplay between its multilayer architecture and the buffer-layer microstructure, which are difficult to isolate experimentally. We implement a multiscale, multiphysics model in the open-source MOOSE (Multiphysics Object-Oriented Simulation Environment) framework that couples particle-scale thermo-mechanical finite-element analysis with mesoscale phase-field fracture to link microstructure to effective stiffness and strength. The model resolves the combined influence of pore volume fraction, size, and aspect ratio and explicitly separates the effects of reduced load-bearing capacity from stress concentrations in the porous buffer. Simulations reveal substantial hoop stresses across coating layers under nominal thermal conditions due to material property mismatches and temperature gradients. In the buffer, stiffness and strength decrease with porosity; morphology is decisive: as aspect ratio decreases, strength degrades far more rapidly than stiffness, consistent with crack-like pores that amplify local stresses. The framework reproduces logarithmic trends with aspect ratio and explains the higher sensitivity of strength, providing parameters that can inform design and acceptance criteria (e.g., limits on pore elongation and porosity gradients). Implemented within MOOSE, the approach is readily extensible to irradiation-dependent kinetics, interface debonding, and uncertainty-quantified 3D analyses to support risk-informed TRISO fuel development.
1. Introduction
Tri-structural isotropic (TRISO) fuel stands out as a next-generation nuclear technology designed to ensure safety and efficiency in advanced reactor applications. Each TRISO particle comprises a fissile fuel kernel encased in multiple coating layers: a porous carbon buffer layer, a dense inner pyrolytic carbon (IPyC) layer, a silicon carbide (SiC) layer, and a dense outer pyrolytic carbon (OPyC) layer (see Figure 1). The buffer, a low-density porous layer, accommodates fission gases and mitigates kernel swelling. The IPyC serves as the first load-bearing barrier against internal pressure, the SiC acts as the main structural layer and primary barrier to fission products, and the OPyC provides the final diffusion barrier while also shielding the SiC from mechanical damage during particle processing and fuel compaction [1]. These layers not only provide TRISO particles with their unique neutronic and thermal characteristics but also enable them to withstand high neutron fluences and high temperatures [2,3,4].
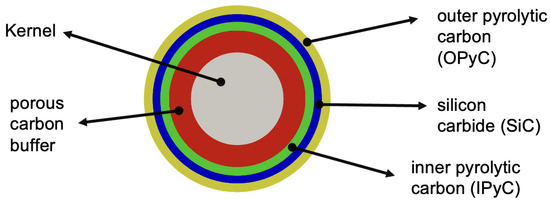
Figure 1.
A schematic illustration of the TRISO Fuel Particle Geometry.
TRISO fuel was first developed in the United States and the United Kingdom in the 1960s using uranium dioxide fuel. In 2002, the Department of Energy (DOE) initiated efforts to improve TRISO fuel by enhancing its irradiation performance and manufacturing processes [5,6]. TRISO fuel testing has since gained significant interest from the advanced reactor community. Reactor vendors such as X-Energy, in collaboration with Oak Ridge National Laboratory, are actively involved in its development. As part of these efforts, a pilot nuclear fuel fabrication facility has been operated at Oak Ridge National Laboratory since 2016. TRISO particle fuels are now being adopted in several countries, including China and Japan, and are part of ongoing development programs in France, the United Kingdom, Russia, and South Africa [7].
TRISO particles are widely recognized for their exceptional performance and reliability in advanced nuclear reactors [8]. Nevertheless, post-irradiation examinations have shown that failures can still occur, initiated by a variety of mechanisms that compromise coating integrity [9] and studies have reported fracture and densification fractions using X-ray computed tomography measurements, providing quantitative insight into irradiation-induced microstructural evolution [3,10,11]. These effects are further exacerbated during operation, fission and irradiation damage generate internal pressurization within the kernel, which in turn increases tensile stresses across the pyrocarbon layers and amplifies the susceptibility of the buffer to cracking [2]. These stresses, coupled with irradiation-induced material changes, give rise to several well-documented degradation pathways in TRISO particles. Post-irradiation examinations (PIE) have shown that particle failure may result from excessive pressurization, cracking within the inner pyrolytic carbon (IPyC), separation at the IPyC–SiC interface, or distortions related to particle asphericity [1,12,13].
Numerous studies have demonstrated that the initiation of such IPyC cracks is strongly influenced by the condition of the buffer layer, where porosity evolution, irradiation-induced densification, and debonding at the buffer–IPyC interface act as precursors to IPyC failure. The connection between buffer degradation and IPyC failure has been highlighted in several recent investigations. Mauseth et al. [14] demonstrated through micro-tensile experiments and post-irradiation analysis that incomplete tearing of the buffer can lead to arrowhead cracks and adhesion of buffer material to the IPyC, which subsequently induces IPyC fracture; in turn, such fractures allow palladium to reach the SiC and accelerate its degradation. Similarly, debonding between the buffer and IPyC layers, frequently observed in the first Advanced Gas Reactor experiments (AGR-1), generates a radial gap that helps to relax stresses [10,11]. This gap was shown to inhibit further IPyC cracking, whereas the absence of debonding allows cracks to propagate directly into the SiC layer. Complementing these findings, Griesbach et al. [15] observed in AGR-2 particles that high buffer densification and partial tearing at the buffer–IPyC interface create localized stress concentrations which act as direct precursors for IPyC fracture. Findings from the AGR-1 and AGR-2 irradiation programs indicate that preserving buffer integrity is advantageous for TRISO fuel performance, since an intact buffer constrains kernel geometry and provides added protection for the IPyC [13,16]. Collectively, these studies reveal that the buffer layer’s microstructural evolution (through densification, fracture, and interface debonding) plays a decisive role in determining whether IPyC damage remains benign or escalates to SiC failure.
Despite extensive experimental observations, experiments alone cannot fully resolve the complex, coupled phenomena governing TRISO fuel behavior. A variety of codes have been developed to model TRISO fuel particles, ranging from one-dimensional tools such as PARFUME [17], STRESS3 [18], TIMCOAT [19], and PASTA [20], to finite element approaches such as ATLAS and BISON [21], as well as general-purpose commercial FEM codes like Abaqus and COMSOL [22,23]. Early 1D tools such as PARFUME and PASTA offered computational efficiency and were well suited for statistical evaluations [17,24], but their formulations limit their ability to capture asymmetric geometries, cracking, or debonding phenomena. Specialized tools such as TIMCOAT and STRESS3 expanded the scope to fracture mechanics and stress-based failure analyses, while ATLAS introduced finite element methods to represent swelling, cracking, and debonding with greater fidelity. Commercial multiphysics codes provide detailed physics but require complex external meshing and come at high computational cost. BISON, as highlighted in recent studies [25,26,27], provides an effective middle ground by integrating 1D, 2D, and 3D TRISO meshing directly into a fuel performance environment. However, BISON is a domain-specific application built on the MOOSE framework [28]. In this work, we use MOOSE directly to show that its general-purpose multiphysics capabilities can reproduce the advantages obtained with BISON, while leveraging an open-source workflow that promotes broad dissemination and reproducibility of results.
To capture the role of microstructure and irradiation in these processes, a multiphysics and multiscale framework is developed that combines phase field and finite element methods to correlate microstructural features, irradiation effects, and mechanical properties of the buffer layer. Finite element simulations at the particle scale predict the heterogeneous stress state across the different layers resulting from irradiation induced strains. Mesoscale phase field simulations investigate how microstructural characteristics such as pore shape, size, and volume fraction affect the elastic and fracture properties of the buffer layer. The modeling results demonstrate a strong dependence of mechanical behavior on the underlying microstructure and enable a mechanistic understanding of TRISO fuel particles.
The structure of the paper is as follows: Section 2 summarizes the multiphysics phase-field modeling of thermo-mechanical fracture as phase transition applied to TRISO particles. Section 3 presents temperature profiles and stress analysis in TRISO layers, with particular attention to the effect of pore geometry in the buffer layer. Section 4 provides the conclusions.
2. Methodology
2.1. Multiphysics Phase-Field Modeling of Thermo-Mechanical Fracture as Phase Transition
Building on our prior work for conventional uranium dioxide (UO2) fuel and its modeling framework [29,30], we extend the approach to TRISO fuel. In this phase-field formulation, the crack is represented by the order parameter , which varies smoothly from 0 (undamaged) to 1 (fully damaged), yielding diffuse crack surfaces. The evolution of the phase field parameter is governed by the Allen-Cahn equation [31], which is given as:
where L is the order parameter mobility for and is total free energy density. To account for microstructural variations, a stochastic term, , is added to the Allen-Cahn equation:
The phase field variable is integrated into the free energy formula to accurately represent the free energy of the system. The free energy per unit volume is expressed as:
where , , and are the elastic, geometrical crack, and gradient contributions to the energy, respectively. For linear elastic behavior, where stress and strain are proportional according to Hooke’s Law, the elastic strain energy density can be defined as:
where is strain and is the stress. The term representing gradient energy is:
where k is the gradient energy coefficient. We incorporate the cohesion energy into the geometrical crack energy, taking into account both the cohesion energy and the double-well potential, as follows:
where parameter B represents the double-well contribution and the energy associated with damage, known as cohesion energy, was defined by [32] and is expressed as follows:
where parameter A represents the cohesion contribution. The double-well potential acts as an energy barrier separating the fully damaged and damage-free states. This barrier enforces irreversibility to prevent crack healing and is defined as:
To correctly model the transition between damage-free and fully damaged states, the system must satisfy specific energy conditions. In the damaged-free state (), only elastic strain energy should be present, while in the fully damaged state (), all elastic stresses must be released, and a maximum cohesive energy contribution A remains. These conditions are mathematically expressed as:
where is the cohesion energy function, is the degradation (interpolation) function related to the material’s elastic stiffness. In accordance with these requirements, the present work defines the functions as:
2.2. Thermo-Mechanical Equilibrium Equations
In this work, the mechanical response of TRISO fuel particle is modeled within the framework of infinitesimal strain theory. This approach is appropriate for brittle materials, which typically experience small elastic deformations prior to failure. Under this assumption, the deformation is considered linear elastic, with the total strain attributed solely to elastic strain. The framework reliably captures the mechanical behavior of TRISO layers under small strain conditions, as is common during early reactor operation or non-irradiated simulations. The mechanical equilibrium equation is given by
where is the Cauchy stress tensor. For a brittle material governed by Hooke’s law,
Here, denotes the fourth-order elasticity tensor, and represents the elastic strain. In the case of isotropic materials, the tensor is fully defined by two material parameters: the elastic modulus (E) and Poisson’s ratio (). For simplicity, the stress–strain relationship is often reformulated directly in terms of E [33]. Equation (14) reduces to
denotes the thermal expansion strain and is the localized strain obtained from the gradients of the displacement vector:
Here, represents the displacement vector, ∇ is the gradient operator, and indicates the transpose of a tensor. The elastic modulus E is defined as
where and correspond to the elastic modulus of the damage-free and fully damaged states, respectively. To model the loss of mechanical integrity due to cracking, a very small elastic modulus is assigned to the fully damaged state (), effectively representing a material with negligible stiffness. The transition between these two states is governed by the interpolation function , also known as the degradation function, which smoothly varies the stiffness as a function of the phase-field variable (Equation (12)).
TRISO fuel particles expand based on their thermal expansion coefficient, creating stress-free strain (eigenstrain). Stress arises only when there is constraint or exposure to uneven temperature gradients. Therefore, the phase-field fracture model is coupled with the heat conduction equation to enable the simulation of fractures induced by thermo-mechanical loading. The heat conduction equation plays a crucial role in evaluating the temperature gradient inside the TRISO fuel particle. It is given by
where k denotes thermal conductivity, T represents temperature, and correspond to density and specific heat, respectively, while Q signifies the heat source. Eigenstrain refers to a strain field introduced into the model that does not directly result from external mechanical loads. In this work, eigenstrain is specifically used to account for thermal expansion strain caused by temperature changes. Therefore, eigenstrain causes expansion or contraction, inducing stresses when thermal gradients are present. Eigenstrain resulting from thermal expansion is given by the following equation:
where is the coefficient of thermal expansion, T is the current temperature (in Kelvin), and is the reference temperature at which the material is free of thermal strain. The resulting partial differential equations (PDEs) are solved using the finite element method (FEM) with implicit time integration and the Preconditioned Jacobian-Free Newton–Krylov (PJFNK) nonlinear solver, implemented within the open-source Multiphysics Object-Oriented Simulation Environment (MOOSE) [34].
2.3. Material and Model Parameters
To accurately represent the TRISO particle’s thermo-mechanical behavior, the geometric dimensions (radii) of each layer and their corresponding thermal conductivities are specified. In addition, elastic modulus, Poisson’s ratio, and thermal expansion coefficients used in the simulation framework are defined, as listed in Table 1. These properties are essential for capturing the coupled thermal and mechanical response of the TRISO fuel under operational conditions.

Table 1.
Elastic properties and thermal expansion coefficients of TRISO particle layers [17].
The particle consists of five concentric layers surrounding a spherical fuel kernel. The radius of the fuel kernel, denoted as , is 0.212 mm. It is encapsulated by a porous carbon buffer layer with a radius of 0.312 mm. The subsequent layers include the inner pyrolytic carbon (IPyC) layer with mm, a silicon carbide (SiC) layer with mm, and the outer pyrolytic carbon (OPyC) layer extending to mm. Each layer exhibits distinct thermal conductivity characteristics, which are treated as constants for the purposes of heat transfer modeling. The thermal conductivity of the fuel kernel is W/(mm·K), while the buffer layer has a significantly lower value of W/(mm·K). Both the IPyC and OPyC layers share the same thermal conductivity, W/(mm·K). The SiC layer, known for its high thermal conductivity and structural strength, is assigned W/(mm·K) [5,35]. These properties are used as inputs to the thermal analysis and are assigned to their respective material domains using mesh-based block identifiers during simulation. The geometric specifications of the TRISO particle layers are presented in Table 2, where the radial thicknesses of each constituent layer are summarized. The corresponding outer radii together with the associated parameter identifiers are reported in Table 3. The material and constitutive model parameters employed for the buffer layer are provided separately in Table 4, as they serve as essential inputs for characterizing its mechanical response within the modeling framework.
Table 2.
Radial thicknesses of TRISO particle layers.
Table 3.
TRISO fuel particle properties and block identifiers [17].
Table 4.
Material and model parameters for TRISO buffer layer.
3. Results
3.1. Thermo-Mechanical Analysis of the Performance of Fresh TRISO Particles
We assessed the thermo-mechanical response of fresh TRISO particles by conducting several simulation cases and recording the steady-state temperature and hoop-stress distributions across the particle layers. First, to assess the effect of the outer surface temperature, three boundary conditions were applied at the outermost layer: 700 K, 900 K, and 1200 K. These values represent different thermal boundary conditions, such as varying coolant environments or operating conditions. Subsequently, the internal volumetric heat generation rate Q, applied to the fuel kernel, was varied across four cases: 0.3, 1.2, 2.0, and 3.0 W/mm3. These values simulate different levels of fission heating corresponding to a range of fuel enrichment levels or reactor operating scenarios. Figure 2 presents a typical the temperature distribution within the TRISO fuel particle, highlighting a hot central region and progressively cooler temperatures toward the outer coating layers.
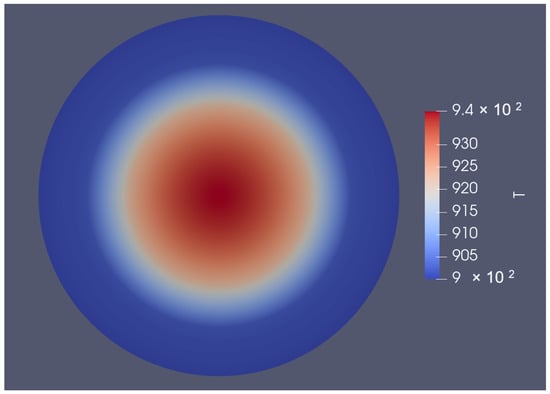
Figure 2.
A characteristic spatial temperature distribution across a TRISO fuel particle obtained from MOOSE simulation (outer T = 900 K and Q = 1.2 W/mm3).
Figure 3 illustrates the steady-state temperature distribution across the TRISO particle layers for four different volumetric heat generation rates (Q = 0.3, 1.2, 2.0, and 3.0 W/mm3). The x-axis represents the radial position from the center of the fuel kernel outward, and the layered regions are labeled to indicate material boundaries: Fuel, Buffer, Inner PyC (IPyC), Silicon Carbide (SiC), and Outer PyC (OPyC). Vertical dashed lines indicate the interfaces between material layers, and layer names are shown for reference. In Figure 3a, the outer boundary condition was fixed at 700 K for all cases, leading to the same surface temperature across simulations. Increasing the internal heat generation results in higher central temperatures. The steepest temperature gradients occur within the fuel and buffer layers, where most of the thermal resistance is observed. Beyond the buffer, the temperature rapidly drops and stabilizes through the coating layers due to their higher thermal conductivities and reduced heat generation. Figure 3b and Figure 3c apply the same internal heat generation rates as in Figure 3a, but with outer boundary temperatures fixed at 900 K and 1200 K, respectively, to illustrate the effect of increased external temperature conditions on the thermal profile within the TRISO particle. In these cases, the temperature across the layers still drops sharply and stabilizes through the layers due to their relatively high thermal conductivities and lack of internal heat generation.
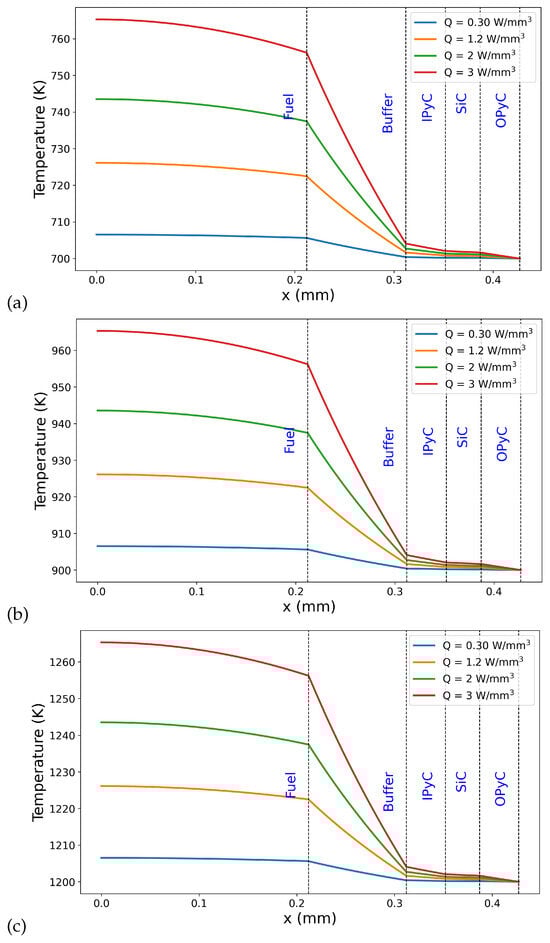
Figure 3.
Temperature distributions across TRISO particle layers for varying internal heat generation rates (Q = 0.3, 1.2, 2.0, and 3.0 W/mm3) under three different outer boundary temperatures: (a) 700 K, (b) 900 K, and (c) 1200 K.
To further investigate the thermo-mechanical response of the TRISO particle, hoop stress distributions across the layers were analyzed for an outer boundary temperature at 700 K, 900 K and 1200 K, as shown in Figure 4. The analysis highlights the influence of the stiffness mismatch between layers on stress localization. In particular, significant tensile hoop stress develops within the inner pyrolytic carbon (IPyC) layer, while compressive stress is observed in the fuel region. The sharp transitions in stress correspond to material interfaces where differences in elastic modulus and thermal expansion create mechanical constraints. Additionally, varying the internal heat generation rate (Q = 0.3, 1.2, 2.0, and 3.0 W/mm3) affects the magnitude of the stress, with higher heat sources leading to increased thermal gradients and consequently greater hoop stress, especially in the IPyC and SiC layers. From Figure 4a–c, it can be observed that the outer boundary temperature also influences the hoop stress experienced across the TRISO layers. However, it is important to note that this effect is most pronounced in the SiC layer, where higher external temperatures lead to a noticeable increase in tensile stress due to its high stiffness and strong mechanical constraint on surrounding layers. The hoop stress values in the SiC layer rise from approximately 300 MPa at 700 K to around 400 MPa at 900 K, and up to 600 MPa at 1200 K, clearly demonstrating the sensitivity of the stress state to thermal boundary conditions.
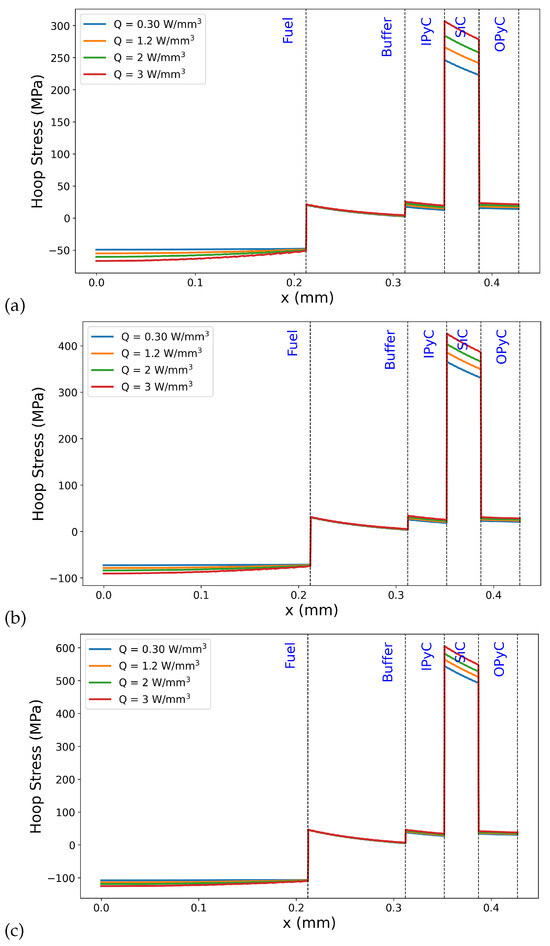
Figure 4.
Hoop stress distributions across TRISO particle layers for different internal heat generation rates (Q = 0.3, 1.2, 2.0, and 3.0 W/mm3) and outer boundary temperatures: (a) 700 K, (b) 900 K, and (c) 1200 K.
Figure 5 shows hoop stress distributions at the buffer–IPyC interface for different internal heat generation rates (Q = 0.3, 1.2, 2.0, and 3.0 W/mm3) and outer boundary temperatures: 700 K, 900 K, and 1200 K. The mechanical behavior of the buffer is crucial for evaluating the structural integrity of TRISO fuel particles under irradiation and thermal loading, as well as for understanding the interaction at the buffer–IPyC interface. The interface region was approximated as a 2 μm band comprising 1 μm from the outermost buffer and 1 μm from the innermost IPyC. This approach captures the stress and strain state near the material transition zone where mechanical and thermal mismatches develop, while maintaining numerical stability. Although it does not model interfacial failure mechanisms directly, it provides a representative measure of the interfacial mechanical environment, particularly under varying thermal and irradiation conditions. To evaluate the sensitivity of this approximation, two band thicknesses were tested under a simulation condition of 1200 K with a heat generation rate of Q = 3 W/mm3. The narrower band (2 μm) yielded an average hoop stress of 22.54 MPa, while the wider band (6 μm) produced an average of 23.67 MPa. The 5% increase indicates a mild stress gradient across the interface, with higher hoop stress nearer the IPyC side. These results support the use of a ±1 μm band (2 μm total) as a representative and numerically stable proxy for estimating interface stress, particularly in the absence of an explicitly modeled interfacial layer.
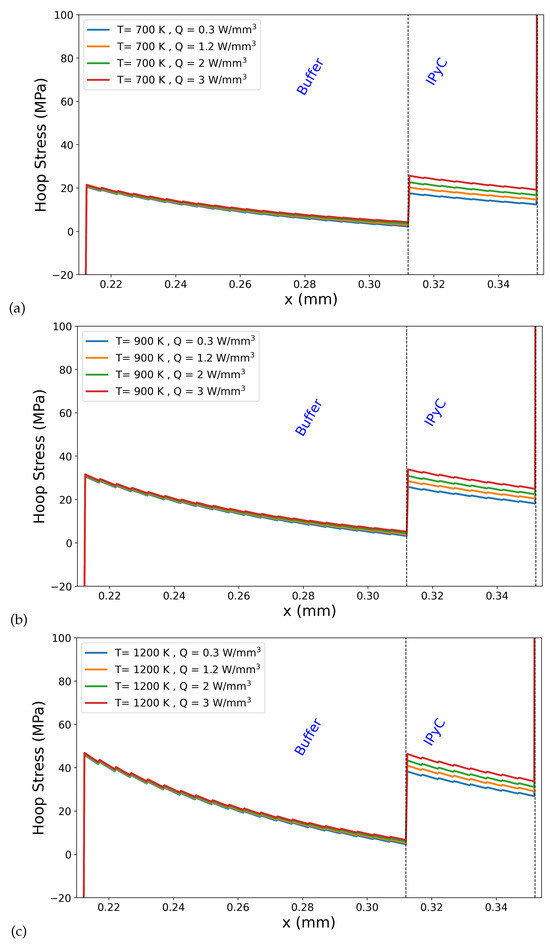
Figure 5.
Hoop stress distributions at the buffer–IPyC interface for different internal heat generation rates (Q = 0.3, 1.2, 2.0, and 3.0 W/mm3) and outer boundary temperatures: (a) 700 K, (b) 900 K, and (c) 1200 K.
Figure 5 reveals that hoop stress within the buffer layer exhibits a gradual decrease as the radial position approaches the IPyC interface. This reduction is consistent across all heat generation rates and outer surface temperatures. As shown in Figure 5, for all temperatures and heat generation rates, the stress increases abruptly from the buffer side to the IPyC side. This behavior can be attributed to differences in elastic modulus, thermal expansion coefficients, and related material properties. The magnitude of this stress increase becomes more significant with rising outer surface temperature. For instance, at the lowest heat generation rate (Q = 0.3 W/mm3), the average stress in the buffer layer increases from 9.33 MPa at 700 K to 13.89 MPa at 900 K, and further to 20.73 MPa at 1200 K. At a higher heat generation rate (Q = 3 W/mm3), the corresponding buffer layer stresses are 10.71 MPa, 15.27 MPa, and 22.12 MPa, respectively. In the IPyC layer, average stresses for Q = 0.3 W/mm3 increase from 14.67 MPa at 700 K to 21.56 MPa at 900 K, reaching 31.90 MPa at 1200 K. For Q = 3 W/mm3, the corresponding IPyC stresses rise to 22.00 MPa, 28.89 MPa, and 39.23 MPa. Within the IPyC layer, the stress not only increases sharply at the interface but also becomes more sensitive to heat generation rate (Q). For instance, the difference in average hoop stress in the buffer layer from Q = 0.3 to Q = 3 W/mm3 is approximately 1.4 MPa, whereas in the IPyC layer, the same increase in Q results in a stress difference of over 7 MPa. A clear increase in stress with rising outer surface temperature indicates that thermal expansion mismatch becomes more pronounced at higher temperatures, resulting in elevated thermally induced stresses, particularly within the stiffer IPyC layer. At the buffer–IPyC interface, a distinct and abrupt increase in stress is observed. This stress jump becomes more pronounced at higher temperatures and heat generation rates. For example, at Q = 0.3 W/mm3, the average hoop stress at the interface region increases from 8.35 MPa at 700 K to 12.25 MPa at 900 K, and further to 18.11 MPa at 1200 K. When Q increases to 3 W/mm3, the interface stress values rise to 12.78 MPa, 16.68 MPa, and 22.54 MPa for the same temperatures, respectively. These results confirm that the interface is highly sensitive to thermal loading, with both temperature and heat generation significantly amplifying stress at this critical location.
Figure 6 shows hoop stress distributions at the buffer–IPyC interface for varying outer boundary temperatures: 500 K, 700 K, 900 K, 1000 K, and 1200 K for different internal heat generation rates (Q = 0.3, 1.2, and 3.0 W/mm3). As seen in Figure 6, increasing the outer surface temperature leads to a noticeable amplification in the hoop stress discontinuity at the buffer–IPyC interface. At lower temperatures (e.g., 500 K), the stress transition across the interface is relatively moderate. However, as the temperature increases to 1200 K, the magnitude of the jump becomes significantly larger across all heat generation rates (see Figure 6a–c). This behavior is attributed to the growing mismatch in thermal expansion between the adjacent layers, which becomes more pronounced at elevated temperatures and results in greater thermally induced stresses concentrated near the interface. The stress hierarchy observed in the present simulations, where hoop stress increases from the buffer to the buffer–IPyC interface and reaches a maximum in the IPyC layer, is in strong agreement with the tensile strength trends reported by Mauseth et al. [14]. Their micro-tensile testing of surrogate TRISO particle layers demonstrated that the buffer–IPyC interlayer exhibits tensile strength behavior intermediate between the buffer and IPyC layers. This observation supports the simulated stress hierarchy, where the buffer consistently shows the lowest stress, the IPyC the highest, and the interface region acts as a transition zone. Although the highest absolute stresses occur within the IPyC layer, the spatial profile in Figure 6 shows that the buffer region adjacent to the interface experiences the steepest stress rise. This may explain why experimental fractures in buffer–IPyC specimens consistently initiate within the buffer side, where weaker mechanical properties coincide with high stress gradients.
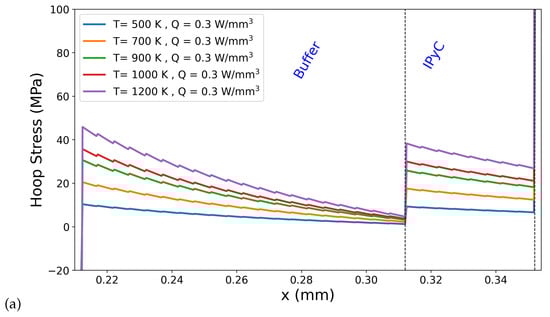
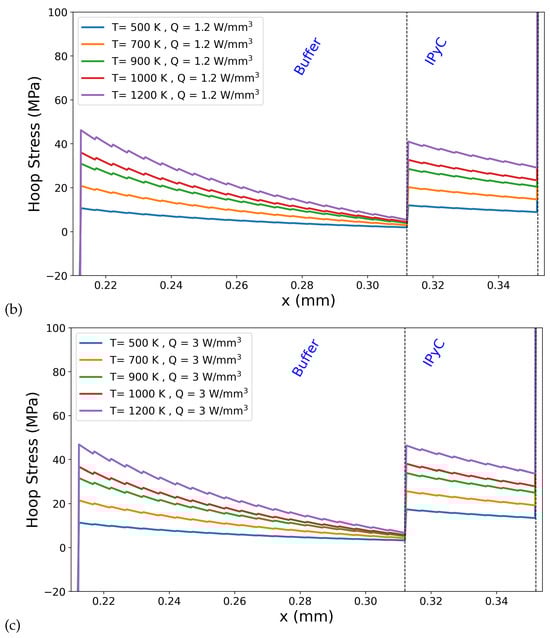
Figure 6.
Hoop stress distributions at the buffer–IPyC interface for varying outer boundary temperatures: 500 K, 700 K, 900 K, 1000 K, and 1200 K for different internal heat generation rates ((a) Q = 0.3, (b) 1.2, and (c) 3.0 W/mm3).
This study highlights that, even in the absence of irradiation effects, the temperature profile within the TRISO fuel particle leads to significant hoop stress, particularly due to the material property differences among the layers. The mismatch in thermal expansion coefficients and elastic stiffness introduces internal constraints that generate stress concentrations. These results emphasize that TRISO particles inherently experience mechanical loading due to their multilayered structure, even before accounting for additional irradiation-induced effects.
Given this intrinsic stress environment, it becomes vital to investigate how individual layers respond to their mechanical environment, and how their behavior is influenced by thermal conditions and microstructural characteristics. In particular, the buffer layer, due to its porous structure and compliant mechanical properties, plays a critical role in accommodating kernel swelling and mitigating stress transmission to outer layers. Therefore, in this study, special attention is given to the buffer layer to understand how its microstructural features influence its mechanical response.
3.2. Effect of Porosity on the Stiffness and Fracture Strength of the Buffer Layer
This section focuses on key geometrical characteristics of the buffer layer, with particular attention to porosity. Extensive structural changes occur in the buffer layer during reactor operation due to high temperatures, mechanical stresses, and radiation damage. These effects can lead to densification of the porous carbon or initiate cracking and fracture [10,36]. Since the stress state within the buffer is directly influenced by irradiation conditions, understanding its mechanical behavior as a function of porosity is critical. This investigation aims to evaluate how varying porosity levels affect the buffer’s load-bearing capacity, providing insight into how microstructural features contribute to the material’s response. Moreover, experimental studies have shown that irradiation can significantly increase porosity in the buffer layer due to the transport and trapping of gaseous fission products, which leads to pore expansion [15]. This increase in porosity has been associated with a reduction in fracture toughness, contributing to a higher likelihood of mechanical failure. These results reinforce the importance of studying the mechanical response of the buffer layer under varying porosity conditions, even in the absence of direct irradiation effects. By simulating stress-strain behavior in 2D domains with controlled void volume fractions, we aim to show the mechanical impact of porosity. To investigate the influence of microstructural variation, porosity (i.e., void volume fraction) was systematically varied in the analysis. The porosity is adjusted by varying the size of the pores while keeping their number constant within the volume.
Figure 7 shows the mechanical response for void volume fractions ranging from 10% to 50%. Increase in porosity (void volume fractions) leads to a higher probability of crack initiation at lower stress state and consequently a decrease in the fracture strength. As the porosity increases, the effective load-bearing area within the buffer layer decreases, making it less resistant to elastic deformation. Similarly, Figure 7 shows that the peak strength diminishes because stress concentrations tend to localize around voids. Therefore, it promotes earlier onset of failure.
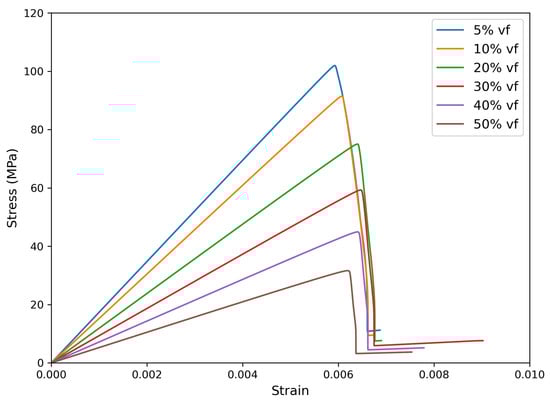
Figure 7.
Stress–strain curves show the mechanical response for void volume fractions ranging from 10% to 50%.
Understanding how stiffness degrades with porosity is critical for predicting stress distribution, fracture risk, and overall structural performance of TRISO particles during reactor operation. Figure 8 illustrates the stress–strain response with 10% void volume fraction, accompanied by snapshots of the damage progression. As the strain increases, stress rises linearly until it peaks, after which a sharp drop is observed due to crack initiation and propagation around the pore.
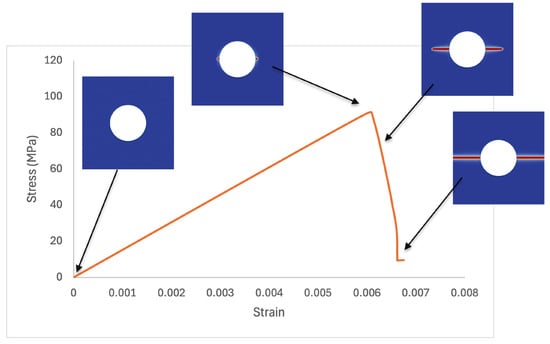
Figure 8.
Illustration of crack nucleation and growth superimposed on the stress–strain curve of a buffer layer with 10% porosity.
The porous buffer layer can be conceptualized as a two-phase composite, wherein voids are dispersed within a continuous solid matrix. Following the assumptions of the Generalized Mixture Rule (GMR) framework, the pores are modeled as having zero elastic modulus, and the resulting effective mechanical properties of the composite are governed by the interaction between the matrix and void phases. To quantify the influence of porosity on the mechanical behavior, our simulation results are fitted using the analytical expressions adapted from Ji et al. [37], as given in Equations (21) and (22). This approach enables a systematic evaluation of how the elastic modulus and fracture strength degrade with increasing void volume fraction. Central to this formulation is the scaling parameter J, which incorporates the effects of pore geometry, including size, shape, and distribution. This parameter establishes a direct and interpretable connection between microstructural features and macroscopic mechanical response. Within the context of our stress analysis, using J allows for more accurate modeling of the porous buffer layer’s behavior, offering greater predictive capability than models that rely solely on curve fitting without accounting for microstructural mechanics.
The dependence of elastic modulus on void volume fraction in the TRISO buffer layer was examined using three functional forms, as shown in Figure 9. The exponential relation, reproduced the dataset with but fails to enforce the physically required limit of as the void fraction approaches unity. The power-law expression, yielded a weaker fit () and is undefined at , making it unsuitable for describing the dense limit. By contrast, the GMR, also achieved an excellent correlation () while retaining a direct link to the remaining solid fraction . This formulation guarantees , ensuring physically meaningful end states. Moreover, the exponent reflects microstructural sensitivity; in this case . The explicit dependence on solid fraction and the ability to encode pore geometry make the GMR approach a more robust and interpretable description of modulus degradation than either the exponential or power-law forms. A similar analysis was performed on the strength of the TRISO buffer layer as a function of void volume fraction (see Figure 10). Although exponential and power-law relations reproduce the overall decrease in strength, their limitations are evident. The exponential fit () predicts an unrealistically steep drop at low porosity, while the power-law fit () underestimates the rapid loss of strength as void fraction increases. By contrast, the GMR formulation, with , , and , provides the most accurate and physically consistent description. It anchors strength directly to the remaining solid fraction (e.g., load-bearing capacity), ensuring and . The fitted exponent captures how pore geometry accelerates strength degradation beyond the rate of stiffness reduction.
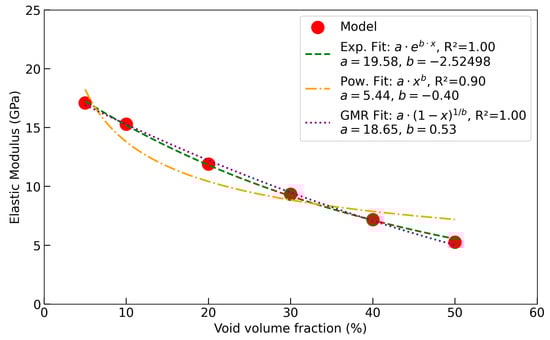
Figure 9.
Elastic modulus as a function of porosity, shows the impact of increasing void fraction on the material’s mechanical response.
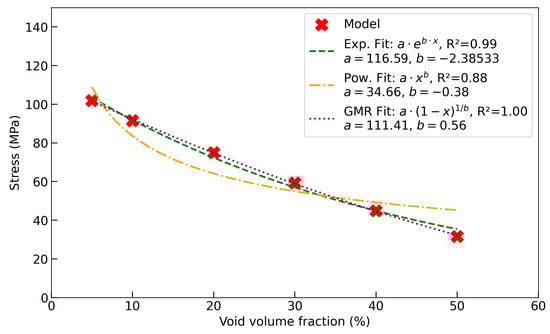
Figure 10.
Strength as a function of porosity. Strength decreases monotonically with increasing void fraction, consistent with reduced load-bearing area and pore-tip stress concentrations; the curves compare the best-fit trends.
3.3. Effect of Pore Morphology on the Stiffness and Fracture Strength of the Buffer Layer
Building on the porosity analysis and prior experimental evidence that pores in the buffer layer tend to elongate in the circumferential direction [38], we investigated the role of pore shape in the mechanical response. This directional morphology -potentially arising from processing conditions- has been linked to fracture initiation and growth via stress concentrations controlled by pore geometry and orientation. Therefore, analyzing the impact of varying aspect ratios provides further insight into how anisotropy at the microstructural level influences the buffer layer’s structural integrity.
Moreover, variations in pore shape may also reflect irradiation-dependent mechanisms, reinforcing the importance of studying aspect ratio effects in this context. To assess its influence on the mechanical behavior of the TRISO buffer layer, we compare two distinct pore shapes: circular and elliptical. These geometries are chosen to represent idealized but relevant variations observed in real microstructures, allowing us to investigate how pore geometry affects stress distribution, crack initiation, and fracture propagation in the phase field simulations.
To investigate the effect of pore shape on mechanical response, we performed a parametric study by varying the aspect ratio of elliptical pores. The aspect ratio was defined as the ratio of the minor axis length (b) to major axis length (a). Series of simulations were conducted by gradually decreasing a and increasing b, resulting in a range of aspect ratios from highly elongated to nearly circular pores. The index on the x-axis represents individual simulation cases, where each point corresponds to a unique pair. This analysis highlights the geometric differences used in the simulations to study the influence of pore anisotropy on fracture behavior.
Figure 11a shows the dependence of elastic modulus on pore aspect ratio (AR, defined here as minor-to-major axis). Circular pores (AR = 1) preserve stiffness, whereas highly elongated pores (low AR, e.g., 0.1–0.2) markedly weaken the material. For AR ≲ 0.3 the modulus drops significantly, indicating a rapid loss of mechanical integrity in the presence of elongated porosity. The fitted moduli span ≈ 5–17 GPa and follow a logarithmic trend described by the equation with a goodness of fit of . Here, even at constant porosity, geometric anisotropy further degrades stiffness, highlighting the compounded mechanical impact of pore shape and volume fraction. The findings of our simulations show strong agreement with experimental observations reported in irradiation studies [15].
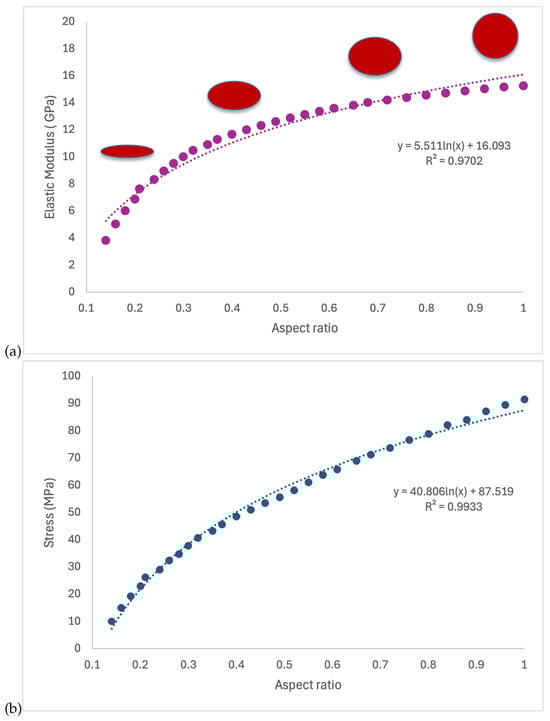
Figure 11.
Effect of pore aspect ratio (AR; lower AR = more elongated) on the elastic modulus (a) and strength (b) of the buffer layer. Schematics show the pore shapes used in the simulations. Both properties increase monotonically with AR and are well described by logarithmic fits; however, strength is far more sensitive -at AR = 0.2, E ≈ 0.45 × and strength ≈ 0.25 × their AR = 1.0 values- consistent with stress concentrations at crack-like void tips.
Figure 11b shows effect of pore aspect ratio on the strength of the buffer layer. The tendency for fractures at the buffer–IPyC interface were observed either within the buffer layer or directly at the interface in both unirradiated and irradiated TRISO particles. During irradiation, densification and incomplete separation at the buffer–IPyC interface introduce additional voids and internal tearing near this region, further weakening it [39]. The present results in Figure 11b, which demonstrate that strength decreases with decreasing aspect ratio (i.e., increasingly elongated pores), support this interpretation. The tensile strength of the buffer layer exhibits a strong dependence on pore aspect ratio. Data indicate that when the void aspect ratio is close to unity (AR = 1, i.e., circular pore), the strength approaches 100 MPa, whereas elongated defects with aspect ratio = 0.1 reduce the strength to approximately 10 MPa. This one order of magnitude drop is consistent with classical stress concentration theory, where the stress intensity factor increases markedly as pores become crack-like, amplifying local stresses and facilitating fracture at substantially lower applied loads. These findings align with the void morphology and porosity evolution govern the fracture response of the buffer side. Elongated pores function as efficient stress concentrators, amplifying local stress intensity and promoting microcrack propagation along the buffer–IPyC interface. When considered alongside observations that densification and irradiation-induced void coalescence further elevate local porosity, it becomes evident that the combined effects of increased void fraction and pore elongation degrade mechanical strength. Pore aspect ratio plays a critical role by controlling the severity of local stress concentration and, consequently, the fracture resistance of the buffer layer.
Collectively, these results show that both strength and stiffness are sensitive to pore geometry, underscoring the need to include pore AR in predictive models of porous materials. Notably, fracture strength declines with decreasing AR at roughly twice the rate of stiffness, as indicated by the steeper slope of the strength-AR curve. For instance, at AR = 0.2 (vs. AR = 1.0), the elastic modulus is about 0.45 of the circular-pore value (≈7.2 vs. 16.1 GPa; ∼55% reduction), whereas the fracture strength is about 0.25 of the circular-pore value (≈21.8 vs. 87.5 MPa; ∼75% reduction). This disproportionate degradation arises from stress concentrations at void tips, which elevate local stresses and suppress apparent strength more than they affect the elastic (stiffness) response. We next quantify the stress concentration factor as a function of AR.
To validate our model predictions for the stress concentration factors, we compare the simulation results with reference analytical solutions from the literature [40]. These benchmark solutions are commonly expressed in polynomial form, with some formulations incorporating only the secant term (Equation (23), and others combining both secant and polynomial terms (Equation (24)). The polynomial term introduces only a minor correction. As shown in Figure 12, the stress intensity factor (SIF) increases significantly with void radius, especially as the normalized radius a/W approaches and exceeds 0.5, where finite-width effects become prominent. The overall trend predicted by our model shows strong agreement with these analytical results.
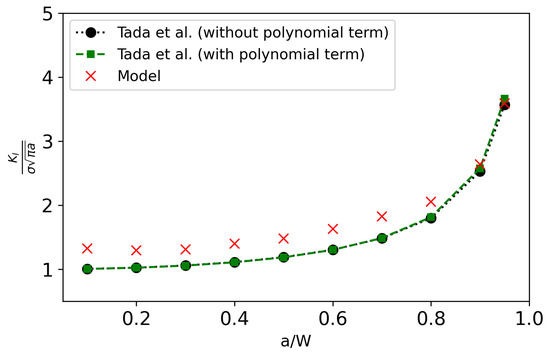
Figure 12.
Comparison of stress intensity factor versus a/W ratio: Results from our numerical model show strong agreement with reference solutions from Tada et al. [40] both with and without polynomial correction, demonstrating the model’s accuracy in capturing fracture behavior.
To further investigate the role of void geometry on stress amplification within the buffer layer, analytical stress concentration factors (SCFs) are computed for elliptical voids embedded in a finite-width plate subjected to uniaxial loading. These calculations follow the methodology established by Pilkey and Peterson [41], with the relevant equations and parameters summarized below and in Table 5.
Table 5.
Constants that depends on the shape and size of the crack and domain [41].
The analytical SCF expressions from Pilkey and Peterson [41] offer a useful baseline for understanding stress amplification around elliptical voids in the buffer layer. However, these solutions are shape-insensitive at low aspect ratios and tend to overestimate SCFs, particularly when the void aspect ratio is below 0.4 (see Figure 13). shows more dramatic differences than . The discrepancy between model and analytical predictions is amplified in , where the additional scaling term intensifies the overestimation at small aspect ratios. This suggests that shape and finite-width effects cannot be decoupled analytically with high fidelity. The numerical model more accurately isolates these contributions, leading to improved predictive capability, particularly for small and highly elongated voids. This limitation arises from their neglect of nonlinear interactions between void size, shape, and stiffness degradation. In contrast, our numerical model accounts for these coupled effects, allowing it to more accurately capture the stress concentration behavior driven by void geometry. The comparison confirms that while analytical and numerical results converge at higher aspect ratios, shape-dependent stress amplification in the buffer layer is best resolved through numerical analysis. These results emphasize the importance of accounting for void morphology in the design and analysis of porous buffer layers in TRISO particles. Relying on analytical estimates may lead to conservative or misleading predictions, especially when voids are elongated or irregular. The numerical approach provides a more accurate tool for quantifying stress concentrations in complex porous geometries.
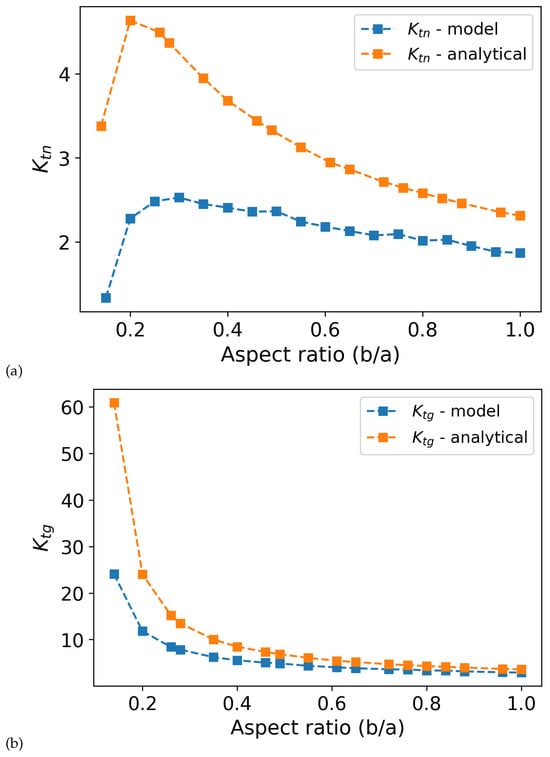
Figure 13.
Comparison of analytical and numerical stress concentration factors ( and ) as a function of void aspect ratio (b/a), highlighting the influence of shape effects on stress amplification in the buffer layer, where (a) corresponds to and (b) to .
Our results demonstrate that increased porosity and elongated pore shapes lead to reductions in mechanical strength and stiffness, consistent with the experimentally observed decrease in fracture toughness under high fluence conditions. Specifically, the data indicate that buffer layers exposed to low temperatures and high fluence exhibit pore expansion and widespread fractures throughout the buffer. This aligns with our simulations showing stress concentration amplification and stiffness degradation as aspect ratio and porosity increase. Additionally, the experimentally reported radial porosity gradients and circumferential fracture behavior correspond well with our modeling predictions, which highlight the strong implications of anisotropic pore morphology. Our analysis supports the interpretation that irradiation and temperature-driven microstructural evolution, particularly in pore shape and size, can significantly impact the mechanical performance of the buffer layer. These analyses provide a mechanistic link between the observed experimental behavior and the simulation outcomes.
4. Conclusions
This study successfully established a robust framework for analyzing the complex thermo-mechanical behavior of TRISO fuel particles, which is crucial for ensuring the safety and reliability of advanced nuclear reactors. By implementing a multiscale and multiphysics approach that combines particle-scale thermo-mechanical finite-element analysis with mesoscale phase-field fracture, we correlated microstructural features within the buffer layer to the macroscopic mechanical response of the entire particle. This methodology provides a detailed, mechanistic understanding of the stress evolution and potential failure pathways in TRISO fuel, linking material properties at the microscale to performance at the particle scale. By implementing the models in the open-source MOOSE ecosystem, we provide a transparent, extensible path to reproduce results and to couple additional physics relevant to advanced reactor conditions.
At the particle scale, the thermo-mechanical analysis revealed that significant internal stresses develop within fresh, unirradiated TRISO particles solely due to thermal gradients and mismatches in material properties between the constituent layers. Notably, high tensile hoop stresses were predicted in the stiff IPyC and SiC layers, which act as the primary structural barriers. The buffer-IPyC interface was identified as a critical region, exhibiting a sharp stress discontinuity that is highly sensitive to both the internal heat generation rate and the particle’s outer surface temperature. These findings underscore that TRISO particles are subjected to considerable baseline mechanical loading that must be accounted for before superimposing irradiation-induced effects.
At the mesoscale, the model effectively quantified the combined impact of pore volume fraction, size, and morphology on the mechanical integrity of the porous buffer layer. Our results demonstrated that both stiffness and strength degrade significantly with increasing porosity. More importantly, the model captured the critical role of pore shape, showing that elongated pores disproportionately reduce fracture strength compared to stiffness due to amplified stress concentrations. A key strength of this work is its ability to decouple the influence of the reduction in load-bearing capacity from the stress concentration effects, providing a clearer understanding of the distinct mechanisms that govern failure in porous microstructures. The model’s accuracy in predicting these stress concentrations was validated against established analytical solutions, confirming its predictive capability.
Future investigations should extend this framework to incorporate irradiation-induced phenomena, such as material swelling, creep, thermal conductivity degradation, and fission gas production, to provide a more comprehensive fuel performance model [21,24,42,43]. Expanding the simulations to 3D would allow for the analysis of asymmetric effects, including particle asphericity and non-uniform crack propagation. Additionally, coupling the current thermo-mechanical model with fission product transport and gas release models within MOOSE could offer deeper insights into the internal pressurization of the particle. Finally, integrating realistic pore structures obtained from advanced characterization techniques, such as X-ray computed tomography, would further enhance the model’s fidelity and predictive power for real-world fuel performance [44].
Author Contributions
M.G.; Methodology, Investigation, Validation, Formal analysis, Writing—original draft. K.A.; Project administration, Conceptualization, Methodology, Funding acquisition, Supervision, Writing—review and editing. All authors have read and agreed to the published version of the manuscript.
Funding
The work presented here was supported by the U.S. Department of Energy NEUP program under award agency number DE-NE0009134 at Texas A&M University. Any opinions, findings, and conclusions or recommendations expressed in this publication are those of the author(s) and do not necessarily reflect the views of the U.S. Department of Energy. K.A. acknowledges the support from the U.S. Nuclear Regulatory Commission (NRC) under award agency number 31310024M0002 at Texas A&M University. Portions of this research made use of Idaho National Laboratory computing resources which are supported by the Office of Nuclear Energy of the U.S. Department of Energy and the Nuclear Science User Facilities under Contract no. DE-AC07-05ID14517.
Data Availability Statement
The input files for this study are available for download from a public repository located at https://github.com/mervegencturk/TRISO (accessed on 28 September 2025).
Conflicts of Interest
The authors declare no conflicts of interest.
References
- Uranium Oxycarbide (UCO) Tristructural Isotropic (TRISO) Coated Particle Fuel Performance: Topical Report EPRI-AR-1 (NP). 2019. Available online: https://www.epri.com/research/products/000000003002015750 (accessed on 10 June 2025).
- Liu, B.; Liang, T.; Tang, C. A review of TRISO-coated particle nuclear fuel performance models. Rare Met. 2006, 25, 337–342. [Google Scholar] [CrossRef]
- Bari, K.; Osarinmwian, C.; López-Honorato, E.; Abram, T.J. Characterization of the porosity in TRISO coated fuel particles and its effect on the relative thermal diffusivity. Nucl. Eng. Des. 2013, 265, 668–674. [Google Scholar] [CrossRef]
- Andersson, D.A.; Stanek, C.R.; Matthews, C.; Uberuaga, B.P. The past, present, and future of nuclear fuel. MRS Bull. 2023, 48, 1154–1162. [Google Scholar] [CrossRef]
- Petti, D.; Martin, P.; Phelip, M.; Ballinger, R. Development of Improved Models and Designs for Coated-Particle Gas Reactor Fuels–Final Report Under the International Nuclear Energy Research Initiative (I-NERI). Technical Report INEEL/EXT–05-02615, 911237. 2004. Available online: https://inis.iaea.org/records/7nkxt-04k66 (accessed on 10 June 2025). [CrossRef]
- Petti, D.; Maki, J.; Hunn, J.; Pappano, P.; Barnes, C.; Saurwein, J.; Nagley, S.; Kendall, J.; Hobbins, R. The DOE advanced gas reactor fuel development and qualification program. JOM 2010, 62, 62–66. [Google Scholar] [CrossRef]
- Powers, J.J.; Wirth, B.D. A review of TRISO fuel performance models. J. Nucl. Mater. 2010, 405, 74–82. [Google Scholar] [CrossRef]
- Terrani, K.A.; Snead, L.L.; Gehin, J.C. Microencapsulated fuel technology for commercial light water and advanced reactor application. J. Nucl. Mater. 2012, 427, 209–224. [Google Scholar] [CrossRef]
- Demkowicz, P.A.; Liu, B.; Hunn, J.D. Coated particle fuel: Historical perspectives and current progress. J. Nucl. Mater. 2019, 515, 434–450. [Google Scholar] [CrossRef]
- Helmreich, G.W.; Kercher, A.K.; Gerczak, T.J.; Richardson, D.; Montgomery, F.C.; Skitt, D.J.; Hunn, J.D. Microstructure of irradiated AGR TRISO particle buffer layers as measured by X-ray computed tomography. J. Nucl. Mater. 2022, 572, 154061. [Google Scholar] [CrossRef]
- Ploger, S.A.; Demkowicz, P.A.; Hunn, J.D.; Kehn, J.S. Microscopic analysis of irradiated AGR-1 coated particle fuel compacts. Nucl. Eng. Des. 2014, 271, 221–230. [Google Scholar] [CrossRef]
- Demkowicz, P.A.; Hunn, J.D.; Petti, D.A.; Morris, R.N. Key results from irradiation and post-irradiation examination of AGR-1 UCO TRISO fuel. Nucl. Eng. Des. 2018, 329, 102–109. [Google Scholar] [CrossRef]
- Hunn, J.D.; Baldwin, C.A.; Gerczak, T.J.; Montgomery, F.C.; Morris, R.N.; Silva, C.M.; Demkowicz, P.A.; Harp, J.M.; Ploger, S.A. Detection and analysis of particles with failed SiC in AGR-1 fuel compacts. Nucl. Eng. Des. 2016, 306, 36–46. [Google Scholar] [CrossRef]
- Mauseth, T.; Dunzik-Gougar, M.L.; Meher, S.; Van Rooyen, I.J. Determining the tensile strength of fuel surrogate TRISO-coated particle buffer, IPyC, and buffer-IPyC interlayer regions. J. Nucl. Mater. 2023, 583, 154540. [Google Scholar] [CrossRef]
- Griesbach, C.; Gerczak, T.; McKinney, C.; Zhang, Y.; Thevamaran, R. Irradiation-condition dependent mechanisms controlling buffer densification and fracture in TRISO nuclear fuel particles. J. Nucl. Mater. 2025, 605, 155565. [Google Scholar] [CrossRef]
- Hunn, J.D.; Baldwin, C.A.; Montgomery, F.C.; Gerczak, T.J.; Morris, R.N.; Helmreich, G.W.; Demkowicz, P.A.; Harp, J.M.; Stempien, J.D. Initial examination of fuel compacts and TRISO particles from the US AGR-2 irradiation test. Nucl. Eng. Des. 2018, 329, 89–101. [Google Scholar] [CrossRef]
- Miller, G.K.; Petti, D.A.; Maki, J.T.; Knudson, D.L. PARFUME Theory and Model Basis Report. INL 2009, INL/EXT-08-14497. Available online: https://inldigitallibrary.inl.gov/sites/sti/sti/4363854.pdf (accessed on 10 June 2025).
- Martin, D.G. Considerations pertaining to the achievement of high burn-ups in HTR fuel. Nucl. Eng. Des. 2002, 213, 241–258. [Google Scholar] [CrossRef]
- Wang, J.; Ballinger, R.G.; Maclean, H.J. TIMCOAT: An Integrated Fuel Performance Model for Coated Particle Fuel. Nucl. Technol. 2004, 148, 68–96. [Google Scholar] [CrossRef]
- Boer, B.; Ougouag, A.M.; Kloosterman, J.L.; Miller, G.K. Stress Analysis of Coated Particle Fuel in Graphite of High-Temperature Reactors. Nucl. Technol. 2008, 162, 276–292. [Google Scholar] [CrossRef]
- Williamson, R.L.; Hales, J.D.; Novascone, S.R.; Pastore, G.; Gamble, K.A.; Spencer, B.W.; Jiang, W.; Pitts, S.A.; Casagranda, A.; Schwen, D.; et al. BISON: A Flexible Code for Advanced Simulation of the Performance of Multiple Nuclear Fuel Forms. Nucl. Technol. 2021, 207, 954–980. [Google Scholar] [CrossRef]
- Miller, G.K.; Petti, D.A.; Varacalle, D.J.; Maki, J.T. Statistical approach and benchmarking for modeling of multi-dimensional behavior in TRISO-coated fuel particles. J. Nucl. Mater. 2003, 317, 69–82. [Google Scholar] [CrossRef]
- Haynes, T.; Battistini, A.; Leide, A.; Liu, D.; Jones, L.; Shepherd, D.; Wenman, M. Peridynamic modelling of cracking in TRISO particles for high temperature reactors. J. Nucl. Mater. 2023, 576, 154283. [Google Scholar] [CrossRef]
- Skerjanc, W.F.; Maki, J.T.; Collin, B.P.; Petti, D.A. Evaluation of design parameters for TRISO-coated fuel particles to establish manufacturing critical limits using PARFUME. J. Nucl. Mater. 2016, 469, 99–105. [Google Scholar] [CrossRef]
- Hales, J.; Williamson, R.; Novascone, S.; Perez, D.; Spencer, B.; Pastore, G. Multidimensional multiphysics simulation of TRISO particle fuel. J. Nucl. Mater. 2013, 443, 531–543. [Google Scholar] [CrossRef]
- Hales, J.; Tonks, M.; Chockalingam, K.; Perez, D.; Novascone, S.; Spencer, B.; Williamson, R. Asymptotic expansion homogenization for multiscale nuclear fuel analysis. Comput. Mater. Sci. 2015, 99, 290–297. [Google Scholar] [CrossRef]
- Toptan, A.; Jiang, W.; Hales, J.D.; Spencer, B.W.; Novascone, S. Verification of Bison fission product species conservation under TRISO reactor conditions. J. Nucl. Mater. 2023, 573, 154105. [Google Scholar] [CrossRef]
- Giudicelli, G.; Lindsay, A.; Harbour, L.; Icenhour, C.; Li, M.; Hansel, J.E.; German, P.; Behne, P.; Marin, O.; Stogner, R.H.; et al. 3.0-MOOSE: Enabling massively parallel multiphysics simulations. SoftwareX 2024, 26, 101690. [Google Scholar] [CrossRef]
- Gencturk, M. Multiphysics and Multiscale Modeling of the Mechanical Behavior of Nuclear Fuels. PhD. Thesis, Texas A&M University, College Station, TX, USA, 2025. [Google Scholar]
- McClenny, L.D.; Butt, M.I.; Abdoelatef, M.G.; Pate, M.J.; Yee, K.L.; Harikrishnan, R.; Perez-Nunez, D.; Jiang, W.; Ortega, L.H.; McDeavitt, S.M.; et al. Experimentally validated multiphysics modeling of fracture induced by thermal shocks in sintered UO 2 pellets. J. Nucl. Mater. 2022, 565, 153719. [Google Scholar] [CrossRef]
- Allen, S.M.; Cahn, J.W. A microscopic theory for antiphase boundary motion and its application to antiphase domain coarsening. Acta Metall. 1979, 27, 1085–1095. [Google Scholar] [CrossRef]
- Levitas, V.I.; Jafarzadeh, H.; Farrahi, G.H.; Javanbakht, M. Thermodynamically consistent and scale-dependent phase field approach for crack propagation allowing for surface stresses. Int. J. Plast. 2018, 111, 1–35. [Google Scholar] [CrossRef]
- Wu, J.Y.; Nguyen, V.P.; Nguyen, C.T.; Sutula, D.; Sinaie, S.; Bordas, S.P. Phase-field modeling of fracture. In Advances in Applied Mechanics; Elsevier: Amsterdam, The Netherlands, 2020; Volume 53, pp. 1–183. [Google Scholar] [CrossRef]
- Gaston, D.; Newman, C.; Hansen, G.; Lebrun-Grandié, D. MOOSE: A parallel computational framework for coupled systems of nonlinear equations. Nucl. Eng. Des. 2009, 239, 1768–1778. [Google Scholar] [CrossRef]
- Geelhood, K.J. PNNL-31427-TRISO Fuel: Properties and Failure Modes 2021. Available online: https://www.nrc.gov/docs/ML2117/ML21175A152.pdf (accessed on 10 June 2025).
- Rice, F.; Stempien, J.; Demkowicz, P. Ceramography of irradiated TRISO fuel from the AGR-2 experiment. Nucl. Eng. Des. 2018, 329, 73–81. [Google Scholar] [CrossRef]
- Ji, S.; Gu, Q.; Xia, B. Porosity dependence of mechanical properties of solid materials. J. Mater. Sci. 2006, 41, 1757–1768. [Google Scholar] [CrossRef]
- Griesbach, C.; Gerczak, T.; Zhang, Y.; Thevamaran, R. Microstructural heterogeneity of the buffer layer of TRISO nuclear fuel particles. J. Nucl. Mater. 2023, 574, 154219. [Google Scholar] [CrossRef]
- Mauseth, T.; Dunzik-Gougar, M.L.; Teng, F. Micro-Tensile Characteristics of As-Fabricated and Irradiated Agr-2 Triso Fuel Particle Buffer, Ipyc, and Buffer-Ipyc Interlayer Regions. J. Nucl. Mater. 2025, 616, 156086. [Google Scholar] [CrossRef]
- Tada, H.; Paris, P.C.; Irwin, G.R. The Stress Analysis of Cracks Handbook, 3rd ed.; ASME Press: New York, NY, USA, 2000. [Google Scholar] [CrossRef]
- Pilkey, W.D.; Pilkey, D.F.; Peterson, R.E. Peterson’s Stress Concentration Factors, 3rd ed.; John Wiley & Sons, Inc.: Hoboken, NJ, USA, 2008. [Google Scholar]
- Ozturk, A.; Gencturk, M.; Ahmed, K. Surface and Size Effects on the Behaviors of Point Defects in Irradiated Crystalline Solids. Front. Mater. 2021, 8, 684862. [Google Scholar] [CrossRef]
- Ahmed, K.; El-Azab, A. Phase-Field Modeling of Microstructure Evolution in Nuclear Materials. In Handbook of Materials Modeling; Andreoni, W., Yip, S., Eds.; Springer International Publishing: Cham, Switzerland, 2020; pp. 2313–2334. [Google Scholar] [CrossRef]
- Badry, F.; Singh, M.; Ortega, L.H.; Mcdeavitt, S.M.; Ahmed, K. An experimentally validated mesoscale model for the effective thermal conductivity of U-Zr fuels. J. Nucl. Mater. 2023, 574, 154203. [Google Scholar] [CrossRef]


Disclaimer/Publisher’s Note: The statements, opinions and data contained in all publications are solely those of the individual author(s) and contributor(s) and not of MDPI and/or the editor(s). MDPI and/or the editor(s) disclaim responsibility for any injury to people or property resulting from any ideas, methods, instructions or products referred to in the content. |
© 2025 by the authors. Licensee MDPI, Basel, Switzerland. This article is an open access article distributed under the terms and conditions of the Creative Commons Attribution (CC BY) license.