Abstract
During natural gas field extraction, downhole compressors frequently encounter gas-liquid two-phase flow conditions, yet the internal flow characteristics and performance evolution mechanisms remain insufficiently understood. This paper investigates a small-scale, low-pressure-ratio five-stage axial compressor using a multiphase numerical simulation method based on the Euler-Lagrange framework. The study systematically examines the effects of different inlet pressures (0.1 MPa, 1 MPa, 8 MPa) and liquid mass fraction (0%, 5%, 10%) on its overall and stage-by-stage performance, droplet evolution, and flow field structure. The results indicate that the inlet pressure exerts a decisive influence on the overall efficiency trend of wet compression. The stage efficiency response displays a trend of an initial decrease in the front stages followed by an increase in the rear stages, showing significant variation under different inlet pressures. Flow field analysis reveals that increased inlet pressure intensifies droplet aerodynamic breakup, leading to higher flow losses in the compressor. Simultaneously, under high-pressure conditions, the cumulative cooling effect resulting from droplet heat transfer and evaporation effectively enhances the flow stability in the rear stages. This research elucidates the interstage interaction mechanisms of gas-liquid two-phase flow in low-pressure-ratio multistage compressors and highlights the competing influences of droplet breakup and evaporation effects on performance under different pressure conditions, providing a theoretical basis for the optimal design of downhole wet gas compression technology.
1. Introduction
In conventional natural gas field development, surface compression is a commonly employed method to enhance well productivity and recovery. However, in specific scenarios such as the development of small condensate gas fields, liquid loading in gas wells is particularly pronounced. Under such operating conditions, the liquid-phase components in the medium can significantly impact compressor performance, resulting in a typical gas–liquid two-phase flow regime. Downhole gas compression technology increases gas production by reducing the flowing bottom-hole pressure and enlarging the pressure drawdown. It not only enhances production rates but also lowers the reservoir abandonment pressure, thereby improving ultimate recovery. Furthermore, subsea wet gas compression serves as a cost-effective boosting solution, capable of directly handling gas–liquid mixtures with liquid volume fractions of up to five percent. This approach eliminates the need for condensate pre-separation processes, leading to substantial savings in investment and operational costs [1,2,3,4,5].
Substantial research has been conducted in the field of gas–liquid two-phase flow compressors. Murthy [6] demonstrated through engine water ingestion experiments that compressor performance degrades markedly when the droplet mass fraction exceeds 1%. Nikolaidis et al. [7] observed in water ingestion tests that droplets reside only briefly within the engine; when the droplet diameter exceeds 500 μm, the mass change due to evaporation is negligible relative to the droplet’s own mass, allowing the omission of mass and heat transfer associated with phase change. Eisfeld [8] further indicated that evaporation effects can be disregarded in compressors with minimal temperature rise during gas compression. Mealand et al. [9] conducted multi-condition experimental studies on wet-gas centrifugal compressors, systematically evaluating the effects of liquid content, density ratio, and Mach number on the compression ratio and polytropic efficiency. They proposed a performance correlation model based on similarity parameters, providing an experimental basis for wet compression system design. Serena et al. [10] performed systematic experimental investigations on surge cycles in centrifugal compressors under wet-gas conditions. Using high-speed imaging, they captured flow reversal and droplet distribution characteristics across different stages of surge development, revealing the damping effect of liquid content on surge amplitude and frequency, thereby offering an experimental foundation for surge prediction and control. In 2003, Alstom enhanced the GT26 test rig by integrating a water injection system, achieving a 1.2% increase in gas turbine power output [11].
Due to the challenges in observing droplet behavior inside engines during water ingestion experiments, numerical simulation has become a vital tool for studying droplet trajectories and morphological evolution. Stanton et al. [12] systematically classified post-impact droplet morphology based on the Weber number. Using CFD (Computational Fluid Dynamics) methods, Das et al. [13] analyzed energy losses caused by water ingestion in compressors, finding that losses concentrate primarily in the rotor tip region. This is attributed to droplet migration toward the blade tip and casing under centrifugal force, increasing the work done on the liquid by the blades and correspondingly reducing effective work on the gas, thereby inducing energy loss. In recent years, high-fidelity numerical simulations have been widely used to elucidate the mechanisms by which droplets affect compressor performance. Luo et al. [14] investigated the impact of rainwater ingestion with different spatial distribution patterns on the performance and flow field distortion of a three-stage compressor. They found that non-uniform droplet distribution leads to inlet total pressure distortion, and higher non-uniformity results in more significant performance degradation. Luo et al. [15] further conducted wet compression simulations of a multistage subsonic compressor, indicating that water injection can suppress flow separation, enhance pressure ratio and efficiency, and pull the near-stall operating point back into the stable operating range. Yang et al. [16] confirmed that after water ingestion, both pressure ratio and adiabatic efficiency decrease, overall compression efficiency drops by 1–2%, the operating point shifts forward, and the stable operating boundary narrows. Zhu et al. [17] performed wet compression simulations on a three-stage transonic compressor and observed that droplet radial migration increases the mass flux in the tip region while enhancing blade work capacity, leading to a significant rise in rotor outlet flow swirl. Zhang et al. [18] systematically analyzed the evaporation distribution characteristics of droplets of different sizes near the choke boundary. They noted that axial droplet evaporation exhibits a two-stage parabolic growth, while radial evaporation tends to become more uniform with decreasing droplet size, suggesting that smaller droplets are more conducive to achieving uniform cooling and performance improvement. Zawadzki et al. [19], based on high-fidelity CFD, investigated the effects of water injection in an aero-engine compressor. Their study revealed that smaller droplets evaporate more completely, significantly reducing outlet temperature and increasing flow rate, offering a new approach for reducing nitrogen oxide emissions.
The production enhancement effect of downhole gas compression technology exhibits a positive correlation with the pressure ratio. However, once the pressure ratio exceeds a specific threshold, the incremental production gains gradually diminish, while both power demand and discharge temperature rise sharply. Consequently, it is essential to determine a techno-economically optimal pressure ratio tailored to different operating conditions, for which multistage axial compressors are better suited due to their adaptability. The existing literature indicates that current research on gas–liquid two-phase flow predominantly focuses on single-stage compressors, whereas studies addressing the impact of liquids on the stage-by-stage performance of multistage compressors remain limited. To address this gap, this study will systematically analyze the characteristics of gas–liquid two-phase flow in multistage axial compressors under downhole operating conditions. The research objectives include evaluating the overall and stage-by-stage performance evolution of the compressor under varying liquid mass flow rates, unveiling the interaction mechanisms between droplets and the flow field under different inlet pressures, and elucidating the interstage coupling mechanisms within the compressor. The study will focus on analyzing the influence of droplet introduction on compressor performance and flow field characteristics under specific pressure ratio conditions.
2. Physical Models and Computational Methods
This study investigates the wet compression performance of a small-scale, low-pressure-ratio five-stage axial compressor. The fundamental geometric and aerodynamic parameters are determined based on downhole measurements, design specifications, and the research of Nader et al. [20]. This study focuses on the design operating condition of the compressor. The simulations are conducted in the vicinity of the optimal efficiency region, sufficiently distant from the surge limit line to ensure stable flow operation. The design parameters are shown in Table 1. Figure 1 presents the meridional flow passage schematic of the five-stage axial compressor, and Figure 2 illustrates the computational mesh of a single passage.

Table 1.
Downhole compressor design parameters.
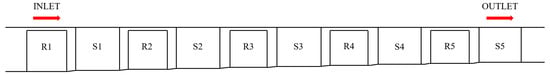
Figure 1.
Meridional view of downhole five-stage axial compressor.
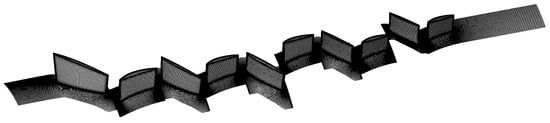
Figure 2.
Downhole five-stage compressor single-channel computing mesh.
Based on the three-dimensional geometric model, the geometric coordinate file of the compressor was extracted, and structured mesh generation was performed using NUMECA (version 16.1) Autogrid (version 5) software. Figure 3 illustrates the mesh distribution of the first-stage rotor blade, with local refinement applied in the leading edge and trailing edge regions. The mesh topology adopts a H-O-H configuration: O-grids are arranged around the blade surfaces to accurately resolve boundary layer flow, while H-grids are applied to the inlet/outlet regions and rotational periodic surfaces for transitional meshing. Among the two-equation turbulence models, the k-ε model and the SST model are the most widely used. To more accurately simulate flow separation phenomena on the blade surface, the SST model was selected for the numerical simulations in this study [21]. As the SST model relies on the k-ω formulation in the near-wall region, a fine wall mesh is essential to ensure solution accuracy. In CFD engineering practice, a widely accepted guideline is to control the height of the first grid layer so that the dimensionless wall distance y+ is approximately 1, ensuring that the grid points reside within the viscous sublayer [22]. To satisfy this requirement, the height of the first grid layer adjacent to the wall was set to 1 × 10⁻⁶ m. Figure 4 illustrates the variation in total pressure ratio with the number of grid cells. When the total number of grid cells increases from 5.56 million to 6.30 million, the change in isentropic efficiency is less than 0.001. Therefore, the mesh with 5.56 million cells was selected.
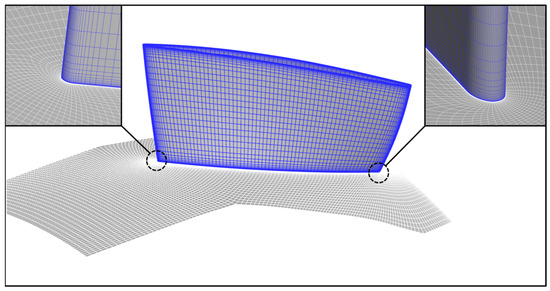
Figure 3.
Stage 1 stator mesh.
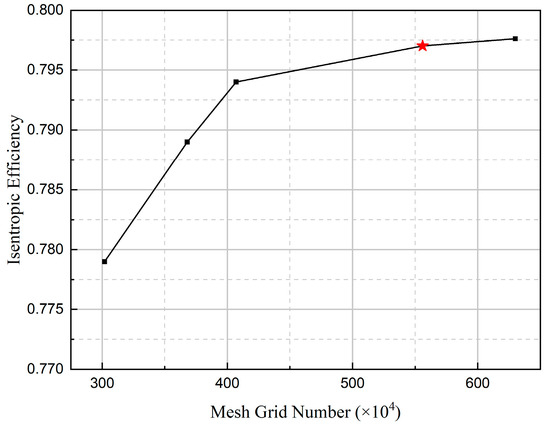
Figure 4.
Mesh grid independence verification.
The numerical simulation case configurations are detailed in Table 2. A total of three baseline operating conditions were established, encompassing nine simulation cases. For each baseline condition, three comparative simulations were conducted: a pure gas case, a case with a liquid mass flow rate equivalent to 5% of the gas flow rate, and a case with a liquid mass flow rate equivalent to 10% of the gas flow rate. Apart from the differing inlet total pressures among the three baseline groups, all other parameters remain consistent: the inlet total temperature is set to 300 K, and the inlet flow direction is axial. Water droplets with a diameter of 0.5 mm are introduced through 2000 uniformly distributed discrete points on the inlet annular plane, with initial velocities matching the local gas flow velocity.
Table 2.
Simulation case setup.
In ANSYS CFX, gas-liquid two-phase flow simulation primarily employs two approaches: the Euler-Euler (two-fluid) model and the Euler-Lagrange model, with their fundamental distinction lying in the description and tracking methodology of the liquid phase.
The Euler-Euler model treats the liquid as a continuous medium, solving the same set of governing equations for both the continuous and dispersed phases, offering the advantage of relatively low computational cost. However, this benefit also constrains its applicability, typically making it more suitable for monodisperse droplet distributions. When dealing with polydisperse droplet systems, the computational cost increases significantly, and its capability to simulate evaporation phenomena is limited. In contrast, the Euler-Lagrange model solves the continuous phase within an Eulerian framework, while the mass, momentum, and energy exchange between the dispersed and continuous phases are accounted for by introducing equivalent source terms into the occupied grids to achieve interphase coupling. This method effectively tracks complex droplet trajectories, captures dynamic changes in droplet size, and enables detailed simulation of interphase drag, mass transfer, and heat transfer processes.
This study focuses on droplet morphological evolution and evaporation effects, and therefore employs the Euler–Lagrange method as the numerical simulation framework. Within this framework, the governing equations for the continuous phase are solved in an Eulerian coordinate system, while the discrete phase is described using the Lagrangian particle tracking method. The specific model configuration is illustrated in Figure 5: the gas-phase drag is modeled using the Schiller–Naumann correlation to calculate the drag coefficient of spherical droplets; the heat transfer process is described by the Ranz–Marshall correlation, based on boundary layer theory, to characterize convective heat transfer between droplets and the gas flow; droplet breakup is simulated using the CAB (Cascade Atomization and Break-up) model to capture secondary breakup under high Weber numbers; droplet collision is handled by the Sommerfeld statistical model to predict rebound characteristics after impact with rough walls; and droplet–wall interactions are governed by an equation-dependent model, which automatically determines criteria for deposition or rebound based on impact conditions such as velocity and angle [23].
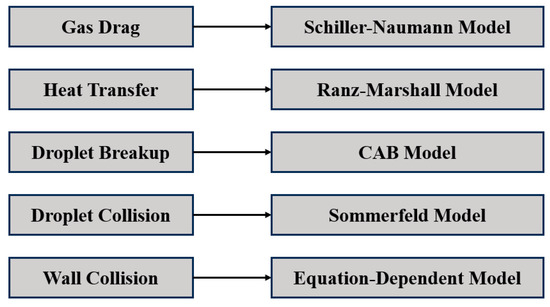
Figure 5.
Configuration of the two-phase flow momentum models.
This study employs a steady-state numerical approach based on the RANS (Reynolds-Averaged Navier–Stokes) equations. The interfaces between rotors and stators utilize the mixing plane model. Both circumferential sides of the rotor domain and stator domain are set as rotational periodic boundary condition. All walls are set as no slip and adiabatic walls. For methane in the wet compression simulations, the ideal gas assumption is applied. The computations were performed in parallel on a high-performance computing cluster node equipped with six Intel Xeon Gold 6140 processors (18 cores per CPU), for a total of 108 physical cores. The cost per simulation case was approximately 540 core-hours.
In this study, observing droplet trajectories, morphological changes, and evaluating evaporation effects are crucial; therefore, the Euler-Lagrange method was selected.
The efficiencies discussed in this paper are all wet compression efficiencies, defined as follows:
where represents the ideal compression work in wet compression, and denotes the actual compression work, and are defined by Equations (2) and (3), respectively [14]:
where is the compression work of air, is the compression work of water vapor; is the mass fraction of water vapor relative to air at the outlet; and are the rotating speed and the total torque of the compressor; is the total mass flow rate at the outlet; and are further defined by Equations (4) and (5) [16]:
In these expressions, is the specific heat at constant pressure; is the specific heat ratio, is the total temperature at the inlet; and are the total pressures at inlet and outlet, respectively.
3. Results and Discussion
According to the findings of Luo et al., after water injection, the stable operating range of a multistage compressor decreases with increasing water flow rate, while the overall efficiency within the operating range shows an upward trend [15]. Compared to multistage compressors, single-stage compressors exhibit reductions in both pressure ratio and efficiency under wet compression conditions [16,18]. As shown in Figure 6, at an inlet pressure of 1 MPa, higher water flow rates correspond to higher overall compressor efficiency, which validates the observations of Luo et al. [15] Under both 0.1 MPa and 8 MPa inlet pressure conditions, the overall efficiency in wet compression operation exceeds that of dry compression operation. However, the efficiency corresponding to the 10% water flow rate case is slightly lower than that of the 5% water flow rate case.
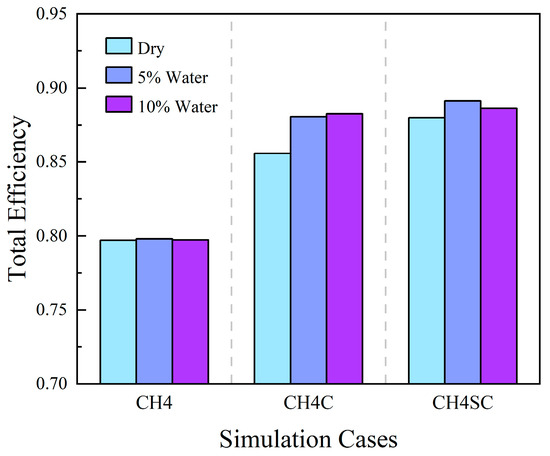
Figure 6.
Change in overall efficiency.
Figure 7 illustrates the variation in stage efficiency with liquid phase flow rate under different inlet pressures. At an inlet pressure of 0.1 MPa, the introduction of the liquid phase slightly improves the compression efficiency of the first four stages but significantly reduces the efficiency of the final stage. At 1 MPa inlet pressure, the liquid phase causes a decrease in efficiency for the first two stages, while the efficiency of the subsequent three stages shows some improvement. At 8 MPa inlet pressure, the liquid phase leads to a reduction in first-stage efficiency, followed by an increase in efficiency across the remaining four stages.
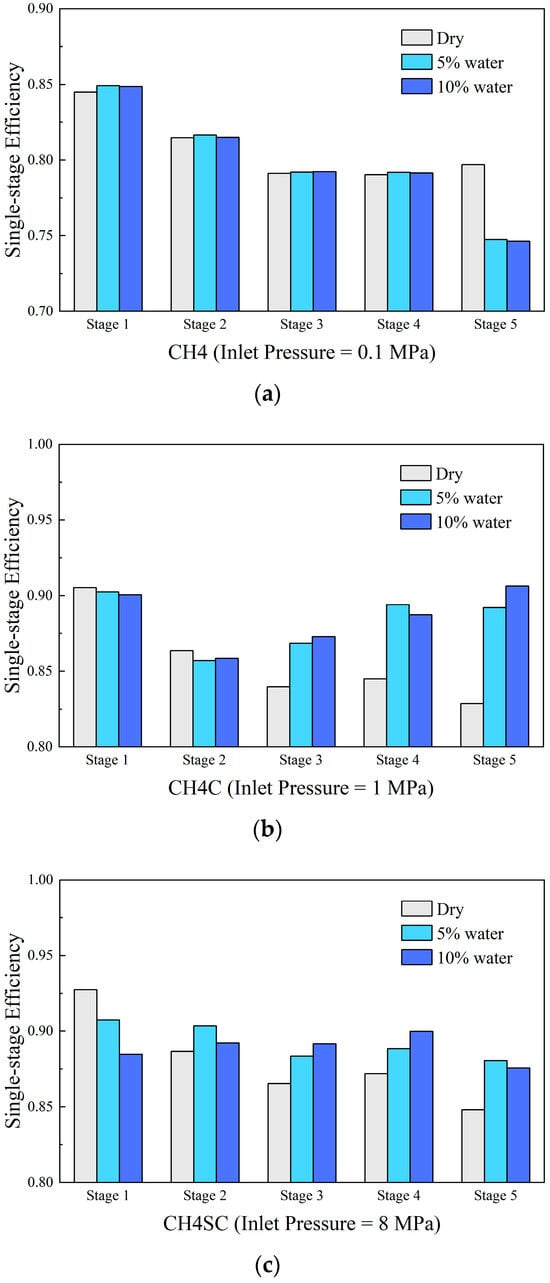
Figure 7.
Change in stage-wise efficiencies. (a) Case CH4; (b) Case CH4C; (c) Case CH4SC.
In summary, under low inlet pressure conditions (0.1 MPa), the introduction of the liquid phase has a relatively minor impact on overall compressor efficiency. This is characterized by a slight improvement in the efficiency of the initial stages and a significant decline in the fifth-stage efficiency. In contrast, at higher inlet pressures (1 MPa and 8 MPa), the liquid phase has a more pronounced effect on overall efficiency. The stage efficiency along the flow direction exhibits a trend of “decrease in the front stages followed by an increase in the rear stages.” Notably, the efficiency deterioration trend in the front stages is consistent with the performance of single-stage compressors under wet compression conditions. The distinct differences in the evolution trends of overall and stage-wise efficiency induced by variations in liquid mass flow rate under different inlet pressure conditions necessitate a more in-depth analysis of the droplet motion characteristics and flow field distribution within the compressor. Such analysis is essential to elucidate the underlying interstage influence and coupling mechanisms.
3.1. Analysis of Droplet Morphological Evolution
3.1.1. Analysis of Droplet Breakup
The simulation results for wet-gas conditions at an inlet pressure of 1 MPa indicate a decline in the efficiency of the compressor’s first stage. As droplets initially interact with the first-stage cascade within the flow passage, a detailed investigation into the droplet motion behavior within this stage was conducted. Figure 8 illustrates the droplet trajectories in the first-stage cascade passage under a liquid mass fraction of 5%. The analysis reveals that droplets primarily collide with and adhere to the pressure surfaces of both rotor and stator blades. A small fraction of droplets impacts the leading edge of the suction surface, resulting in the formation of a hydrophobic zone near the blade trailing edge. Here, the gas-liquid interfacial region may influence the structure of the mainstream gas flow through momentum exchange and interphase interactions.
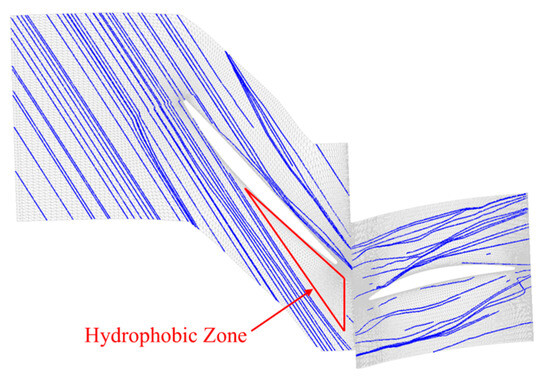
Figure 8.
Droplet streamlines at 5% water (Stage 1, Case CH4C).
Figure 9 shows the droplet diameter distribution within the first-stage blade passage. Observations indicate that droplets impacting the leading edge of the rotor suction surface undergo partial breakup and are then transported downstream with the main flow. Conversely, droplets impacting the rotor pressure surface coalesce into liquid films. These films migrate along the blade surface, then detach at the trailing edge of the pressure surface, and finally break up into secondary droplets. After passing through the second-stage rotor, the droplet diameter is primarily reduced to below 100 μm, significantly improving their flow-following capability. Notably, a portion of the droplets undergoes diameter change even before contacting the first-stage rotor blades. This phenomenon stems from the velocity lag due to the density difference between the droplets and air, resulting in aerodynamic shear forces. When these forces exceed the droplet’s surface tension, droplet breakup and morphological transformation occur.
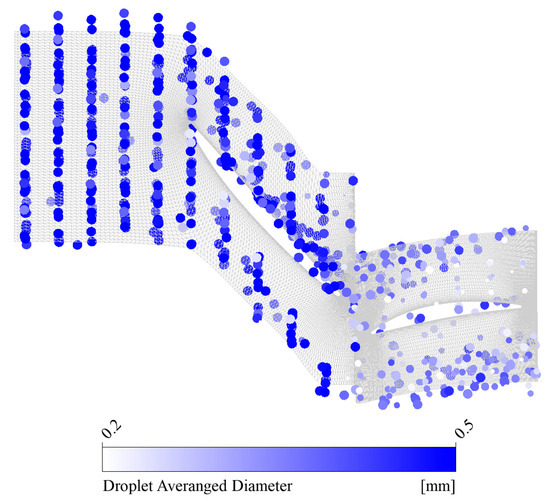
Figure 9.
Droplet diameter distribution at 5% water (Stage 1, Case CH4C).
Figure 10 shows the variation curve of the average droplet diameter at the outlet of each stage under different inlet pressures at a 5% water flow rate. Under the same water flow rate, the average droplet diameter at the outlet of each stage decreases as the inlet pressure increases. According to Formula (6), after the inlet pressure increases, the droplet Weber number increases with the gas density, making droplets more prone to breakup. At the fifth-stage blade outlet, the average droplet diameter for the 1 MPa case is 2.81% of that for the 0.1 Mpa case, and the average droplet diameter for the 8 Mpa case is 0.59% of that for the 0.1 Mpa case.
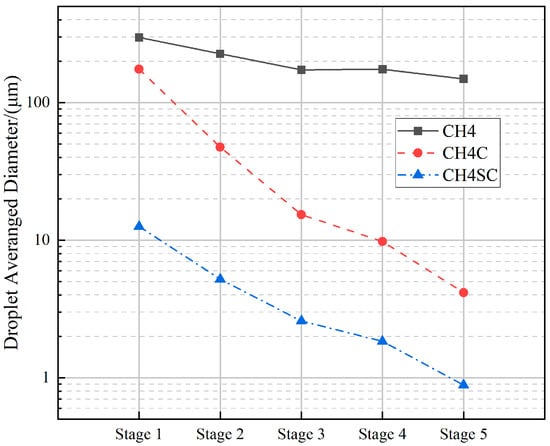
Figure 10.
Average droplet diameter at each stage outlet (5% Water).
3.1.2. Analysis of Droplet Evaporation
Figure 11 presents the water vapor mass fraction at the outlet and its relative total temperature difference compared to the dry compression case under different liquid mass fraction conditions. Experimental data indicate that the outlet water vapor mass fraction is below 0.1% for all conditions, demonstrating that evaporation is indeed very weak in this low-pressure-ratio compressor with low inlet temperature and large droplet diameter. A comparison of the parameters between the CH4 and CH4C cases reveals that the water vapor mass fraction under higher inlet pressure conditions increases significantly, suggesting that raising the inlet pressure helps promote droplet evaporation. Combined with the previous analysis, the high-pressure environment intensifies droplet breakup, substantially increasing the specific surface area of the droplets, thereby effectively enhancing the evaporation rate. Notably, when the inlet pressure increases from 0.1 Mpa to 1 Mpa, the outlet water vapor mass fraction for the 10% water case increases by a factor of 10, while the outlet relative temperature difference increases by a factor of 50. The variation in the outlet relative temperature difference is considerably greater than that of the water vapor mass fraction. This phenomenon indicates that, within the low-pressure-ratio compressor, the cooling effect resulting from convective heat transfer between the droplets and the gas is an important and non-negligible factor.
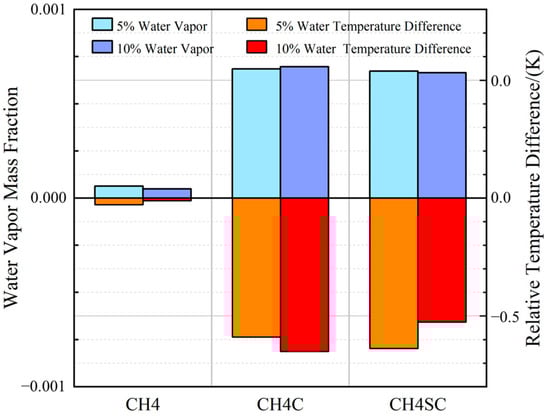
Figure 11.
Water vapor mass fraction versus relative temperature difference at outlet.
3.2. Analysis of Flow and Loss Characteristics
3.2.1. Analysis of Flow Field in the First Stage
Based on the above analysis, droplets contacting the leading edge of the moving blade suction surface break up and detach from the blade surface, transporting downstream and forming a local water-deficient zone behind the suction surface leading edge. Figure 12 shows the Mach number distribution in the first-stage rotor blade passage. In the CH4SC case, an elongated low-speed zones exist near the wall on the rotor suction surface at 50% and 95% span locations. Their spatial distribution highly coincides with the aforementioned droplet trajectories, attributable to the momentum dissipation effect on the surrounding gas caused by the low-speed droplets formed after impact and breakup on the suction surface. Correspondingly, droplets impacting the rotor pressure surface aggregate and form liquid films, increasing the equivalent wall roughness and promoting earlier flow separation in the pressure surface boundary layer. At the 95% span location, a larger low-speed zone formed by the interaction between the liquid film and the near-wall flow on the pressure surface can be observed. This phenomenon is not obvious in the other two cases, primarily because the absolute droplet flow rate increases significantly with inlet pressure.
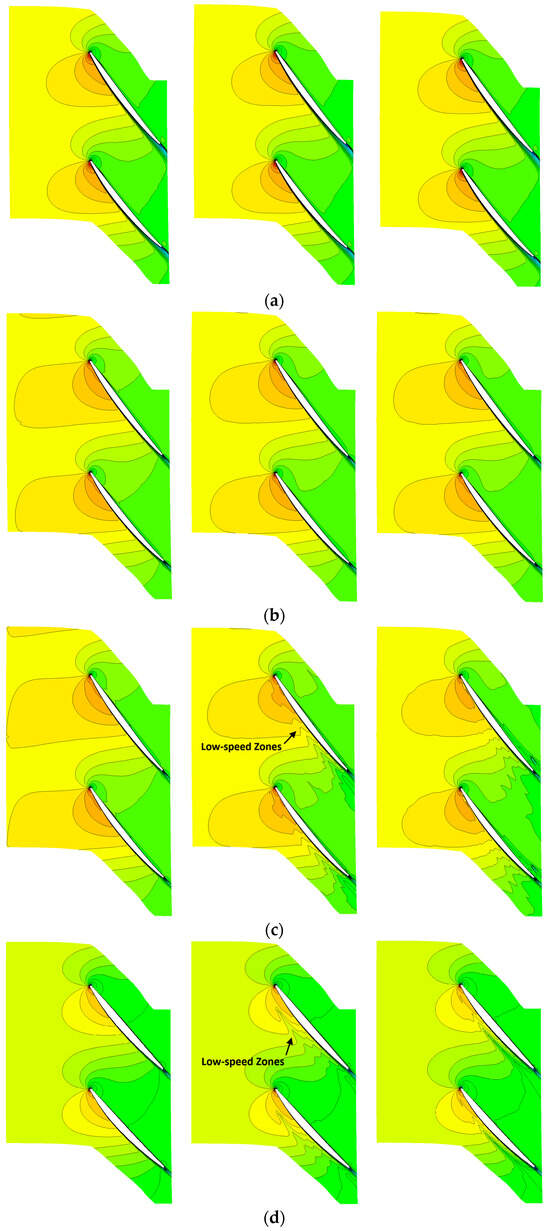
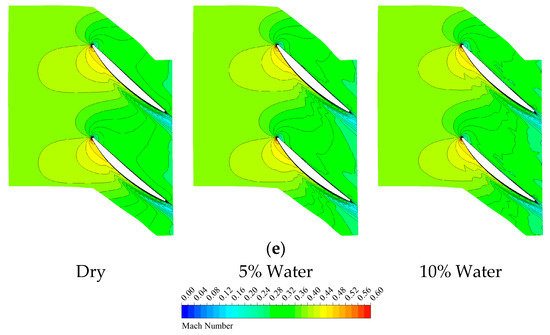
Figure 12.
Mach number contours at different spanwise locations (Rotor 1). (a) 95% Span (Case CH4); (b) 95% Span (Case CH4C); (c) 95% Span (Case CH4SC); (d) 50% Span (Case CH4SC); (e) 5% Span (Case CH4SC).
In summary, the following patterns can be derived: when the inlet pressure remains constant, as the liquid mass fraction increases, the extent of the low-speed zone within the blade passage continuously expands; when the liquid mass fraction remains constant, as the inlet pressure increases, the influence of droplets on the first-stage flow field significantly enhances. This is because the increased gas density leads to a higher droplet Weber number, making them more prone to secondary breakup, thereby altering the flow field velocity distribution through enhanced gas-liquid two-phase momentum exchange.
Figure 13 presents the variation in the inlet axial velocity and total pressure ratio of the first-stage blades. As the liquid mass fraction and inlet pressure increase, the flow losses induced by water droplets within the cascade intensify, leading to a degradation of the blade row’s pressure rise capability and a corresponding reduction in the inlet axial velocity. The maximum attenuation of the pressure rise capability reaches 5.51%. Under these conditions, the inlet airflow angle at the first stage increases, making the flow on the suction surface more prone to separation and shifting the compressor operating condition closer to the surge boundary. This variation trend aligns with that observed in single-stage compressors under wet compression conditions, further confirming the similarity in flow characteristics between the front stages of a multistage compressor and a single-stage compressor.
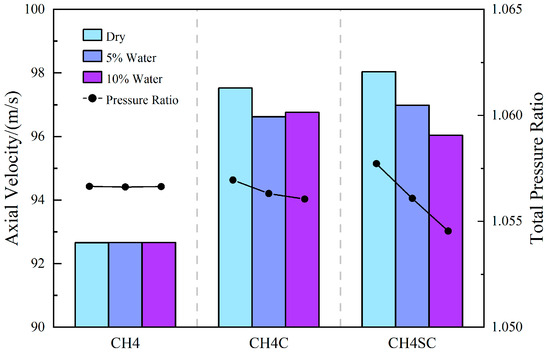
Figure 13.
Inlet axial velocity and total pressure ratio at different water ingestion rates (Stage 1).
3.2.2. Analysis of Flow Field in the Last Stage
Figure 14 presents the limiting streamline distributions on the suction surface of the fifth-stage stator under different operating conditions. At an inlet pressure of 0.1 Mpa, a distinct separation bubble is observed in the leading edge region of the suction surface. The separated flow reattaches at 10% axial chord length and subsequently develops into large-scale separated flow starting from 20% axial chord length. Combined with the Mach number contour distribution of the CH4 case in Figure 15, it can be observed that as the water ingestion rate increases, the degree of flow separation intensifies continuously, with the primary separation zone exhibiting a transition from the mid-span region toward the blade tip and root. When the inlet pressure increases to 1 Mpa, the leading edge separation bubble disappears, indicating that under higher inlet pressure conditions, the inlet flow angle of the final stage decreases, significantly enhancing the flow stability on the suction surface and effectively suppressing flow separation. Under these conditions, the onset of large-scale separation shifts downstream to 25% axial chord length, and the separation zone extent is markedly reduced compared to the 0.1 Mpa case. With increasing liquid mass fraction, the large-scale separation originating from the blade root region gradually expands, and the affected area at the trailing edge extends from 40% to 50% span height. Under the 8 Mpa inlet pressure condition, the overall flow structure is generally similar to that of the 1 Mpa case. As the liquid mass fraction increases, the separation zone demonstrates a non-monotonic variation trend, initially contracting and subsequently expanding.
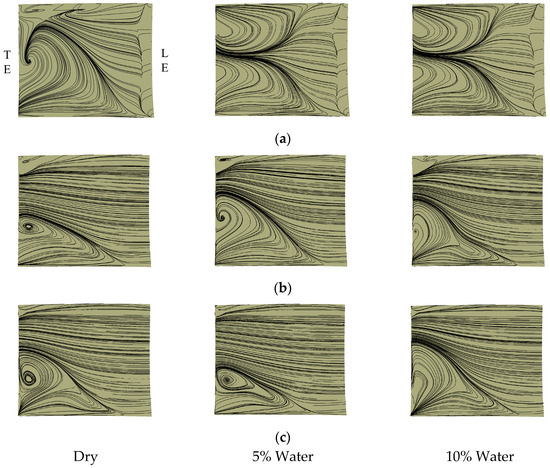
Figure 14.
Limiting streamlines on the suction surface (Stator 5). (a) Case CH4; (b) Case CH4C; (c) Case CH4SC.
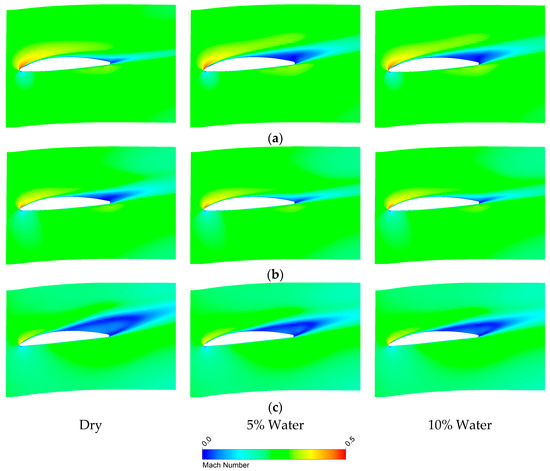
Figure 15.
Mach number contours at different spanwise locations (Stator 5). (a) 75% Span (Case CH4); (b) 50% Span (Case CH4); (c) 25% Span (Case CH4).
Figure 16, Figure 17 and Figure 18 present the entropy generation rate distributions in the trailing edge region of the fifth-stage stator under different operating conditions. The distribution characteristics show strong agreement with the previously discussed flow field analysis. At an inlet pressure of 0.1 MPa, the average droplet diameter within the flow passage remains large (>100 μm), making the cooling effect from droplet evaporation and heat transfer negligible. In this case, droplets only negatively impact compressor performance through aerodynamic breakup. The entropy generation rate contours reveal that flow losses under this condition increase monotonically with rising water ingestion rates.
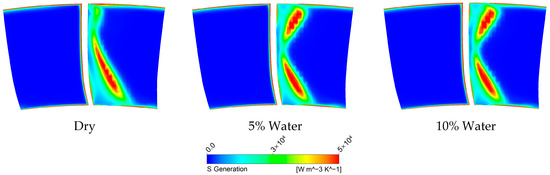
Figure 16.
Entropy generation rate at TE (Stator 5, Case CH4).
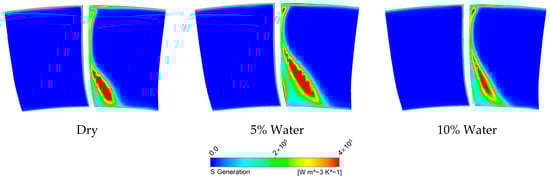
Figure 17.
Entropy generation rate at TE (Stator 5, Case CH4C).
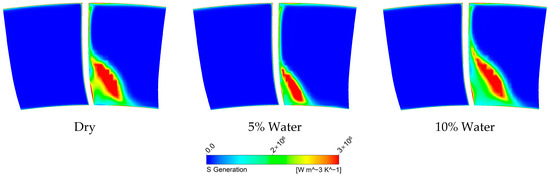
Figure 18.
Entropy generation rate at TE (Stator 5, Case CH4SC).
In contrast, at the rear-stage outlet regions of the CH4C and CH4SC cases, the average droplet diameter reduces significantly (<10 μm), resulting in a larger specific surface area that enables continuous accumulation of evaporative cooling effects in the rear-stage flow. The decrease in gas temperature reduces the required shaft work for compression at the same pressure ratio, subsequently diminishing the airflow turning angle and making the flow direction more axial. When the thermodynamic benefits from droplet cooling surpass the flow losses induced by aerodynamic breakup, the rear-stage flow losses become effectively suppressed. In the CH4C case, as the liquid mass fraction increases, the internal cascade losses exhibit a non-monotonic trend of initial increase followed by decrease. Meanwhile, in the CH4SC case, the losses demonstrate an evolutionary pattern of initial decrease followed by increase. This indicates that for different inlet pressure conditions, there exists an optimal liquid mass fraction that maximizes compressor performance.
3.2.3. Analysis of Interstage Aerodynamic Coupling Effects
Figure 19 illustrates the inlet airflow angles of stator at the front and rear stages with water ingestion rate under the CH4 condition. In this case, the cooling effect due to droplet heat transfer and evaporation is negligible, while the flow losses induced by droplet aerodynamic breakup lead to a degradation of the compressor’s pressure rise capability and a corresponding reduction in the inlet axial velocity. All inlet airflow angles exhibit a trend of deviation from the axial direction. Under the influence of the compressor’s stage-by-stage amplification characteristic, the inlet attack angle continuously increases along the flow direction, ultimately resulting in an expansion of the flow loss region on the suction surface of the fifth-stage stator.
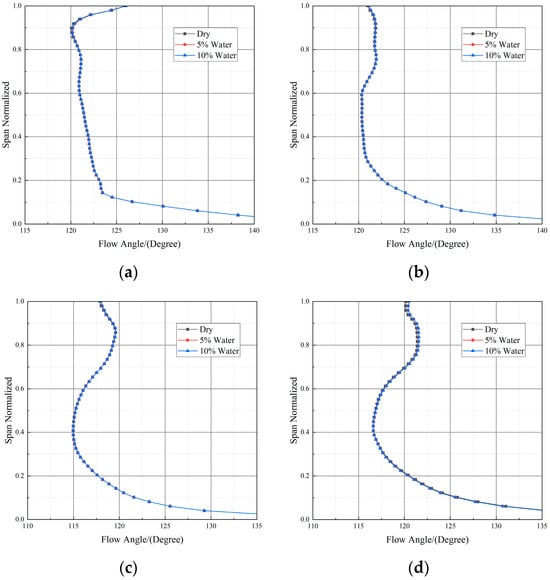
Figure 19.
Inlet airflow angle of stator at different water ingestion rates (Case CH4). (a) Stage 1; (b) Stage 2; (c) Stage 4; (d) Stage 5.
Typically, the expansion of the separation zone in the rear stages reduces the compressor’s flow capacity, which further decreases the inlet axial velocity and increases the inlet attack angle. In extreme cases, this can trigger a global surge of the system. In this study, due to the relatively low overall pressure ratio of the compressor, the expansion of the rear-stage separation zone under wet compression conditions is limited, and thus its impact on the aerodynamic characteristics of the front stages remains relatively weak.
Figure 20 illustrates the variation patterns of the inlet airflow angles at the front and rear stages of the compressor with water ingestion rate under the CH4C condition. In this operating condition, the airflow angle at the front stages shows a gradual deviation from the axial direction as the water ingestion rate increases. In the rear stage region, within the span range from the blade root to 30% blade height, the airflow angle becomes more aligned with the axial direction with increasing water ingestion rate, while from 60% blade height to the blade tip region, the airflow angle deviates from the axial direction as the water ingestion rate increases.
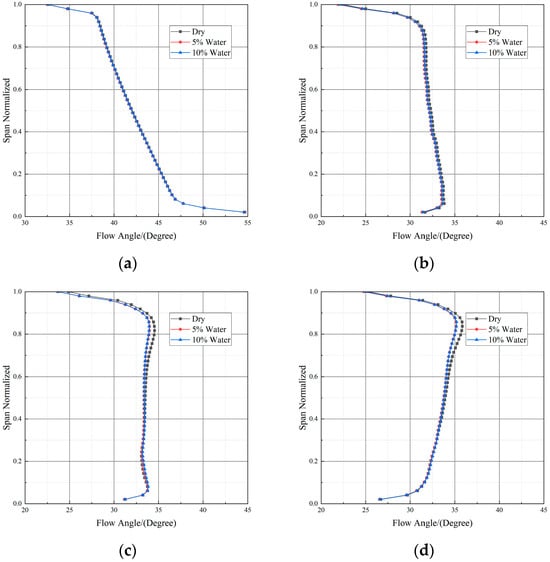
Figure 20.
Inlet airflow angle of stator at different water ingestion rates (Case CH4C). (a) Stage 1; (b) Stage 2; (c) Stage 4; (d) Stage 5.
During the compression process in a multistage compressor, droplet heat transfer and evaporation exhibit progressive development characteristics. In the rear stages, the cumulative cooling effect is significantly enhanced, and the lower inlet temperature effectively improves the pressure rise capability of each compressor stage. Under maintained pressure ratio conditions, the airflow turning angle is correspondingly reduced, which helps suppress the tendency of the airflow to deviate from the axial direction. Furthermore, the higher airflow density in the rear stages enhances the flow capacity of the compressor, contributing to the reduction in the attack angle at the front stages. This shifts the compressor operating point away from the surge boundary and improves overall operational stability.
Figure 21 illustrates the variation in inlet flow angles at the front and rear stages of the compressor under the CH4SC condition with different water ingestion rates. The results indicate that all inlet flow angles exhibit a trend of deviation from the axial direction as the water ingestion rate increases. Under this operating condition, the high inlet pressure of 8 MPa induces intense droplet breakup within the flow passage. However, in a low-pressure ratio compressor, the limited heat transfer and evaporation capacity of the droplets are insufficient to compensate for the flow losses generated by aerodynamic breakup, ultimately manifesting as a general deviation of the flow angles from the axial direction in the flow field. Although the enhanced aerodynamic breakup under 8 Mpa inlet pressure increases the specific surface area of the droplets, thereby promoting heat transfer and evaporation processes, the intensification of the breakup process also leads to more significant flow losses. This study demonstrates that for a low-pressure-ratio compressor under a high inlet pressure of 8 Mpa, the negative effects, such as increased flow losses induced by intensified aerodynamic droplet breakup, generally outweigh the potential positive benefits, such as enhanced evaporative cooling resulting from the increased specific surface area.
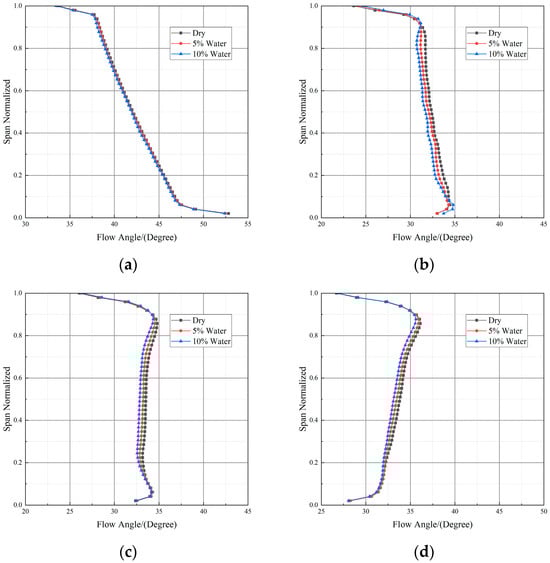
Figure 21.
Inlet airflow angle of stator at different water ingestion rates (Case CH4SC). (a) Stage 1; (b) Stage 2; (c) Stage 4; (d) Stage 5.
Based on the above analysis, droplet residence time within a single-stage compressor is short, and droplet size is relatively large, rendering the cooling effect from heat transfer and evaporation negligible. Consequently, droplets introduce only negative effects, ultimately leading to a reduction in efficiency. In contrast, for multistage compressors, droplet residence time is longer. Droplet size progressively decreases along the flow direction, while gas temperature increases stage by stage. This progressive evolution creates favorable conditions for the accumulation of positive effects through heat transfer and evaporation between droplets and the gas, thereby offering the potential for overall efficiency improvement. Combined with the research of Luo et al., it can be inferred that under conditions of low liquid mass fraction (e.g., less than 5%), higher design pressure ratios and a greater number of stages in a compressor lead to more significant accumulation of the droplet evaporative cooling effect. When this positive effect outweighs the negative effects induced by droplet breakup and momentum dissipation, the overall compressor efficiency will exhibit an upward trend.
4. Conclusions
Through numerical simulation, this paper systematically investigates the gas-liquid two-phase flow characteristics and performance evolution of a multistage axial compressor under downhole conditions. The main conclusions are as follows:
(1) Under low inlet pressure (0.1 MPa), the introduction of the liquid phase has a minor impact on the overall efficiency but leads to a marked decrease in last-stage efficiency. In contrast, at higher inlet pressures (1 MPa, 8 MPa), it results in a more substantial improvement in overall efficiency, with the stage efficiency distribution shifting toward a descending–ascending profile from front to rear stages.
(2) An increase in inlet pressure significantly enhances the secondary breakup process of droplets by raising the Weber number, leading to a sharp reduction in the average droplet diameter. This process has a dual effect: on one hand, the increased specific surface area promotes evaporative cooling, yielding thermodynamic benefits; on the other hand, intensified momentum exchange results in greater aerodynamic losses. In the low-pressure ratio compressor examined in this study, the evaporation effect remains generally weak.
(3) At 0.1 MPa, the evaporative cooling effect of droplets is weak, and its influence primarily manifests as flow losses caused by momentum dissipation. At 1 MPa, droplet breakup is more sufficient, leading to increased flow losses due to momentum dissipation; however, the cumulative evaporative cooling effect in the rear stages partially mitigates the negative impact of droplet breakup. At 8 MPa, aerodynamic droplet breakup intensifies further, while evaporation remains limited by the low pressure ratio, causing the negative effects of droplet breakup to regain dominance.
(4) Flow disturbances induced by droplet breakup propagate along the flow direction and are amplified stage by stage. When flow deterioration in the front stages causes the inlet flow angle to deviate from the axial direction, it aggravates flow separation in the rear stages, forming a vicious cycle. Conversely, when the droplet cooling effect is significant, it reduces the incidence angle at the rear-stage inlets, enhances flow stability, and conversely affects the front stages by improving inlet conditions, thereby increasing overall stability.
(5) In single-stage compressors and the front stages of multistage compressors, droplet residence time is short and droplet size is relatively large, rendering their evaporative cooling effect negligible. Droplets primarily undergo intense aerodynamic breakup or experience violent collisions with blade surfaces, leading to significant flow losses and performance degradation. Consequently, both pressure ratio and efficiency exhibit a declining trend under these conditions.
(6) In the middle and rear stages of multistage compressors, droplet residence time is extended, droplet size progressively decreases along the flow path, and gas temperature increases stage by stage. Under low liquid loading conditions (e.g., liquid mass fraction <5%), higher design pressure ratios and a greater number of stages favor the accumulation of the droplet evaporative cooling effect. When this positive effect outweighs the negative effects induced by mechanisms such as droplet breakup, the overall compressor efficiency transitions to an upward trend.
In summary, during the operation of a downhole low-pressure-ratio multistage axial compressor, when rotational speed and pressure ratio remain constant (i.e., operating at a fixed working point), it is essential to systematically evaluate the influence of inlet pressure and water injection rate on droplet breakup intensity and evaporation extent, and to analyze the resulting interstage aerodynamic coupling effects. This approach allows for the optimization of operating parameters to maximize compressor performance benefits. Future research could further explore broader operating conditions, such as investigating the evolution of gas throughput capability, compression efficiency, and interstage matching characteristics under varying rotational speeds and pressure ratios.
Author Contributions
M.C.: Conceptualization, Methodology, Software, Data curation, Formal analysis, Writing—original draft, Writing—review and editing. W.P.: Supervision, Project administration, Funding acquisition, Writing—original draft. H.L.: Supervision, Methodology, Validation, Writing—original draft. S.S.: Methodology, Investigation. Y.W.: Methodology, Investigation. W.Z.: Project administration, Investigation. All authors have read and agreed to the published version of the manuscript.
Funding
This research was funded by SINOPEC project (NO. 35800000-22-ZC0613-0020).
Data Availability Statement
The raw data supporting the conclusions of this article will be made available by the authors on request.
Conflicts of Interest
Authors M.C., W.P. and H.L. was employed by the Sinopec Research Institute of Petroleum Engineering Co., Ltd. The remaining authors declare that the research was conducted in the absence of any commercial or financial relationships that could be construed as a potential conflict of interest.
Abbreviations
| CFD | Computational Fluid Dynamics |
| CAB | Cascade Atomization and Break-up |
| RANS | Reynolds-Averaged Navier–Stokes |
| LE | Leading Edge |
| TE | Trailing Edge |
References
- Fantoft, R. Subsea gas compression-challenges and solutions. In Proceedings of the Offshore Technology Conference, Houston, TX, USA, 2–5 May 2005. [Google Scholar]
- Brenne, L.; Bjørge, T.; Bakken, L.E.; Hundseid, O. Prospects for sub sea wet gas compression. In Proceedings of the Turbo Expo: Power for Land, Sea, and Air, Berlin, Germany, 9–13 June 2008. [Google Scholar]
- Awan, A.R.; Teigland, R.; Kleppe, J. A survey of North Sea enhanced-oil-recovery projects initiated during the years 1975 to 2005. SPE Reserv. Eval. Eng. 2008, 11, 497–512. [Google Scholar] [CrossRef]
- Ramberg, R.M.; Davies, S.R.; Rognoe, H.; Oekland, O. Steps to the subsea factory. In Proceedings of the Offshore Technology Conference Brasil, Rio de Janeiro, Brazil, 29–31 October 2013. [Google Scholar]
- Montoya, C.; AlAdawy, A.; Malkawi, A.; Lastra Melo, R. Gas well performance analysis with downhole gas compression. In Proceedings of the Abu Dhabi International Petroleum Exhibition and Conference, Abu Dhabi, United Arab Emirates, 12–15 November 2018. [Google Scholar]
- Murthy, S.N.B.; Reese, B.A.; Arcangeli, G.T.; Tsuchiya, T. Analysis of Water Ingestion Effects in Axial Flow Compressors; Technical Report No. AFAPL-TR-78-35; Air Force Aero Propulsion Laboratory: Dayton, OH, USA, 1978. [Google Scholar]
- Nikolaidis, T.; Pilidis, P.; Teixeira, J.A.; Pachidis, V. Water Film Formation on an Axial Flow Compressor Rotor Blade. In Proceedings of the Turbo Expo: Power for Land, Sea, and Air, Berlin, Germany, 9–13 June 2008. [Google Scholar]
- Eisfeld, T.; Joos, F. Experimental Investigation of Two-Phase Flow Phenomena in Transonic Compressor Cascades. In Proceedings of the Turbo Expo: Power for Land, Sea, and Air, Orlando, FL, USA, 8–12 June 2009. [Google Scholar]
- Mæland, D.; Bakken, L.E. Wet Gas Hydrocarbon Centrifugal Compressor–Performance Test Results and Evaluation. In Proceedings of the ASME International Mechanical Engineering Congress and Exposition, Online, 1–5 November 2021. [Google Scholar]
- Serena, A.; Hundseid, Ø.; Bakken, L.E. Experimental Characterization of Surge Cycles in a Centrifugal Compressor Under Wet Gas Operation. In Proceedings of the ASME Turbo Expo: Power for Land, Sea, and Air, Boston, MA, USA, 26–30 June 2023. [Google Scholar]
- Cataldi, G.; Güntner, H.; Matz, C.; McKay, T.; Hoffmann, J.R.; Nemet, A.; Lecheler, S.; Braun, J. Influence of High Fogging Systems on Gas Turbine Engine Operation and Performance. In Proceedings of the Turbo Expo: Power for Land, Sea, and Air, Vienna, Austria, 14–17 June 2004. [Google Scholar]
- Stanton, D.W.; Rutland, C.J. Multi-Dimensional Modeling of Thin Liquid Films and Spray-Wall Interactions Resulting from Impinging Sprays. Int. J. Heat Mass Transf. 1998, 41, 3037–3054. [Google Scholar] [CrossRef]
- Das, K.; Hamed, A.A.; Basu, D. Droplet Trajectories and Collection on Fan Rotor at Off-Design Conditions. In Proceedings of the Turbo Expo: Power for Land, Sea, and Air, Barcelona, Spain, 6–11 May 2006. [Google Scholar]
- Luo, M.; Hu, Q.; Wang, J.; Ooi, K.T.; Zheng, Q.; Yan, S. Numerical Study of the Flow and Characteristics in a Multistage Compressor Based on Different Spatial Distribution Forms of Rainwater. J. Aerosp. Eng. 2024, 37, 04023102. [Google Scholar] [CrossRef]
- Luo, S.; Li, S.; Song, X. Study on Rain Absorption Performance and Flow Field of Transonic Compressor under Different Working Conditions. Aerospace 2024, 11, 829. [Google Scholar] [CrossRef]
- Yang, L.; Zhang, H.; Lin, A. Effects of Water Ingestion on the Tip Clearance Flow in Compressor Rotors. J. Aerosp. Eng. Part G 2019, 233, 4235–4246. [Google Scholar] [CrossRef]
- Zhu, Z.; Wu, Y.; Ming, L.; Zhang, X.; Ouyang, H. Numerical Investigation on the Influence of Wet Compression Aerodynamic Performance of Multi-Stage Transonic Compressor. J. Turbomach. 2025, 147, 061011. [Google Scholar] [CrossRef]
- Zhang, J.; Xue, Z.; Jia, S.; Wang, K.; Zhang, Y. Influence of the Droplet Diameter on Compressor Rotor Performance under Constant Humidification. Heat Transf. Eng. 2024, 45, 1884–1902. [Google Scholar] [CrossRef]
- Zawadzki, N.; Szymański, A.; Igie, U. Effect of Water Injection on Turbofan Engine Compressor Operation and Aerodynamics. In Proceedings of the ASME Turbo Expo: Power for Land, Sea, and Air, London, UK, 24–28 June 2024. [Google Scholar]
- Nader, L.; Biddick, D.; Artinian, H.; Kulkarni, P.; Van Hoy, B.; Zdan, S. Liquid Removal to Improve Gas Production and Recoverable Reserves in Unconventional Liquid-Rich Reservoirs by Subsurface Wet Gas Compression. In Proceedings of the SPE Artificial Lift Conference and Exhibition–Americas, Virtual, 21 October 2020. [Google Scholar]
- Khan, A.; Irfan, M.; Niazi, U.M.; Shah, I.; Legutko, S.; Rahman, S.; Alwadie, A.S.; Jalalah, M.; Glowacz, A.; Khan, M.K.A. Centrifugal Compressor Stall Control by the Application of Engineered Surface Roughness on Diffuser Shroud Using Numerical Simulations. Materials 2021, 14, 2033. [Google Scholar] [CrossRef] [PubMed]
- Menter, F.R. Two-Equation Eddy-Viscosity Turbulence Models for Engineering Applications. AIAA J. 1994, 32, 1598–1605. [Google Scholar] [CrossRef]
- Ansys Inc. ANSYS CFX-Solver Modeling Guide; ANSYS, Inc.: Canonsburg, PA, USA, 2025; pp. 320–376. [Google Scholar]
Disclaimer/Publisher’s Note: The statements, opinions and data contained in all publications are solely those of the individual author(s) and contributor(s) and not of MDPI and/or the editor(s). MDPI and/or the editor(s) disclaim responsibility for any injury to people or property resulting from any ideas, methods, instructions or products referred to in the content. |
© 2026 by the authors. Licensee MDPI, Basel, Switzerland. This article is an open access article distributed under the terms and conditions of the Creative Commons Attribution (CC BY) license.