Abstract
The solidified natural gas (SNG) technology presents a prospective strategy for CH4 storage and transportation. Low gas storage capacity and slow formation rate remain the key challenges for its field applications. This study suggested a compound system of cyclopentane (CP) + graphite nanoparticle (GNP) nanofluid to enhance the formation kinetics of CH4 hydrate. Results indicated that both gas consumption and hydrate formation rate were higher at a higher CP concentration, peaking at 14 wt%, where t90 (the time to reach 90% of the final gas uptake) was 65.7 min, and the gas uptake reached 0.1346 mol/mol. However, an excessive CP (21 wt%) negatively affected CH4 hydrate generation kinetics due to the excessive cage occupancy of CP in 51264 cavities. A lower temperature was determined to be more favorable for CH4 hydrate formation within nanofluids, which was visually demonstrated by the denser hydrate crystals formed at 275.15 K. Moreover, storage stability analysis revealed that CH4 hydrate formed in CP + GNP nanofluids can be preserved at atmospheric pressure and 268.15 K without significant decomposition. This work provides a superior scheme for hydrate-based CH4 storage, offering great contributions to SNG technology advancement.
1. Introduction
Gas hydrates are ice-like crystalline compounds formed by water and gas molecules (such as CH4, CO2, etc.) under high-pressure and low-temperature conditions [1,2]. Gas hydrates are typically categorized into sI, sII, and sH, three types [3,4,5,6,7]. Hydrate formation is widely recognized as an effective method for natural gas storage and transportation, namely Solidified Natural Gas (SNG) technology [8,9,10]. Compared to traditional natural gas storage technologies like CNG and LNG, SNG shares the advantages of high capacity [11], mild conditions [12,13], and greater convenience in storage and transportation. However, harsh conditions associated with hydrate formation and its slow rate are the bottlenecks that must be overcome prior to field application of the SNG technology [14,15,16].
Using thermodynamic promoters is an effective means of modifying the hydrate phase equilibrium, facilitating hydrate crystallization under more moderate conditions, and hence lessening the expense associated with hydrate formation [17,18,19,20]. Tetrahydrofuran (THF) has been widely employed to moderate CH4 hydrate phase equilibrium and facilitate CH4 hydrate formation [21,22]. The equilibrium pressure of methane hydrate was found to drop from 6.9 MPa to around 0.5 MPa at 283.15 K with 5.56 mol% THF [23], which accelerates CH4 hydrate formation. Another environmentally friendly thermodynamic promoter, dioxane (DIOX), has been utilized to moderate formation conditions [24]. With 5.56 mol% DIOX, the equilibrium pressure of CH4 hydrate at 283.15 K decreases to 1.0 MPa, which is less pronounced than that with THF [25]. Recently, cyclopentane (CP) was found to outperform THF in reducing CH4 hydrate formation pressure [26]. It was reported that the equilibrium curve for methane hydrate in solutions containing CP exhibits a significant shift toward the thermodynamically favorable area, in contrast to that without CP. The equilibrium conditions for methane hydrate within a 5.6 mol% CP solution were determined as 0.62 MPa and 287.25 K [27]. As presented, CP shifts the phase equilibrium more significantly than DIOX and comparably to THF. Furthermore, the low water solubility and volatility of CP enable its easy separation and reuse. Therefore, CP is less toxic and more readily recoverable than THF and DIOX, aligning with the green chemistry principles. [28].
Nanofluids have been successfully utilized to enhance CH4 hydrate formation kinetics, accelerating the process and improving gas consumption efficiency [29,30,31,32]. The addition of nanoparticles enhances heat transfer during hydrate formation, while the dispersed nanoparticles provide numerous nucleation sites, thereby accelerating hydrate crystallization and improving formation kinetics [33,34,35]. Metal nanoparticles, including Fe3O4 [33], ZnO [34], and CuO [36], are commonly used to optimize the CH4 formation kinetics. It was found that SDS@Fe3O4 induced a faster hydrate nucleation and higher gas consumption than SDS alone [33]. In addition, the gas consumption of CH4 hydrate formation within a 500 ppm SDS + 0.3 wt% CuO nanofluid was 12.2% higher than that in a 500 ppm SDS solution [36]. However, the high cost and environmental pollution of metal nanoparticles limit their widespread application [37]. In contrast, graphite nanoparticles are considered biocompatible, cost-effective, and easily produced, with excellent thermal conductivity, which helps promote hydrate growth [38,39,40,41]. Research revealed that, in comparison with pure water, the use of GNP reduced the induction time by 80.8% and increased gas uptake by 12.8% [38]. One study indicated that adding GNP to THF solution increased gas storage by 36% and curtailed the tind compared to the THF solution alone. [40]. Moreover, comparison between GNP and metal nanoparticles has highlighted that, under identical temperature and pressure conditions, gas consumption achieved in the GNP nanofluid system was 8~30% higher than that in ZnO and CuO nanofluid systems [42].
As observed, the validity of CP in controlling hydrate formation conditions and GNP in enhancing hydrate formation kinetics has been established independently. However, the synergistic improvement of CP + GNP combination on hydrate formation has not been reported yet, and CH4 hydrate growth kinetics in CP + GNP nanofluids remain unexplored. This study examined the synergistic impact of GNP and CP on CH4 hydrate generation. Gas consumption and hydrate formation rates in GNP nanofluids were measured. Additionally, hydrate formation kinetics in CP + GNP nanofluids were investigated at various temperatures. Finally, the stability of CH4 hydrate storage in CP + GNP nanofluids under atmospheric pressure was assessed. This study is conducive to elucidating the synergistic effect of GNP and CP on CH4 hydrate formation and will offer deeper insights into the SNG technology advancement.
2. Experimental Section
2.1. Materials
CH4 gas (99.99 mol%) was offered by Chongqing Jiarun Gas Co., Ltd., Chongqing, China. Graphite nanoparticles (GNP, 99.95% purity) with an average size of 50 nm were purchased from Xuzhou New Material Technology Co., Ltd., Xuzhou, China [40], and the SEM images can be seen in our previous study [40]. It was shown that graphite nanoparticles exhibit uniform distribution and a plate-like structure, with one dimension measured less than 500 nanometers. Sodium dodecyl sulfate (SDS, 99% purity) and cyclopentane (CP, 96% purity) were supplied by Chengdu Chemical Co., Ltd., Chengdu, China. According to the zeta potential measurement and stability evaluation, GNP nanofluid exhibits good colloidal stability over 24 h [43,44], so they can exist stably within the experimental period. Distilled water (with 18.2 MΩ·cm resistivity) was applied for all experiments.
2.2. Apparatus
The formation and dissociation of CH4 hydrate were investigated using a microscopic experimental setup. This apparatus has been documented in the previous literature [45,46]. Briefly, a 100 cm3 transparent sapphire reactor is the core part of the setup, with the maximum working pressure of 10 MPa [47]. A stereomicroscope and a CCD camera were mounted in front of the water bath to photograph images of hydrate crystals [47].
2.3. Procedures
2.3.1. Preparation of GNP + CP Nanofluids
GNP + CP nanofluid was produced using a two-step method. The specific steps are as follows: (1) Prepare an SDS solution with the SDS concentration fixed at 500 ppm, which is an optimal concentration to form a stable nanofluid. This has been verified in our previous study [9]; (2) Measure the required amount of GNP and add it to the SDS solution; (3) Stir the mixed solution with a magnetic stirrer for 15 min; (4) Disperse the solution ultrasonically for 20 min to create the graphite nanofluid; (5) Add a specified amount of CP to the graphite nanofluid to form the combined GNP + CP nanofluid.
2.3.2. Kinetic Experiments for CH4 Hydrate Formation
Hydrate formation experiments were conducted as follows. The reactor was first rinsed with distilled water, followed by the injection of 100 mL of GNP+CP solution. Subsequently, three purges with CH4 were performed to eliminate air. Pressurizing the reactor to 6 MPa using CH4 as it was cooled to the set value. Launched the agitation and adjusted its speed to 300 rpm. Temperature and pressure data were recorded by data acquisition system every 10 s. Each experimental group was repeated three times under identical conditions to verify reproducibility. The first run was designated as the “fresh,” while the subsequent two runs were designated as “memory.”
The amount of CH4 consumed during hydrate formation is calculated using Equation (1).
where ΔnH represents the molar amount of gas molecules captured in hydrate at the end of the experiment, nw denotes the water amount used in the experiment, ng,0 and ng,t denote the methane gas amount in the reactor at time 0 and time t, respectively, P is the pressure, T and V are the temperature and volume of gas phase, R is ideal gas constant, and Z is the compressibility factor calculated utilizing Pitzer correlation in Equation (2).
Abbott’s equations are used for the calculation of B0 and B1 [48].
According to the study reported in the literature [49,50], under the experimental conditions (6 MPa, 275–279 K), the uncertainty in Z is estimated to be less than 2%, which represents a negligible error in the gas uptake calculation.
Gas storage capacity is the phase volume ratio of the gas-hydrate, as calculated by Equation (3).
where VGH is storage capacity, Vgas is the gas volume stored in the hydrate under standard conditions, VH is the hydrate volume, MW and ρW are the molar mass and density of water. ΔV is the difference between the molar volumes of the hydrate and the liquid phase, and was set to 4.6 cm3/mol [51]. N is hydrate number [42].
2.3.3. Morphology Experiments of CH4 Hydrate Formation
The solution used in the experiments was 0.5 wt% GNP + 14 wt% CP. After cleaning the reactor three times with pure water, 60 mL of the solution was introduced. The reactor was then purged 3 times by CH4 to remove residual air. After cooling the solution to the target temperature, the reactor was pressurized to 6 MPa using CH4. The magnetic stirrer began to stir the contents of the reactor at 300 rpm. The camera captured and recorded the morphology of the hydrate crystals every 5 s.
2.3.4. Experiments on CH4 Hydrate Storage
CH4 hydrate formation at 277.15 K, 6.0 MPa was described in Section 2.3.2. After hydrate generation, chill the reactor to a designated subzero temperature, which refers to that below 273.15 K, for 12 h. Subsequently, rapid depressurization to 0.1 MPa was performed. Finally, CH4 hydrate was stored at 0.1 MPa and the desired temperature for 48 h.
The gas recovery (R%) from hydrate dissociation is calculated by Equation (4).
where nformation is the amount of the gas consumption during hydrate generation, and ndissociation is the gas amount that is recovered after dissociation.
3. Results and Discussion
3.1. Effects of CP on CH4 Hydrate Formation in Graphite Nanofluids
The tind, t90, gas consumption, and gas storage capacity gained from the experiments are listed in Table 1. Figure 1 displays the effects of CP concentration on CH4 consumption in GNP + CP nanofluids. As seen in Figure 1a, during the initial 20 min, an increased CP concentration led to a faster reaction rate and greater gas consumption. This can be attributed to the fact that elevated CP concentrations lead to the formation of more CP hydrates within the GNP nanofluid, thereby facilitating the entry of CH4 into the pre-formed hydrate cage structures. At the same time, the increased amount of CP can aid in transferring more CH4 molecules into solution for subsequent incorporation with water. As the experiment progressed, gas consumption in the 0.5 wt% GNP + 14 wt% CP system surpassed the 0.5 wt% GNP + 21 wt% CP system after approximately 30 min, showing the enhanced formation kinetics. Finally, as depicted in Figure 1b, gas consumption in 0.5 wt% GNP + 14 wt% CP system was 4.2% higher than that of the 0.5 wt% GNP + 21 wt% CP system. This mainly resulted from the increased mass transfer impedance during hydrate generation in the 0.5 wt% GNP + 21 wt% CP system, resulting in a smaller cage occupancy of CH4 compared with that of the 0.5 wt% GNP + 14 wt% CP system.

Table 1.
Experiment conditions and results in different systems. All experiments were conducted at 277.15 K and 6 MPa.
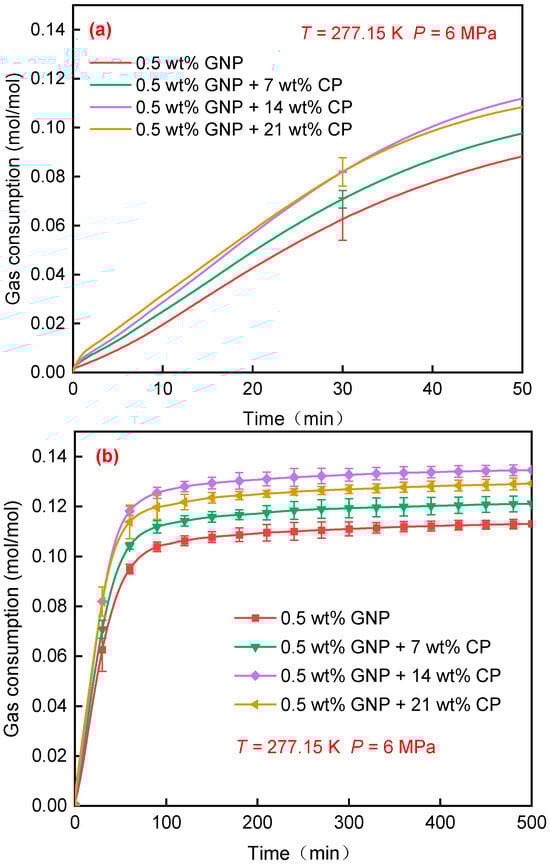
Figure 1.
Gas consumption of CH4 hydrate formed in GNP + CP nanofluids. The experiments were conducted at 277.15 K, 6 MPa, with CP concentration varying from 7 wt% to 21 wt%. (a) Gas consumption in the first 50 min; (b) gas consumption in 500 min.
Figure 2 shows temperature variations over CH4 hydrate generation at varied CP concentrations. As presented in Figure 2a, in the 0.5 wt% GNP nanofluid without CP, a temperature peak appeared at 20.8 min and it reached the maximum value of 278.63 K, indicated by black arrows. This suggests the substantial and continuous hydrate generation during this period [52]. When adding a certain amount of CP into the GNP nanofluid, as exhibited in Figure 2b–d, the temperature peak reached 278.79 K, 278.86 K, and 279.04 K, corresponding to 7 wt%, 14 wt%, and 21 wt% CP, respectively, higher than that in the 0.5 wt% GNP nanofluid without CP. This indicates greater hydrate formation with increased CP concentration. It is also found that a higher CP concentration resulted in a shorter time to reach the maximum temperature of the exothermic peak. For example, the time obtained at 0, 7 wt%, 14 wt%, and 21 wt% CP was 20.8 min, 13.0 min, 10.2 min, and 8.5 min, respectively, indicating that higher CP concentrations can facilitate faster hydrate formation during the initial phase.
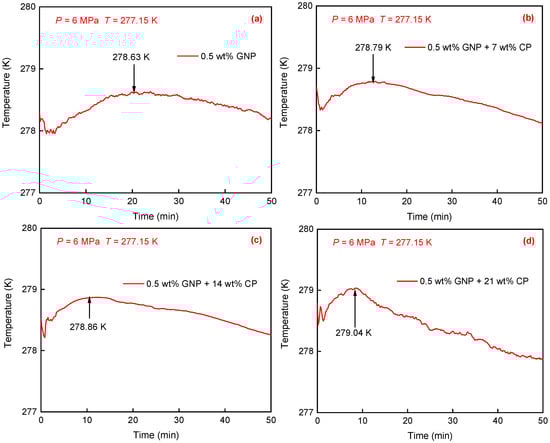
Figure 2.
Temperature profiles of CH4 hydrate formation in four solutions with varying CP concentrations. (a) 0.5 wt% GNP. (b) 0.5 wt% GNP + 7 wt% CP. (c) 0.5 wt% GNP + 14 wt% CP. (d) 0.5 wt% GNP + 21 wt% CP.
Figure 3 compares t90 at varied CP concentrations. Obviously, t90 decreased as the CP concentration increased from 0 to 21 wt%. t90 obtained at 7 wt% CP was 73.4 min, and it decreased to 65.7 min as the CP concentration increased to 14 wt%, indicating a reduction of 10.5%, also showing a decrease of 16.3% compared to that obtained in 0.5 wt% GNP nanofluid without CP. This is because a greater CP hydrate formed in a denser CP solution, providing a larger number of hydrate cages to trap CH4 molecules. Thus, the process of hydrate formation was shortened. However, t90 obtained at 21 wt% CP was 65.8 min, nearly identical to that observed at 14 wt% CP. This means that the promoting effect cannot be enhanced while the CP concentration exceeds 14 wt%.
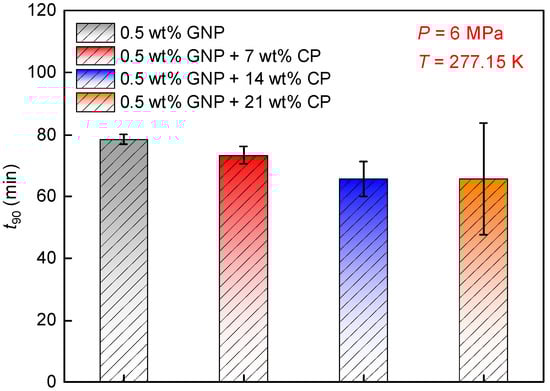
Figure 3.
Impacts of CP concentration on t90. Experiments were conducted at 277.15 K and 6.0 MPa.
Figure 4 compares the gas storage capacity obtained within GNP nanofluids containing varied CP concentration. As seen, at 7 wt% CP, gas storage capacity reached 120 V/V, which was 7% larger than that obtained in the absence of CP (112.1 V/V), indicating that gas storage capacity elevated in the presence of CP. Interestingly, the gas storage capacity at 14 wt% CP (133.5 V/V) was greater than that acquired at both 7 wt% and 21 wt% CP, demonstrating that 14 wt% was an optimum concentration to increase the gas storage capacity among all the tested CP concentrations. This phenomenon can be attributed to two mechanistic constraints. Firstly, increased CP concentration lowers the aqueous phase volume, reducing the quantity of water available for hydrate formation with CH4. Secondly, CP acts as a competing guest molecule for the large hydrate cages. At higher concentrations, CP occupancy of these cages increases, which in turn suppresses CH4 inclusion [53]. Although increasing the CP concentration enhanced hydrate nucleation and growth, the highest gas storage capacity was achieved at the medium concentration of CP (14 wt%). Based on this result, it is believed that when the GNP + CP system is applied to enhance CH4 hydrate formation, the CP concentration should be maintained at 14 wt%, which is conducive to obtaining a higher CH4 gas storage capacity.
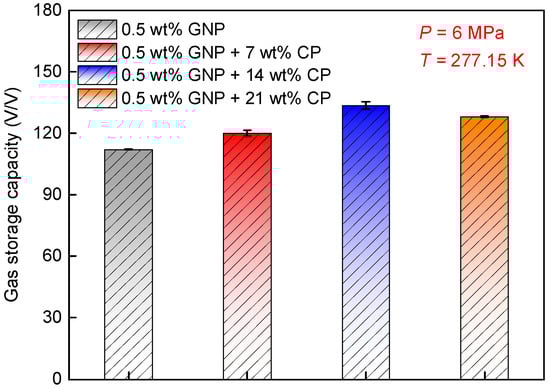
Figure 4.
Effects of CP concentration on gas storage capacity. The experiments were conducted at 277.15 K and 6.0 MPa.
3.2. Impacts of Temperature on CH4 Hydrate Formation in GNP + CP Nanofluids
0.5 wt% GNP + 14 wt% CP system demonstrated superior performance in boosting CH4 hydrate generation. However, the impact of temperature on CH4 hydrate generation remains unclear. Table 2 presents a comparison of hydrate formation at different temperatures (275.15 K, 277.15 K, and 279.15 K) in this mixed solution.
Table 2.
Experiment conditions and results in the 0.5 wt% GNP nanofluid added with 14 wt% CP at different temperatures.
Figure 5 illustrates the temperature profiles for CH4 hydrate generation in the 0.5 wt% GNP + 14 wt% CP mixed system. The gray curve represents the temperature profile for CH4 hydrate formation at 275.15 K, where a sharp peak is observed, suggesting the rapid hydrate generation event. This is primarily due to the increased driving force at a lower temperature, which accelerated hydrate nucleation and, as a result, led to a faster temperature rise. Meanwhile, the rapid hydrate growth allowed the reaction to complete within a short time, followed by a fast recovery of the temperature to the designed value. As the temperature rose to 277.15 K, the temperature peak (red line) was shorter compared to that at 275.15 K, along with an extended recovery period to the original temperature. This indicates that hydrate crystallization at 277.15 K proceeded more slowly, and the hydration reaction required more time to complete. At 279.15 K, the temperature curve (blue line) exhibited several minor temperature peaks, marked by black arrows, indicating continuous nucleation and multiple crystallization events of CH4 hydrate. On the other hand, hydrate formation at 279.15 K appeared to occur intermittently over approximately 100 min, indicating the slowest hydrate formation among the three temperatures. This is probably caused by the reduced driving force compared to 275.15 K and 277.15 K.
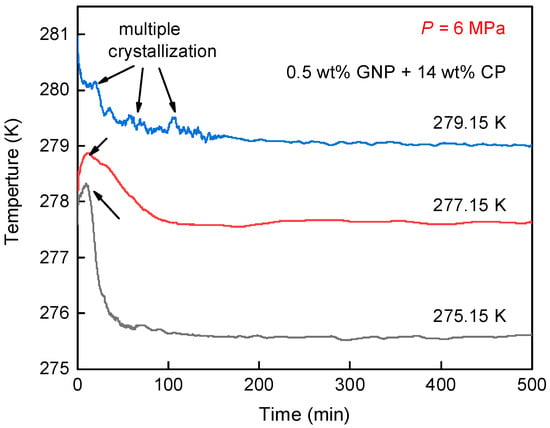
Figure 5.
Temperature profiles for CH4 hydrate formed in 0.5 wt% GNP + 14 wt% CP nanofluid at different temperatures (275.15 K, 277.15 K, 279.15 K).
Figure 6 displays the impacts of temperature on CH4 consumption in 0.5 wt% GNP + 14 wt% CP solution. As seen, gas consumption at 275.15 K (0.1366 mol/mol) was the highest, surpassing that at 279.15 K (0.0908 mol/mol) by 50.4%. Moreover, the rate of gas consumption at 275.15 K was the fastest, indicating that hydrate formed more rapidly at this temperature compared to 277.15 K and 279.15 K. This is because of the higher degree of subcooling at 275.15 K, strengthening the hydrate generation driving force, and thereby inducing a faster generation rate. It is noteworthy that the final gas uptake at 275.15 K and 277.15 K showed a negligible difference, suggesting that despite the stronger driving force at 275.15 K, the amount of gas hydrate did not increase significantly. In contrast, gas consumption at 279.15 K was reduced significantly compared to that at 275.15 K and 277.15 K, indicating that hydrate formation at 279.15 K was less pronounced than that at lower temperatures. This agrees well with the temperature profile presented in Figure 5.
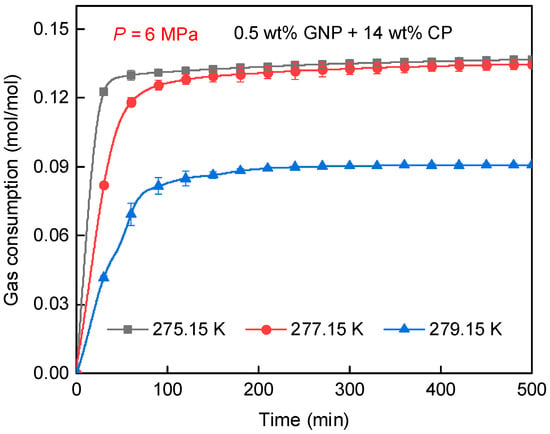
Figure 6.
Gas consumption of CH4 hydrate generation obtained at varied temperatures.
Figure 7 illustrates the impact of temperature on t90 for CH4 hydrate formation. As observed, t90 at 275.15 K was 27.7 min, significantly shorter than that at 279.15 K (87.8 min). This can be attributed to the faster dissolution and dispersion of CH4 molecules in the solution at lower temperatures, which also provides a greater driving force for hydrate generation [52]. Further, the longest t90 occurred at 279.15 K, accompanied by the lowest observed gas consumption (as shown in Figure 7), indicating that high temperatures were not favorable for hydrate formation within 0.5 wt% graphite nanofluid + 14 wt% CP system. Consequently, lowering the temperature was effective in enhancing hydrate formation kinetics.
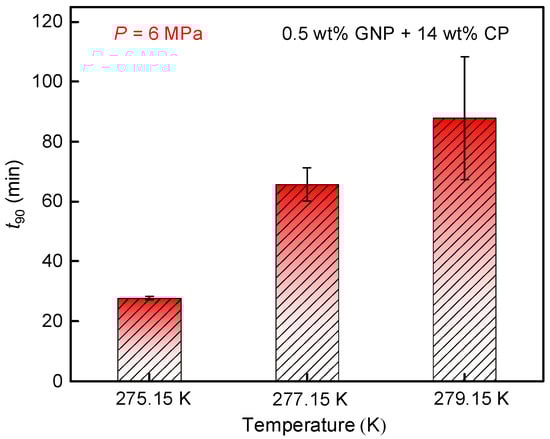
Figure 7.
Effects of temperature on gas consumption of CH4 hydrate formed in the 0.5 wt% GNP + 14 wt% CP system.
Figure 8 shows the impact of temperature on gas storage capacity for methane hydrate formation in a 0.5 wt% GNP + 14 wt% CP system. As the temperature decreased, the gas storage capacity at 277.15 K reached 133.5 V/V, showing a 48.3% increase compared to that at 90.0 V/V at 279.15 K. This suggests that lowering the temperature can increase the gas storage capacity, primarily resulting from the significant increase in driving force (subcooling) of hydrate formation. However, further cooling to 275.15 K resulted in only a marginal 1.3% rise in gas storage capacity compared to that at 277.15 K, implying that the way of lowering temperature has limited effectiveness in gas storage improvement. This means that hydrate formation at 277.15 K reached a threshold of water conversion to hydrate, and it is very hard to overcome the heat and mass transfer barriers by reducing the temperature, although the hydrate generation rate at 275.15 K was greater compared to that at 277.15 K.
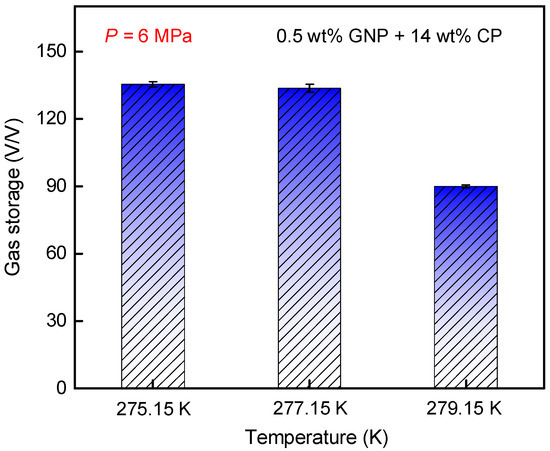
Figure 8.
Effects of temperature on gas storage capacity of CH4 hydrate formation in the 0.5 wt% GNP + 14 wt% CP system.
Figure 9 shows the morphological behavior during CH4 hydrate generation in a 0.5 wt% GNP + 14 wt% CP system under varied temperatures. Note that the kinetic behavior of CH4 hydrate formation can be elucidated by observing the hydrate growth morphology without using any image analysis metrics [27,46]. Although quantitative image analysis was not performed, the visual comparison clearly indicated that hydrate coverage became more extensive and the crystal density was higher at 275.15 K, consistent with the kinetic data, showing a faster growth and higher gas consumption. Figure 9a,f,k show the beginning of the experiments. It is clear to see that hydrate initially formed at gas/liquid interface because of the extensive contact area, as illustrated in Figure 9b,g,l. At 275.15 K, hydrate crystals appeared at 15 s, while they first appeared at 90 s as the temperature increased to 279.15 K. This means the lower the temperature, the shorter the hydrate induction time. Note that hydrate initially grew upward along the reactor wall, and a small amount of hydrate crystals grew downwards at the same time, as shown in Figure 9c,h,m. As the reaction progressed, the hydrate continued to grow both upward and downward. It was found that lower temperatures resulted in faster hydrate growth, as exhibited in Figure 9d,i,n. Finally, at 600 s, the hydrate nearly covered the reactor wall. However, the hydrate formed at 275.15 K was found to be denser, leaving no additional voids in the reactor. In contrast, the hydrate formed at 277.15 K and 279.15 K did not fully cover the reactor wall, as indicated in the yellow circles in Figure 9j,o. This indicates less hydrate generation at these two temperatures compared to that at 275.15 K. The analysis of the morphological behavior of hydrate generation at varied temperatures revealed that lower temperatures significantly enhanced crystallization kinetics and promoted hydrate growth. These morphological observations are consistent with the kinetic experimental results shown in Figure 6.
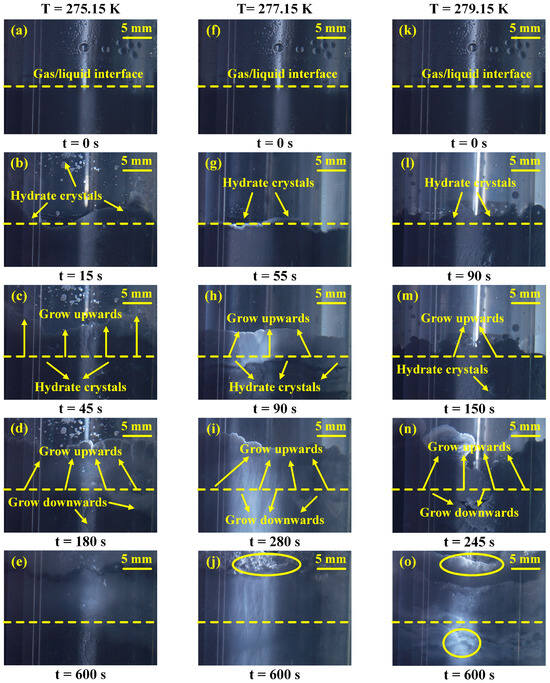
Figure 9.
Morphological images for CH4 hydrate formation at varied temperatures in the 0.5 wt% GNP + 14 wt% CP system. (a–e) CH4 hydrate formation under 275.15 K; (f–j) CH4 hydrate formation under 277.15 K; (k–o) CH4 hydrate formation under 279.15 K.
According to the revealed evolution patterns and kinetic mechanisms of hydrate formation, Figure 10 elucidates the mechanism of CH4 hydrate generation in the GNP + CP system. Figure 10a illustrates the initial state of the GNP + CP system, where the CP phase, being both buoyant and water-immiscible, floated on top of the aqueous nanofluid. Figure 10b depicts the onset of the reaction, where CH4 molecules diffuse through the CP phase and come into contact with water, leading to hydrate generation at the CP/nanofluid interface. CP molecules quickly occupied the 51264 cavities of the hydrates (the large cage consists of 12 pentagonal faces and 5 hexagonal faces, which is assembled from numerous water molecules with hydrogen bonds), while some CH4 molecules were confined within the 512 cavities. At this stage, sII hydrates were predominantly formed. Figure 10c illustrates the intermediate and later stages of hydrate formation. The initially formed sII hydrates caused a reduction in the CP phase, making it difficult to fully cover the CP-nanofluid interface. Subsequently, CH4 molecules were consumed to form sI hydrates with the remaining water until the reaction was complete. As a result, the sI and sII hydrates ultimately coexisted in the reactor.
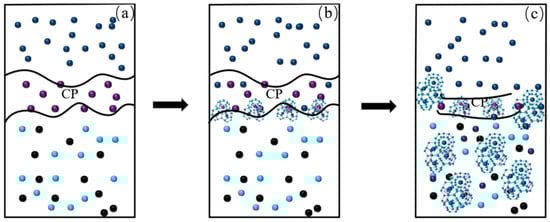
Figure 10.
CH4 hydrate formation mechanism in GNP + CP nanofluid. (a) CH4 dissolved into the solution; (b) Hydrate formation occurred at the gas-liquid interface; (c) Continuous hydrate growth within the GNP + CP nanofluid.
3.3. Gas Consumption Comparison in Different Systems
Table 3 compares the gas uptake and average rate for CH4 hydrate generation across different systems. As seen, the largest gas consumption (0.1346 mol/mol) and the fastest hydrate formation (2.1 mmol/min·mol) are obtained from the GNP + CP system among all the systems listed. This indicates that CH4 hydrate formation is significantly enhanced in the GNP + CP compound system. At 277.15 K and 6 MPa, the GNP + CP system exhibits a 19.0% increase in gas consumption and a 16.7% increase in formation rate compared to the CP solution. Likewise, CH4 hydrate formation within the THF, CP + THF, and DIOX systems is also inferior to that within the GNP + CP system. Note that a lower gas consumption and formation rate were obtained, although higher driving forces were reserved in the CP, THF, and CP + THF systems. This means a larger amount of energy was consumed in these systems, but the gas consumption was smaller. As presented, GNP is effective in enhancing CH4 hydrate formation kinetics, and its combination with CP will become a superior strategy for the high-efficiency CH4 solidified storage and transportation.
Table 3.
Gas uptake of CH4 hydrate formation in varied systems.
3.4. Stability of CH4 Hydrate Storage at Atmospheric Pressure
To examine the effectiveness of CP + GNP nanofluids for solidified natural gas storage and transportation, the storage stability of CH4 hydrate formed within the CP + GNP nanofluid under atmospheric pressure was investigated.
Figure 11 compares the CH4 gas evolution at 271.15 K, 268.15 K, and 265.15 K under 0.1 MPa. As shown, CH4 hydrate experienced a significant dissociation during the initial 4 h, where gas evolutions across all storage runs were <16%. Thereafter, the gas evolution curve gradually flattened, indicating a small degree of CH4 hydrate dissociation. After 48 h, the final gas evolution, ranked from highest to lowest, was 271.15 K (31.2%) > 265.15 K (21.7%) > 268.15 K (10.4%), as summarized in Table 4. Note that CH4 hydrate decomposed slightly during storage, suggesting that CH4 hydrate formed within the GNP + CP nanofluid can be effectively preserved at atmospheric pressure under the experimental conditions. This can be induced by the self-preservation effect [55], which prevents rapid hydrate decomposition. At temperatures < 273.15 K, water molecules that were not incorporated into the hydrate and produced from hydrate dissociation quickly formed an ice shell on the methane hydrate surface [56]. The ice layer acts as a physical obstacle, isolating the inner hydrate from the external environment. Consequently, thermal exchange between the surroundings and CH4 hydrate was restricted, so the hydrate dissociation was hampered.
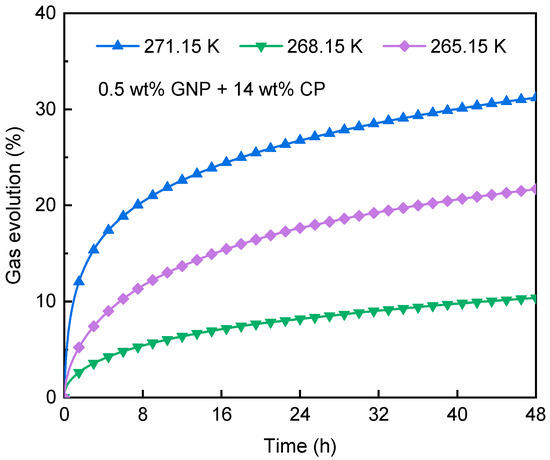
Figure 11.
Impacts of storage temperature on gas evolution of CH4 hydrate.
Table 4.
Stability of CH4 hydrate stored at 0.1 MPa and different temperatures.
Note that the optimal temperature for CH4 hydrate storage at 0.1 MPa in the CP + GNP nanofluids was determined to be 268.15 K, as shown in Table 4. This is probably because excessive ice crystals formed at 265.15 K, which compressed and disrupted the CH4 hydrate lattice, thus weakening the self-preservation effect and triggering hydrate decomposition [57,58]. This observation also complies with the findings obtained in the literature [59], in which CH4 hydrate decomposed more fiercely at 266 K than at 269 K. On the contrary, at 271.15 K, the increased thermal motion of CH4 and water molecules weakened the hydrogen bonds, making the hydrate lattice more prone to collapse and thus facilitating the release of CH4 molecules trapped in the hydrates.
3.5. Perspectives for Scale-Up
This study demonstrates the promising kinetics and stability of the CP + GNP nanofluid system at the laboratory scale. To advance this technology toward practical application, key challenges must be addressed: (1) ensuring uniform nanoparticle dispersion in large-scale or continuous reactors for consistent performance; (2) developing efficient cyclopentane recovery and recycling processes to reduce cost and environmental impact; and (3) evaluating the long-term stability, safety, and lifecycle of graphite nanoparticles in industrial settings. Successfully overcoming these hurdles is essential for scaling the CP + GNP system into a commercially viable SNG storage technology.
4. Conclusions
This study investigates the synergistic impact of graphite nanofluids and cyclopentane on methane hydrate generation. It was found that adding CP into the GNP nanofluid can significantly enhance hydrate generation. At a combination of 0.5 wt% GNP + 14 wt% CP, the highest gas uptake of 0.1346 mol/mol and storage capacity of 133.5 V/V were achieved. However, an overconcentrated CP concentration of 21 wt% is detrimental to CH4 hydrate formation because of the excessive cage occupation of CP. Decreasing temperature can promote CH4 hydrate generation in the CP + GNP nanofluid, with a marginal increase in gas storage capacity between 277.15 K and 275.15 K, suggesting a practical operational threshold. Morphological analysis confirmed that hydrate formation was faster and denser at lower temperatures, which is consistent with the kinetic data. Additionally, the CP + GNP system exhibited excellent storage stability under atmospheric pressure, presenting minimal hydrate disruption at 268.15 K over 48 h, leveraging the self-preservation effect. The findings suggest that the CP + GNP nanofluid system holds significant potential for SNG storage, providing a promising strategy for advancing the SNG technology toward practical applications.
Author Contributions
Conceptualization, Z.T. and D.Z.; methodology, Z.T., J.Z. and D.Z.; validation, R.K., W.B. and L.W.; formal analysis, R.K.; investigation, Z.T., R.K. and W.B.; resources, L.W.; data curation, R.K. and L.W.; writing—original draft preparation, Z.T., R.K. and L.W.; writing—review and editing, D.Z.; supervision, J.Z. and D.Z.; funding acquisition, D.Z. and J.Z. All authors have read and agreed to the published version of the manuscript.
Funding
This research was funded by the National Natural Science Foundation of China (No. 52576191, No. U25A20275), the Fundamental Research Funds for the Central Universities (2024CDJYDYL006), and the National Key Research and Development Program (2021YFB3301100).
Data Availability Statement
The original contributions presented in this study are included in the article. Further inquiries can be directed to the corresponding authors.
Conflicts of Interest
Author Zhansheng Tao was employed by the company Shanxi Lanhua Coalbed Methane Co., Ltd.. The remaining authors declare that the research was conducted in the absence of any commercial or financial relationships that could be construed as a potential conflict of interest.
References
- Englezos, P. Clathrate hydrates. Ind. Eng. Chem. Res. 1993, 32, 1251–1274. [Google Scholar] [CrossRef]
- Lee, S.; Lee, Y.; Seo, D.; Moon, S.; Ok, Y.; Yang, W.; Park, Y. Enhancing gas storage capacity by controlling the cage occupancy of natural gas hydrate. Chem. Eng. J. 2025, 518, 164493. [Google Scholar] [CrossRef]
- Sloan, E.D. Gas hydrate: Review of physical/chemical properties. Energy Fuels 1998, 12, 191–196. [Google Scholar] [CrossRef]
- Chong, Z.R.; Yang, S.H.B.; Babu, P.; Linga, P.; Li, X.S. Review of natural gas hydrates as an energy resource: Prospects and challenges. Appl. Energy 2016, 162, 1633–1652. [Google Scholar] [CrossRef]
- Ke, W.; Svartaas, T.M.; Chen, D.Y. A review of gas hydrate nucleation theories and growth models. J. Nat. Gas Sci. Eng. 2019, 61, 169–196. [Google Scholar] [CrossRef]
- Babu, P.; Daraboina, N. A systematic review of recent advances in hydrate technology for precombustion carbon capture. J. Environ. Chem. Eng. 2024, 12, 113439. [Google Scholar] [CrossRef]
- Li, J.B.; Zhong, D.L.; Yan, J. Improving gas hydrate-based CH4 separation from low-concentration coalbed methane by graphene oxide nanofluids. J. Nat. Gas Sci. Eng. 2020, 76, 103212. [Google Scholar] [CrossRef]
- Veluswamy, H.P.; Kumar, A.; Seo, Y.; Lee, J.D.; Linga, P. A review of solidified natural gas (SNG) technology for gas storage via clathrate hydrates. Appl. Energy 2018, 216, 262–285. [Google Scholar] [CrossRef]
- Ge, B.B.; Li, X.Y.; Zhong, D.L.; Lu, Y.Y. Investigation of natural gas storage and transportation by gas hydrate formation in the presence of bio-surfactant sulfonated lignin. Energy 2022, 244, 122665. [Google Scholar] [CrossRef]
- Gaikwad, N.; Kim, H.; Bhattacharjee, G.; Sangwai, J.S.; Kumar, R.; Linga, P. Thermodynamics, Kinetics, Morphology, and Raman studies for sH Hydrate of Methane and Cyclooctane. ACS Eng. Au 2023, 3, 173–183. [Google Scholar] [CrossRef]
- Sloan, E.D. Fundamental principles and applications of natural gas hydrates. Nature 2003, 426, 353–359. [Google Scholar] [CrossRef]
- Wu, Y.; Zhang, Y.; Bhattacharjee, G.; He, Y.; Zhai, M.; Linga, P. Seawater-based methane storage via mixed CH4/1,3-dioxane hydrates: Insights from experimental and molecular dynamic simulations. Chem. Eng. J. 2023, 479, 147721. [Google Scholar] [CrossRef]
- Beckwée, E.J.; Houlleberghs, M.; Ciocarlan, R.G.; Chandran, C.V.; Radhakrishnan, S.; Hanssens, L.; Cool, P.; Martens, J.; Breynaert, E.; Baron, G.V.; et al. Structure I methane hydrate confined in C8-grafted SBA-15, A highly efficient storage system enabling ultrafast methane loading and unloading. Appl. Energy 2024, 353, 122120. [Google Scholar] [CrossRef]
- Ge, B.B.; Zhong, D.L.; Lu, Y.Y.; Li, X.Y. Investigation of Tetrahydrofuran-CH4 hydrate formation in unstirred conditions from a different perspective: Application to solidified natural gas storage. Energy Fuels 2023, 37, 15647–15656. [Google Scholar] [CrossRef]
- Qin, Y.; Bao, R.; Zhou, L.; Yang, X.; Liu, C.; Wan, W.; Chen, Y.; Guo, Y. Enhanced formation kinetics of hydrates using 1,3-dioxolane, l-leucine, and β-cyclodextrin. Fuel 2023, 332, 126165. [Google Scholar] [CrossRef]
- Yu, Y.S.; Sun, W.Z.; Chen, C.; Li, X.S.; Chen, Z.Y. Kinetics studies of methane hydrate formation and dissociation in the presence of cyclopentane. Fuel 2024, 356, 129651. [Google Scholar] [CrossRef]
- Wei, Y.; Worley, J.; Zerpa, L.E.; Chien, Y.C.A.; Dunn-Rankin, D.; Kezirian, M.T.; Koh, C.A. Natural gas storage in hydrates in the presence of thermodynamic hydrate promoters: Review and experimental investigation. Fluid Phase Equilibria 2025, 591, 114286. [Google Scholar] [CrossRef]
- Sun, J.; Zhang, Y.; Bhattacharjee, G.; Li, X.; Jiang, L.; Linga, P. Hydrate-based energy storage: Studying mixed CH4/1,3-dioxane hydrates via thermodynamic modeling, in-situ Raman spectroscopy, and macroscopic kinetics. Appl. Energy 2024, 368, 123517. [Google Scholar] [CrossRef]
- Mu, L.; Zhou, Z.; Tan, Q.; Li, X.; Zhao, H.; Cui, Q. Experimental investigation on the methane storage by forming sH hydrate. J. Energy Storage 2024, 77, 109940. [Google Scholar] [CrossRef]
- Mu, L.; Zhou, Z.; Tan, Q.; Li, X.; Zhao, H.; Cui, Q. Rapid and energy-dense methane hydrate formation at near ambient temperature using 1,3-dioxolane as a dual-function promoter. Appl. Energy 2022, 311, 118678. [Google Scholar]
- Inkong, K.; Rangsunvigit, P.; Kulprathipanja, S.; Linga, P. Effects of temperature and pressure on the methane hydrate formation with the presence of tetrahydrofuran (THF) as a promoter in an unstirred tank reactor. Fuel 2019, 255, 115705. [Google Scholar] [CrossRef]
- Kumar, A.; Vedula, S.S.; Kumar, R.; Linga, P. Hydrate phase equilibrium data of mixed methane-tetrahydrofuran hydrates in saline water. J. Chem. Thermodyn. 2018, 117, 2–8. [Google Scholar] [CrossRef]
- Veluswamy, H.P.; Wong, A.J.H.; Babu, P.; Kumar, R.; Kulprathipanja, S.; Rangsunvigit, P.; Linga, P. Rapid methane hydrate formation to develop a cost effective large scale energy storage system. Chem. Eng. J. 2016, 290, 161–173. [Google Scholar] [CrossRef]
- Yao, Y.; Chen, D.Y.; Yin, Z.Y. On the importance of DIOX concentration in promoting CH4 hydrate formation: A thermodynamic and kinetic investigation. Fuel 2022, 324, 124355. [Google Scholar] [CrossRef]
- Yu, Y.S.; Zhang, Q.Z.; Li, X.S.; Chen, C.; Zhou, S.D. Kinetics, compositions and structures of carbon dioxide/hydrogen hydrate formation in the presence of cyclopentane. Appl. Energy 2020, 265, 114808. [Google Scholar] [CrossRef]
- Lee, J.; Jin, Y.K.; Seo, Y. Characterization of cyclopentane clathrates with gaseous guests for gas storage and separation. Chem. Eng. J. 2018, 338, 572–578. [Google Scholar] [CrossRef]
- Lv, Q.N.; Zhang, K.; Li, X.S.; Li, G. Investigation on the Structure, Formation Mechanism, and Surface Morphology of CP-CH4 Binary Hydrate. Energy Fuels 2023, 37, 2009–2018. [Google Scholar] [CrossRef]
- Rahmati, A.M.; Manteghian, M.; Pahlavanzadeh, H. Experimental and theoretical investigation of methane hydrate induction time in the presence of triangular silver nanoparticles. Chem. Eng. Res. Des. 2017, 120, 325–332. [Google Scholar] [CrossRef]
- Li, J.; Liang, D.; Guo, K.; Wang, R.; Fan, S. Formation and dissociation of HFC134a gas hydrate in nano-copper suspension. Energy Convers. Manag. 2006, 47, 201–210. [Google Scholar] [CrossRef]
- Arjang, S.; Manteghian, M.; Mohammadi, A. Effect of synthesized silver nanoparticles in promoting methane hydrate formation at 4.7 MPa and 5.7 MPa. Chem. Eng. Res. Design 2013, 91, 1050–1054. [Google Scholar] [CrossRef]
- Mohammadi, A.; Manteghian, M.; Haghtalab, A.; Mohammadi, A.H.; Rahmati-Abkenar, M. Kinetic study of carbon dioxide hydrate formation in presence of silver nanoparticles and SDS. Chem. Eng. J. 2014, 237, 387–395. [Google Scholar] [CrossRef]
- Pahlavanzadeh, H.; Rezaei, S.; Khanlarkhani, M.; Manteghian, M.; Mohammadi, A.H. Kinetic study of methane hydrate formation in the presence of copper nanoparticles and CTAB. J. Nat. Gas Sci. Eng. 2016, 34, 803–810. [Google Scholar] [CrossRef]
- Liu, G.Q.; Wang, F.; Luo, S.J.; Xu, D.Y.; Guo, R.B. Enhanced methane hydrate formation with SDS-coated Fe3O4 nanoparticles as promoters. J. Mol. Liq. 2017, 230, 315–321. [Google Scholar] [CrossRef]
- Abdi-Khanghah, M.; Adelizadeh, M.; Naserzadeh, Z.; Barati, H. Methane hydrate formation in the presence of ZnO nanoparticle and SDS: Application to transportation and storage. J. Nat. Gas Sci. Eng. 2018, 54, 120–130. [Google Scholar] [CrossRef]
- Najibi, H.; Shayegan, M.M.; Heidary, H. Experimental investigation of methane hydrate formation in the presence of copper oxide nanoparticles and SDS. J. Nat. Gas Sci. Eng. 2015, 23, 315–323. [Google Scholar] [CrossRef]
- Aliabadi, M.; Rasoolzadeh, A.; Esmaeilzadeh, F.; Alamdari, A. Experimental study of using CuO nanoparticles as a methane hydrate promoter. J. Nat. Gas Sci. Eng. 2015, 27, 1518–1522. [Google Scholar] [CrossRef]
- Kilaru, H.V.; Ponnusamy, S.K.; Rames, C.P. A review on heavy metal pollution, toxicity and remedial measures: Current trends and future perspectives. J. Mol. Liq. 2019, 290, 111197. [Google Scholar] [CrossRef]
- Zhou, S.D.; Yu, Y.S.; Zhao, M.M.; Wang, S.L.; Zhang, G.Z. Effect of graphite nanoparticles on promoting CO2 hydrate formation. Energy Fuels 2014, 28, 4694–4698. [Google Scholar] [CrossRef]
- Yu, Y.S.; Xu, C.G.; Li, X.S. Evaluation of CO2 hydrate formation from mixture of graphite nanoparticle and sodium dodecyl benzene sulfonate. J. Ind. Eng. Chem. 2018, 59, 64–69. [Google Scholar] [CrossRef]
- Yan, J.; Lu, Y.Y.; Zhong, D.L.; Zou, Z.L.; Li, J.B. Enhanced methane recovery from low concentration coalbed methane by gas hydrate formation in graphite nano fluids. Energy 2019, 180, 728–736. [Google Scholar] [CrossRef]
- Zhang, J.; Xing, X.; Yin, Z.; Mao, N.; He, T. Evaluating CO2 + C3H8 hydrate kinetics with cyclopentane and graphite for sustainable hydrate-based desalination. J. Clean. Prod. 2023, 384, 135365. [Google Scholar] [CrossRef]
- Lu, Y.Y.; Ge, B.B.; Zhong, D.L. Investigation of using graphite nanofluids to promote methane hydrate formation: Application to solidified natural gas storage. Energy 2020, 199, 117424. [Google Scholar] [CrossRef]
- Li, F.; Qi, P.; Liu, L.; Wang, H. Surface Decoration and Dispersibility of Modified Graphene Nanoplatelets (GNPs) in Aqueous Surfactant Solution. Russ. J. Phys. Chem. A 2025, 99, 2178–2183. [Google Scholar] [CrossRef]
- Yırmıbeșoğlu, A.; Nihan, K.; Boran, F. Effect of surface-active substances on the macrodispersion behavior of thermal stress-modified multi-wall carbon nanotubes in cryogenic environments. Diam. Relat. Mater. 2024, 150, 111739. [Google Scholar] [CrossRef]
- Zhong, D.L.; Lu, Y.Y.; Sun, D.J.; Zhao, W.L.; Li, Z. Performance evaluation of methane separation from coal mine gas by gas hydrate formation in a stirred reactor and in a fixed bed of silica sand. Fuel 2015, 143, 586–594. [Google Scholar] [CrossRef]
- Li, Z.; Zhong, D.L.; Zheng, W.Y.; Yan, J.; Lu, Y.Y.; Yi, D.T. Morphology and kinetics investigation of TBAB/TBPB semiclathrate hydrates formed with a CO2 + CH4 gas mixture. J. Cryst. Growth 2019, 511, 79–88. [Google Scholar] [CrossRef]
- Deng, X.Y.; Yang, Y.; Zhong, D.L.; Li, X.Y.; Ge, B.B.; Yan, J. New insights into the kinetics and morphology of CO2 hydrate formation in the presence of sodium dodecyl sulfate. Energy Fuels 2021, 35, 13877–13888. [Google Scholar] [CrossRef]
- Smith, J.M.; Van Ness, H.C.; Abbott, M.W. Introduction to Chemical Engineering Thermodynamics; Mcgraw-Hill, Inc.: New York, NY, USA, 2011. [Google Scholar]
- Azizi, N.; Behbahani, R.M. Predicting the compressibility factor of natural gas. Pet. Sci. Technol. 2017, 35, 696–702. [Google Scholar] [CrossRef]
- Mahmoud, M. Development of a new correlation of gas compressibility factor (Z-factor) for high pressure gas reservoirs. J. Energy Resour. Technol. 2014, 136, 012903. [Google Scholar] [CrossRef]
- Makogon, Y.F. Hydrates of Hydrocarbons, 1st ed.; Penwell Books: Tulsa, OK, USA, 1997. [Google Scholar]
- Ge, B.B.; Zhong, D.L.; Lu, Y.Y.; Kuang, R.G. THF-CH4 Hydrate Formation under Static Conditions with the Change of Temperature: Application to CH4 Storage in the Form of Gas Hydrates. Energy Fuels 2025, 39, 6232–6240. [Google Scholar] [CrossRef]
- Cai, J.; Hu, Y.F.; Zhang, Y.; Xu, C.G.; Chen, Z.Y.; Lv, Q.N.; Li, X.S. Study on Temperature Characteristics of Hydrate Slurry during Cyclopentane-Methane Hydrate Formation. Energy Fuels 2018, 32, 1558–1566. [Google Scholar] [CrossRef]
- Li, H.Y.; Li, X.S.; Yu, Y.S.; Chen, Z.Y. Morphologies, kinetics and structures of methane hydrate in the system containing tetrahydrofuran and cyclopentane. Fuel 2023, 340, 127585. [Google Scholar] [CrossRef]
- Yakushev, V.; Istomin, V. Gas hydrate self-preservation effect. Phys. Chem. Ice 1992, 58, 136–140. [Google Scholar]
- Bai, D.S.; Zhang, D.W.; Zhang, X.R.; Chen, G. Origin of Self-preservation Effect for Hydrate Decomposition: Coupling of Mass and Heat Transfer Resistances. Sci. Rep. 2015, 5, 14599. [Google Scholar] [CrossRef] [PubMed]
- Shimada, W.; Takeya, S.; Kamata, Y.; Uchida, T.; Nagao, J.; Ebinuma, T.; Narita, H. Texture change of ice on anomalously preserved methane clathrate hydrate. J. Phys. Chem. B 2005, 109, 5802–5807. [Google Scholar] [CrossRef]
- Kida, M.; Watanabe, M.; Jin, Y.; Nagao, J. Contribution of water molecules to methane hydrate dissociation. Jpn. J. Appl. Phys. 2015, 54, 065502. [Google Scholar] [CrossRef]
- Wu, Q.; Wang, Y.; Zhan, J. Effect of rapidly depressurizing and rising temperature on methane hydrate dissociation. J. Nat. Gas Chem. 2012, 21, 91–97. [Google Scholar] [CrossRef]
Disclaimer/Publisher’s Note: The statements, opinions and data contained in all publications are solely those of the individual author(s) and contributor(s) and not of MDPI and/or the editor(s). MDPI and/or the editor(s) disclaim responsibility for any injury to people or property resulting from any ideas, methods, instructions or products referred to in the content. |
© 2026 by the authors. Licensee MDPI, Basel, Switzerland. This article is an open access article distributed under the terms and conditions of the Creative Commons Attribution (CC BY) license.