Abstract
In this paper, a permanent-magnet-assisted synchronous reluctance motor (SYNRM) coupled with a newly built QDBC and a voltage-fed inverter (VFI) for a standalone PV water pumping system is suggested. Because power supply oscillations can result in short-term disruptions that affect drive performance in industrial applications involving these motors, a robust smooth control system is required to guarantee high efficiency and uninterrupted operation. According to the suggested architecture, a newly built quadratic boost regulator with a very high voltage gain, called a quadruple-diode boost converter (QDBC), is used to first elevate PV voltage to high levels. Additionally, to optimize the power output of the solar PV module, the perturbation and observation highest power point tracking approach (P&O) is implemented. To provide smooth synchronous motor starting, field-oriented control (FOC) of a voltage-fed inverter (VFI) is combined with hysteresis current control of the QDBC. The optimization algorithms discussed in this paper aim to enhance the efficiency of the SYNRM, particularly in operating a synchronous motor powered by variable energy sources such as solar PV. These algorithms function within a cybernetic system designed for water pumping, incorporating feedback loops and computational intelligence for improved performance. Afterward, the three-phase permanent-magnet synchronous motor that drives the mechanical load is fed by the resulting voltage via a voltage source inverter. Furthermore, a thorough hysteresis current control method implementation of the QDBC was suggested in order to attain optimal efficiency in both devices, which is crucial when off-grids are present. Even when the DC-link voltage dropped by up to 10% of the rated voltage, the suggested method was shown to maintain the required reference torque and rated speed. To verify the efficacy of the suggested method, a simulation setup according to the MATLAB 2022b/Simulink environment was employed. To gather and analyze the data, multiple scenarios with varying operating conditions and irradiance levels were taken into consideration. Finally, a working prototype was constructed in order to validate the mathematical analysis and simulation findings of the suggested framework, which includes a 1 kW motor, current sensor, voltage sensor, QDBC, and VCS inverter.
1. Introduction
Solar-powered water pumps are needed for irrigation in warm African and Middle Eastern states because of the rapid population growth and the ensuing need to live in desert regions, establish new living areas there, and raise livestock and crops [1,2,3,4]. Making plans for the expansion of cities and the subsequent urbanization of vast desert regions—which presently lack foundation, utilities, and a transportation network—is an extremely important issue. Energy is necessary for development, both in urban and rural areas, but development cannot happen until most of the population has easy access to water, the source of life.
Because of this, there seems to be a need for the installation of solar-powered water pumping systems to transport water from boreholes to ground level for use in the creation of new agricultural communities in the arid regions of hot countries [2,3,4,5,6]. For instance, water can be pumped from a river or borehole to the other irrigation networks, or it can be moved up to a storage tank for preservation and later use.
Researchers are concentrating on enhancing the general efficacy and dependability of solar power water pumping systems as well as creating affordable and straightforward drive systems and control strategies. The authors of [7] employ a synchronous reluctance motor. The authors of [8] present induction motors as an alternative for driving water pumping systems. The pump is driven by a permanent-magnet synchronous motor, which is used by authors of [9]. Due to its durable design, widespread industrial use, affordability, and cheap cost, the induction motor outperforms other commercial engines in PV water pumping applications [10].
However, induction motors also have shortcomings and drawbacks. Because of their nonlinear model, this kind of motor has complicated control. Because it is less expensive and complex, the scalar control technique is usually utilized to regulate induction motors; however, it provides an inadequate torque response at low frequencies [11,12,13]. The authors of [11,12,13] suggest the indirect field-oriented control approach. Throughout the whole speed range, this method offers good speed precision and a decent torque response. However, the settings of the machine affect this control method and make it complicated.
In this paper, a permanent-magnet-supported reluctance synchronous motor (SYNRM) in conjunction with a recently constructed QDBC and a voltage-fed inverter (VFI) is recommended. SYNRMs are widely utilized in household appliances, electric vehicles, aircraft, and other industries due to their small size, low loss, and great efficiency. The SYNRM is not equipped with a rotor excitation winding, just like a traditional synchronous motor with prominent poles. In this case, salient poles are only used in the construction of the permanent magnet rotor. The cylindrical stator inner surface of variable reluctance motors often retains many of their benefits.
Modern control strategies, such as field-oriented control (FOC), are implemented in synchronous motors through inverters, enabling precise and independent control of torque and speed. These methods are essential for optimizing efficiency, particularly under fluctuating load conditions. In terms of power management and optimization, systems connected to variable power sources, such as solar PV panels, utilize algorithms to identify the highest power point (HPPT) of the source. Techniques like “perturbation and observation” dynamically adjust the motor’s speed reference to ensure efficient power extraction and utilization. In practical engineering applications, the term “cybernetic systems” for water pumping refers to sophisticated automated control systems that rely on feedback loops and computational intelligence—such as optimization algorithms—to enhance efficiency. This approach is especially effective when operating synchronous motors powered by variable energy sources like solar PV.
In principle, the suggested quadruple-diode boost regulator (QDBC) is a high-order regulator that has a total harmonic distortion (THD) of 6.6%, which is lower than boost, buck, and buck/boost regulators, as well as the standard SEPIC regulator (10%) [12]. Furthermore, the QDBC regulator’s crest factor is far lower than that of any other DC-DC regulator previously mentioned. All of these characteristics make this converter a cost-effective and efficient processor for creating current and, hence, torque with very low harmonic content and vibration [13].
Hence, the main advantages of the renewed SYNRM with the suggested QDBC are as follows:
- The SYNRM can now compete with an induction machine due to its improved saliency ratio, especially when considering the power factor and the amount of kVA needed for the inverter.
- In comparison to the field-oriented controlled induction machine, small- to medium-sized superior-performance motors could be easier to regulate when utilizing the SYNRM.
- As opposed to the asynchronous motor that experiences a possible cause of overheating, it may be operated steadily down to zero rpm when fully loaded.
- The SYNRM also seems to be more effective than an induction machine at low speeds.
- Efficiency increases without a large back-EMF or the need to modify the stator design by adding the right amount of magnet to the rotor core.
- Demagnetization caused by machine overloading and high room temperatures is one of the main problems with SYNRMs. However, demagnetization is impossible when powerful magnets are utilized.
However, the stability of SYNRM operations is negatively impacted by excessive torque ripple that is produced as a result of QDBC supply and load current fluctuations. It then produces several issues, including high vibration, noise, and a limited lifespan. Therefore, decreasing torque ripple is very crucial for the motor’s performance. Additionally, this study suggests a hysteresis current controller that may be used to dynamically modify the output-to-input voltage ratio of the QDBC, maximizing its performance according to operating conditions and system factors.
Moreover, the QDBC with hysteresis current control is susceptible to a number of cyberattacks, such as the following:
- Fake Data Injection: In order to alter voltage or current levels and perhaps cause instability or damage, attackers could introduce fake data into the control system.
- Sensor Manipulation: Inaccurate readings from compromised sensors (such as temperature, voltage, and current) could result in improper control actions.
- Attackers may interfere with communication signals by jamming, which would stop the converter from obtaining the right instructions or feedback.
Cyberattacks on DC-DC converters may result in [14,15,16] the following:
- System uncertainty: When the power system is unstable, it may cause oscillations, voltage sags, or even blackouts due to improper control actions.
- Hardware degradation: The converter or other related equipment may sustain damage from excessive voltage or current levels brought on by attacks.
- Decreased effectiveness: Waste of energy could result from attackers manipulating the converter’s operation to lower its efficiency.
- Risks to safety: Attacks could jeopardize safety measures in applications like electric cars, which could result in mishaps.
Therefore, while continuously monitoring the highest power point (HPPT), the suggested QDBC provided from a PV system may feed the reluctance synchronous motor with electrical power with minimum harmonics created. Moreover, the VCS inverter uses field-oriented control regulation to keep the goal torque and speed constant, even in the case of insufficient grid stability. DC-link capacitors are therefore not large. However, in order to defend against future cyber threats, it is imperative that strong cybersecurity measures be incorporated into both their design and operation. The safe and dependable operation of these converters in a variety of applications requires a multi-layered strategy that incorporates intrusion detection, redundancy, secure communication, and frequent vulnerability evaluations [14,15,16,17,18].
Additionally, definitions and explanations of the SYNRM’s state equations and operation modes are provided. The voltage, current, and their harmonic spectrum waveforms are thoroughly examined and confirmed. Finally, the usefulness of the suggested QDBC in conjunction with the SYNRM and field-oriented inverter is presented by the simulation findings run using MATLAB/SIMULINK software. The characteristics of the recommended regulator are as follows:
- As illustrated in [13], the QDBC is compared to numerous other DC-DC stepping up voltage converters, such as boost converters, increased voltage gain, and reduced current and voltage ripple.
- The analytical and simulated results show that the recommended QDBC regulator can theoretically achieve an efficiency of 98%.
- As demonstrated in [14], the DC-DC converter with the hysteresis current controller can be hot-plugged, increasing the system’s redundant operation, flexibility, and adaptation. Furthermore, utilizing hysteresis current control to evaluate the converter’s characteristics on a regular basis can assist in lowering the risk of cybernetic attacks.
The following are the primary outcomes of this paper:
- The suggested QDBC regulator operates alongside hysteresis current control to reduce harmonic distortion in voltage and current, enhancing overall system performance.
- Determining the PV’s highest power point at different temperatures and irradiation levels.
- The suggested QDBC provides the necessary DC voltage for the DC winding of a sensorless SYNRM that drives a water pump load or an electric vehicle.
- The field-oriented control of the VFI is combined with the P&O technique to maximize the power from the solar PV module. This aids in the synchronous reluctance motor starting smoothly as well.
- To confirm the effectiveness of the suggested system, a simulation study is carried out in MATLAB 2021a.
2. System Description
The double-stage SYNRM drive block diagram for a water pumping system is displayed in Figure 1. The system is composed of a photovoltaic array, a vector-control scheme for the SYNRM drive, a reference speed generator, a recently developed quadruple-diode boost converter with high voltage gain in conjunction with an HPPT technique and voltage source inverter, and an SYNRM drive with centrifugal pumping load.
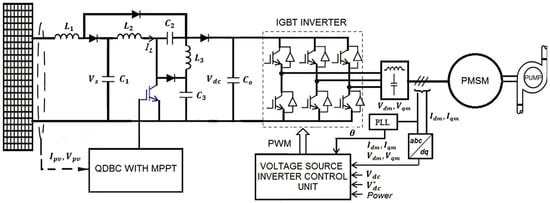
Figure 1.
SYNRM-based PV with a QDBC, VFI, and centrifugal water pump.
2.1. Modeling of the SYNRM
The three-phase two-pole permanent-magnet synchronous motor circuit is illustrated in Figure 2. The suggested SYNRM model does not take into account the effects of hysteresis, skin effects, saturation in damping winding magnetic core, rotor saliency, of stator core losses. However, the two-phase motor on the direct and quadrature axes (henceforth referred to as dq-axes) is used to generate the dynamic model of the SYNRM. This technique is preferred over the three-phase model due to its conceptual simplicity, as it only requires one pair of two windings on the stator.
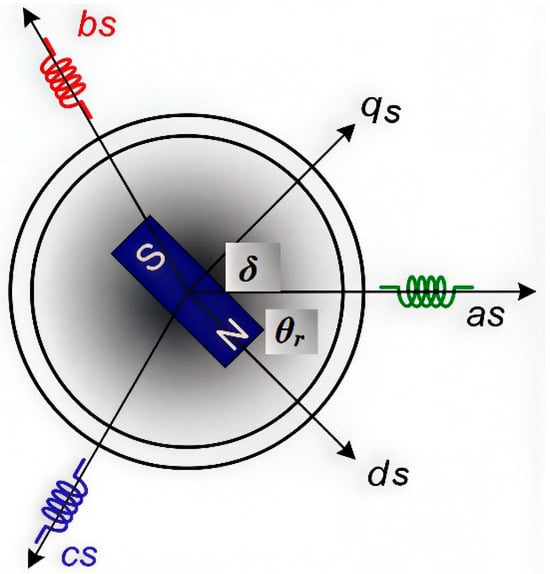
Figure 2.
Three-phase circuit with dq-axes for a two-pole permanent-magnet reluctance synchronous motor.
2.1.1. The dq Equations of the SYNRM
The stator voltages and currents for this motor in the rotor reference frame are given by the following equations, as shown in Figure 3, which is derived in [19,20]:
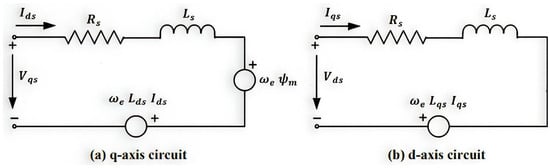
Figure 3.
Equivalent circuit of the SYNRM [19].
The variables that are represented in Equation (2) are the stator resistance (Rs), permanent-magnet flux linkage (ψm), total dq-axis stator inductances (Lds), and (Lqs). Let us recall from [16] and Figure 1 that the dq-axis components of the stator current could be given as:
Reference [20] states that the rotor position angle is given as , where θ is the initial phase of the rotor permanent magnet. Integrating the circuitry-electromagnetic Equation (1) with respect to the currents, and , one finds:
2.1.2. The Quasi-Stationary State and Phasor-Domain Model of the SYNRM
In the quasi-stationary state of the SYNRM represented by Figure 4, Equation (3) could be modified as follows:
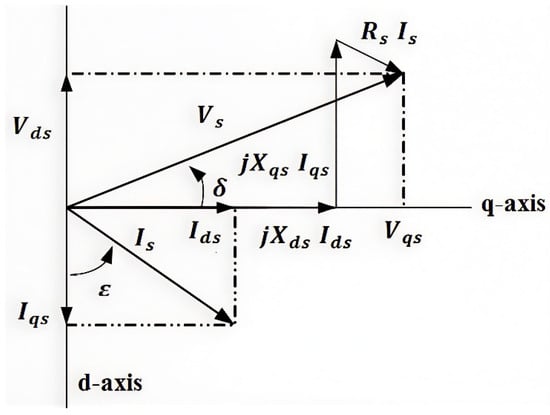
Figure 4.
Phasor diagram of the SYNRM.
The dq-axis reference frames represent the physical behavior of stator and rotor currents in a frame that rotates at the same speed as the rotor. When a balanced set of three-phase voltages is applied, a continuously rotating space vector is generated in the dq-plane of the machine. In the rotor reference frame, this voltage vector remains stationary if the rotor rotates at the same angular velocity as the spinning voltage vector, adjusted by the number of pole pairs.
The two components that make up the standard description of the angular relationship between the dq-axes and the stator voltage space vector are as follows:
To construct a phasor-domain model of the SYNRM, the first line of Equation (4) is multiplied by (−j) and added to the second line after translating the current and voltage into their respective phasors:
After further modification of Equation (5), it yields:
Thus, in the phasor domain, one may write:
The dq-axis stator current components can be approximately determined according to the steady-state voltages, as outlined in [17], assuming the stator resistance (Rs) is neglected.
2.1.3. Torque Expression for the SYNRM
The motion equation of the synchronous machine uses Newton’s second law, written as follows:
where ωr is the mechanical rotor speed, J is the moment of inertia of the rotor with the connected load, is the electrical stator speed, TL is the load torque, which is positive for motor operation, and, finally, β is the friction damping factor of the rotational system of the motor with the mechanical load. Therefore, the electromagnetic torque and the torque of a synchronous machine have the same dq variables [19,20]:
The following equation for the machine torque in terms of the dq stator current can be obtained by replacing ψds and ψqs from Equation (1):
where P is the total number of poles in the machine. The provided equation demonstrates that the torque is made up of two distinct mechanisms. While the second word denotes “the reluctance torque” brought on by the variation in dq-axis inductances or reluctances, the first term indicates “the permanent-magnet excitation torque” or “synchronous torque” that arises between the current, iqs, and the permanent magnet. As a result, the torque equation demonstrates that the SYNRM, or, as this work’s title puts it, “permanent-magnet-assisted synchronous reluctance motor,” can be thought of as a hybrid of traditional synchronous-reluctance motors and external permanent-magnet motors.
After substituting from Equation (9), it is evident that the torque of the SYNRM can be expressed in terms of stator phasor voltage as follows:
By substituting from Equation (5) into (13), one may calculate the torque according to the torque angle δ, voltage, and frequency as follows:
After substituting for and rearrangement, one may get:
The torque of the SYNRM has two components:
- The reluctance torque is due to the difference in inductances between the dq-axes, which is a notable characteristic, unlike in surface-mounted Permanent-magnet Synchronous Machines (PMSMs), where the inductance values along the dq-axes are identical. This torque varies in accordance with the sine of twice the torque angle δ and the square of the voltage per Hertz.
- The magnetic (excitation) torque (in blue) due to the permanent-magnet flux structure. The magnetic torque is mainly improved by applying a modified structure of the motor magnets, as shown in [16], which increases the efficiency of the motor and the saliency ratio. When the stator voltage and stator synchronous speed are fixed, the greatest torque is achieved when . Thus, the following is the greatest torque at a certain Volt per Hertz:
According to Figure 3, the vector with a constant amplitude of Is on the dq-axis plane can be expressed as follows:
Moreover, the electromagnetic torque can be expressed using the stator current amplitude and flux (magnetomotive force) angle (ε) and Equation (12) as follows:
Thus, if the stator current is kept constant, the greatest torque is achieved when . Hence, the maximum torque is:
Equating the maximum reluctance torque in Equation (16) with that in Equation (19) yields:
Hence, substituting for the space current phasor, , and for the space voltage phasor, , then:
Otherwise, if the flux angle, , then it should be greater than zero degrees and smaller than negative ninety degrees. For synchronous motors, it is good to set the flux angle (ε) between −15° and −75°. Thus:
where is the coupling factor between Lds and Lqs, and practically, it has a value of . As stated in (23), the currents in the dq-axis frame will be transformed into perfect constant vectors synchronized with cross-coupling terms (). Consequently, feed-forward is employed to offer independent current control, power, and torque management and to offset the impacts of cross-coupling.
According to [14], the synchronous motor’s quadrature inductance component, Lqs, has a constant value when its corresponding q-axis current, Iqs, is small and near zero. Otherwise, for positively or negatively increasing or reducing Iqs, it drops considerably. However, the counterpart inductance of the SYNRM, Lds, remains constant even when its corresponding d-axis current, Ids, fluctuates either positively or negatively. After applying Equation (17), setting a value of 45° for the torque angle, and maintaining constant values for both inductances, Lds and Lqs, the flux angle, ε, should be set for generating and motoring the mode of the SYNRM to an ideal value of around ±15°.
The analysis outlined above clearly demonstrates that two key variables are adjusted within this paper to regulate the power and/or speed of the synchronous reluctance motor (SYNRM): the dq components of the stator current and the electromagnetic torque of the motor. Additionally, an increase in the input power supplied to the motor leads to a corresponding rise in rotor speed, highlighting the necessity of the suggested QDBC. Efficient control of the QDBC’s output voltage and current is achieved using the hysteresis current-mode technique in combination with the HPPT tracking system. This approach plays a vital role in managing the dq-axis currents of the SYNRM’s stator, which, in turn, governs its electromagnetic torque (Te), power, and speed.
2.1.4. Power Expression for the SYNRM
Figure 5 depicts the phasor diagram of an internal SYNRM according to the equivalent circuit (3). The input power for this model can be calculated as follows:

Figure 5.
A synchronous reluctance motor’s power factor in relation to the saliency ratio (K).
The three-phase real power developed per phase in the SYNRM in watts is expressed according to [16]. The real power developed per phase in watts is:
Whereas the expression in red represents the excitation power, and that in blue represents the reluctance power. The reactive per phase power is given as:
where E is the internal voltage generated by the permanent magnet within the stator circuit of the SYNRM.
Synchronous reluctance motors are often criticized for their low power factor, which is a recognized drawback in discussions surrounding their application. However, it is beneficial to examine this issue in greater detail. According to Figure 4, the power factor of a SYNRM, cos θ, can be determined by calculating the voltage amplitude, Vs, with respect to the projection of the voltage space vector onto the current space vector. That is:
Once more, ignoring the stator resistance is convenient. Since any resistance can only raise the power factor in this situation, ignoring the stator resistance has an additional detrimental impact on the power factor. Using the previous analysis, one may get:
which reduces to:
According to [15], the maximum value reached by the power factor is . This is obtained when the excitation angle, ε, reaches a value such that . Figure 5 shows the motor power factor versus the saliency ratio, k, under the maximum power factor approach, and for different values of the saliency ratio, k. It should be noted that induction machines of class B with a horsepower rating of roughly 10 typically have a power factor of 0.8 and a saliency ratio of 9. Hence, an upward-sloping curve illustrates the power factor enhancement, moving closer to unity as the saliency ratio rises.
The optimal working condition for determining rated torque is the point where the power factor is at its peak. A key consideration is the proximity of this working point to the highest torque scenario during pullout. If the stator resistance is disregarded, the input and output power are considered equal. Under these circumstances, when stator resistance is neglected:
After dividing these two equations, one may get:
Substituting for , then one may obtain for the torque angle:
Thus:
Finally, it is evident from (29) that the amplitude of the current at a highest power factor is:
Combining Equation (23) with Equation (33) results in the following expression for the input power at the maximum power factor:
Additionally, the following expression for the reluctance torque produced at pullout by the provided SYNRM input power can be obtained:
At the pullout condition, the input power can be given as:
Taking the ratio of Equation (36) and Equation (34) results in:
Hence, if , then which is a very fair and acceptable amount of per unit pullout torque.
2.2. Water Pump Mathematical Model
In the context of pump terminologies, the power supplied to the pump from outside is referred to as braking horsepower, or simply bhp. In typical scenarios involving a rotating shaft, the brake horsepower is expressed as:
The mechanical speed of the shaft, denoted as (rad/s), and the torque applied to the shaft, (in N·m), are key parameters. Pump efficiency, , is described as the proportion of useful power generated compared to the power supplied, and it is expressed in the following manner:
where ρ represents the density of water (kg/m3), g denotes gravitational acceleration (m/s2), is the volume flow rate (m3/s), and H signifies the net head of the water pump (mH2O). It is important to highlight that under steady-state conditions, the mass flow rate (kg/s) substitutes .
Friction, internal breakdowns, fluid separation on blade surfaces, turbulence dispersion, and various other factors contribute to irreversible losses in all pumps. Therefore, the mechanical energy supplied to the pump must be larger than The useful power actually transferred to the fluid is commonly referred to as water horsepower. This term remains in use regardless of whether the fluid being pumped is water or if the power is measured in units other than horsepower.
3. SYNRM Torque and Speed Controllers
The regulation of the dq-axis stator current components is primarily responsible for controlling the reluctance torque, and the precise estimation of the SYNRM parameters (Lds, Lqs, and the machine’s back EMF) is responsible for controlling the magnetic excitation torque.
3.1. Reluctance and Magnetic Torque Control
Most synchronous reluctance motor control systems for magnetic torques have parameter-dependent controllers, whose operations depend on the motor’s characteristics being understood. One may classify parameter-dependent control systems as those that operate a motor at its maximum torque value per amp (MTPA) or without a speed sensor.
The functionality of the sophisticated parameter-dependent control approaches can be improved by utilizing an offline model of the motor parameters. However, because of the non-linearity brought on by iron saturation, this requires a lot of calculation. Real-time calculations of this kind are typically irrational. Furthermore, including the cross-saturation effect in offline parameter estimates is highly challenging and time-consuming [15].
The motor parameter determination considered in this paper relies on precise motor input signal measurements used in the applied simulation in the environment of Simulink/Matlab. As stated in Equation (13) through (37), the back-EMF of the permanent magnet and the dq-axis inductances are found.
The excitation flux, λm, is regarded as constant in this parameter consideration approach. Nevertheless, λm may fluctuate as a result of temperature variations, particularly if the rotor core contains ferrite magnets. These fluctuations in this flux with the high harmonic components of fifth and seventh orders are generated according to [19,20]; the stator voltages and currents can be filtered out using a basic low-pass filter. The z-transfer function of the low-pass filter could be as follows:
The low-pass filter does not require a changeable cut-off frequency since it operates inside a synchronous reference frame. The lowest feasible cut-off frequency is desired.
As was already established, the SYNRM torque is primarily controlled by the dq-axis components of the stator currents, specifically the reluctance component. Field-oriented control of the SYNRM allows for the individual regulation of the dq-axis stator current component vector. Therefore, a variety of unique dq-axis current pairings can be used to achieve the desired torque at any motor speed [19,20].
3.2. Current Controller Parameters
Figure 6 depicts the block design of a high-powerful speed and torque regulated system optimized for the highest torque output. The speed control loop processes the reference and measured rotor speeds, calculates the error signal, and sends it to the PI controller to generate the required machine torque, .
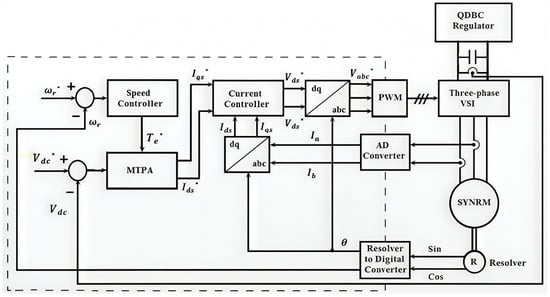
Figure 6.
Block diagram of a field-oriented controlled permanent-magnet-assisted synchronous reluctance motor (SYNRM) using a maximum torque per ampere controller (MTPA).
The maximum torque per ampere (MTPA) controller utilizes the generated torque () along with the reference speed to operate within the MTPA regime. It calculates the reference stator currents for the dq-axes, which are subsequently fed into the dq-axis current controllers.
Consequently, the reference dq-axis stator voltages are the output of these PI current controllers with the MTPA controller. Park’s transformation is then used to convert these voltages to an ABC reference frame so that the PWM technique can generate the triggering signals for the machine voltage source inverter. It should be noted that PI controller output limits, which are determined by the SYNRM rating, must be applied.
As illustrated in Figure 7, two independent controllers, speed and torque, are used to set and to the necessary values. The specifications of the PI controller used for regulating the d-axis stator current is defined as follows:
where kdi and kdp correspond to the integral and proportional gains of the current loop, respectively. The symbol τdi represents the bandwidth of the PI controllers. kdi and kdp represent the proportional and integral gains for the current loop, respectively. The bandwidth of the PI controllers is indicated by the symbol τdi. Next, we obtain the following for the current controller’s first-order response with the desired bandwidth of :
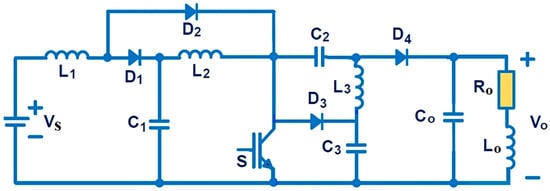
Figure 7.
QDBC.
Considering , then:
The q-axis control parameters are determined similarly, where:
According to Equation (6), one may write the following transfer function for the first-order response of the speed control with the desired bandwidth of :
where is the bandwidth of the speed controller and and are the speed controller parameters.
However, since it is typically difficult to determine B, Bω is treated as an unknown disturbance in the torque equation above. Consequently, the modified open-loop gain for speed control can be expressed as follows [16,17,18,19,20,21,22]:
Next, the desired bandwidth of the speed controller, is multiplied by the current controller bandwidth, τbi, and their square root value is then obtained numerically to determine the bandwidth of the speed controller, τbω. Thus, , where the desired speed controller bandwidth is normally chosen as , and . Hence, the speed controller gains are again chosen to be and .
4. Basic Structure of the QDBC
Figure 7 illustrates the basic architecture of the newly suggested quadruple-diode boost converter (QDBC). The QDBC is made up of a DC power source, smoothing inductors (L1, L2, and L3), a single power electronic switch (MOS), capacitive filters (C1, C2, C3, and Co), four diodes (D1, D2, D3, and D4), and a DC resistive load, Ro.
Principle of Operation of the QDBC
The huge smoothing inductors provide nearly constant inductor currents, while the average inductor voltage of the DC-DC converter is zero, in accordance with the voltage-second area balancing principle. Furthermore, due to their high capacitance values, capacitive voltages reflect essentially pure DC and unbroken waveforms, whereas capacitive currents have zero mean values under equilibrium state conditions. Table 1 outlines the essential characteristics required for effectively modeling and simulating a Quasi-Dual-Bridge Converter (QDBC) (China, Dongguan Xuansn Electronic Tech. LTD) operating in continuous conduction mode (CCM). In this mode, energy transfer is maintained through inductor currents that do not drop to zero. Consequently, during the suggested operation in CCM, the MOS switch remains active for a duration of and inactive for the remaining time, . Here, the parameter D denotes the DC output-to-input voltage ratio ratio of the primary switch in the QDBC, as detailed in [11].

Table 1.
QDBC manufacturer specification parameters.
The suggested converter operates in two modes: the on-regime of its main switch MOS during the interval of and the off-regime during the interval of . The voltage, power, and current simulation waveforms for and an operating frequency of 2 kHz are displayed in Figure 8, which was created using Ansoft.
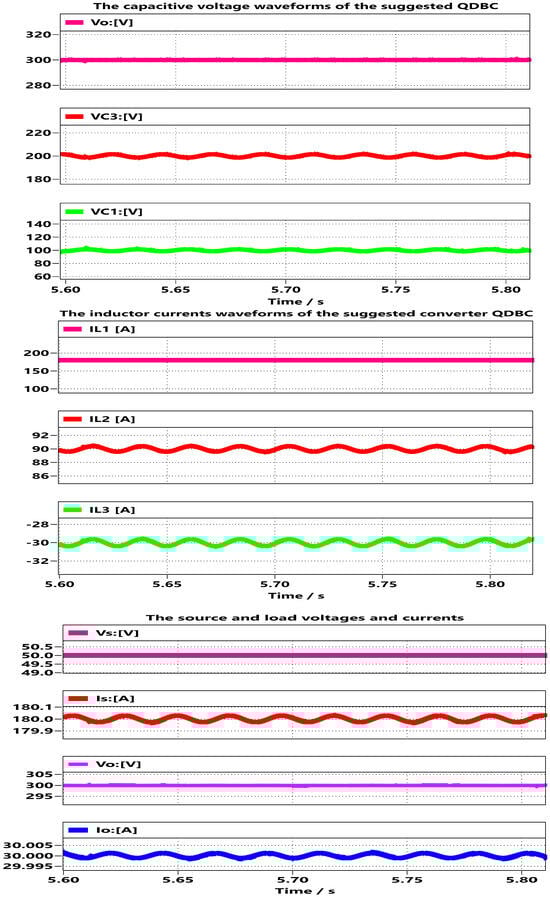
Figure 8.
Simulation of QDBC current and voltage waveforms for ; the frequency of the QDBC is .
Using inductor currents as state-dependent variables, the output-to-input voltage ratio can be expressed using the equations that follow [11]:
- Diode D2 activates in tandem with the MOS switch. Thus:
As a result, the fluctuation in the power source current passing through the inductor L1 when the switch is activated is:
- 2.
- Diode D2 is turned off when the MOS switch is deactivated. Thus:
The power source current homogenized ripple is:
Therefore, in accordance with [11], the homogenized current ripple for the source current is as follows:
where ∆is represents the homogenized ripple of the power source current in relation to the shifting ratio, D. Utilizing the previously mentioned average values of the EMF voltages under optimal operating circumstances during the operational phase, the following equations can be derived:
Substituting and from the previous Equations, one may get [11]:
By properly adjusting the output-to-input voltage ratio D, the output voltage may be regulated as the voltage generated at the input varies.
The following challenges may arise from examining the previous equivalent circuits for the inductor current ripple:
where f is the operating frequency of the QDBC and L is the common inductance of all converter inductors. As the output-to-input voltage ratio D shifts from zero to unity, Figure 9 displays the inductor current homogenized ripple curves (∆iL1, ∆iL2, and ∆iL3). For QDBCs, the inductor current homogenized ripple is a commonly used design parameter [20,21,22,23,24,25].
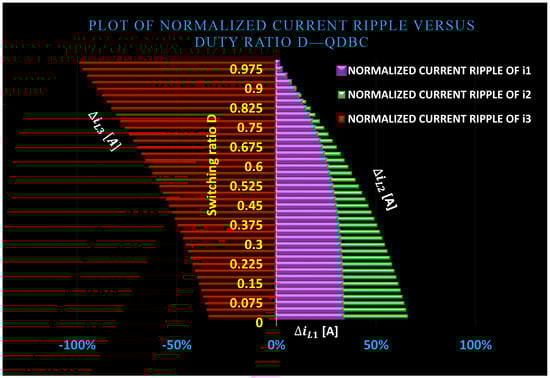
Figure 9.
The homogenized ripples of the QDBC’s inductor currents (f L1 ∆iL1, f L2 ∆iL2, and f L3 ∆iL3) when the output-to-input voltage ratio D shifts from zero to unity. Plots are produced for and .
The critical inductances of the QDBC are determined using the following formula, according to the average mean values of the inductor currents at the suggested converter’s edge of discontinuous operation mode:
The formulas for determining the absolute value of the capacitor voltage ripples can be derived according to reference [11]:
We can write the following ideal values for the capacitances of the various capacitors according to the maximum values of the respective voltage ripples:
The homogenized voltage ripple across the capacitors that are being studied is shown in Figure 10. is the highest value of , whereas D = 0.5 is the maximum value of . The switching frequency, f, duty cycle, D, and maximum voltage ripple, , may all be used as designing factors to build the capacitors.
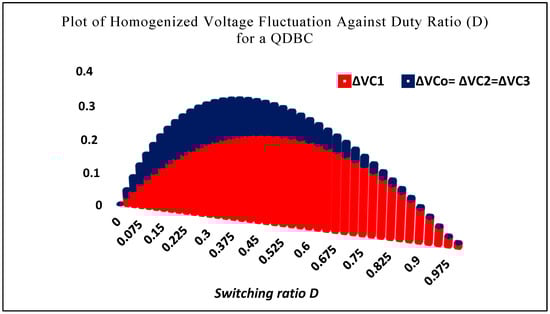
Figure 10.
Graphs of the capacitor voltage homogenized ripples. and are created for and when the switching ratio D shifts from zero to unity.
The QDBC is evaluated against the inversion buck/boost converter (BB), boost converter, and SEPIC using PWM modulation techniques. The comparison considers structural complexity, aggregated average value, repaired average value, effective median value (RMS) at the basic frequency, AC component RMS value (RMSAC), crest factor, standard ripple factor, cohesive factor, and distortion caused by harmonics [1]. The findings show that the QDBC demonstrates higher efficiency, offers greater voltage gain, and exhibits superior dynamic performance.
5. Modeling of the PV System
To achieve the desired voltage output, a certain number of solar photovoltaic cells, also known as PV modules, are usually connected in series or/and parallel to make up the solar system configuration. The system’s components include an HPPT controller, an inverter, a battery charge controller, and some low-voltage switchgears in addition to the solar PV module [23,24,25].
5.1. Equivalent Circuit of the Suggested PV Cell
The intricate physics governing a PV cell can be illustrated through the equivalent electrical circuit depicted in Figure 11.
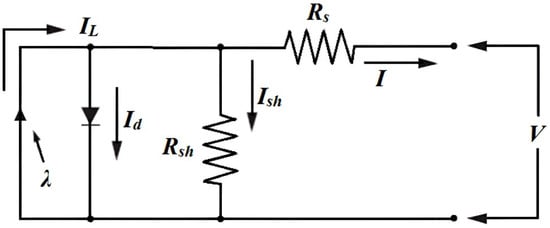
Figure 11.
A PV (photovoltaic) cell’s equivalent electrical circuit.
The circuit parameters are as follows:
The current (I) at the output terminals is determined by subtracting the current through the diode (Id) and the leakage shunt current (Ish) from the light-produced current (IL). The series resistance (RS) arises from factors such as contact resistance, impurities, and the depth of the pn junction, and it is considered an internal resistance present before current flow occurs. Shunt resistance (Rsh), on the other hand, is usually attributed to defects in production rather than subpar PV cell construction. Low shunt resistance can lead to losses of power in solar cells, as it provides a different route for the current generated by light [25,26,27,28].
Series and shunt resistances in solar cells are parasitic characteristics that influence both efficiency and the illuminated current–voltage (I–V) behavior of the cells. Extremely low shunt resistance (Rsh) and excessively high series resistance (Rs) can, respectively, reduce the open-circuit voltage (Voc) and short-circuit current density (Jsc). The following formula can be used to get the open-circuit voltage (Voc) of the cell when the load current is zero, or when :
The traditional diode current expression provides the following formula for diode current:
where:
ID is the saturation diode current.
Q is the electron charge of the diode (1.6 × 10⁻¹⁹).
A is the curve fitting constant.
K is the Boltzmann constant (1.38 × 10⁻²³ J/K).
T is the absolute temperature in K.
Therefore, the following expression gives the load current:
It is typically disregarded in realistic cells since it is insignificant in comparison to IL and ID. Thus, the saturated diode current can be determined empirically by providing a voltage Voc to the cell in the dark and tracking the current entering the cell. This current is also known as the dark current or the reverse saturated diode current [23].
5.2. I–V and P-V Curves of the Suggested Solar Cell
When fully illuminated, the short-circuit current (Isc) and the open-circuit voltage (Voc) stand out as the two key parameters commonly used to define the electrical performance of cells. The short-circuit current is measured by connecting the output terminals and recording the resulting terminal current. In the absence of terminal voltage, the short-circuit current corresponds to the photocurrent (IL), with negligible contributions from diode and ground leakage currents, as noted in references [25,26,27].
The open-circuit voltage is the maximum photovoltaic output voltage that is generated under a zero-ground leakage current. Thus, if , then:
The voltage, represented as kT/Q, is 0.026 V at 300 K. In realistic cells, the reverse saturation current is considerably smaller than the photocurrent, often differing by several orders of magnitude. Consequently, the open-circuit voltage is substantially greater than the kT/Q ratio. When exposed to continuous light, the IL/ID ratio is highly sensitive to cell temperature, leading solar cells to typically exhibit a negative coefficient of temperature for the open-circuit voltage.
Figure 12 shows the I–V and P-V properties of the solar module that is suggested in this paper. Figure 12’s top portion displays the I–V characteristic of a 210 W panel at two distinct temperatures (25 and 45 degrees) and a solar illumination intensity of 1000 W/m2. Another reference condition used by the industry to report I–V curves is 500 W/m2 sun intensity.
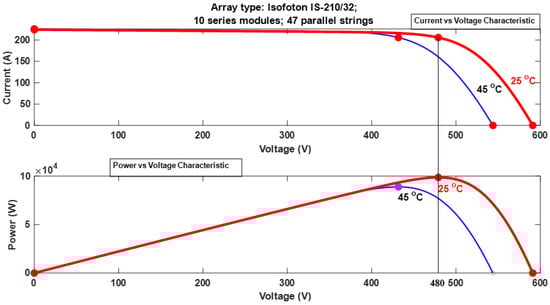
Figure 12.
(I–V) and power versus voltage characteristics of the suggested PV module (25° and 45°).
The short-circuit current is characterized by the point where the voltage at the top left corner of the I–V curve in the first quadrant is zero. This current is measured with the output terminals shorted, meaning the voltage is zero. In contrast, the open-circuit voltage is observed at the bottom right of the curve, where the current is zero. When the output terminals are open and there is no current flowing, this voltage would be detected. The power at the output is calculated by multiplying the panel’s output voltage and current. A plot of power against voltage is also shown at the bottom of Figure 12. At the voltage that corresponds to the I–V curve’s knee point, the cell produces its highest amount of power. It is crucial to remember that when either the voltage or the current is zero, the cell produces no power.
5.3. Highest Power Point Tracking
Highest power point tracking (HPPT) solar PV modules are designed to maximize electricity production. Unlike mechanical tracking systems, HPPT relies on a control system that operates through a specific tracking algorithm. By adjusting to variations in temperature and sun irradiation, these algorithms aid in optimizing power output from solar arrays. The voltage at which a photovoltaic module may generate the most electricity is known as the “highest power point,” or peak power voltage. This highest power point is influenced by a number of factors, including solar radiation, the temperature of the solar cells [25,26,27].
The PV module discussed in this paper generates power with a maximum voltage of roughly 17 V when operating under ideal conditions at a cell temperature of 25 °C. On particularly hot days, this voltage may decrease to about 15 V, whereas on very cold days, it can increase to around 18 V. The core concept behind highest power point tracking (HPPT) is to operate the PV modules at their most efficient voltage level, enabling the extraction of maximum electricity. The fundamental principle of the HPPT algorithm revolves around optimizing the power output from the PV module to charge the battery effectively. It calculates the maximum power output the PV module can provide and optimizes it to align with the ideal voltage needed to maximize current flow into the battery. This involves assessing the PV module’s output and matching it with the battery’s voltage level.
The core logic of the HPPT algorithm is as follows: It determines the maximum power output that the PV module can deliver for charging the battery and adjusts this to the optimal voltage, ensuring the battery receives the highest possible current. The HPPT continuously evaluates and compares the PV module’s output with the battery’s voltage.
5.3.1. Perturbation and Observation (P&O)
The perturbation and observation (P&O) method is one of the most popular methods for highest power point tracking (HPPT). Its popularity stems from its simplicity and reliable performance under steady radiation conditions. A major advantage of this method is its ease of implementation, as it requires minimal computational effort. However, a notable drawback arises when there are rapid changes in environmental conditions. In such cases, oscillations can occur around the highest power point, causing the system to deviate and track in the wrong direction. The P&O technique relies on one voltage sensor and one current sensor to measure the current and voltage of the PV array, enabling the calculation of power. The process involves adjusting the operating voltage of the DC link between the PV array and the power converter, as well as modifying the output-to-input voltage ratio of the converter.
The perturbation and observation (P&O) method is a widely used approach for highest power point tracking (HPPT), favored for its simplicity and dependable performance under stable radiation conditions. One of its significant advantages lies in its straightforward implementation, requiring minimal computational resources. However, a key limitation emerges during rapid fluctuations in environmental conditions. Under such scenarios, the method can generate oscillations near the highest power point, potentially leading the system to veer off course and track incorrectly. The P&O method utilizes a voltage sensor and a current sensor to measure the PV array’s voltage and current, enabling the computation of power. The process includes fine-tuning the operating voltage of the DC link connecting the PV array to the power converter and adjusting the converter’s output-to-input voltage ratio to optimize performance.
Figure 13 shows the flowchart of the P&O algorithm, while Figure 14 presents the Simulink/Matlab model for implementing the HPPT method using the P&O algorithm. To minimize oscillations within the HPPT process, a saturation limit is applied to control voltage fluctuations [28,29,30]. In Figure 13, within the small-signal analysis of converters, the term (dp*dv), where (dp) represents the power differential and (dv) denotes the voltage differential, arises as a mathematical artifact from the complete non-linear equation. This term, which corresponds to a second-order (or second-differential) component, is generally disregarded due to the simplifying assumptions of the analysis. However, in this diagram, it is included solely for the purpose of deriving the AC component of the converter’s duty cycle (d*).
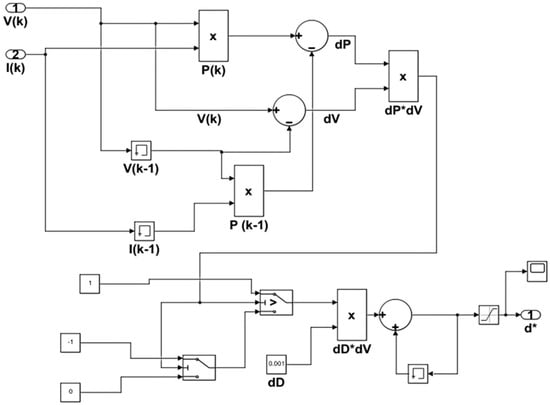
Figure 13.
Simulink/Matlab model of the P&O method. d*: Small-Signal Perturbation.
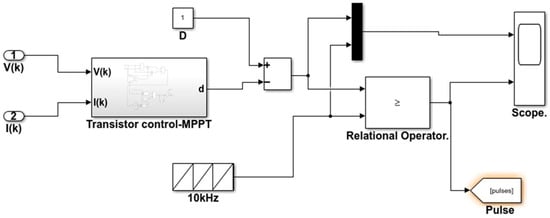
Figure 14.
Gating pulses to switch the module.
Figure 14 shows how the gating pulses for the module’s switches are created using a relational operator.
5.3.2. QDBC Comparison to the Boost Converter Using the Perturbation and Observation (P&O) Technique
To determine the behavior of the converter, the high-order QDBC is examined and compared to the boost converter using the simulation of the P&O technique in the logarithmic software implemented in Simulink/Matlab. The parameters utilized for the model of the boost converter and QDBC for simulation using the P&O technique are specified in Table 2.
Table 2.
Detail parameters of boost.
Figure 15 and Figure 16 show the boost converter current and voltage waveforms as well as the input and output powers and efficiency waveforms as it is integrated with the P&O technique with a temperature 25 °C and variation in irradiation of the solar panel from 1000 W/m2 to 600 W/m2.
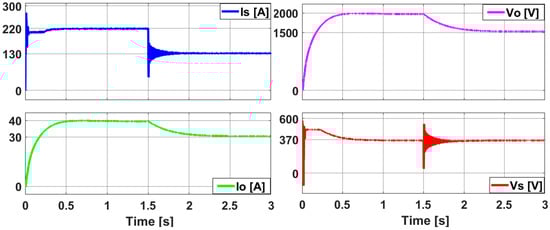
Figure 15.
The boost converter current and voltage waveform resulting from the P&O technique.
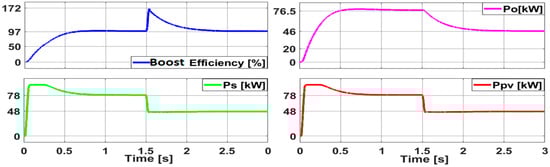
Figure 16.
The boost converter power and efficiency waveform resulting from the P&O technique.
The input/output current and voltage waveforms of the QDBC, along with the input/output powers and efficiency waveforms, are displayed in Figure 17 and Figure 18. The temperature is set to 25 °C, and the solar panel’s irradiation varies from 1000 W/m2 to 600 W/m2.
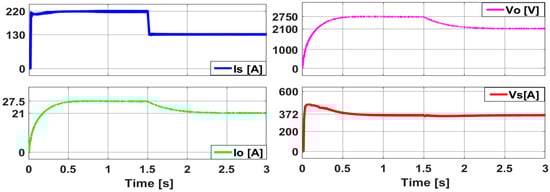
Figure 17.
The QDBC current and voltage waveform resulting from the P&O technique.
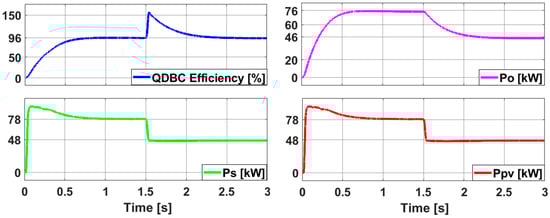
Figure 18.
The QDBC power and efficiency waveform resulting from the P&O technique.
The analysis indicates that the current and voltage waveforms generated by the boost converter, utilizing the HPPT-based P&O method, did not perform as intended and experienced oscillations prior to reaching the desired steady-state value, particularly evident at the 1.5 s mark. As illustrated in Figure 18 and Figure 19, integrating the QDBC approach with the HPPT-based P&O technique yielded results under irradiation levels ranging from 1000 W/m2 to 600 W/m2. These results reveal that the QDBC functions as a first-order system, offering a shorter settling time, higher input/output currents, voltages, and power outputs, while maintaining efficiency almost identical to that of the boost converter. Furthermore, in contrast to the boost converter, the QDBC ensures the absence of overshoots in its current and voltage waveforms.
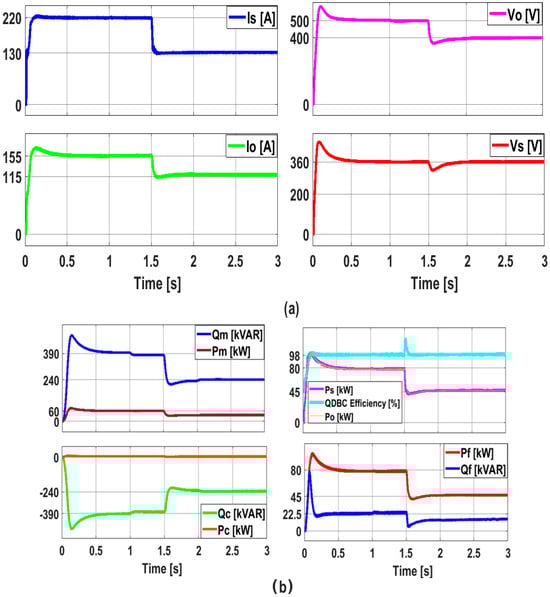
Figure 19.
The analysis of the suggested system under varying irradiation and load torque conditions involves the following key aspects: (a) a detailed study of the input and output voltages and currents of the QDBC, (b) an evaluation of active power and efficiency (Ps and Po) at both the photovoltaic module and the QDBC inputs/outputs.
6. Overall Simulation Results of the Suggested System (QDBC, VFI, SYNRM, and Mechanical Load)
This study examines the arrangement of PV panels, specifically the isofoton IS-210/32 (Isofoton, Madrid, Spain) modules, validated through a configuration comprising 47 parallel strings, each with 10 series-connected modules. The suggested system was simulated within the MATLAB 2021a/Simulink environment, featuring PV panels integrated with a QDBC, a VFI, and a SYNRM connected to a mechanical load. Detailed simulation parameters for the SYNRM system are provided in Table 3.
Table 3.
SYNRM parameters.
The system’s performance was assessed under varying test conditions: first, under irradiance levels transitioning stepwise from 1000 W/m2 to 600 W/m2, and second, with load torque adjustments in incremental steps from 0 to 12 N·m, followed by a decrease from 12 N·m to 6 N·m over a span of 3 s.
The dynamic performance of the suggested system is analyzed first by considering the response of the QDBC input/output voltages, currents, power, and efficiency to the variation in the irradiation and load torque (Figure 19). Thus, the irradiation is decreased from 1000 to 600 W/m2 within 3 s. When the irradiation decreases between the 1.5 s and 3 s span time, the voltages and currents of the QDBC also decrease, as observed in Figure 19a. Figure 19b shows the PV and the QDBC power curves and efficiency. The PV panels and QDBC exhibit a notable decrease in input current, output current, and output voltage (Is, Io, and Vo). In contrast, the QDBC input voltage, Vs, experiences a negligible decrement because of the algorithmic instructions incorporated into the HPPT-based P&O technique’s software.
The reduction in PV current also results in a drop in the maximum PV and QDBC power that is available. The maximum power is 80 kW at 1000 W/m2 of radiation and 40 kW at 6000 W/m2 of radiation. Furthermore, Figure 19b shows the power generated at the output of the VFI—both active and reactive, Pf and Qf—as well as the active/reactive power (Pc and Qc) of the RLC filter, which is positioned in between the inverter. Since the QDBC and VFI have nearly similar active powers, their respective efficiencies are roughly 98%, as shown in Figure 19b. Figure 19b illustrates the active and reactive powers provided to the SYNRM machine (Pm and Qm). The diagram reveals that once the RLC filter’s damping resistive elements consume a certain portion of active power, the P&O algorithm optimally extracts the maximum active power accessible from the PV panel to supply the machine.
However, the RLC filter produces a reactive power, Qc, which is then consumed by the SYNRM in the form of a magnetic field. The reactive power, Qc, produced by the transmission line and shunt filter shifts from −390 kVAR to −240 in 3 s. The SYNRM machine then accepts this reactive power as Qm. The machine is powered by an active power of 60 kW (Pm).
Figure 20 and Figure 21 show that the load torque step behavior is accompanied by a step-change in both the motor’s active and reactive power, as well as a step-change in PV power due to irradiation. Moreover, the machine continues to run almost at the same speed even after the load torque or the PV irradiation is drastically reduced or increased. This demonstrates that the oriented-field controlled VFI and the suggested QDBC, when combined with the P&O algorithm, can run the SYNRM machine at a nearly constant speed, which is necessary for the stabilized water pumping operation.
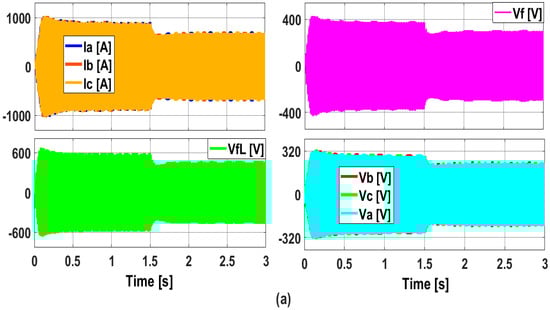
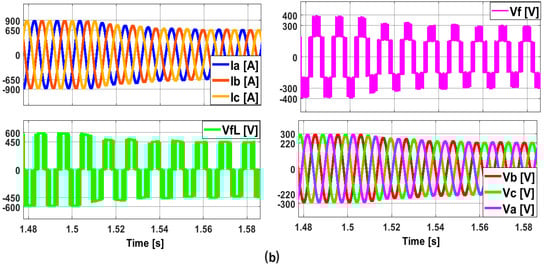
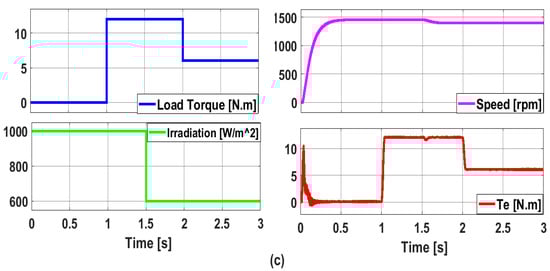
Figure 20.
Response of the suggested system to a step change in the irradiation and in the load torque. (a) Transient respective. (b) Snapshot steady-state overall waveform of the phase voltages (Va, Vb, and Vc), the phase currents (Ia, Ib, and Ic) of the RLC shunt filter, and the inverter VFI output line voltage (VfL) and phase voltage (Vf). (c) The radiation (1000 W/m2 and then 600 W/m2), the load torque (0 N·m, 12 N·m, and then 6 N·m), the SYNRM rotor’s speed, and the electromagnetic torque, Te.
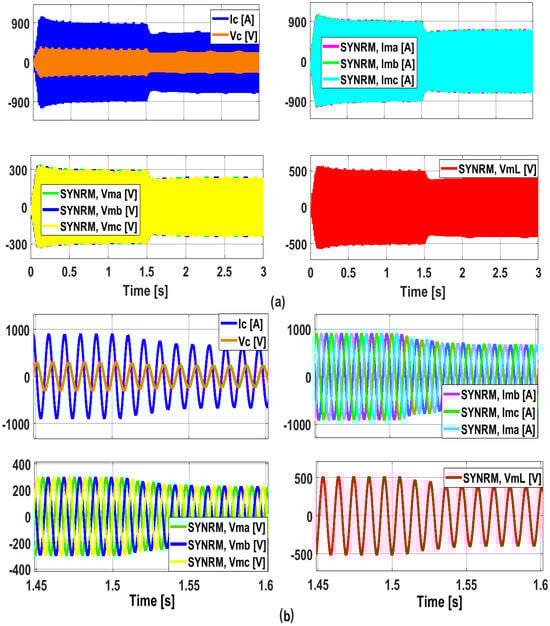
Figure 21.
Response of the suggested system to a step change in the irradiation and in the load torque. (a) The waveform of the SYNRM line voltage, VmL, concerning the input/output phase voltages and currents (Vma, Vmb, Vmc, Ima, Imb, and Imc). (b) A steady-state image of the SYNRM phase voltages and currents waveform. The phase voltage of the capacitive element in a shunt filter is represented by voltage Vc and current Ic.
The transient behavior and a snapshot of the steady-state waveform of the phase currents and voltages at the VFI’s output are depicted in Figure 20a and Figure 20b, respectively. When the PV irradiation drops from 1000 to 600 W/m2, Figure 20b illustrates how the VFI’s phase currents, Ia, Ib, and Ic shift from a maximum value of 850 A to a maximum value of 620 A. Simultaneously, the input phase voltages (Va, Vb, and Vc) of the SYNRM shift from an approximately 300 V maximum value to a 235 V maximum value. The VFI’s output phase voltage, Vf, varies from a 360 V maximum value to a 280 V maximum value, while the VFI’s line voltage changes from a 620 V maximum value to a 470 V maximum value.
Figure 20c displays the electromagnetic torque, which likewise follows the PV power. The fact that a QDBC generates pure DC current and voltage at its output is one of its main benefits. Compared to the boost converter, the QDBC has more L and C components in its circuit; therefore, it does not need any extra filter circuits to generate a smooth output.
Figure 20c also depicts the motor’s no-load speed, which is approximately 1485 rpm. When the load torque varies from no-load to 12 N.m. at 1 s, the motor speed stays nearly constant with only a very slight reduction of 5 rpm. Nevertheless, the motor speed drops to 1450 rpm as the PV irradiation drops 40% of its 1000 value to 600 W/m2 at 1.5 s. In comparison to the 40% decrease in PV irradiation, this represents only a 2.3% decrease of 35 rpm from its prior value.
Figure 21 is used to illustrate the response of the suggested system to a step shift in the load torque and radiation. The SYNRM line voltage waveform, VmL, with respect to the input/output phase voltages and currents (Vma, Vmb, Vmc, Ima, Imb, and Imc) is shown in Figure 21a. A picture of the SYNRM phase voltage and current waveform in steady condition is shown in Figure 22b. Voltage Vc and current Ic in a shunt filter indicate the phase voltage of the capacitive element.
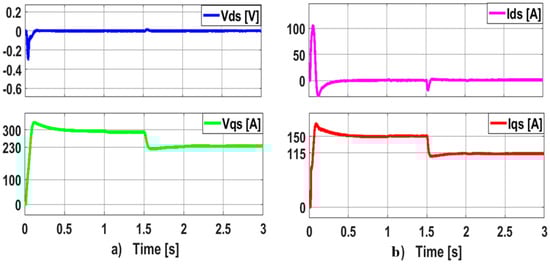
Figure 22.
Response of the suggested system to a step change in the irradiation and in the load torque: (a) dq-stator voltages and voltages of the SYNRM, (b) dq-stator currents of the SYNRM.
Stator dq-axis currents and voltages, as shown in Figure 22, follow the PV current waveform and irradiation fluctuation and are perfectly coupled, but they do not alter in response to changes in load torque.
7. Experimental Implementation of the Suggested Regulator QDBC
Figure 23 illustrates the hardware test bench designed for the suggested QDBC regulator. The technical specifications of the experimental 40 W model are provided in Table 4. The performance results of the QDBC under the experimental setup are displayed in Figure 24 and Figure 25.
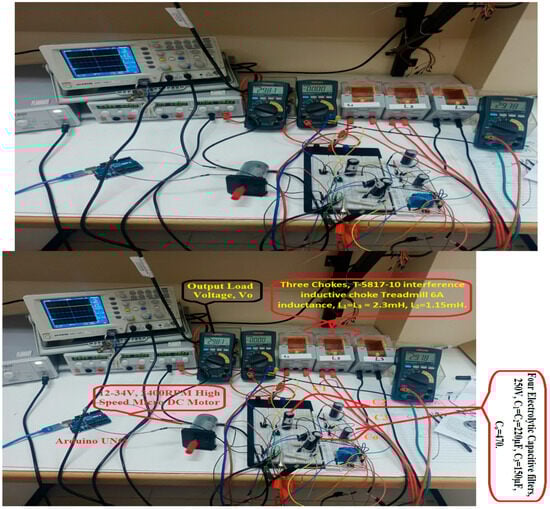
Figure 23.
Hardware setup for the recommended QDBC regulator without an X-bridge filter.
Table 4.
QDBC design specifications.
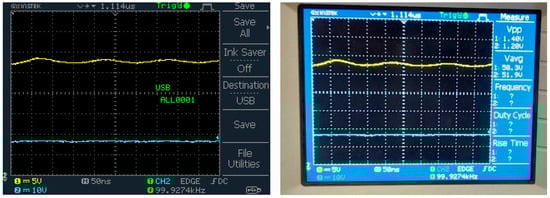

Figure 24.
Waveforms relevant to the suggested regulator, QDBC, with a resistor–inductor 50 W load.
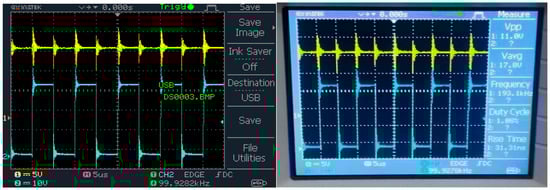
Figure 25.
The suggested regulator (QDBC) was implemented once more using an Arduino IDE UNO paired with a pulse generator. It was operated at a 20 kHz frequency to demonstrate the voltage stress across the MOSFET transistor, depicted in blue, and the diode D3, depicted in yellow.
Considering the approximate 0.5 V drop caused by the circuit, the specifications indicate a resistor–inductor load of 40 W powered by a supply voltage of 9.5 V. The system is switched at a frequency of 10 kHz. The test findings reveal that the QDBC achieved a voltage gain exceeding six times at a half output-to-input voltage ratio and eight times when operating at a duty cycle of 0.6. Based on mathematical analysis, the expected load voltages for duty cycles of 0.3, 0.5, and 0.6 are 25.2 V, 57 V, and 95 V, respectively. This highlights an impressive efficiency ranging between approximately 92% and 94%, which is further validated by the empirical results presented in Figure 24 and Figure 25, as well as the supporting video. The load current is determined by measuring the voltage drop across a resistor:
- The system outputs a 52 V load voltage, represented in yellow, and a 1.5 A load current, shown in blue, with an output-to-input voltage ratio (D) of 0.5. This configuration is used to power a high-speed micro-DC motor (2400 RPM) with a voltage range of 12–34 V.
- For a load consisting of a 3.3 mH inductor and a 200 Ω resistor, the output characteristics are as follows: At a switching duty cycle of D = 0.6, the load voltage reaches 92 V (depicted in yellow), while the load current measures 1.8 A (depicted in blue).
- With an output-to-input voltage ratio of 0.3, the load voltage drops to 25 V (illustrated in yellow) while maintaining a load current of 1.5 A, shown in blue. Additionally, compared to the output voltage, the stress on the main transistor (MOSFET), as indicated in Figure 25, remains within the specified range at approximately 17 V (blue).
The QDBC represents a relatively new innovation in the high-performance regulator industry, owing to its distinctive voltage gain characteristics. Its exceptional capability to modify the correlation between input and output voltages positions it as a promising choice for applications requiring precise voltage profiles. Unlike traditional step-up regulators that typically rely on linear voltage gain, the QDBC operates differently, offering enhanced reliability and reduced output fluctuations, which have garnered significant attention. The suggested regulator (QDBC) incorporates an Arduino IDE UNO and a pulse generator for programming purposes. It is configured to work with an output-to-input voltage ratio of 0.3 and a 20 kHz frequency. The output includes a load voltage of 52 V, represented in yellow, and a load current of 1.5 A, shown in blue.
- The output consists of a voltage of 91 V (represented in yellow) with a corresponding current of 1.8 A (depicted in blue), as well as a voltage of 26 V (represented in yellow) accompanied by a current of 1.5 A (depicted in blue).
8. Conclusions
This study examines the dynamic behavior of a system consisting of a PV solar panel, QDBC, VFI, SYNRM, and mechanical load. The analysis takes into account changes in irradiance (from 1000 to 600 W/m2) and load torque (from 0 N.m. to 12 N.m. and eventually to 6 N.m.).
The “quadruple-diode boost converter”, or QDBC, is a newly suggested boost converter to provide solar PV applications with a better voltage gain, lower input/output voltage, current standardized ripple specifications, and better efficiency. The QDBC topology that is suggested has a peak efficiency of 95–98% and a conversion voltage gain of
In contrast to other common DC-DC converters (such as buck, SEPIC, boost, and buck/boost), the QDBC performs better dynamically and has a higher voltage gain and improved efficiency. Moreover, two PI controllers are used to observe and disrupt the suggested QDBC’s dynamic performance.
The synchronous reluctance motor (SYNRM) has now reached a competitive level with induction machines, largely due to an improved saliency ratio. This advancement is particularly evident when evaluating factors such as the power factor and the inverter’s kVA requirements. Compared to field-oriented controlled induction machines, regulating small to medium-sized high-performance motors appears more manageable with the application of SYNRM technology. Analytical and simulated findings demonstrate that the recommended QDBC regulator can theoretically achieve a peak efficiency of 98%. Additionally, the DC-DC converter equipped with a hysteresis current controller can be integrated seamlessly during operation, enhancing system redundancy, adaptability, and flexibility. Employing hysteresis current control for regular evaluation of converter characteristics can also mitigate the risk of cybernetic attacks. The QDBC regulator operates in conjunction with hysteresis current control, which effectively minimizes harmonic distortion in both voltage and current, thereby improving system performance. This approach is further reinforced by the field-oriented control of the VFI combined with the perturbation and observation (P&O) technique, designed to maximize power extraction from PV modules. Moreover, this combination facilitates a smooth start for the synchronous reluctance motor. The P&O method remains one of the most widely adopted techniques for highest power point tracking (HPPT) due to its simplicity and reliable behavior under stable radiation conditions. Renowned for its ease of implementation, the method demands minimal computational resources. However, it faces challenges under rapidly fluctuating environmental conditions, where oscillations near the highest power point may arise, potentially leading to tracking errors. The P&O method relies on current and voltage sensors to measure the PV array’s output parameters, enabling the calculation of power. The process entails precise adjustment of the DC link’s operating voltage between the PV array and power converter while fine-tuning the converter’s output-to-input voltage ratio for optimal performance. A Simulink/Matlab model was developed to execute HPPT via the P&O algorithm. To address oscillations within the HPPT mechanism, a saturation limit was introduced to control voltage instability effectively. Experiments integrating the QDBC approach with HPPT-driven P&O techniques were conducted under irradiation conditions spanning 1000 W/m2 to 600 W/m2. The findings revealed that the QDBC operates as a first-order system, providing quicker settling times and higher input/output currents, voltages, and power outputs while maintaining similar efficiency levels to those of the boost converter. Unlike the boost converter, however, the QDBC ensures waveform stability by eliminating overshoots in current and voltage outputs.
The simulation clearly shows that the P&O algorithm maximizes the panel’s power output in response to variations in irradiation when paired with the recently suggested QDBC. The prior validation of the suggested system demonstrates that the P&O algorithm with the QDBC is able to extract the maximum power from the panel even in situations when the irradiation fluctuates sufficiently.
In comparison to traditional water pumping systems, the input DC voltage required for the suggested stand-alone SYNRM with a QDBC is higher. As a result, the suggested configuration greatly boosts the PV input and raises the system’s power density. The VFI’s output terminals generate a pure sine wave when the QDBC is used in conjunction with the field-oriented controlled VFI; no further filters or unique modulation methods are required. With a modified P&O algorithm, the speed reference for outer-loop speed control is produced. Additionally, the FOC method is used to control the SYNRM. The simulation results show how effective the suggested arrangement is when the load torque and irradiation change.
The synchronous reluctance motor (SYNRM) stands out for its superior stability and dynamic performance compared to induction motors (IMs) and permanent-magnet synchronous motors (PMSMs), particularly in scenarios involving variable irradiance and partial shading. Its rotor design is simple and robust, free of conductive elements such as cages or permanent magnets. This not only makes the motor highly reliable but also minimizes its sensitivity to temperature variations. SYNRMs are highly efficient across a range of applications, making them ideal for driving various types of irrigation pumps, including centrifugal, submersible, and surface models. Their efficiency remains high over a broad speed range, featuring a relatively flat efficiency curve that ensures optimal operation at partial loads—typical in zoned or variable-demand irrigation systems. Moreover, the compact and durable construction of these motors, especially those integrating drives tailored for submersible use, makes them particularly suited for deep-well water pumping. The absence of rotor windings significantly reduces heat generation, which enhances reliability and extends bearing longevity in submerged, often oil-cooled environments. By operating at lower temperatures, SYNRMs mitigate thermal stress on components, increasing the overall lifespan of the system. This technology has strong scalability potential for industrial applications, though ongoing research continues to refine its performance in critical areas. Integrating a synchronous reluctance motor (SYNRM) with a QDBC presents notable advantages in scalability, cost-effectiveness, and environmental sustainability. This combination is especially beneficial in applications requiring higher power output levels and substantial voltage gains. The QDBC topology provides significantly enhanced voltage gain compared to traditional boost converters, even at lower duty cycles. This feature is essential for converting lower input voltages from sources like batteries or renewable energy systems into higher voltage outputs suitable for industrial demands. Cutting-edge designs incorporating coupled inductors and voltage multiplier cells distribute voltage stresses across components and switches, enabling the use of lower-rated switches while maintaining high reliability at elevated power levels. With operational efficiencies frequently exceeding 95–98% in prototypes, paired with the SYNRM’s ultra-premium efficiency, these systems achieve reduced operational costs over their lifecycle, yielding a high return on investment.
Author Contributions
Conceptualization, W.E., H.A., A.J., H.K., F.G. and M.A.; Methodology, W.E., H.A., A.J., H.K., F.G. and M.A.; Software, W.E., H.A., A.J., H.K., F.G. and M.A.; Validation, W.E., H.A., A.J., H.K., F.G. and M.A.; Formal analysis, W.E., H.A., A.J., H.K., F.G. and M.A.; Investigation, W.E., H.A., A.J., H.K., F.G. and M.A.; Resources, W.E., H.A., A.J., H.K., F.G. and M.A.; Data curation, W.E., H.A., A.J., H.K., F.G. and M.A.; Writing–original draft, W.E.; Writing–review & editing, W.E., A.J. and F.G.; Visualization, W.E., H.A., A.J., H.K. and F.G.; Supervision, W.E.; Project administration, W.E.; Funding acquisition, W.E., H.A., A.J., H.K., F.G. and M.A. All authors have read and agreed to the published version of the manuscript.
Funding
This study did not receive any external funding.
Data Availability Statement
All data produced or examined in this study are contained within the manuscript.
Acknowledgments
We extend our sincere gratitude to the leadership and administration of Zarqa University for their invaluable assistance in completing this research. Their financial support, professional guidance, and direction have been instrumental to the success of this work.
Conflicts of Interest
The authors declare no conflicts of interest.
References
- Kishta, A.M. Designing, Modeling, and Testing a Solar Water Pump for Developing Countries. Ph.D. Thesis, Iowa State University, Ames, IA, USA, 2002. [Google Scholar]
- Wang, J.; Jiang, C.; Li, M.; Chen, H.; Li, H. Renewable energy, agriculture, and carbon dioxide emissions nexus: Implications for sustainable development in sub-Saharan African countries. Sustain. Environ. Res. 2023, 33, 31. [Google Scholar] [CrossRef]
- Salih, H.R.; Abdulrazzaq, A.A.; Guzun, B.D. Dynamic Modeling of Pump Drive System utilizing Simulink/MATLAB Program. Int. Res. J. Eng. Technol. 2015, 3, 21–24. [Google Scholar]
- Waly, H.M.; Osheba, D.S.; Azazi, H.Z.; El-Sabbe, A.E. Induction motor drive for PV water-pumping system with high-gain non-isolated DC-DC converter. In Proceedings of the 2019 IEEE Conference on Power Electronics and Renewable Energy (CPERE), Aswan, Egypt, 19–21 March 2019; pp. 497–503. [Google Scholar]
- Niazi, P. Permanent-Magnet Assisted Synchronous Reluctance Motor Design and Performance Improvement. Ph.D. Thesis, Texas A&M University, College Station, TX, USA, 2005. [Google Scholar]
- Ayodele, T.R.; Ogunjuyigbe, A.S.O.; Ekoh, E.E. Evaluation of numerical algorithms used in extracting the parameters of a single-diode photovoltaic model. Sustain. Energy Technol. Assess. 2016, 13, 51–59. [Google Scholar] [CrossRef]
- Zaky, A.A.; Abdel-Aty, A.A.; Aboueisha, A.M.; Abd El-Halim, A.S. Energy efficiency improvement of water pumping system using synchronous reluctance motor fed by perovskite solar cells. Int. J. Energy Res. 2020, 44, 11629–11642. [Google Scholar] [CrossRef]
- Ben Ammar, R.; Ben Ammar, M.; Oualha, A. Photovoltaic power forecast using empirical models and artificial intelligence approaches for water pumping systems. Renew Energy 2020, 153, 1016–1028. [Google Scholar] [CrossRef]
- Alqaderi, M.; Emar, W.; Saraereh, O.A. Concentrated Solar Power Site Suitability using GIS-MCDM Technique Taken UAE as a Case Study. Int. J. Adv. Comput. Sci. Appl. (IJACSA) 2018, 9, 261–268. [Google Scholar] [CrossRef]
- Prabhakaran, K.K.; Karthikeyan, A.; Varsha, S.; Perumal, B.V.; Mishra, S. Standalone single stage PV-Fed reduced switch inverter based PMSM for water pumping application. IEEE Trans. Ind. Appl. 2020, 56, 6526–6535. [Google Scholar] [CrossRef]
- Emar, W.; Aljanaideh, A.; Jaber, A.; Musleh, M.; Emar, A.; Al-Nairat, M. Delta Modulation Technique and Harmonic Analysis for the Modified Quadruple-Diode Boost Regulator Without and With a Voltage Multiplier Unit (VMU). Energies 2025, 18, 2492. [Google Scholar] [CrossRef]
- Gao, S.; Zhao, K.; Zhang, H. Suggested quadratic high-gain boost converter. J. Power Electron. 2025, 25, 631–641. [Google Scholar] [CrossRef]
- Jayanthi, K.; Gnanavadivel, J.; Kaviya, K.; Manikandan, V.; Saravanan, C. Analysis and implementation of modified quadratic boost high-gain converter using voltage multiplier cell. Electr. Eng. 2025, 107, 4583–4600. [Google Scholar] [CrossRef]
- Wang, R.; Chen, Y.; Huang, J.; Wu, Y.; Kang, Y. A Hysteresis Current Controller for the Interleaving Operation of the Paralleled Buck Converters Without Interconnecting Lines. Electronics 2024, 13, 4928. [Google Scholar] [CrossRef]
- EL-Ebiary, A.H.; Mokhtar, M.; Mansour, A.M.; Awad, F.H.; Marei, M.I.; Attia, M.A. Distributed Mitigation Layers for Voltages and Currents Cyber-Attacks on DC Microgrids Interfacing Converters. Energies 2022, 15, 9426. [Google Scholar] [CrossRef]
- Huai, Q.; Ji, Y.; Yang, M.; Jie, Z.; Yuan, X.; Xu, X. Elimination Methods for High-Frequency Harmonics on the DC Side of Modular Multilevel Converters from the Perspective of Valve Control. Energies 2025, 18, 2655. [Google Scholar] [CrossRef]
- Ghosh, P.R.; Das, A.; Bhuvaneswari, G. Analysis and implementation of a new method to retain the original speed and torque of synchronous reluctance motor during sustained voltage dip. IET Electr. Power Appl. 2019, 13, 1365–1377. [Google Scholar] [CrossRef]
- Kim, J.; Jeong, I.; Lee, K.; Nam, K. Fluctuating current control method for a PMSM along constant torque contours. IEEE Trans. Power Electron. 2014, 29, 6064–6073. [Google Scholar] [CrossRef]
- Sumathi, S.; Kumar, L.A.; Surekha, P. Solar PV and Wind Energy Conversion Systems, An Introduction to Theory, Modeling with MATLAB/SIMULINK, and the Role of Soft Computing Techniques; Springer: Cham, Switzerland, 2015. [Google Scholar]
- Qinghua, L. Analysis, Design and Control of Permanent-Magnet Synchronous Motors for Wide-Speed Operation. Ph.D. Thesis, National University of Singapore, Singapore, 2005. [Google Scholar]
- Emar, W. Hysteresis current-mode regulated modified sepic-buck converter used for solar photovoltaic systems. Arab. J. Sci. Eng. 2024, 49, 7053–7077. [Google Scholar] [CrossRef]
- Pompodakis, E.E.; Orfanoudakis, G.I. Efficient integration of buck converter into an active rectifier for DC-fault current limitation in DC networks. e-Prime—Adv. Electr. Eng. Electron. Energy 2025, 13, 101053. [Google Scholar] [CrossRef]
- Rahman, T.; Deb, N.; Larguech, S.; Moniruzzaman, M.; Jizat, N.M.; Alharbi, S.S.; Al-Bawri, S.S. Active DC to DC converter based battery charge balancing systems from renewable energy by using electric vehicle. Energy Rep. 2025, 14, 1114–1136. [Google Scholar] [CrossRef]
- Emar, W. A new Modified Class of SEPIC Converter Processor with PV and A/C Integrated Circuit Systems. J. Circuits Syst. Comput. 2021, 30, 2150176. [Google Scholar] [CrossRef]
- Olayiwola, T.N.; Hyun, S.-H.; Choi, S.-J. Photovoltaic Modeling: A Comprehensive Analysis of the I–V Characteristic Curve. Sustainability 2024, 16, 432. [Google Scholar] [CrossRef]
- Tirado-Serrato, J.G.; Sanchez, A.; Maximov, S. Parametrization of I–V characteristics of solar cells via asymptotics solutions of the super-ellipse model. Sol. Energy 2025, 300, 113797. [Google Scholar] [CrossRef]
- Liu, Y.; Li, K.; Zhou, B.; Li, X.; Li, P. Optimal design of solar cells grid electrodes According to quadratic curves. Results Eng. 2025, 27, 106322. [Google Scholar] [CrossRef]
- Negami, T.; Sawaki, K.; Mavlonov, A.; Kawano, Y.; Minemoto, T. Analyses of I–V curve hysteresis in perovskite solar cells using circuit simulator. Sol. Energy 2023, 265, 112087. [Google Scholar] [CrossRef]
- Piegari, L.; Rizzo, R. Adaptive perturbation and observation algorithm for photovoltaic Highest power point tracking. IET Renew. Power Gener. 2010, 4, 317–328. [Google Scholar] [CrossRef]
- Jung, W.-S.; Lee, H.-K.; Lee, Y.-K.; Kim, S.-M.; Lee, J.-I.; Choi, J.-Y. Analysis and Comparison of Permanent-magnet Synchronous Motors According to Rotor Type under the Same Design Specifications. Energies 2023, 16, 1306. [Google Scholar] [CrossRef]
Disclaimer/Publisher’s Note: The statements, opinions and data contained in all publications are solely those of the individual author(s) and contributor(s) and not of MDPI and/or the editor(s). MDPI and/or the editor(s) disclaim responsibility for any injury to people or property resulting from any ideas, methods, instructions or products referred to in the content. |
© 2025 by the authors. Licensee MDPI, Basel, Switzerland. This article is an open access article distributed under the terms and conditions of the Creative Commons Attribution (CC BY) license.