Abstract
With global energy systems shifting toward sustainable solutions, Dubai faces the challenge of meeting rising energy needs while minimizing environmental impacts. This study explores long-term (LT) strategic planning for Dubai’s power sector through a techno-environmental–economic lens. Using PLEXOS® modelling software (Version 9.20.0001) and official data from Dubai’s main utility provider, a comprehensive model examines medium- and LT energy pathways. The analysis identifies solar photovoltaic (PV) technology as central to achieving Dubai’s goal of 100% clean energy by 2050. It also highlights the need to cut emissions from natural gas (NG) infrastructure, targeting a goal of 14.5% retirement of NG energy generation capacities by the mid-century. Achieving zero-emission goals will require complementary technologies such as carbon capture (CC), nuclear energy, and energy storage as part of a broader decarbonization strategy. This study further assesses the economic effects of climate policy, showing that moderate carbon pricing could increase the Levelized Cost of Energy (LCOE) by an average of 6% across the forecast horizon. These findings offer valuable guidance for decision-makers and stakeholders, particularly the Dubai Electricity and Water Authority (DEWA), in advancing a carbon-neutral energy system. By 2050, Dubai’s total installed generation capacity is projected to reach 53.3 GW, reflecting the scale of transformation needed to meet its clean energy ambitions.
Keywords:
capacity expansion; clean energy; zero-emission; long-term; strategy; energy policy; PLEXOS 1. Introduction
Energy is the fundamental essence of our planet and has been steadily growing over the past decade, driven by several factors, including population growth. As global energy demand rises and constraints on fossil fuel resources persist, the need for alternative, sustainable, and reliable solutions becomes increasingly critical in multiple countries [1]. In response, countries worldwide are implementing strategies to transition toward a greener future and secure reliable power supplies [1,2]. These strategies aim to diversify energy resources to ensure the provision of a reliable and clean energy supply while maintaining financial feasibility for all communities and sectors. Moreover, as populations grow, the demand for energy intensifies, which underscores the necessity of long-term sustainable energy policies that address both accessibility and environmental sustainability for all communities and economic sectors [3].
Renewable energy (RE), notably solar and wind power, stand out as the predominant resources for the global energy transition due to their economic viability and environmental advantages [4]. They are derived from sources that are infinite and naturally restored such as solar energy and are continuously deployed to replace conventional power resources, thereby contributing to the decarbonization of electricity grids [5]. In addition to solar and wind energy, other renewable sources such as hydropower, biomass, geothermal, and nuclear energy also contribute significantly to the diversification of the energy mix. Hydropower, generated from flowing water, and geothermal energy, extracted from the earth’s heat, are two reliable and scalable renewable energy sources utilized in regions with suitable geological conditions [6]. Nuclear power is an alternative source of RE, relying on uranium as its primary fuel source in certain regions worldwide [7]. Wind energy, which can be deployed onshore or offshore, harnesses the kinetic energy of wind to generate electricity, offering a clean and abundant source of energy [8]. Solar energy, derived from the sun’s radiation, is another prominent RE source. In addition to being abundant and inexhaustible, solar power offers scalability and versatility, with PV panels capable of being installed on rooftops, in solar farms, and even integrated into building materials [9]. The growing phase-out strategies of fossil fuels have promoted the widespread adoption of RE sources as viable alternatives. This shift away from fossil fuels is driven by concerns about climate change and energy security, prompting governments to prioritize clean energy investments. As a result, RE technologies have seen rapid advancements and cost reductions, making them increasingly competitive in the global energy market. Additionally, RE’s potential to create jobs, drive economic growth, and boost energy resilience has accelerated its deployment across sectors [10].
The United Arab Emirates, an oil-field-based country, has been recognized globally as a key leader paving the path for a greener and sustainable future through energy diversification commitments. In 2017, the country launched its energy strategy, defining clear decarbonization goals for 2030 and an ambitious vision for 2050 [11,12]. The strategy prioritizes green investments in the energy sector, in which RE is playing an increasingly important role. The UAE Energy Strategy 2050 has announced several long-term predictions that significantly impact the energy sector through sustainable programmes aiming at carbon reduction without compromising energy security and economic stability. In the short term, the country aims to achieve a total installed capacity of 19.8 GW of clean energy by 2030, particularly solar energy, which has proven its capabilities and competitive advantage in response to climate change mitigation [11]. This is projected to create 50,000 job opportunities and achieve a grid emission factor of 0.27 kg of CO2/kWh by 2030 [11]. According to the countries’ strategic predictions, the contribution of clean energy in energy generation is therefore expected to become 32% and 38% by 2030 and 2035, respectively [11]. This will facilitate meeting the carbon emissions goals without significantly impacting the cost of electricity.
The United Arab Emirates, a major global player in the oil and gas sector, has heavily relied on fossil fuels to maintain a reliable energy supply. According to the energy statistics released by the International Energy Agency (IEA), the UAE has consistently demonstrated a clear reliance on natural gas (NG) as the predominant source of electricity supply in the country, spanning the period from 2000 to 2021, as indicated in Figure 1 [13,14].
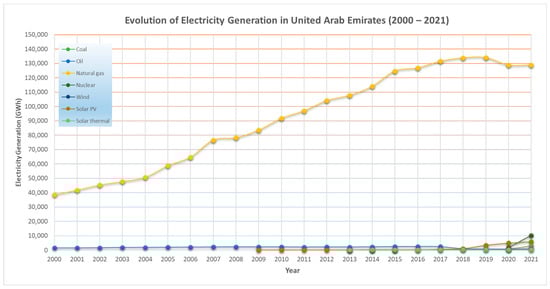
Figure 1.
Evolution of electricity generation in the United Arab Emirates since 2000 [13,14].
Nevertheless, in recent years, the country has demonstrated a strong commitment to decreasing its dependence on natural gas and has begun investing in RE resources like solar PVs [15]. A key principle of Sheikh Mohammed bin Rashid’s (MBR) Dubai Clean Energy Strategy is to create an environmentally favourable energy mix by 2030 consisting of solar energy (25%), nuclear power (7%), clean coal (7%), and gas (61%) [16,17]. In line with this strategy, the country places a special emphasis on solar energy, with projects like the MBR Solar Park in Dubai being among the largest solar installations globally. This park stands as evidence of the UAE’s commitment to harnessing the power of the sun, positioning itself as a pioneer in RE [18,19]. Additionally, the UAE has embraced nuclear energy to strengthen its energy security and satisfy the expanding needs of its growing economy. Barakah Nuclear Power Plant, located in the western part of Abu Dhabi, is a major step toward adding nuclear energy to the energy mix. This shows the UAE’s dedication to implementing cutting-edge and environmentally friendly technologies while also diversifying the country’s energy sources [20].
In the UAE, the power sector is primarily managed by two entities, namely, Dubai Electricity and Water Authority (DEWA) and Emirates Water and Electricity Company (EWEC). DEWA is responsible for power procurement in the city of Dubai, while EWEC oversees power procurement for Abu Dhabi and the northern emirates [21,22]. EWEC, playing a vital role in the UAE’s power sector, conducts an annual capacity expansion modelling study using PLEXOS® software to recommend new power generation assets needed to meet the region’s demand. A recent report in 2024 outlined recommendations for capacity expansion up to 2037, with the goal of achieving 60% of total clean energy by 2035 and eliminating the need for NG by 2050 [23,24]. Similarly, DEWA produces annual reports, including statistics, sustainability, and climate change overviews, which offer clear insights into the status and long-term planning of the power sector in Dubai. However, these reports may lack the in-depth capacity expansion models necessary to facilitate decision-making regarding future infrastructure development and energy resource allocation [25]. Within this context, the key research question of this study is as follows: What is the most cost-efficient and most reliable long-term energy mix for Dubai that aligns with its clean energy and emissions reduction targets?
Together, these entities constitute the primary contributors to the country’s power generation, ensuring a dependable and cost-effective supply of water and electricity to consumers. Furthermore, it is noteworthy that both DEWA and EWEC have defined clear goals aligning with the UAE government’s 2050 strategy. EWEC strives to contribute to the UAE Energy Strategy 2050 by advancing clean energy sources, including renewables and nuclear power, with the goal of achieving a 50% increase in the total energy mix, significantly contributing to reducing the carbon footprint by 70% [21]. Similarly, DEWA, one of the key pillars in the clean energy transition in the UAE, has recently announced its strategy to generate around 75% of its overall energy needs from renewable resources by 2050 [18]. Nonetheless, a crucial interim target has been established, targeting 25% clean energy via a diversification of the energy mix to include the four main components described earlier by 2030 [18,26,27]. However, in June 2022, DEWA amended its 2050 milestone, aiming to provide 100% from clean energy sources [28,29]. This announcement was supported by ambitious plans including but not limited to further expansion of the MBR Solar Park to a total production capacity of 5 GW by 2030, which is one of the significant projects contributing to the 2030 goals, in addition to the completion of hybrid renewable and energy storage projects, e.g., 950 MW at Noor Energy 1 combining CSP and PV, and 250 MW of pumped hydro storage for 6 h at Hatta to be completed in Q1 2025 [28,30]. Recently, DEWA published its annual statistical report for 2023, revealing a total installed capacity of 16,270 MW. This includes an increase in the share of gas turbines to 8528 MW compared to 2022, achieved through the partial addition of 553 MW to the Aweer Power Station H Phase IV (out of 829 MW in total). Furthermore, the completion of the Hassyan Power Plant added a final 600 MW to the steam turbines’ share by the end of 2023, totalling 5115 MW. Figure 2 below illustrates the breakdown of technology shares in Dubai by the end of 2023 in terms of installed capacity (MW), which was utilized as a starting point in this study [31]. In the near future, considering planned candidates in the city, these shares are expected to be distributed slightly differently, aiming for a cleaner energy mix with a total of 18,546 MW.
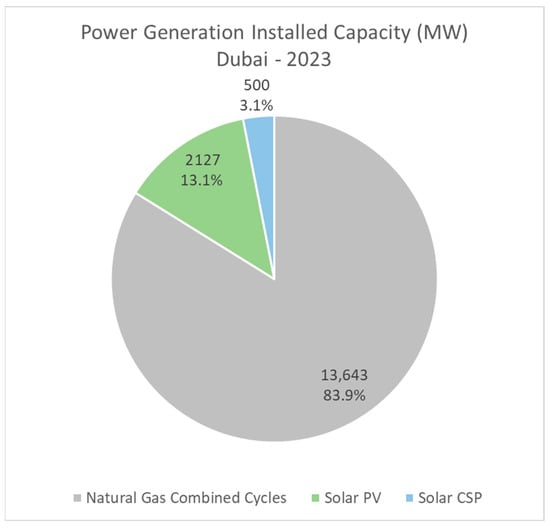
Figure 2.
Technology-based power generation installed capacity in Dubai by end of 2023 [31].
The clear goals outlined by both DEWA and EWEC, aligning with the UAE government’s 2050 strategy, provide crucial benchmarks for evaluating various scenarios and sensitivities in this analytical approach, which takes into account the ambitious targets as outlined by the UAE government in Table 1 [32].

Table 1.
UAE Energy Strategy 2050: detailed breakdown of the projected energy mix [32,33].
According to a recent report from prominent figures in the country, determining the ideal RE blend in the country, considering various technologies, e.g., PV, CSP, or wind, and the integration of ESS, presents a significant challenge [34]. In the UAE, competitive utility-scale bidding is the primary approach for building large-scale projects based on contractual agreements with off-takers, e.g., DEWA, EWEC, and the Federal Electricity and Water Authority (FEWA), for long-term operations. These tenders comprise mutually agreed-upon terms that are fundamentally required for designing, building, executing, and operating the project within the desired timeframe [34]. While annual reports provide valuable insights into the current state and long-term planning of the power sector in the UAE, there is a need for more detailed capacity expansion models to inform decision-making regarding future infrastructure development and energy resource allocation.
Various studies have employed PLEXOS® for capacity expansion assessments both locally and globally [35]. Countries like Australia [36], Pakistan [37], the KSA [10], and the UAE have leveraged PLEXOS® to model their electricity markets, facilitating the transition to sustainable and reliable energy futures. For instance, EWEC in Abu Dhabi regularly produces detailed capacity expansion plans to meet their decarbonization targets and recommends new power generation assets. In their 2024 report, EWEC projected an additional 3 GW of solar PV by 2028, with an average annual deployment of 1.4 GW of solar capacity between 2027 and 2037, supported by 400 MW of battery energy storage system (BESS) for system flexibility, particularly during winter. EWEC recognizes the importance of natural gas (NG) generation and flexibility in the short to medium term, as they employ gas-based units as a transitional measure to integrate more renewables [23]. Notably, EWEC plans for newly proposed gas-based generators to operate at minimal capacity factors to maintain supply reliability and meet emissions targets. Moreover, the plan to reconfigure existing assets provides additional flexibility, with expectations for them to operate at low capacity factors to enhance power security. This strategy resonates with findings from this study, where gas-based assets coupled with 97% Carbon Capture and Storage (CCS) are introduced at maximum allowable capacity factors, accompanied by significant reductions in existing assets’ capacity factors to mitigate their substantial emissions. Furthermore, EWEC emphasizes the critical role of integrating CCS units with newly proposed gas-based energy generation, ensuring flexibility in operations when necessary [23].
In Saudi Arabia (KSA), studies were conducted to assess potential deployment of RE in comparison to gas-based stations. Using PLEXOS®, a model was developed to evaluate emissions reductions and regional interconnection dynamics until 2040. The analysis highlights the complex dynamics of gas pricing and distribution, indicating a potential shift in demand distribution within regions if gas prices are raised or deregulated. The study demonstrates the significant advantage of integrating over 70 GW of solar PV in the Kingdom, particularly if gas prices are deregulated. Interestingly, despite substantial solar energy integration, the study did not propose any storage technologies. Additionally, it suggests that improving network interconnection may offer a more cost-effective solution than deploying storage technologies [10].
On a global scale, a ground-breaking study utilized PLEXOS® to develop a global electricity system model aimed at supporting deep decarbonization efforts facing ambitious climate goals. The model, comprising over 30,000 power plants from over 160 countries, represents a significant advancement in understanding large-scale interconnection challenges. Leveraging open data and technological advancements, the authors outline the model’s creation process, address limitations, and validate its accuracy by comparing it against historical data. Additionally, the model provides openly accessible and comprehensive datasets, allowing for collaborative research and serving as a reference for future studies [35].
This paper presents a detailed long-term capacity expansion strategy designed for DEWA, a leading power procurement entity in the UAE. The research addresses the critical question of identifying the best energy mix that fulfils the city’s rising electricity demands without compromising environmental sustainability. The strategy integrates both medium- and long-term approaches to ensure that the city’s energy goals are met in alignment with its broader sustainability and economic objectives. The proposed expansion plan includes the addition of new generation capacities strategically aligned with sustainability objectives, while ensuring the feasibility of the expansion. By examining projected demand growth, technological advancements, and environmental considerations, the study develops a comprehensive strategy that seeks to balance energy security with sustainability. The study also sheds light on various ESS proposed for expansion, supporting the intermittent nature of highly penetrated renewable resources to enhance grid stability and reliability.
The contributions of this paper lie mainly in the development of a comprehensive methodology for capacity expansion planning, specifically tailored to Dubai’s energy system, with the flexibility to be adapted to other regions by varying inputs to meet their specific needs. The proposed approach incorporates critical factors such as technological advancements, economic considerations, and environmental impacts, offering a robust framework for evaluating future energy scenarios. While the core findings of this work are techno-economic in nature, highlights of policy and institutional aspects are provided solely to contextualize the results and aid interpretation. The model integrates renewable energy sources and projected technological cost reductions, providing a clear pathway for energy transition. The novelty of this research lies in its first-of-its-kind, detailed approach to capacity expansion planning at the operational level, utilizing the most updated real data from Dubai’s energy regulator to ensure accuracy and relevance. This is the first study in the region to provide such an in-depth analysis, offering a comprehensive, data-driven evaluation of energy generation options. The methodology is designed to be scalable and flexible, enabling its application not only to Dubai but also to regions with diverse resource profiles, policy landscapes, and energy demands, thereby supporting more effective energy transition strategies and decarbonization efforts on a global scale. Importantly, the findings of this study serve as a practical, data-driven tool for public policymakers and energy regulators in Dubai, particularly DEWA, by supporting evidence-based decision-making and enabling the effective implementation of a successful capacity expansion plan.
2. Methodology
In order to determine the lowest-cost energy mix in the country, it is essential to apply a deterministic programming methodology that is capable of simulating multiple scenarios at varying conditions. This approach was used to co-optimize both a clean and non-clean power generation portfolio to develop a strategic plan for the city, without compromising the economic advantages and production costs of the overall system. In this project, PLEXOS® energy modelling software (Version 9.20.0001) served as the primary tool for determining the most cost-effective capacity expansions, utilizing an optimization-based technique at the backend [38]. It is a widely recognized and reliable energy modelling tool used in the industry for long-term expansion planning. Its results have been validated in numerous studies and real-world applications [10,23,35,39], which demonstrates its accuracy in optimizing power systems, forecasting demand, and evaluating economic and environmental trade-offs. Decision-makers, utility governmental authorities, and researchers rely on PLEXOS® to develop data-driven strategies that ensure efficient resource allocation, grid stability, and sustainable energy transitions. Its proven track record makes it a trusted tool for informed policy and investment decisions in the energy sector.
PLEXOS® relies on Linear Programming (LP) and Mixed-Integer Linear Programming (MILP) to address complex problems such as Unit Commitments and Economic Dispatch, providing invaluable support for decision-makers by enabling them to determine the best possible solution [40]. In this paper, long-term capacity expansion modelling was utilized to identify the lowest-cost energy mix by examining several scenarios, as indicated in Figure 3 [36].
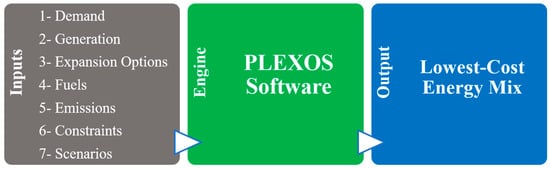
Figure 3.
Conceptual schematic diagram for mid- or long-term capacity expansion modelling using PLEXOS®.
The methodology outlined below is specifically applied to Dubai in this study; however, it can be adapted and implemented in other regions to develop their expansion plans using PLEXOS® based on their specific needs, power demand, and system components, while considering economic aspects and environmental targets. This approach ensures flexibility and scalability, which enables comprehensive analysis and optimization across various geographical contexts.
In this study, PLEXOS® is utilized to achieve the final objective of minimizing the Net Present Value (NPV) of capital and production costs. This optimization is formulated as a Mixed-Integer Problem to minimize the total cost, as expressed in the general formula shown in Equation (1) below [41]:
where x represents all assets, C(x) represents capital costs including cost of new generator builds and generator retirements, and P(x) represents the cost of operating the system with all existing and newly built generators.
Total Cost = C(x) + P(x)
2.1. System Configuration
The system configuration began by adding Dubai as the primary region for analysis. This involved simply incorporating a data file containing the city’s load (MW) from 2016 to 2023 [25], utilized for forecasting until 2030 and 2050 within PLEXOS®. For sensitivity analysis purposes, load scalars of ±20% were subsequently employed with respect to the base load developed using PLEXOS®, in order to account for various load scenarios. Dubai’s power generation infrastructure comprises four main complexes, Aweer, Jebel Ali, Hassyan, and MBR Solar Park, serving as major nodes in this study [42].
2.1.1. Demand
This data-driven study relied on DEWA’s Annual Statistical Reports (ASR) and the Sustainability Report (2017) as its primary sources, utilizing both actual and predicted data of installed capacity and peak demand. The statistical reports encompass actual data on installed capacity and peak demands, extracted for the years 2004 to 2023, as shown using solid lines in Figure 4 [25]. The Sustainability Report, produced in 2017, indicated an anticipated trend from 2017 to 2030 (dashed lines), in alignment with the actual data from 2004 to 2023, making it a reliable resource for future years’ predictions [43].
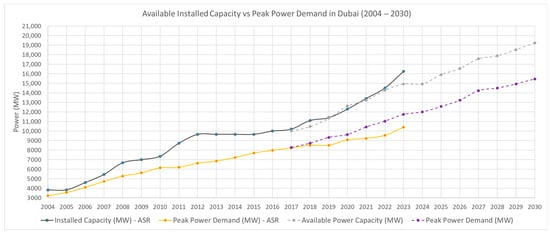
Figure 4.
Installed capacity (MW) and annual peak power demand (MW) (actual vs. anticipated) in Dubai [25,43].
PLEXOS® software’s forecasting capabilities were employed to predict Dubai’s load from 2024 to 2050, utilizing 2023 as the base profile to generate period-by-period demands, e.g., summer and winter, as indicated in Figure 5. This approach was reinforced by monthly peak loads (MW) modelled to follow the same trend observed from 2016 to 2023. Additionally, the yearly energy demand (GWh) was constrained based on DEWA’s extracted energy requirements (GWh) from 2013 to 2023 (solid line), which was extended to 2052 (dashed line), as shown in Figure 6 [25]. The peak load in Dubai is forecasted to reach 12,200 MW by 2030, closely aligning with DEWA’s prediction of approximately 11,930 MW in its 2022 sustainability report [44]. Using PLEXOS®, the peak load was projected to reach 18,640 MW by 2050 under base conditions.
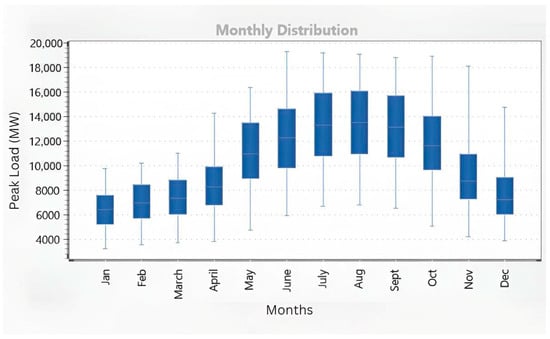
Figure 5.
Monthly distribution of peak loads (MW) in Dubai using PLEXOS®.
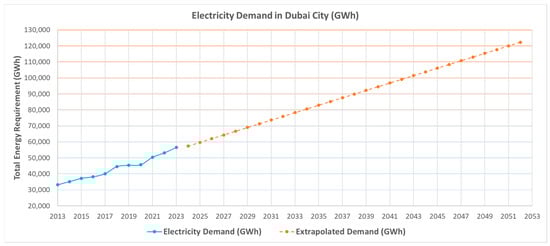
Figure 6.
Total energy requirement (GWh) in Dubai (2013–2052) [25].
Figure 7 illustrates both the base profile (blue) and generated hourly demand forecast (orange) for the entire horizon (2024–2052) utilizing the 2023 base profile, maximum monthly demands (MW), and maximum yearly energy requirements (GWh) as input parameters.
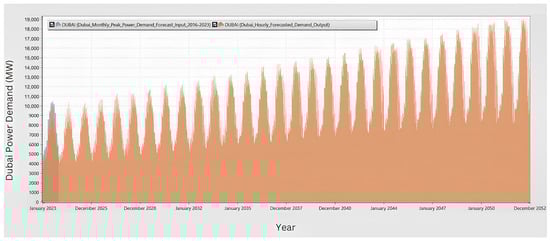
Figure 7.
Base year (2023) and forecasted power demand (MW) (2024–2052) in Dubai using PLEXOS®.
2.1.2. Components
In PLEXOS®, four key objects were defined to set up the system before executing models. These components comprise generators, fuels, emissions, and energy storage system (ESSs).
Generators
Generators were categorized into three groups: existing, planned, and expansion candidates. Existing stations represent operational assets with predetermined lifetimes, while planned candidates include recently contracted projects that are yet to commence operations. Expansion candidates encompass options with significant potential for deployment in Dubai, according to publicly available energy strategies. These expansion options extend beyond renewables to include natural gas-based combined cycles (NGCC), which currently account for approximately 90.9% of total energy generation in Dubai [44]. Moreover, these NGCCs are proposed to be coupled with CC technologies, aligning with Dubai’s 2030 and 2050 Clean Energy Strategies [18]. From the renewables side, despite DEWA’s selection, for the first wind farm in 2021, of a site located in Hatta with a potential capacity of 28 MW, progress seems to be ongoing, with no further results made available for the feasibility study in recent years. Moreover, due to the UAE’s limited wind resources and low wind speeds, wind energy has been excluded from the expansion options in this study [45,46,47]. Therefore, the renewables share was mainly allocated to solar energy (PV/CSP) and nuclear energy. Table 2 below summarizes technologies proposed for expansion in this study. Table A1 in Appendix A provides a detailed classification of existing and planned power generation assets in Dubai.
Table 2.
Expansion candidates proposed as part of clean energy expansion in Dubai.
In PLEXOS®, renewable energy generators are linked with demand through the following expression, shown in Equation (2), to ensure that the total generation always meets or exceeds the load in Dubai city.
where G1, G2, etc. are different renewable generators, L1, L2, etc. are loads of different regions, and x1, x2, etc. are the load coefficients (ranging between 0 and 1) representing the percentage of the load to be met with renewable resources, which has taken a value of 1 in this study to fully meet the desired load of Dubai city with clean resources [48]. As outlined in Figure A1 in Appendix A, on a technological basis, the energy mix is anticipated to be categorized into the same three main technologies: PV, CSP and NGCC. Notably, renewable energy is expected to constitute around 25% of the total energy mix, aligning with DEWA’s intermediate plan for 2030 on the pathway to achieving the final target of 2050 [18]. However, it’s important to note that Figure A1 represents shares of installed capacity (MW), rather than energy generation in GWh.
∑ Generation (G1 + G2 + …) − ∑ (x1 × L1) + (x2 × L2) + … ≥ 0
Fuels
Natural gas, which makes up over 90% of the 2022 total energy generation in Dubai, has been assumed to be the primary fuel over diesel and clean coal for existing and planned thermal power plants [44]. It has also been designated as the key energy source for the modelling of the future advancement of the Combined Cycle Gas Turbine (CCGT) with CC readiness. In this work, a price assumption of USD 2.93/GJ was adopted for NG, which reflects an average of the gas price based on similar studies conducted within the field [15,49]. The production rate (kg/GJ) of CO2e emissions was modelled across three scenarios: Business as Usual (BAU), low, and high. The corresponding values for these scenarios were taken as follows: 193 for BAU, 161 for low [50], and 232 for high. In the case of BAU, the production rate was calculated based on 2022’s gas energy generation of around 48,076 GWh and the forecasted BAU emissions of 35.79 million tons CO2e were obtained from DEWA sustainability and climate change reports in 2022 [44,51].
Emissions
To incorporate carbon pricing, the study modelled three scenarios, each with varying shadow prices of CO2 representing low, mid, and high carbon prices in USD/ton, set as 26, 41, and 52, respectively. These values were considered as the levelized price over the period from 2020 to 2050, ensuring a consistent evaluation of costs across the designated timeframe [52]. This approach highlights the significance of carbon pricing in shaping future energy cost projections and in evaluating the economic viability of different technologies, further emphasizing its role in the transition to a low-carbon energy system. It is important to note that selected removal rates (90%, 95% and 97%), for which cost forecasts were developed by the National Renewable Energy Lab (NREL), reflect different levels of effectiveness in capturing carbon emissions and do not represent technological limitations [53].
Energy Storage Systems
As RE shares continue to grow for climate change mitigation, the need for reliable and cost-effective ESSs is also rapidly expanding. In PLEXOS®, battery classes include various types and chemistries as well as other ESSs such as Compressed Air Energy Storage (CAES), flywheel, and TES. In this project, the current ESS infrastructure includes two embedded TES systems with CSP at the MBR Solar Park, along with a pumped hydro storage facility in Hatta utilizing clean energy generated at the MBR Solar Park [30]. Various ESS options were considered for expansion in this study [28,54,55]. However, evaluating the maturity and compatibility of these options with existing infrastructure is crucial for addressing this expansion challenge. Notably, this aspect was excluded from the study.
2.2. Key Inputs and Assumptions
In this section, the vital inputs and assumptions driving the model’s success will be explored. These include economic data, market trends, technical specifications, and environmental considerations.
2.2.1. Technical Specifications
In this study, various parameters were established for different technologies to account for their technical capabilities. For existing NGCC generators, a heat rate of 6.133 GJ/MWh was adopted, assuming the utilization of market-leading F-class turbines. This rate reflects a thermal efficiency of 58.7%, as determined by a recent study on CCGT performance in the UAE [49]. For expansion candidates under the NGCC category, heat rates were extracted from NREL ATB to account for variability throughout the years 2021–2050 under a moderate scenario, as demonstrated in Figure A8 [53]. It is important to recognize that CCS introduces an additional load to NGCC generation, consequently increasing the heat rate of the generator due to the power consumption by the CCS unit. Separately, for nuclear power generation, a heat rate of 11.017 GJ/MWh (10.443 Btu/kWh) was considered according to EIA and NREL predictions for the upcoming years [53,56].
To optimize power generator performance, minimizing degradation is crucial. Ageing, both age-based and from operational factors like NGCC fluctuations and shutdowns, contributes to reduced efficiency over time. For existing and planned NGCC plants, a yearly power degradation of 3% was considered, although this decreases with regular maintenance [49]. However, for new NGCC candidates, a lower degradation rate of 0.3% per year was assumed, reflecting anticipated technological advancements and minimal variation in power generation. In the case of all PV assets, a degradation rate of 0.7% per year was used [57], while for CSP, a rate of 1% per year was adopted to account for its embedded storage capabilities [58]. Nuclear power, known for its stability over its technical lifetime, was assigned a degradation rate of 0.2% per year. Solar PV and CSP were assigned a technical lifetime of 25 years across all categories, while NG-based generators were allocated 35 years. Nuclear power was assigned a technical lifespan of 40 years [37].
The capacity factor trend was examined based on the NREL Annual Technology Baseline (ATB) [53]. Predictions for capacity factors were developed for various categories spanning from 2021 to 2050, considering technological advancements over time. For PV plants, a lower limit of 26.2% was applied across all categories, existing, planned, and expansion candidates, according to the 2022 installed capacity and energy generation [44,59]. However, upper limits were derived from NREL projections, which anticipate three values corresponding to the three scenarios: advanced, moderate, and existing. These upper limits were utilized for the expansion, planned, and existing categories, reflecting the anticipated technological improvements for future expansions until 2050, compared to planned candidates and expansion candidates up to 2030, which are expected to come online in the next few years. Finally, a narrower range of capacity factor was taken for existing candidates.
According to projected capacity factors by NREL, nuclear power generators are anticipated to operate at a capacity factor of 92.7% under mature technology assumptions and market-based financials throughout the years 2021–2050 [53]. However, lower limit estimations were made to allow for a reduction in the capacity factor, with the typical value being based on the performance of the Barakah plant in Abu Dhabi in 2022, which was estimated to be 84.6%, as reported by an EWEC statistical leaflet [60,61]. Table 3 summarizes the various capacity factors used in this study.
Table 3.
Capacity factors [53,62].
2.2.2. Economic Inputs
To accurately predict the economic impact of the developed model, it is important to account for the variation in costs anticipated throughout the years that are occurring due to global gas fluctuation or technological advancements. The ATB developed by NREL has been utilized to incorporate technology-specific costs, e.g., capital expenditure (CAPEX) and fixed and variable operating expenses (OPEX) over the years 2021 to 2050 [53], accounting for the potential future decline in costs associated with these technologies, as illustrated in Figure A2, Figure A3, Figure A4, Figure A5, Figure A6 and Figure A7 in Appendix A. Technological advancements are expected to drive down the costs of renewable energy technologies, including PV, which will impact future cost projections and the economic viability of energy generation options. An economic life equal to the technical life described above was considered to ensure an alignment between the lifespan of the project and its economic viability. Additionally, a discount rate of 6% was assumed for all expansion candidates [3]. It is important to note that costs for technologies such as solar PV, wind, and other renewables are largely market-driven, influenced by demand, technological progress, and global trends. These factors may impact future cost predictions. Based on current trends, it is expected that PV, along with other renewable technologies, will become more competitive in the future, influencing the overall cost structure and economic outlook. However, regulatory implications, including policy changes, subsidies, tariffs, and compliance requirements, may introduce uncertainties that could impact the accuracy of assumptions and results.
2.2.3. Environmental Inputs
As per a DEWA sustainability report in 2022, the objective is to achieve a 30% reduction in carbon emissions by 2030 [44]. Additionally, the climate change report anticipates a steady decline in CO2 emissions. This will be achieved by maintaining the target at the desired level and continuously increasing the gap between both the target and the increasingly emitting BAU scenarios, aiming for a 35% gap by 2030, as indicated in Figure A9 [51].
In the CO2 annual emission scenario, the targets mentioned above were extended to 2050 to achieve zero-emission power generation. This was performed by gradually decreasing emissions with equal steps starting from 27.14 million tons of CO2 in 2030. Under this condition, a PLEXOS® constraint was applied to prevent yearly emissions from exceeding the specified thresholds.
2.2.4. Constraints and Scenarios
The model addressed multiple limitations to regulate expansion and align with regulations and energy strategies, including the UAE’s net-zero energy plan for 2050. These constraints are configured within PLEXOS® to prevent exceeding defined limits, track renewables penetration, and ensure seamless ESS integration. Moreover, various scenarios were established to evaluate parameters’ impacts on mid- and long-term outcomes, ensuring compliance with constraints like CO2 emissions and testing different carbon price (CP) values. Table 4 summarizes key scenarios considered in this study. To account for variations in demand relative to the base load, two load scenarios were evaluated with ±20% variation with respect to the base load shown in Figure 7. In addition, two commonly used CCS efficiencies were included to assess their techno-commercial implications on the expansion plan. Three different carbon-pricing levels were also examined to understand their potential impact on expansion economics. CO2 production rates were varied under high and low scenarios to reflect potential fluctuations in emissions. The analysis incorporated the potential role of nuclear energy and energy storage solutions, in line with DEWA’s official strategic expansion plans [18].
Table 4.
Overview of key scenarios and their underlying assumptions.
3. Results
In this study, base models were executed and solved without infeasibilities using moderate and BAU scenarios. These scenarios encompass several factors, including base load, CO2 production rate (CPR)–BAU, and no CP. It also considers several constraints depending on the horizon such as CO2 annual limit and clean energy strategy. The results of this study were derived from PLEXOS® modelling software.
3.1. Medium-Term—2030
According to DEWA, the 2030 anticipated generation mix comprises natural gas (61%), solar energy (25%), clean coal (7%), and nuclear power (7%) [18]. However, recent announcements indicate a shift in strategy, with the Hassyan plant transitioning entirely to NG [63]. As highlighted in DEWA’s 2022 sustainability report, this shift is supported by the negligible contribution of clean coal (0.3% of total energy generation) and suggests a potential amendment to the clean energy strategy, likely eliminating clean coal from the mix [44]. Additionally, with no recent updates on nuclear power development in Dubai, it is expected that its share will be redistributed to both NG and solar energy. These two sources are projected to dominate energy generation in Dubai city until 2030. In light of these trends, the developments identified in this study indicate how policy directions in Dubai are evolving within the broader governance context. They also suggest that the clean energy policy may gradually formalize the removal of clean coal, as this reflects the ongoing strategic adjustments already underway. Moreover, the medium-term outlook may benefit from offering greater policy clarity regarding the expected contribution of nuclear power or alternatively reinforce the planned expansion of solar PVs in order to ensure that future policy updates remain well aligned with Dubai’s institutional priorities and long-term sustainability objectives.
Overall, the findings indicate that NG will continue to serve as the primary source for the base load in Dubai city. It is projected to generate approximately 46,757 GWh of energy in 2025, delivered by an installed capacity of 16,756 MW. Similarly, in 2028, NG is expected to produce around 46,602 GWh with an installed capacity of 16,735 MW, reflecting a slight degradation of power and reduction in NG generation compared to 48,076 GWh in 2022 [44]. However, it is forecasted to generate 48,487 GWh by 2030 with a capacity of around 16,223 MW, considering a slight increase in NGCC capacity factor, to meet the targeted share allocated by DEWA.
Dubai city anticipates significant progress in the development of solar PV plants, beginning with the MBR solar park phase 6, which is expected to become operational in stages from 2025 (600 MW), 2026 (400 MW), and 2027 (800 MW), totalling 1800 MW [64,65]. Among the three RE technologies considered for expansion, i.e., solar PV, CSP, and nuclear energy, PLEXOS® analysis indicates that solar PVs will secure the entirety of the allocation designated for the RE sector. This preference stems from its competitive pricing and the abundance of its resources in the UAE, coupled with several success stories of similar projects in Dubai that are breaking world tariffs. As shown in Figure 8, results suggest an extra capacity of around 522 MW in 2025, which would enable Dubai to achieve its 5 GW target for the MBR solar park [65]. However, projections indicate further solar PV penetration in 2026, with an additional 435 MW, and in 2028, with an extra 620 MW. A decline in solar momentum is anticipated towards 2030, with an additional building capacity of 572 MW and 325 MW in 2029 and 2030, respectively.
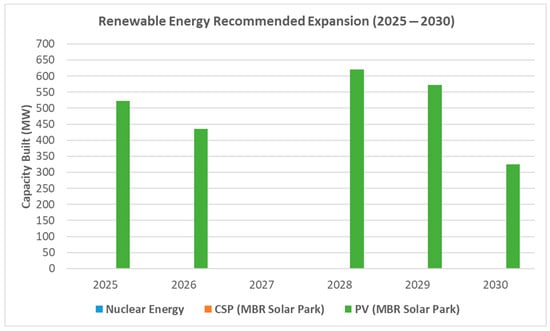
Figure 8.
Renewable energy recommended expansion capacities in the medium term (2025–2030).
The additional PV plants are projected to operate at a maximum allowable capacity factor, averaging 35.8% over the simulated horizon. These added capacities are expected to be contracted at a gradually declining LCOE (USD/MWh), as illustrated in Figure 9. On the other hand, minimal expansions were proposed for NGCC generators coupled with CCS, primarily to meet DEWA’s targeted annual emissions by 2030. Additional capacities of NGCC + 97% CSS comprising 801 MW, 1372 MW, and 1284 MW are recommended at the three core complexes to operate at the maximum allowable capacity factor, averaging 78% over the medium-term horizon, as illustrated in Figure 10.
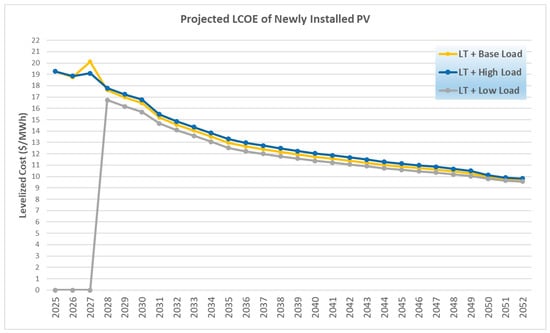
Figure 9.
Projected LCOE reduction in newly installed PV capacities.
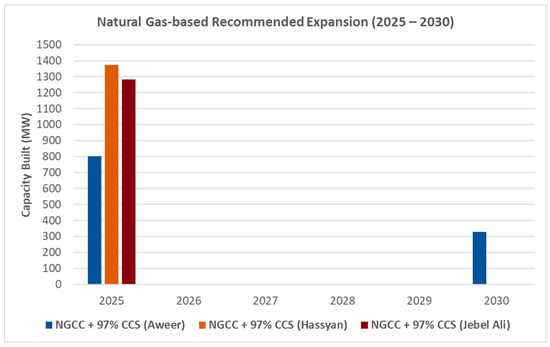
Figure 10.
Natural gas-based recommended expansion capacities in the medium term (2025–2030).
These expansions were supplemented by an additional 327 MW at Aweer complex in 2030. They aim to meet the growing demand, targeted NG share, and targeted emissions, in addition to offsetting the retirement of ageing power plants, such as Jebel Ali Station G, which is expected to reach the end of its lifetime by 2028. However, it is important to note that the introduction of new NGCC assets is accompanied by a substantial reduction in the capacity factors of existing NG assets at the BAU CPR. This underscores the necessity for decarbonization of around 3784 MW of the NGCC capacity, with an abatement rate of 97% in the medium term, to uphold targeted CO2 emission levels. This approach may slightly increase the LCOE of energy generation due to the added expenses of CCS units (around 45.6 USD/MWh), which require extra energy, and consequently increase the NG feed to the plant [66].
Finally, to environmentally assess the model, an annual emission constraint was examined to ensure compliance with the targeted emissions set by DEWA’s climate change report 2021. This is illustrated in Figure 11, comparing production versus gross production before emission abatement [51]. Incorporating these emission constraints within the analysis also underscores how environmental considerations are increasingly integrated into Dubai’s policy and planning processes. It demonstrates that future energy sector decisions will need to align not only with technological and economic priorities but also with the Emirates’ evolving climate commitments, which are gradually shaping the governance landscape and guiding long-term strategic choices.
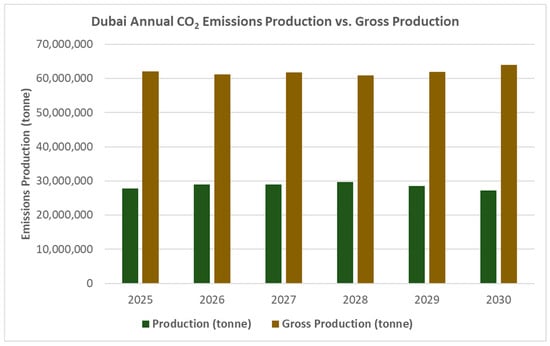
Figure 11.
Dubai annual CO2 emissions production (tonne) vs. gross production (tonne)—PLEXOS®.
3.2. Long-Term—2050
In long-term planning, three models were implemented to manage load variations, taking into account high and low growth rates compared to the base load in Dubai. These models were executed under identical conditions regarding CO2 annual constraints, carbon pricing, and technology shares by 2030. The expansion plan yielded similar technological preferences as the base case explained for the medium term in the previous section. Both solar PV and NGCC + 97% CCS effectively addressed the expansion challenge without encountering any infeasibilities, demonstrating compatibility with future energy strategies in terms of reliability, cost affordability, and sustainability in the three load scenarios. Variations in load growth rates prompted PLEXOS® to modify the recommended capacities, locations, and timing of new builds. These results highlight the need for Dubai’s energy sector to adopt adaptive planning practices that account for uncertain demand paths. This may involve developing more dynamic procurement frameworks, adaptive permitting procedures, and scenario-based investment routes to ensure capacity expansion remains aligned with demand without over- or under-investing in key technologies.
The generation capacity (MW) projected for Dubai demonstrates a steady increase up to 2030, followed by a slight increase between the end of 2030 and 2031, before stabilizing at another growth rate. This shift was primarily driven by the constraints on CO2 emissions and technology shares for renewables and gas-based generation implemented from 2025 to 2030. The removal of these constraints led to increased solar PV penetration with its relatively low capacity factor from 2030 onwards due to its cost-effectiveness. By 2050, a significant boost in PV generation capacity will be necessary to match CO2 emission reductions, especially towards the projection period’s end. This pattern indicates that policy decisions on when to relax or tighten emission targets and technology share constraints will substantially influence the scale and timing of solar and gas-based investments. As a result, policymakers may need to set clearer guidelines on when these constraints should be adjusted, which helps to prevent investment overload or timing delays as the system approaches its long-term decarbonization horizon.
Regionally, the LCOE has shown a downward trend across the three scenarios, as illustrated in Figure 12. This reduction indicates technological advancements across all technologies coupled with continuous cost reductions and increased competition in the energy market. Notably, there is a projected drop in LCOE between 2030 and 2031, primarily due to the sudden increase in solar PV penetration during this period, tremendously reducing the average LCOE of the region. The observed decline in LCOE highlights the importance of predictable procurement processes for utility-scale solar and contracting approaches that enable the energy procurer to capture ongoing cost reductions. Clear regulatory guidance, particularly regarding site availability and grid-connection needs, will be essential to support continued PV expansion and manage its financial implications.
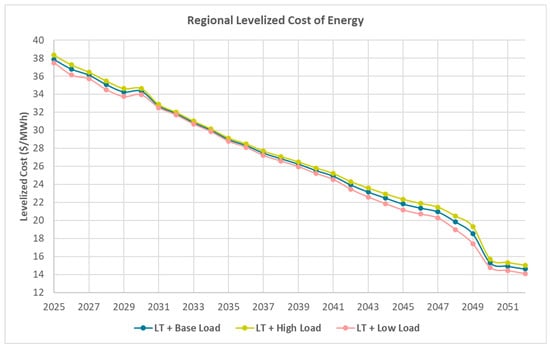
Figure 12.
Regional levelized cost of energy ($/MWh).
In both base and high load scenarios, new NGCC capacities were introduced in the three core locations. However, in the low load scenario, PLEXOS® results indicate that new installations of NGCC + 97% CCS are only occurring in two locations: Hassyan and Jebel Ali. All new NGCC capacity builds were recommended for the medium term, with the most recent new build planned for 2030. On the other hand, PV penetration begins in 2025 for the base and high loads but starts in 2028 for the low load scenario. This scenario suggests that conventional power generation appears sufficient to meet the base load of Dubai city in the near term, while gradually incorporating PV power to meet growing long-term demand. In all cases, PV expansion continues until 2050 and beyond, as illustrated in Figure 13.
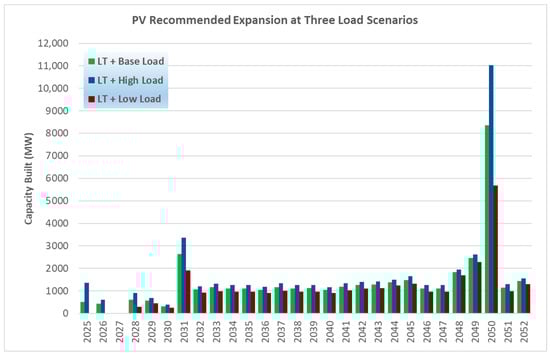
Figure 13.
PV recommended new capacity built until 2050 for three load scenarios.
This section employed the same maximum allowable CO2 emissions for all three scenarios to ensure alignment across various load variations for both the medium- and long-term horizons, as shown in Figure 14. Maintaining identical emission caps across all load scenarios reflects an implicit policy assumption that environmental targets remain fixed even under demand uncertainty. However, these findings suggest that achieving uniform emission limits may require differentiated operational strategies or policy adjustments, such as modifying dispatch criteria, introducing demand management measures that may influence actual load, or revising the timelines for meeting specific emission targets, to ensure compliance under varying demand conditions while avoiding excessive dependence on high-cost technologies.
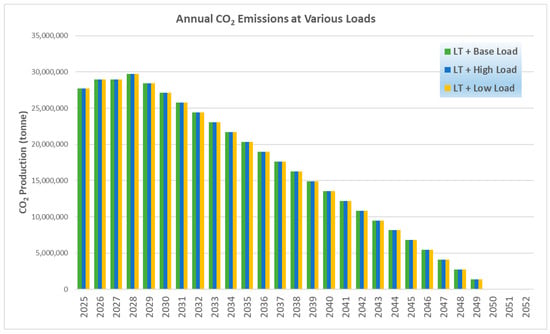
Figure 14.
Annual CO2 emissions produced at various loads.
4. Techno-Enviro-Economic Discussion
The capacity allocations of the key scenarios are distributed among four primary technologies across the simulated period. Under BAU and nominal conditions, the energy mix in Dubai comprises mainly NG and solar energy, with the allocation varying depending on energy demands and existing policies. Initially, current policies indicate a predominant presence of both technologies in the near-term, with a slight edge toward NG due to its reliability and maturity. However, over time, solar PV undergoes significant penetration, with additional capacities introduced to offset its low capacity factors, aiming to achieve zero emissions by 2050. Furthermore, nuclear energy is projected to start at a nearly 7% contribution, in line with DEWA’s target, gradually decreasing as the integration of ESSs is preferred alongside the high penetration of solar energy. Figure 15 below illustrates how the energy mix evolves over time, highlighting the contributions of the four main technologies. These modelled shifts suggest that decision-makers in Dubai may need to reconsider the pacing of technology transitions, particularly as the growing dominance of solar and the increasing importance of storage solutions signal a reorientation of strategic priorities within the energy sector.
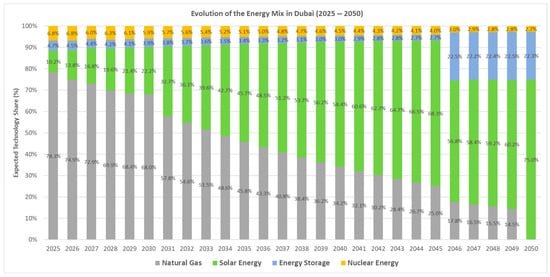
Figure 15.
Evolution of energy mix in Dubai (2025–2050) using PLEXOS®.
As shown above, by 2030, the city is projected to achieve the energy strategy objectives assumed in this study, with 68% of energy generation derived from NG and the remaining 32% from clean energy sources. The aim of achieving zero emissions by 2050 leads to a reduction in NG starting in 2031, gradually decreasing over time until the entire city’s energy supply is sourced from clean sources by 2050. However, achieving this objective necessitates the retirement of 14.5% of NG facilities by the end of the horizon to offset emissions and meet the target. Alternatively, the remaining 14.5% can be decarbonized in parallel to the PV penetration through retrofitting with CCS technology. However, these approaches may not be the most viable solutions. A more strategic path could involve extending decarbonization targets to allow non-renewable generators to phase out naturally at the end of their lifespan and maximize the effective use of existing resources. Such findings demonstrate how technical pathways must interact with governance realities in Dubai, where policy updates must balance climate ambitions with infrastructure readiness and the operational lifetimes of existing assets.
Additionally, with the rising penetration of solar energy, there is a growing need for high-rate ESS integration commencing in 2046, as natural gas appears inadequate to fulfil the city’s base load. However, it is advisable to initiate ESS integration earlier rather than making a significant investment within a shorter timeframe. Furthermore, there is an expectation that natural gas may replace nuclear energy in the long term. This transition could align with advancements in CCS technology, potentially achieving a 100% capture rate by the end of the horizon. These technical insights highlight the importance of early policy planning around ESS procurement, regulatory approval, and investment sequencing, as rapid large-scale deployment late in the horizon may impose a substantial financial burden and exceed realistic institutional capacity.
The remaining non-retired share of NG includes several stations that have not reached the end of their operational lifetimes, such as four stations at Hassyan complex, Aweer Station H Phase IV, and Jebel Ali Station M Ext, along with newly proposed capacities in this study. The retirement of these stations should be accompanied by significant investments in renewable resources to compensate for NG station retirement. Therefore, to facilitate gradual phase-out of NG by the end of the horizon, there might be a need for a relaxation of the targeted annual CO2 emissions. This relaxation is projected to achieve zero emissions by 2055, with an average annual emissions reduction of 2%. The model’s results offer an important indication for political decision-makers: extending the mitigation horizon to 2055 may represent a practical alternative that helps avoid sudden, large-scale investment requirements, reduces financial pressures, and enables Dubai to fully utilize the remaining operational lifetimes of its existing NG assets. This extended timeline would still support the emirate’s long-term sustainability objectives while providing a more gradual, manageable, and institutionally feasible transition pathway.
4.1. Economic Analysis
As illustrated in Figure 9, the LCOE values demonstrate a continuous decline in PV prices, reflecting a positive trend in RE affordability. The projected decrease begins at approximately 2.7% in the early years and gradually accelerates to above 3% by 2030. By 2050, the LCOE for PVs is anticipated to range from USD 9.56/MWh to USD 9.83/MWh, reflecting a substantial decline across the three load scenarios. It is important to note that the actual starting point in Dubai may be slightly lower due to specific conditions in the region. For instance, considering the recent tariff of USD 16.2 per MWh [64], the initial cost trajectory for PV projects might vary. Nonetheless, this decline highlights solar energy’s growing affordability and competitiveness in Dubai, indicating promising opportunities for increased adoption and investment in clean energy.
Similarly, there is a clear trend of decreasing NGCC costs over time in the near term. This trend indicates the improving cost-effectiveness and competitiveness of NGCC technology, making it an increasingly viable option for meeting energy demands in the near future. However, the LCOE values are expected to experience an increase attributed to the reduction in the capacity factor and subsequent decrease in energy generation. This decline in 2026 and 2028 is anticipated as more renewables are integrated to align with the clean energy strategy, necessitating a balance between reliability and sustainability.
Economically, the base model favours NGCC with 97% CCS in the medium-term horizon. When the capture rate is reduced to 95% for new capacities under the same conditions, the average LCOE decreases by about 0.71%. This decrease was anticipated, as lower capture rates are expected to incur lower costs. However, in a scenario where no new builds are considered, retrofitting with 90% CCS would take preference and exhibits an increase of around 2.09% compared to new builds with 95%. This trend is largely attributable to the complexities involved in retrofitting existing infrastructure, which requires additional investments to accommodate CCS technology. These evolving cost profiles highlight the importance of adaptive policy frameworks that allow energy procurers to adjust investment decisions, carbon-capture requirements, and the timing of new developments based on technology performance. Incorporating cost trends into regulatory and planning processes will be essential for ensuring that Dubai’s clean energy transition is both economically feasible and aligned with long-term sustainability goals.
4.2. Nuclear Energy and Energy Storage Systems
Under nominal conditions, nuclear energy was introduced to evaluate the impact on meeting the allocated 7% share mandated by DEWA’s Clean Energy Strategy 2030 [18]. In the medium term, the model effectively incorporated 615 MW of nuclear energy, operating at an average capacity factor of 93%. However, the distribution of the newly installed capacity of nuclear energy may vary over the years depending on emerging policies and infrastructure availability. As a result, a slower penetration rate of solar PVs is proposed, beginning in 2028 with less than 100 MW, followed by 516 MW in 2029 and 274 MW in 2030. They are expected to be contracted at an average LCOE of USD 123/MWh, which is relatively lower compared to the low-end LCOE estimate by Lazard [66]; however, this would lead to an increase in the regional LCOE.
To achieve high levels of RE penetration, integrating ESSs is crucial for stabilizing intermittent power generation. Under base conditions, additional capacities of 500 MWh of flywheels, 40 GWh of lead-acid batteries, and 12 GWh and 24 GWh of Li-ion batteries with storage durations of 2 h and 4 h, respectively, were identified from the various expansion candidates of ESS listed in Table A2, which also includes storage technologies that are already available, to support long-term PV power generation. Results indicate heavy integration of ESSs from 2046 onwards, as renewables emerge to be the major energy source. The introduction of ESSs will increase newly built PV capacity by around 7.1% compared to the BAU with nuclear scenario. This is coupled with maximizing the capacity factor of PV to its maximum allowable limit, as surplus energy is required to fulfil the charging requirement of the storage systems.
4.3. Energy Mix
The study compared various scenarios based on technology shares across four main categories, natural gas, solar energy, nuclear energy, and energy storage, in relation to the baseline BAU scenario. The BAU scenario encompasses various conditions that were varied for sensitivity analysis purposes. These conditions included base load, no CP, BAU CPR, 2030 target technology share, and 2050 annual emission targets.
These scenarios were analyzed from left to right to provide meaningful insights, with the BAU scenario serving as the reference point, as shown in Figure 16. By 2030, the energy generation system is projected to consist of NG, solar energy, and ESSs across all scenarios. Nuclear energy is introduced in two scenarios to align with the 2030 strategy. The addition of ESS alongside nuclear energy results in a slight shift towards solar energy. High and low load conditions exhibited similar technology shares, despite being proportionally different from the base load in the BAU scenario. Additionally, scenarios with CC rates below 97% meet demand with equal shares but incur different costs. Similarly, varying CPs result in identical technological shares. Furthermore, adjusting the CPR maintains the same generation share, with fewer newly built NG generation capacities in the low CPR scenario. Finally, the introduction of nuclear energy led to a reduction in the share of solar energy, contributing to 7% of the energy mix. Notably, no new ESSs were proposed in the medium term, with a slight preference for solar energy in the ESS scenario.
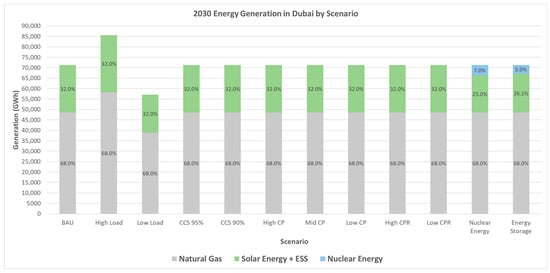
Figure 16.
Energy generation scenario comparison—2030.
By 2050, we aim for an energy mix of 100% clean energy, despite the existence of non-retired NGCC capacities, e.g., Hassyan complex, as indicated in Figure A10. This transition raises policy considerations regarding how the remaining NGCC assets will be regulated or integrated during the final stages of decarbonization, as their continued operation influences investment timing and long-term planning decisions. In the long term, the energy storage scenario emerges as the most feasible option, with the proposed energy mix comprising 75% solar PV, 22.3% energy storage, and 2.7% nuclear energy, as indicated in Figure 15. In 2050, the monthly energy mix is projected to mirror the illustration in Figure 17, highlighting peak generation during the summer period. For a more detailed analysis at a higher resolution, e.g., daily, integrating future solar irradiance is recommended to assess its impact on actual solar energy and the supporting battery generation, which was excluded from this study.
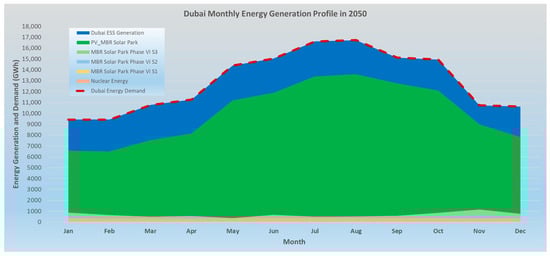
Figure 17.
Projected 2050 monthly energy generation in Dubai.
Economically, the results indicate that the energy storage scenario falls between the CP and conventional scenarios. While energy storage shows a slightly lower LCOE compared to the nuclear-only scenario due to the adoption of additional PVs, the high costs associated with ESSs lead to an overall increase in the LCOE, as indicated in Figure 18. The integration of ESSs will lead to an increase in the city’s load, necessitating additional PV capacity to charge the system, resulting in a 7.1% increase compared to the scenario without ESSs. Despite the benefits of increased RE penetration and reduced carbon emissions, the higher regional LCOE associated with ESS integration and additional PV capacities outweighs the BAU and NGCC-based scenarios, emphasizing the importance of carefully assessing the cost implications of such integration. These findings highlight the need for DEWA, as the primary energy procurer and system planner, to evaluate the financial trade-offs of large-scale ESS deployment and determine whether long-term cost structures justify accelerated investment in storage technologies.
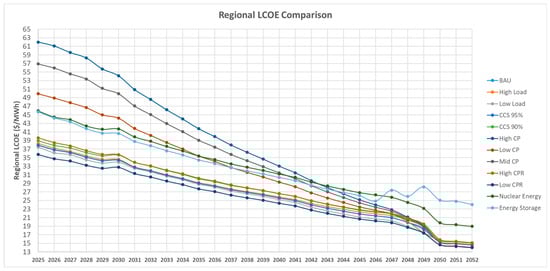
Figure 18.
Regional LCOE comparison of scenarios.
As shown in Figure 18, the lowest regional LCOE was obtained with the low CPR scenario due to its minimal introduction of newly built gas-based (NGCC + 97% CCS) generators, as existing NGCC assets generation is maximized, which still complies with the targeted CO2 emissions at low CPR. Additionally, the nuclear energy, energy storage, and CP scenarios exhibit less competitiveness compared to other scenarios in the medium-term. However, approaching 2050, CP scenarios appear to fall within a similar range as conventional scenarios. This finding indicates that the energy procurer (DEWA) must consider how the relative cost-effectiveness of each pathway will shape its future priorities, investment sequencing, and technology adoption timeline within a long-term decarbonization strategy.
By 2050, the projected generation capacity is set to reach 53.3 GW, achieving 100% clean energy generation. This is in line with DEWA’s initial estimation in 2020 of 42 GW, which was expected to fulfil 75% of energy needs with clean resources. If scaled linearly, DEWA’s estimate for 100% clean energy would be approximately 56 GW, which is nearly identical to the 53.3 GW projected in this study [16,17].
These projected developments also carry important implications for Dubai’s political and governance context, where centralized decision-making, strong government-led entities, and integrated energy–water management play defining roles. Translating the modelled expansion of solar PV, ESS, and NGCC assets equipped with high carbon capture rates into practice will require DEWA to internally coordinate grid reinforcement, land allocation, and desalination planning so that energy and water infrastructure evolve in line with the transition. As large-scale solar deployment accelerates and nuclear power’s role stabilizes, governance processes must support timely permitting, long-term investment commitments, and clear pathways for integrating emerging technologies. Within this context, identifying the right scenario, which is technically feasible, economically acceptable, and institutionally actionable, is essential for achieving optimal implementation, as not all technically optimal pathways reflect real constraints such as regulatory processes, infrastructure readiness, and stakeholder coordination. Ensuring that the adopted scenario fits Dubai’s institutional realities will therefore be key to meeting the Emirates’ clean energy goals by 2050.
5. Conclusions
In this paper, a capacity expansion model utilizing PLEXOS® provided valuable insights into shaping the energy mix for Dubai in 2030 and 2050. Through comprehensive analysis and scenario planning, the study uncovered significant findings that offer strategic guidance for the sustainable development of the city’s energy sector. Looking ahead to 2030 and beyond, the model forecasts a significant role for natural gas with CC technology, along with solar energy, in Dubai’s energy landscape. Leveraging abundant natural gas reserves and solar potential, the city is expected to rely predominantly on these sources to meet growing energy demands while reducing carbon emissions in the medium term. Therefore, this study proposes potential amendments to the Dubai Clean Energy Strategy, primarily in terms of technology shares. The results suggest a significant shift towards incorporating more solar PV to fulfil the entirety of the allocated share for RE. Furthermore, it was observed that the most recent planned development of NGCC is anticipated to occur in 2030. Also, a 14.5% reduction in NGCC assets will be crucial for mitigating the impact of carbon emissions and preventing the extension of zero-emission targets if a strict target is set for 2050. At the end of the horizon, the generation capacity is projected to reach 53.3 GW to fulfil DEWA’s goal of achieving 100% clean energy by 2050. In terms of CC, preferences were observed in favour of high capture rates (>97%), followed by 95% and 90%, indicating a preference for technologies that facilitate the growth of the NGCC portfolio while addressing emissions concerns. Additionally, it is crucial to note that employing the model with NGCC at a 0% CCS rate as the sole option disregards NG power expansion in both the medium and long term, highlighting the importance of integrating carbon capture mechanisms into the analysis. Furthermore, the study reveals that the integration of ESS can increase solar PV penetration by 7.1% by 2050, further emphasizing the importance of energy storage technologies in facilitating RE integration and grid stability. These implications serve as a roadmap for policymakers to navigate the transition towards a cleaner and more resilient energy infrastructure.
From a policy perspective, these findings indicate that Dubai must align its regulatory and institutional frameworks with a transition that uses NGCC primarily in configurations equipped with high carbon capture rates, rather than expanding conventional natural gas assets. This shift requires close coordination within the energy and water planning authority (DEWA), given the integrated nature of power generation and desalination plants. Effective implementation will depend on streamlining permitting, ensuring integrated energy–water decision-making, and addressing barriers such as land constraints for large solar deployment, high upfront ESS costs, and the need for major transmission system upgrades to accommodate a significantly expanded solar-based generation portfolio. Strengthening incentives for storage, optimizing procurement pathways, and enhancing grid flexibility will be crucial to translating the model’s pathways into actionable policy decisions that support Dubai’s 2030 and 2050 clean energy ambitions. While these policy and governance considerations help contextualize the implications of the modelled pathways, the main contributions of this study remain techno-environmental–economic, with such interpretative insights provided to support a clearer understanding of the results. It is also important to emphasize that these institutional considerations are indicative rather than prescriptive, as they reflect the scope and limitations of the modelling exercise and are intended primarily to support interpretation rather than prescribe specific policy actions.
Finally, it is imperative to acknowledge the uncertainties and challenges that lie ahead in realizing the envisioned energy transition. Market dynamics, technological advancements, and regulatory frameworks will undoubtedly influence the trajectory of Dubai’s energy future. Therefore, ongoing collaboration and stakeholder engagement will be essential to navigate these complexities, align with evolving technologies and policy frameworks, and ensure the successful implementation of the capacity expansion plan. Future work could explore the social implications of the energy transition, including its impact on local communities, employment, and social equity. Additionally, a broader view of carbon pricing and its integration into economic models could provide further insights into the cost–benefit analysis of various technologies. Other limitations, such as data uncertainty, variability in resource availability, and external geopolitical factors, should also be considered to refine future predictions and strategies for achieving a sustainable energy future. Future research should also investigate the potential to decouple power generation assets from seawater desalination, particularly for thermal desalination technologies that are traditionally integrated with natural gas power plants in Dubai. This transition requires a strategic decision on whether to retire or extend existing power plants so that carbon emissions can be reduced without compromising the coupled water supply. In this context, water demand must be evaluated alongside the retirement of natural gas assets and their associated desalination plants. Hence, the parallel development of independent desalination plants should be thoroughly examined, taking into account both the evolving power demand and the need for stable and continuous water production. The increasing penetration of renewable energy further adds complexity, as it introduces variability in power generation. Therefore, a holistic, forward-looking planning framework is essential to ensure that future energy and water systems remain secure, resilient, and capable of supporting Dubai’s long-term sustainability goals.
Author Contributions
Conceptualization, M.N. and A.Y.; methodology, A.Y.; software, A.Y.; validation, A.Y.; formal analysis, A.Y.; investigation, A.Y.; resources, A.Y.; data curation, A.Y.; writing—original draft preparation, A.Y. and M.N.; writing—review and editing, A.Y. and M.N.; visualization, A.Y.; supervision, M.N.; project administration, M.N. All authors have read and agreed to the published version of the manuscript.
Funding
This research received no external funding.
Data Availability Statement
The data is available and can be provided upon request.
Conflicts of Interest
The authors declare no conflicts of interest.
Appendix A
Table A1.
Existing and planned candidates in Dubai by year-end of 2023 [42].
Table A1.
Existing and planned candidates in Dubai by year-end of 2023 [42].
| Category | Project Name | Capacity (MW) |
|---|---|---|
| Existing | Jebel Ali Station D | 1027 |
| Jebel Ali Station E | 616 | |
| Jebel Ali Station G | 818 | |
| Jebel Ali Station K | 948 | |
| Jebel Ali Station L Phase I | 969 | |
| Jebel Ali Station L Phase II | 1432 | |
| Jebel Ali Station M | 2185 | |
| Jebel Ali Station M Ext | 700 | |
| Aweer Station H Phase I | 606 | |
| Aweer Station H Phase II | 421 | |
| Aweer Station H Phase III | 968 | |
| MBR Solar Park Phase I | 10 | |
| MBR Solar Park Phase II | 200 | |
| MBR Solar Park Phase III A | 200 | |
| MBR Solar Park Phase III B | 300 | |
| MBR Solar Park Phase III C | 300 | |
| MBR Solar Park Phase IV (PV) | 217 | |
| MBR Solar Park Phase IV (PT) | 600 | |
| MBR Solar Park Phase IV (Tower) | 100 | |
| MBR Solar Park Phase V A | 300 | |
| MBR Solar Park Phase V B | 300 | |
| MBR Solar Park Phase V C | 300 | |
| Hassyan Clean Coal Phase I | 600 | |
| Hassyan Clean Coal Phase II | 600 | |
| Hassyan Clean Coal Phase III | 600 | |
| Planned | Aweer Station H Phase IV | 829 |
| MBR Solar Park Phase VI | 1800 | |
| Hassyan Clean Coal Phase IV | 600 | |
| Total | 18,546 |
Table A2.
Existing and expansion candidates of ESS [28].
Table A2.
Existing and expansion candidates of ESS [28].
| Category | Technology | Max Power (MW) | Duration (h) | RTE (%) | Build Cost ($/kW) | FO&M ($/kW/yr) | VO&M ($/MWh) | Lifetime (Years) [67] |
|---|---|---|---|---|---|---|---|---|
| Existing | Thermal Energy Storage (Molten Salt)– Parabolic Trough | 600 | 11 | 80 | 300 [67,68] | 53.7 [69] | - | 25 |
| Thermal Energy Storage (Molten Salt)– Solar Tower | 100 | 15 | 80 | 300 [67,68] | 53.7 [69] | - | 25 | |
| Pumped Hydro Storage | 250 | 6 | 80 [30,70] | Figure A3 | 18.66 [55] | 0.54 [55] | 80 | |
| Expansion | Compressed Air Energy Storage (CAES) | 1000 [71] | 10 | 75 [72] | 800 [67,71] | 22 [67] | 2.1 [73] | 30 |
| Flywheel | 20 [71] | 0.25 | 95 [67,70] | 300 [67] | 20 [67] | 0.3 [73] | 15 | |
| Li-ion Battery | 60 [54] | 2, 4, 6, 8, 10 | 85 [72] | Figure A2 | Figure A4 | - | 15 | |
| Lead Acid Battery | 100 [71] | 4 | 75 [70] | 600 [67] | 50 [67] | 0.3 [73] | 15 [74,67] | |
| NaS Battery | 8 [71] | 4 | 75 [72] | 2000 [71] | 80 [67] | 0.3 [73] | 20 | |
| Vanadium Redox Flow Battery (VRFB) | 100 [71] | 4 | 80 [72] | 1500 [67] | 37 [67] | 0.3 [73] | 20 | |
| Pumped Hydro Storage (PHS) | 2315 [71] | 10 | 80 [70] | Figure A3 | 18.66 [55] | 0.54 [55] | 80 | |
| Thermal Energy Storage (TES) | 100 [71] | 10 | 80 | 300 [67,68] | 53.7 [69] | - | 25 |

Figure A1.
Expected technology-based distribution (MW) in the near future.

Figure A2.
Overnight capital costs of a 60 MW Li-ion battery (NMC/LFP) at different durations [54].

Figure A3.
Overnight capital costs of pumped hydro storage (Class 10) [55].

Figure A4.
Fixed O&M (USD/kW/yr) of a 60 MW Li-ion battery (NMC/LFP) at different durations (2021–2050) [54].

Figure A5.
Projected CAPEX (USD/kW) of selected technologies [53].

Figure A6.
Projected fixed O&M (USD/kW-yr) of selected technologies [53].

Figure A7.
Projected variable O&M (USD/MWh) of selected technologies [53].

Figure A8.
Projected heat rates of natural gas-based power generation [53].

Figure A9.
Targeted carbon emission reductions compared to BAU–DEWA [51].

Figure A10.
Generation capacity (MW) of modelled scenarios—2050.
References
- Koko, S.P. Optimal battery sizing for a grid-tied solar photovoltaic system supplying a residential load: A case study under South African solar irradiance. Energy Rep. 2022, 8, 410–418. [Google Scholar] [CrossRef]
- Grimm, A.; Jong, W.A.D.; Kramer, G.J. Renewable hydrogen production: A techno-economic comparison of photoelectrochemical cells and photovoltaic-electrolysis. Int. J. Hydrogen Energy 2020, 45, 22545–22555. [Google Scholar] [CrossRef]
- Sgouridis, S.; Abdullah, A.; Griffiths, S.; Saygin, D.; Wagner, N.; Gielen, D.; Reinisch, H.; McQueen, D. RE-mapping the UAE’s energy transition: An economy-wide assessment of renewable energy options and their policy implications. Renew. Sustain. Energy Rev. 2016, 55, 1166–1180. [Google Scholar] [CrossRef]
- Hassan, Q.; Viktor, P.; Al-Musawi, T.J.; Ali, B.M.; Algburi, S.; Alzoubi, H.M.; Al-Jiboory, A.K.; Sameen, A.Z.; Salman, H.M.; Jaszczur, M. The renewable energy role in the global energy Transformations. Renew. Energy Focus 2024, 48, 100545. [Google Scholar] [CrossRef]
- Pietzcker, R.C.; Stetter, D.; Manger, S.; Luderer, G. Using the sun to decarbonize the power sector: The economic potential of photovoltaics and concentrating solar power☆. Appl. Energy 2014, 135, 704–720. [Google Scholar] [CrossRef]
- Gielen, D.; Boshell, F.; Saygin, D.; Bazilian, M.D.; Wagner, N.; Gorini, R. The role of renewable energy in the global energy transformation. Energy Strategy Rev. 2019, 24, 38–50. [Google Scholar] [CrossRef]
- AlFarra, H.J.; Abu-Hijleh, B. The potential role of nuclear energy in mitigating CO2 emissions in the United Arab Emirates. Energy Policy 2012, 42, 272–285. [Google Scholar] [CrossRef]
- Mezher, T.; Dawelbait, G.; Abbas, Z. Renewable energy policy options for Abu Dhabi: Drivers and barriers. Energy Policy 2012, 42, 315–328. [Google Scholar] [CrossRef]
- Salimi, M.; Hosseinpour, M.; N.Borhani, T. Analysis of Solar Energy Development Strategies for a Successful Energy Transition in the UAE. Processes 2022, 10, 1338. [Google Scholar] [CrossRef]
- Elshurafa, A.M.; Alatawi, H.; Soummane, S.; Felder, F.A. Assessing effects of renewable deployment on emissions in the Saudi power sector until 2040 using integer optimization. Electr. J. 2021, 34, 106973. [Google Scholar] [CrossRef]
- TUAEG. UAE Energy Strategy 2050. 2023. Available online: https://u.ae/en/about-the-uae/strategies-initiatives-and-awards/strategies-plans-and-visions/environment-and-energy/uae-energy-strategy-2050 (accessed on 17 September 2023).
- Emirates News Agency (WAM). UAE Announces Net Zero by 2050 Strategic Initiative; Emirates News Agency: Abu Dhabi, United Arab Emirates, 7 October 2021; Available online: http://wam.ae/en/details/1395302978138 (accessed on 22 February 2023).
- International Energy Agency. United Arab Emirates, Key Energy Statistics, 2021. Available online: https://www.iea.org/countries/united-arab-emirates (accessed on 14 January 2024).
- IEA. Evolution of Electricity Generation in United Arab Emirates Since 2000. Available online: https://www.iea.org/countries/united-arab-emirates/energy-mix (accessed on 13 April 2024).
- Naimi, M.S.A.; Ali, M.I.H.; Mogi, G. Abu Dhabi Energy Mix using PLEXOS as optimization tool. In Proceedings of the 5th International Conference on Renewable Energy: Generation and Applications (ICREGA), Al Ain, United Arab Emirates, 25–28 February 2018. [Google Scholar]
- DEWA. Renewable Energy Shaping the Future of Sustainability; DEWA: Abu Dhabi, United Arab Emirates, 4 January 2020. Available online: https://www.dewa.gov.ae/en/about-us/media-publications/latest-news/2020/01/renewable-energy-shaping-the-future-of-sustainability (accessed on 10 April 2024).
- CNN. $13.6B Record-Breaking Solar Park Rises from Dubai Desert; CNN: New York, NY, USA, 25 April 2019; Available online: https://amp.cnn.com/cnn/style/article/mbr-solar-park-dubai-desert-intl (accessed on 10 April 2024).
- TUAEG. Dubai Clean Energy Strategy. 2023. Available online: https://u.ae/en/about-the-uae/strategies-initiatives-and-awards/strategies-plans-and-visions/environment-and-energy/dubai-clean-energy-strategy#:~:text=Dubai%20Clean%20Energy%20Strategy%20aims,clean%20energy%20and%20green%20economy (accessed on 14 October 2023).
- Gandhi, K.; Apostoleris, H.; Sgouridis, S. Catching the hydrogen train: Economics-driven green hydrogen adoption potential in the United Arab Emirates. Int. J. Hydrogen Energy 2022, 47, 22285–22301. [Google Scholar] [CrossRef]
- Emirates Nuclear Energy Corporation. Barakah Nuclear Energy Plant. 2022. Available online: https://www.enec.gov.ae/barakah-plant/#:~:text=The%20Barakah%20Nuclear%20Energy%20Plant%20%28Barakah%20NPP%29%2C%20composed,the%20United%20Arab%20Emirates%20and%20the%20Arab%20World (accessed on 7 March 2024).
- Emirates Water and Electricity Company. Who We Are. Available online: https://ewec.ae/who-we-are (accessed on 15 January 2024).
- Dubai Electricity and Water Authority. MD&CEO Message. Available online: https://www.dewa.gov.ae/en/about-us/strategy-excellence/md-ceo-message (accessed on 15 January 2024).
- Emirates Water and Electricity Company. Statement of Future Capacity Requirements 2024–2037; EWEC: Abu Dhabi, United Arab Emirates, 2024; Available online: https://www.ewec.ae/uploads/mediakit/1747641325/Statement%20of%20Future%20Capacity%20Requirements%202024-2037_%20Summary%20Report.pdf (accessed on 5 December 2025).
- Emirates News Agency (WAM). EWEC Invites EOI Submissions for Development of Battery Energy Storage System; Emirates News Agency: Abu Dhabi, United Arab Emirates, 7 March 2024. Available online: https://www.wam.ae/en/article/b20vszh-ewec-invites-eoi-submissions-for-development (accessed on 7 December 2025).
- Dubai Electricity & Water Authority. Annual Statistics; Dubai Electricity & Water Authority: Abu Dhabi, United Arab Emirates, 9 May 2023. Available online: https://www.dewa.gov.ae/en/about-us/strategy-excellence/annual-statistics (accessed on 7 January 2024).
- Tayer, H.S.M.A. Dubai Is Steadily Moving Towards Net-Zero by 2050; Dubai Electricity and Water Authority (DEWA): Abu Dhabi, United Arab Emirates, 4 March 2024. Available online: https://www.dewa.gov.ae/en/about-us/media-publications/latest-news/2024/03/dubai-is-steadily-moving-towards-net-zero-by-2050#:~:text=The%20city%20is%20on%20track,of%20achieving%2027%25%20by%202030 (accessed on 20 April 2024).
- United Arab Emirates Ministry of Energy and Industry. UAE State of Energy Report 2019; United Arab Emirates Ministry of Energy and Industry: Abu Dhabi, United Arab Emirates, 2019. [Google Scholar]
- Dubai Electricity & Water Authority. Promising Prospects for Clean and Renewable Energy Thanks to the Vision and Directives of Our Wise Leadership; DEWA: Abu Dhabi, United Arab Emirates, 17 June 2022. Available online: https://www.dewa.gov.ae/en/about-us/media-publications/latest-news/2022/06/promising-prospects (accessed on 14 October 2023).
- Dubai Electricity & Water Authority. DEWA PJSC Integrated Report; DEWA: Abu Dhabi, United Arab Emirates, 2022. [Google Scholar]
- DEWA. DEWA’s Adoption of Clean Energy Storage Technologies Enhances Energy Security in Dubai; DEWA: Abu Dhabi, United Arab Emirates, 7 January 2024. Available online: https://www.dewa.gov.ae/en/about-us/media-publications/latest-news/2024/01/dewas-adoption-of-clean-energy-storage#:~:text=The%20250MW%20station%20will%20have,and%20operational%20facilities%20is%20ongoing (accessed on 18 April 2024).
- Dubai Electricity & Water Authority. Annual Statistics Booklet 2024; DEWA: Abu Dhabi, United Arab Emirates, 6 March 2024. Available online: https://www.dewa.gov.ae/en/about-us/strategy-excellence/annual-statistics (accessed on 8 February 2024).
- UAE Ministry of Energy & Industry. UAE National Energy Strategy 2050—Presentation for CEM Long Term Energy Scenarios. Available online: https://www.irena.org/-/media/Files/IRENA/Agency/Webinars/UAE-Presentation_LTES.pdf?la=en%26hash=7AB6DF56E17BE7CE5841CF5015DA9BE55F10C919 (accessed on 15 January 2024).
- Embassy of the United Arab Emirates Washington, DC. UAE Energy Diversification. Available online: https://www.uae-embassy.org/discover-uae/climate-and-energy/uae-energy-diversification (accessed on 25 February 2023).
- Trichakis, P.; Carter, N.; Tudhope, S.; Patel, I.; Sgouridis, S.; Griffiths, S. Enabling the UAE’S Energy Transition—Top Ten Priority Areas for Renewable Energy Policymakers; Khidmah: Abu Dhabi, United Arab Emirates, 2018. [Google Scholar]
- Brinkerink, M.; Gallachóir, B.Ó.; Deane, P. Building and Calibrating a Country-Level Detailed Global Electricity Model Based on Public Data. Energy Strategy Rev. 2021, 33, 100592. [Google Scholar] [CrossRef]
- Foster, J.; Wagner, L.; Liebman, A. Modelling the Electricity and Natural Gas Sectors for the Future Grid: Developing Co-Optimisation Platforms for Market Redesign. 2015. Available online: https://mpra.ub.uni-muenchen.de/70114/1/MPRA_paper_70114.pdf (accessed on 19 April 2024).
- Bank, T.W. Variable Renewable Energy Integration and Planning Study; The World Bank: Washington, DC, USA, 2020. [Google Scholar]
- Energy Exemplar. Plexos—The Energy Analytics and Decision Platform for all Systems. Available online: https://www.energyexemplar.com/plexos (accessed on 6 January 2024).
- Hamdi, M.; El Salmawy, H.A.; Ragab, R. Incorporating operational constraints into long-term energy planning: The case of the Egyptian power system under high share of renewables. Energy 2024, 300, 131619. [Google Scholar] [CrossRef]
- Energy Exemplar. Electricity Market Modeling with PLEXOS. Available online: https://xpert.energyexemplar.com/electricity-market-modeling/1131796 (accessed on 19 January 2024).
- PLEXOS Overview. In Proceedings of the EMFC Conference, Boston, MA, USA, 27–28 August 2018.
- Dubai Electricity and Water Authority. Dubai Electricity and Water Authority PJSC Announces Record Operating and Financial Results for the 3rd Quarter of 2023; Dubai Electricity and Water Authority: Abu Dhabi, United Arab Emirates, 10 November 2023. Available online: https://www.dewa.gov.ae/en/about-us/media-publications/latest-news/2023/11/dubai-electricity-and-water-authority-pjsc#:~:text=DEWA%20has%20added%20200%20MW,the%203rd%20quarter%20of%202023.&text=By%202030%2C%20DEWA%20will%20add,capacity%20will%20reach%2073 (accessed on 21 January 2024).
- Dubai Electricity and Water Authority. DEWA Sustainability Report 2017. 2017. Available online: https://www.dewa.gov.ae/en/consumer/sustainability/sustainability-reports (accessed on 20 December 2025).
- Dubai Electricity and Water Authority. DEWA Sustainability Report 2022. 2022. Available online: https://www.dewa.gov.ae/en/consumer/sustainability/sustainability-reports (accessed on 20 December 2025).
- Energy & Utilities. Dubai Identifies Site for UAE’s First Wind Farm; Energy & Utilities: Warwickshire, UK, 18 August 2021; Available online: https://energy-utilities.com/dubai-identifies-site-for-uae-s-first-wind-farm-news113780.html#:~:text=of%20the%20emirate.-,Using%20preliminary%20data%2C%20Dubai%20has%20identified%20an%20area%20in%20Hatta,year%20using%20a%20150m%20tower (accessed on 18 April 2024).
- Bagchi, A. Site Identified in Dubai for UAE’s First Wind Farm. ME Construction News. 22 August 2021. Available online: https://meconstructionnews.com/48885/site-identified-in-dubai-for-first-uae-wind-farm (accessed on 7 April 2024).
- Schult, H.; Bons, M.; Thamm, M.; Maas, N.; Dertinger, A.; Schimmel, M.; Kerres, P.; Alhanaee, N.; Bräuniger, S. Exploring the Potential of Wind Energy in the United Arab Emirates. 2023. Available online: https://www.energypartnership-uae.org/fileadmin/user_upload/vae/publications/Guidehouse_Exploring_UAE_Wind_Energy_Potential_2023.pdf (accessed on 7 April 2024).
- Energy Exemplar. LT Plan Integration; Energy Exemplar: Lake City, UT, USA, 2021. [Google Scholar]
- Mondol, J.D.; Carr, C. Techno-economic assessments of advanced Combined Cycle Gas Turbine (CCGT) technology for the new electricity market in the United Arab Emirates. Sustain. Energy Technol. Assess. 2017, 19, 160–172. [Google Scholar] [CrossRef]
- Santos, R.; Sgouridis, S.; Alhajaj, A. Potential of CO2-enhanced oil recovery coupled with carbon capture and storage in mitigating greenhouse gas emissions in the UAE. Int. J. Greenh. Gas Control. 2021, 111, 103485. [Google Scholar] [CrossRef]
- Dubai Electricity and Water Authority. DEWA Climate Change Report 2021; DEWA: Abu Dhabi, United Arab Emirates, 2021. [Google Scholar]
- Luckow, P.; Stanton, E.A.; Fields, S.; Biewald, B.; Jackson, S.; Fisher, J.; Wilson, R. 2015 Carbon Dioxide Price Forecast; Synapse Energy Economics: Cambridge, MA, USA, 2015. [Google Scholar]
- National Renewable Energy Lab. Annual Technology Baseline. Available online: https://atb.nrel.gov/electricity/2023/other_technologies_(eia) (accessed on 18 February 2024).
- NREL. Utility-Scale Battery Storage. Available online: https://atb.nrel.gov/electricity/2023/utility-scale_battery_storage (accessed on 9 March 2024).
- NREL. Pumped Storage Hydropower. Available online: https://atb.nrel.gov/electricity/2023/pumped_storage_hydropower (accessed on 9 March 2024).
- EIA. Cost and Performance Characteristics of New Generating Technologies, Annual Energy Outlook 2022; U.S. Energy Information Administration: Washington, DC, USA, 2022. [Google Scholar]
- NREL. Utility-Scale PV. Available online: https://atb.nrel.gov/electricity/2023/utility-scale_pv (accessed on 25 February 2024).
- Elbeh, M.B.; Sleiti, A.K. Analysis and optimization of concentrated solar power plant for application in arid climate. Energy Sci. Eng. 2021, 9, 784–797. [Google Scholar] [CrossRef]
- Dubai Electricity and Water Authority. Annual Statistics 2022. 2022. Available online: https://www.dewa.gov.ae/en/about-us/strategy-excellence/annual-statistics (accessed on 11 January 2024).
- Emirates Water and Electricity Company. Statistical Reports. Available online: https://www.ewec.ae/media-kit/statistical-reports (accessed on 18 February 2024).
- Emirates Water and Electricity Company. Statistical Leaflet 2022; EWEC: Abu Dhabi, United Arab Emirates, 2022. [Google Scholar]
- IRENA. Renewable Power Generation Costs in 2022; IRENA: Abu Dhabi, United Arab Emirates, 2022. [Google Scholar]
- Dubai Electricity and Water Authority. Hassyan Power Complex. Available online: https://www.dewa.gov.ae/en/about-us/strategic-initiatives/hassyan (accessed on 21 January 2024).
- DEWA. DEWA Selects Preferred Bidder for 1800 MW Solar PV IPP Project—Sixth Phase of the Mohammed bin Rashid Al Maktoum Solar Park. 2023. Available online: https://www.dewa.gov.ae/en/about-us/media-publications/latest-news/2023/08/dewa-selects-preferred-bidder (accessed on 5 December 2023).
- Dubai Electricity and Water Authority. Mohammed bin Rashid Al Maktoum Solar Park. 2023. Available online: https://www.dewa.gov.ae/en/about-us/strategic-initiatives/mbr-solar-park (accessed on 21 January 2024).
- Lazard. LCOE V16; Lazard: New York, NY, USA, 2023. [Google Scholar]
- Hossain, E.; Faruque, H.M.R.; Sunny, M.S.H.; Mohammad, N.; Nawar, N. A Comprehensive Review on Energy Storage Systems: Types, Comparison, Current Scenario, Applications, Barriers, and Potential Solutions, Policies, and Future Prospects. Energies 2020, 13, 3651. [Google Scholar] [CrossRef]
- Rahman, M.M.; Oni, A.O.; Gemechu, E.; Kumar, A. Assessment of energy storage technologies: A review. Energy Convers. Manag. 2020, 223, 113295. [Google Scholar] [CrossRef]
- Balliet, W.H.; McLaughlin, L.; Ma, Z.; Glusenkamp, K. Technology Strategy Assessment—Thermal Energy Storage; U.S. Department of Energy: Washington, DC, USA, 2023. [Google Scholar]
- Bocklisch, T. Hybrid energy storage systems for renewable energy applications. Energy Procedia 2015, 73, 103–111. [Google Scholar] [CrossRef]
- Chakraborty, M.R.; Dawn, S.; Saha, P.K.; Basu, J.B.; Ustun, T.S. A Comparative Review on Energy Storage Systems and Their Application in Deregulated Systems. Batteries 2022, 8, 124. [Google Scholar] [CrossRef]
- Schaber, C.; Mazza, P.; Hammerschlag, R. Utility-Scale Storage of Renewable Energy. Electr. J. 2004, 17, 21–29. [Google Scholar] [CrossRef]
- U.S. Department of Energy. Energy Storage Technology and Cost Characterization Report; U.S. Department of Energy: Washington, DC, USA, 2019. [Google Scholar]
- Asri, L.I.M.; Ariffin, W.N.S.F.W.; Zain, A.S.M.; Nordin, J.; Saad, N.S. Comparative Study of Energy Storage Systems (ESS). In Proceedings of the 1st International Conf on Engineering and Technology, Online, 15–16 March 2021. [Google Scholar]
Disclaimer/Publisher’s Note: The statements, opinions and data contained in all publications are solely those of the individual author(s) and contributor(s) and not of MDPI and/or the editor(s). MDPI and/or the editor(s) disclaim responsibility for any injury to people or property resulting from any ideas, methods, instructions or products referred to in the content. |
© 2025 by the authors. Licensee MDPI, Basel, Switzerland. This article is an open access article distributed under the terms and conditions of the Creative Commons Attribution (CC BY) license.