Abstract
Driven by growing electricity demand, Algeria is diversifying its energy mix with a focus on solar power. A successful transition requires robust climate analysis to guide decision makers and investments. This study investigated the influence of specific weather regimes (WRs) on Algeria’s energy sector, analyzing their summer impacts on solar production, energy demand, and the resulting energy shortfall, expressed as the daily difference between demand and potential solar generation. We further examined the occurrence of Energy Supply Droughts (ESDs), periods when this shortfall exceeds a critical threshold. It was observed that days with a negative North Atlantic Oscillation (NAO−) followed by an Atlantic Ridge (AR) generate a solar surplus and lower demand, creating ideal conditions for energy storage. Conversely, a positive North Atlantic Oscillation (NAO+) reduces production while increasing demand, frequently leading to ESD events. Although generally neutral, Scandinavian Blocking (BL) also contributes to ESDs by amplifying unfavorable energy anomalies. Notably, ESD events associated with NAO+ and BL show strong convergence with similar synoptic configurations and spatial structures. However, while WRs are useful for operational forecasting, predicting extreme ESDs requires an approach that directly targets extreme weather conditions.
1. Introduction
1.1. Energy Context and Climate Challenges
Algeria is undergoing a major energy transition, driven by a sharp rise in electricity consumption. According to the Ministry of Energy and Mines, national demand tripled from 20.7 TWh in 2002 to 63 TWh in 2020, with a further 5% increase in the first nine months of 2024 compared to the same period in 2023. Projections from the Electricity and Gas Regulatory Commission (CREG) suggest consumption could reach 150 TWh by 2030 and 250 TWh by 2050. This growth is fueled by three key socio-economic factors: rising living standards, rapid urbanization, and sustained population growth [1,2].
The residential sector is the primary driver of this demand, accounting for approximately 39% of total electricity consumption in 2023 [3]. A major contributor is the widespread adoption of air conditioning, where about 6.6 million units were installed in Algeria between 2000 and 2013 [4]. This shift is causing a structural change in the national energy profile, moving peak consumption from winter to summer and intensifying the link between electricity demand and cooling degree days, as depicted by Figure 1 (a trend confirmed by recent studies [5,6]). This pattern is expected to intensify, where the air conditioning market is projected to grow by 7.9% annually from 2025 to 2031, positioning Algeria as the third-largest market in Africa after Egypt and Nigeria [7].
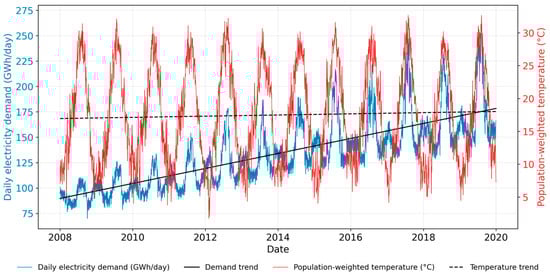
Figure 1.
The evolution of daily electricity consumption as a function of population-weighted regional mean temperature. Period: January 2008 to January 2020. The trend line for each series is also shown.
Climate change is exacerbating Algeria’s energy vulnerability. A pronounced warming trend of 0.49 °C per decade from 2000 to 2023 surpasses the global average of 0.37 °C per decade for the same period [7]. This rapid warming, coupled with accelerating air conditioning adoption, is intensifying key challenges for the energy sector, including higher summer peak demand (as evidenced by a record 19.1 GWh in July 2024 [8]), longer heatwaves, and an increased risk of shortfalls between electricity demand and renewable generation [5,6].
This growing climate pressure coincides with a generation fleet that remains, in 2023, as an over 98.7% dependence on natural gas [9]. This fossil fuel dependence sustains a significant carbon footprint of 3.9 metric tons of CO2 per capita as of 2023 [10].
In this context, a transition to a renewable energy mix is a strategic imperative driven by economic and climate necessity. Algeria possesses substantial geographical advantages for this transition as over 80% of the country is covered by the Sahara Desert, which receives daily solar radiation of ≈5–6 kWh/m2/day (often exceeding 6.5–7 kWh/m2/day), with annual potential varying between 1700 and 2650 kWh/m2 [11,12,13,14].
Capitalizing on this potential, the Algerian government initiated an ambitious energy transition program to supply 27% of the national electricity demand from renewable energy sources by 2030, primarily through solar photovoltaic (PV), aligning with sustainable development goals and international climate commitments [15]. A key pillar of this strategy is the large-scale deployment of PVs, a technology that is ideally matched to the high-insolation conditions of the Saharan environment.
1.2. Weather Regimes as Analytical Framework
Algeria’s shift to clean energy strongly depends on climatic conditions, as PV generation is intrinsically governed by meteorological factors and is subject to complex seasonal variations. The performance of PV systems is primarily determined by three key variables: solar irradiance, which directly controls electricity generation; ambient temperature, which can reduce cell efficiency beyond an optimal threshold of approximately 25 °C; and wind speed, which helps moderate module temperature to reduce thermal losses [16]. Therefore, obtaining accurate and reliable assessments of climate change impacts on these variables is essential. Such analysis is critical for informing national energy strategy and de-risking future investments in solar infrastructure.
WRs offer a robust framework for analyzing climate-energy interactions. Defined as persistent, recurring patterns of large-scale atmospheric circulation that can last from days to weeks, WRs are well-established tools for weather forecasting and climate impact studies [17,18,19]. Their influence on surface meteorological variables, and consequently on solar energy production, is extensively documented (e.g., [20,21,22,23,24,25,26]). While the impact of WRs on winter energy production, both solar and wind, has been extensively studied in the European context (e.g., [27,28,29,30,31,32,33]), research focusing on the Mediterranean and North Africa remains comparatively limited (e.g., [34,35]). This study addresses this critical geographical gap by presenting the first comprehensive analysis of Algeria’s solar energy potential and its summer variability driven by WRs, a period coinciding with peak electricity demand. Using a long-term WR classification derived from ERA5 reanalysis, we quantified the impact of each regime on key meteorological factors and assessed their influence on national energy production and demand. We further introduced an ESD indicator to evaluate the risk of critical solar energy shortfalls during persistent WRs.
To assess the utility of WRs as indicators of meteorological influences on the national energy sector, we addressed two key questions:
- (i)
- What are the average effects of different WRs on energy production, demand, and shortfalls?
- (ii)
- Do episodes of high energy demand coupled with low production correspond to specific WRs?
The paper is structured as follows: Section 2 details the data and methodologies used for analysis. Section 3 presents the results on observed WRs and their impacts on PV potential, electricity demand, shortfall days, and ESDs. Section 4 provides a discussion contextualizing these findings, and Section 5 summarizes the conclusions.
2. Materials and Methods
2.1. Meteorological Data
Daily averages from ERA5, the fifth generation of reanalysis produced by the European Centre for Medium-Range Weather Forecasts (ECMWF) as part of the European Commission’s Copernicus Climate Change Service (C3S) [36], were used to analyze changes in atmospheric circulation [28,32,37,38,39,40]. ERA5 stands out for its integration of advanced physical models and the use of the 4D-Var assimilation method, combining satellite and terrestrial observations for a better representation of atmospheric patterns.
A significant advancement over its predecessor, ERA-Interim, ERA5 provides hourly data from 1940 to the present. It features enhanced spatial resolution (0.25° × 0.25°, approximately 31 km) and resolves the atmosphere using 137 vertical levels from the surface to 0.01 hPa, capturing spatio-temporal details with unprecedented fidelity for a global reanalysis.
ERA5 data (1940–2024) were used to characterize long-term WRs and their spatial meteorological signatures, providing a robust climatology. For the joint analysis of PV generation and electricity demand, we used the Pan-European Climate Database (PECD v4.2) [41]. These nationally aggregated, bias-corrected time series are derived from ERA5 and are post-processed specifically for national-scale energy balance analysis, matching the resolution and coverage of the demand data.
2.2. Methods
2.2.1. Weather Regime Classification
Each summer day (June–August), the ERA5 dataset from 1940 to 2024 was assigned to one of four established WRs using an Empirical Orthogonal Function (EOF) and K-means framework, following the classification methodology of Cassou [42] and was consistent with prior studies [18,19,21]. The classification was based on daily maps of geopotential height anomalies at 500 hPa (Z500) over northwestern Africa (25° W–25° E, 18° N–45° N). Anomalies were first computed by subtracting the monthly climatology at each grid point, thereby removing the monthly mean seasonal cycle.
EOF analysis was employed to reduce the dimensions of the geopotential height anomaly fields. Prior to decomposition, the data were weighted by the square root of the cosine of latitude to correct for meridional convergence and to ensure equal-area representation. A scree test of the first 12 EOFs indicated a distinct elbow at the fourth mode. The first four principal components were therefore retained, as they captured 80.4% of the cumulative variance (Figure 2).
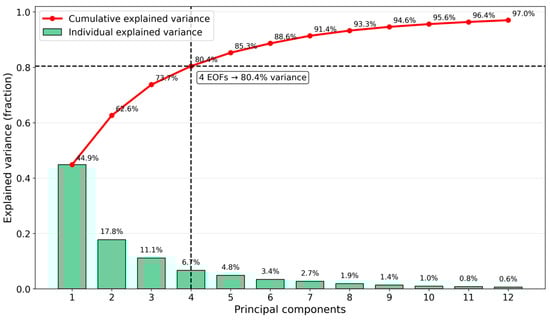
Figure 2.
The explained variance by different principal components.
The time series associated with these EOFs were used as coordinates in a reduced phase space, where each daily circulation pattern was represented as a point. The optimal number of clusters was determined to be k = 4, selected by maximizing the silhouette score across k = 2 to 6. This choice yielded a marginally better silhouette score (0.222) than k = 3 (0.218), while remaining physically interpretable and consistent with the established four-regime framework. The k = 2 solution was rejected as physically oversimplified despite its higher score (0.35), and k ≥ 5 resulted in over-partitioning of the data. The final WRs are presented and analyzed in Section 3.
2.2.2. Energy Model
A daily solar power potential model was developed to quantify the impact of WRs on PV energy production. This meteorological model estimates the theoretical energy yield based solely on climate drivers, independent of installed capacity [43] and panel-specific characteristics, such as tilt or orientation [44,45,46].
The PV potential Ppot (no units) was calculated as follows:
With Pr, the performance ratio (no units), G is the incident solar radiation (Wm−2) and Gstc is the incident radiation under standard test conditions (STC) (1000 Wm−2) [43,47,48].
Moreover, Pr is defined as a function of solar cell temperature Tcell (°C), which exerts a negative influence:
in which
where Tstc represents the ambient air temperature at Standard Test Conditions (25 °C); γ denotes the temperature coefficient, taken as −0.005 °C−1 [43]; and Tcell is modeled as a function of the mean daytime air temperature (Tday, °C), incident solar radiation (G, W m−2), and wind speed (V, m s−1), with the following system-specific regression coefficients: c1 = 4.3 °C, c2 = 0.943, c3 = 0.028 °C·m2·W−1, and c4 = −1.528 °C·s·m−1 [46]. This coefficient was empirically derived from the long-term monitoring of crystalline-silicon PV modules at test facilities in Colorado and Arizona. Given the climatic similarity characterized by high irradiance, elevated temperatures, and significant wind speeds between these sites and Algeria, this coefficient set is well suited for our regional-scale assessment.
Historical energy demand data were obtained from the Sonelgaz database, Algeria’s primary electricity utility. This publicly available dataset (https://doi.org/10.17632/z5x2d3mhw7.1) provides 12 years of hourly data (2008–2020) [49], collected via a national SCADA (Supervisory Control and Data Acquisition) system from interconnected power generation centers [50]. Figure 3 illustrates the relationship between the daily energy demand and population-weighted temperature.
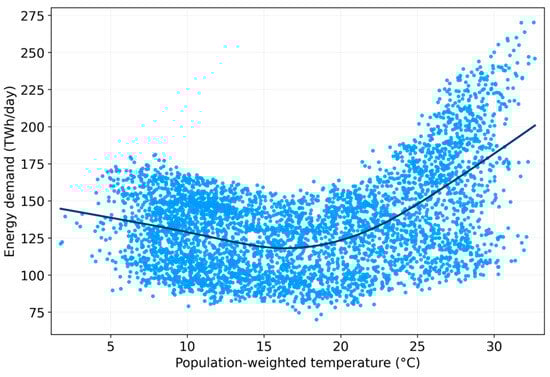
Figure 3.
Daily electricity demand as a function of the population-weighted regional mean temperature. Light blue dots represent the observed data, and the dark blue curve shows the fitted regression model. Period: January 2008 to January 2020.
2.2.3. Analysis
The average effect of each WR on the surface meteorology and energy potential was analyzed using composite methods. This required calculating the averages of all the days classified in a given regime. Anomalies, defined as deviations from the summer climatology (JJA), were used to assess the deviations from normal conditions.
For the spatial analysis in Section 3.2 and Section 3.5, the solar potential was computed directly from the ERA5 data (surface solar irradiance, 2 m temperature, and 10 m wind speed) at each grid point. The daily averages were calculated considering only summer daylight hours (06:00–19:00 UTC) to reflect the realistic PV operating conditions and to quantify the impact of meteorological variability on conversion efficiency. For the national-scale analysis (Section 3.3 and Section 3.4), the solar potential was derived from pre-aggregated ERA5-based time series provided by the PECD v4.2 database, which was specifically designed for energy balance and power system applications. Here, the daily cumulative values (GWh/day) were computed to align with the resolution of the electricity demand data. The overall methodology is summarized in Figure 4.
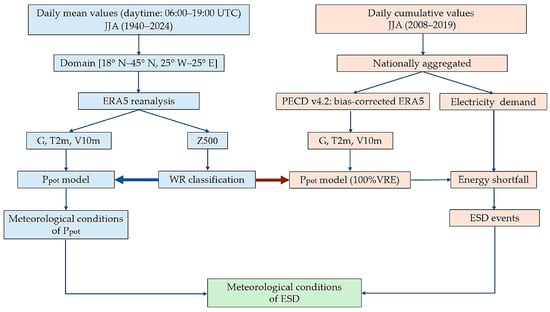
Figure 4.
Flowchart of the study design to assess the impact of weather patterns on the potential for solar power generation, energy shortfall, and ESD events.
To analyze the relationship between high energy demand and low solar production, we adopted the ESD methodology from Raynaud et al. [51]. This framework identifies the critical periods when the grid is under stress by calculating the daily difference between energy demand and solar production. We first define the daily energy shortfall S (j) as follows:
where D(j) is the daily energy demand and P(j) is the potential solar production at day j. A positive S(j) indicates an energy shortfall, while a negative value indicates a surplus.
S(j) = D(j) − P(j),
The Supply Deficiency Index (SDI) was computed for each day, and an ESD event was identified when the shortfall was greater than a specified threshold of the average demand. The SDI is calculated as follows:
where Dm is the mean daily demand over 2008–2019. A threshold of k = 0.5, corresponding to moderate drought conditions in Raynaud et al. [51], was applied within a scenario of 100% VRE. Sensitivity tests with a more stringent threshold (k = 0.8, for severe events) yielded no ESD days, indicating that such extreme solar-driven deficits are not captured in our dataset.
The 100% VRE scenario allows for a conceptual normalization to isolate the meteorological drivers of supply–demand co-variability. By assuming the entire load is supplied by solar power, demand and production are placed on a common basis, revealing characteristic climate ‘fingerprints’ for energy shortfalls that are independent of installed capacity. For any realistic penetration level α (e.g., α = 0.27 by 2030 for Algeria), production can be rescaled (Pα(j) = α · P(j)). Since the SDI is linear in P(j), the timing and relative frequency of ESD events remain governed by WRs, while their magnitude is proportional to α. Thus, our 100% VRE results represent an upper bound on shortfall severity that can be directly downscaled to inform planning.
3. Results
3.1. Weather Regimes
A systematic comparison of the WRs was conducted to assess energy variability across summer days. Figure 5 displays the composite atmospheric circulation patterns for the four WRs identified over the domain [18° N–45° N, 25° W–25° E]. These patterns are consistent with established classifications (e.g., [18,19,24]).
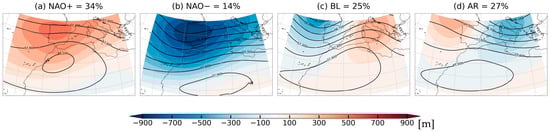
Figure 5.
The composite patterns of a 500 hPa geopotential height for the four summer WRs: (a) NAO+, (b) NAO−, (c) BL, and (d) AR. Anomalies (shaded, m) were computed relative to the JJA climatology (1940–2024). Contours show the mean geopotential height isolines (300 m intervals), defining the synoptic-scale circulation. Regime frequencies are indicated as percentages. Domain: 25° W–25° E, 18° N–45° N. Data: ERA5 reanalysis.
Two regimes represent the opposing phases of NAO [52]. As shown in Figure 5a, the NAO+ regime features a strong positive geopotential height anomaly over the northeastern Atlantic and western Europe, extending into northwestern Africa. In contrast, the NAO− regime, as depicted in Figure 5b, is characterized by a pronounced negative geopotential height anomaly centered over the Iberian Peninsula, which extends across the domain while weakening southeastward. The remaining two regimes are defined by a meridional dipole of the geopotential height anomaly. The BL regime, as shown in Figure 5c, exhibits a positive anomaly over southeastern Europe and the Mediterranean, extending into eastern North Africa, and it is paired with a negative anomaly over the North Atlantic. Conversely, the AR regime, as illustrated in Figure 5d, shows an opposite dipole structure, with positive anomalies in the west and negative anomalies in the east.
Over the 85 seasons study period, NAO+ is the most frequent regime (34%), followed by AR (27%), BL (25%), and NAO− (14%) (Figure 5).
The persistence of WRs across the 85 analyzed summer seasons is shown in Figure 6. The distributions reveal that half of all the episodes for each regime last fewer than three consecutive days (median). However, notable differences exist; NAO− exhibits the longest mean persistence (5.35 days), followed by AR (4.70 days), while NAO+ (3.65 days) and BL (3.37 days) are notably shorter-lived.
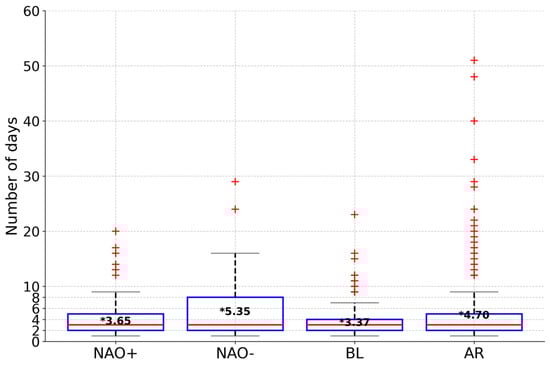
Figure 6.
Box plot showing the persistence of the WRs during summer (JJA, 1940–2024). Boxes represent the interquartile range (25th–75th percentiles), with the central line indicating the median and the asterisk (with value) showing the mean. The ends of the whiskers correspond to the lowest (highest) value in the interquartile range of the lower (upper) quartile. Aberrant values are represented individually by ‘+’.
The interquartile range (25th–75th percentiles) indicates that most events persist for 2–8 days. AR demonstrates the greatest variability, with sequences lasting up to 52 days. In contrast, NAO− has a more homogeneous distribution with only two outliers (maximum 29 days). NAO+ and BL are more tightly grouped around their upper quartiles, though their maxima still reach 20 and 22 days, respectively.
3.2. Meteorological and Energy Impacts
WRs have a significant influence on the surface conditions relevant to energy production. The large-scale circulation, defined by a 500 hPa geopotential height, governs the progression of synoptic systems and directly modulates key surface variables, including incoming solar radiation, near-surface temperature, and wind speed. Figure 7 illustrates the characteristic spatial anomalies of these meteorological variables for each regime, while Figure 8 translates these impacts onto the solar production potential. The ensuing sections (Section 3.2.1, Section 3.2.2, Section 3.2.3 and Section 3.2.4) detail the average spatial characteristics, both meteorological and energetic, for each individual regime.
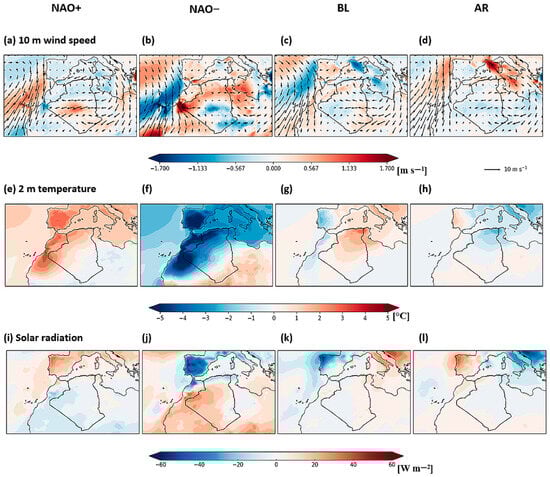
Figure 7.
The mean surface anomalies by regime. Colors show anomalies of a (a–d) 10 m wind speed (m s−1; vectors from U/V), where the wind vectors represent the average field (calculated from U and V components); (e–h) 2 m air temperature (°C); and (i–l) surface downward solar radiation (W m−2). Each WR in a column, labeled at the top, is the following from left to right: NAO positive, NAO negative, Scandinavian Blocking, and Atlantic Ridge. Figure is based on ERA5 data (JJA, 1940–2024).
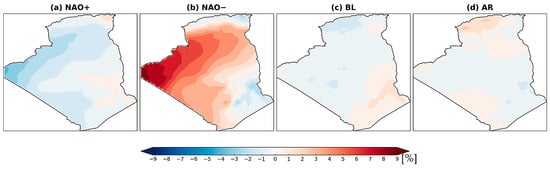
Figure 8.
Normalized anomalies of the potential power production impacts (%) of the four WRs. Each WR in a column, labeled at the top, is the following from left to right: NAO+, NAO−, BL, and AR. This figure is based on ERA5 data (JJA, 1940–2024).
3.2.1. NAO Positive
North of 35° N, the anticyclonic circulation indicated by the 58,200 m geopotential height contour (Figure 5a) impedes mid-latitude flows, restricting cold air advection (Figure 7a). This results in a widespread positive surface temperature anomaly across northwestern Africa (Figure 7e). Concurrently, NAO+ induces the most pronounced negative solar radiation anomaly, and it is centered over the Sahel and extending across the southern and western Sahara (Figure 7i). These conditions collectively cause a significant reduction in solar production potential across most of Algeria (Figure 8a).
3.2.2. NAO Negative
The NAO− regime is characterized by a pronounced zonal flow (geopotential height contour, Figure 5b), which advects intensified winds from the North Atlantic southward across northwestern Africa. This circulation promotes cold air advection (Figure 7b), resulting in negative temperature anomalies across most of the domain, except the southeast (Figure 7f). Despite the cooler temperatures, this regime exhibits the highest incoming solar radiation over northwestern Africa and the Sahel (Figure 7j). Consequently, it yields the highest solar production potential among all regimes, with significantly above-normal production across northern Algeria and the central-western Sahara. The potential remains near normal to low only in the southeast and along the Mediterranean coast (Figure 8b).
3.2.3. Scandinavian Blocking
The BL regime features an omega blocking pattern centered over the northeastern domain (geopotential height contour, Figure 5c), characteristic of persistent high pressure over Italy and the central Mediterranean. This circulation drives a pronounced warm anomaly extending from northeastern Europe across the Mediterranean, with a maximum over northeastern Algeria and Tunisia (Figure 7g). Concurrently, 10 m wind speeds decrease across the central and eastern Mediterranean (Figure 7c), indicating reduced air mass advection over the continent. These conditions lead to drier weather and a moderate increase in surface solar irradiance, particularly across eastern and southeastern Algeria (Figure 7k). Although the resulting solar production potential is higher than during NAO+ conditions, the positive anomaly remains modest across most of the territory (Figure 8c).
3.2.4. Atlantic Ridge
The AR regime is associated with a cyclonic circulation and an upper-level trough extending from Eastern Europe to the eastern Mediterranean (geopotential height contour, Figure 5d), creating atmospheric instability. This pattern channels cold air from the Mediterranean through Tunisia into the High Plains of northeastern Algeria (Figure 7d), resulting in negative temperature anomalies across northern Algeria (Figure 7h). The associated instability fosters cloud formation, which reduces surface solar irradiance in the northeast (Figure 7l). In contrast, the northwest remains under the influence of a stable high-pressure system. On average, the solar production potential during AR days exceeds that of the BL and NAO+ regimes, particularly in western and central coastal regions (Figure 8d).
3.3. Energy Variability Within Weather Regimes
The composite energy analysis reveals distinct regime-dependent signatures. Solar energy production (Figure 9a) is highest during NAO−, moderately elevated during AR, reduced during NAO+, and remains near the seasonal average during BL. Conversely, the energy demand (Figure 9b) peaks during NAO+ but is significantly suppressed during NAO− and AR; the demand during BL is close to the climatological mean. The resulting energy shortfall, the difference between demand and solar production (Figure 9c), directly reflects these patterns. A pronounced energy shortfall during NAO+ indicates peak grid stress. In contrast, an energy surplus during NAO− creates a favorable window for grid operation. The AR regime contributes moderately to grid stability, while the BL regime has a largely neutral net effect.
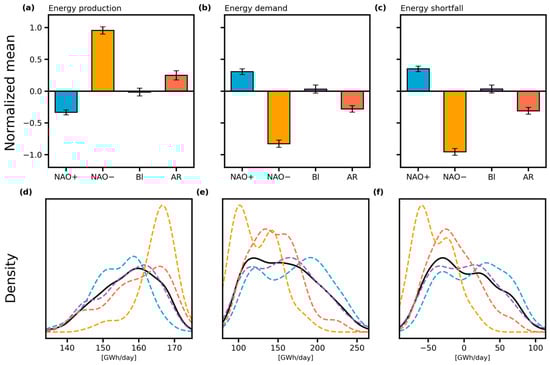
Figure 9.
WR impacts on energy variables. (a–c) The normalized mean anomalies of energy production, demand, and shortfall relative to the summer climatology. Error bars indicate ±1 standard error of the composite mean. (d–f) The density distributions of Algeria’s total energy production, demand, and shortfall for climatology (black solid line) and split by WR (colored dashed lines: NAO+ (blue), NAO− (orange), BL (purple), and AR (red)).
The variability within each regime, as illustrated by the distribution of energy variables (Figure 9d–f), reveals distinct impacts. Relative to the summer climatology (black line), NAO− shifts the solar production distribution toward higher values with a pronounced positive skew, indicating frequent energy surpluses. Concurrently, demand is constrained to lower values, creating recurrent favorable windows for the grid. Conversely, NAO+ exhibits a pattern of reduced production and increased demand, shifting distributions upward and resulting in a high probability of significant energy shortfall. The AR regime produces a weaker, yet favorable, signal similar to NAO−, reducing the frequency of energy shortfall without generating substantial surpluses. In contrast, the BL regime distributions closely follow the climatology, with near-average production and demand, resulting in a balanced energy shortfall with minimal variability and few exceedances.
3.4. Energy Supply Droughts
Figure 10 presents the evolution of the energy shortfall and ESD vents, combining intra-seasonal and interannual timescales to link extreme events with WRs. A clear transition was evident from a surplus phase (2008–2011) to more frequent and intense shortfalls after 2012, with the period of 2017–2019 marked by particularly prolonged shortfalls.
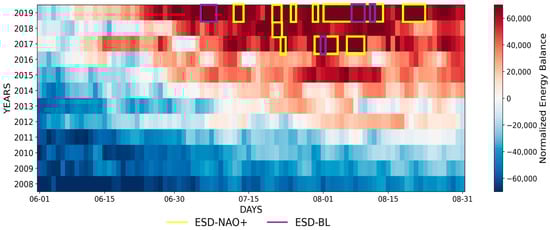
Figure 10.
Hovmöller diagram of the daily normalized energy balance (D−P)/Dₘ (no units) for the summer periods (2008–2019). Red (positive) and blue (negative) shading indicate energy shortfall and surplus, respectively. Yellow boxes highlight the ESD events [(D − P)/Dm ≥ 0.5] occurring during NAO+ regimes, and the purple boxes highlight the ESD events occurring during BL regimes.
ESD episodes occur predominantly (82%) during the NAO+ conditions (Figure 10, yellow boxes). The BL regimes account for the remaining 18%, with three of the four most extreme events co-occurring with NAO+ (Figure 10, purple boxes). Most ESDs are concentrated in late July and August, coinciding with the seasonal decline in PV output and peak cooling demand.
This configuration reveals a dual vulnerability characterized by a predictable intra-seasonal progression from early-summer surpluses to late-summer shortfalls, which highlights the direct influence of WRs on PV production, as well as a long-term interannual trend of increasing production–demand mismatch, which is driven primarily by the gradual increase in air-conditioning demand, as evidenced by the upward trend in summer electricity consumption shown in Figure 1. Together, these effects progressively amplify the generation-load imbalance throughout the study period.
3.5. Meteorological Conditions of ESDs
This analysis contrasted the atmospheric conditions during ESDs with the average configurations of their associated WRs, focusing on four key parameters for PV potential (Figure 11).
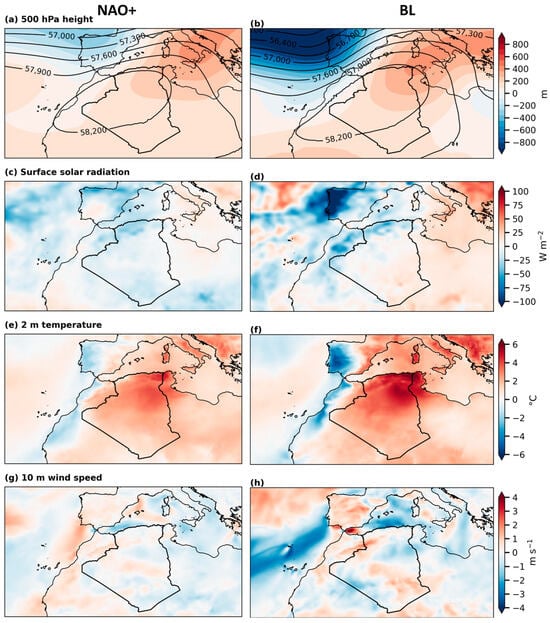
Figure 11.
Composite anomalies during the ESD events for a (a,b) Z500 geopotential height (m, where contours show absolute values at 300 m intervals); (c,d) surface solar irradiance (W m−2); (e,f) 2 m air temperature (°C); and (g,h) 10 m wind speed (m s−1). Each WR in a column, labeled at the top, is the following from left to right: NAO+ and BL regimes. ERA5 (JJA, 2008–2019).
During the NAO+-related ESDs, the regime’s signature intensifies (Figure 11a–d). The positive geopotential height anomaly strengthens and becomes more concentrated in the northeastern domain. The 58,200 m geopotential height contour shifts northward, reaching the coast and indicating an extended anticyclonic blocking pattern. Consequently, 10 m wind speeds diminish over a large maritime area. A positive 2 m temperature anomaly extends across Algeria and the Mediterranean, peaking in the northeast. Concurrently, solar radiation decreases over Algeria, and it is most pronounced in the north, the Hoggar Massif, and the western Sahara, thereby reducing solar generation potential.
ESDs associated with the BL regime are more intense than those during NAO+, driven by a stronger geopotential height anomaly dipole (Figure 11e–h). The anticyclone (58,200 m geopotential height contour) shifts northeast toward the Tunisian coast, amplifying the characteristic omega block. At the surface, 10 m winds weaken over the Mediterranean but strengthen over the central Sahara. The 2 m temperature anomaly intensifies, exceeding +6 °C in northeastern Algeria. In contrast to NAO+, BL episodes show a localized radiation increase over the southeast, which may partially offset production losses. Ultimately, the reinforced blocking, extreme heat, and elevated cooling demand synergistically create a high risk for severe ESD events.
4. Discussion
This study established a critical link between large-scale atmospheric regimes and Algeria’s energy security by analyzing their influence on summer PV production and electricity demand.
We demonstrate that the NAO− regime generated substantial solar power surpluses alongside reduced electricity demand, creating the most favorable conditions for grid stability. This dynamic is rooted in its specific atmospheric signature and its peak frequency in June (41%), which coincides with the African pre-monsoon phase. During this period, Atlantic flows advect cold maritime air into the Algerian Sahara [53,54]. This synoptic configuration yields a dual energy benefit by providing moderate temperatures that prevent PV panel efficiency losses from overheating [16], while simultaneously limiting air conditioning demand [5].
The AR regime, though less pronounced, also contributes to grid stability with power surpluses and below average demand. It remains relatively stable throughout the summer, with a slight peak in June.
Collectively, the NAO− and AR regimes create significant energy surpluses, presenting strategic opportunities for storage to mitigate shortfalls during other regimes.
In contrast, the NAO+ regime generates the most critical conditions for energy security, combining a PV production shortfall with heightened electricity demand. This systemic vulnerability results from the convergence of several unfavorable meteorological factors. The NAO+ regime peaks in July–August (respectively, 48% and 43%), coinciding with the establishment of the African monsoon in the Sahel south of the Sahara [55]. During this period, the advection of cool Atlantic flows into western North Africa weakens, while intensified warm winds between the Hoggar massif and the Atlas Mountains cause significant surface warming [53,56,57]. Concurrently, the northward expansion of the monsoon and the seasonal strengthening of the Saharan Heat Low enhance moisture advection. This process leads to more frequent cloud formation and convectively driven dust outbreaks across the southern and western Sahara [53,58]. The resulting high temperatures and decreases in solar radiation have a dual negative impact by degrading PV efficiency [16] and amplifying cooling demand [5]. This combination imposes severe operational constraints on the power grid. Our analysis indicates that the BL regime is characterized by both power generation and electricity demand remaining close to seasonal averages. This results in an overall neutral impact on the power system, maintaining relative grid balance. The frequency of this regime remains relatively stable throughout the summer, with a slight increase during July and August.
We report that ESDs are preferentially associated with the NAO+ regime, during which its defining anomalies are amplified: a strengthened Z500 anticyclone over northeastern Algeria, weakened maritime airflows, reduced surface solar irradiance, and intensified surface heating. This synoptic configuration directly explains the co-occurrence of severely depressed solar generation and peak electricity demand. While less frequent, ESDs under the BL regime are often more intense. A stronger geopotential dipole and thermal anomaly can generate extreme conditions that match or exceed those of NAO+. However, BL is distinguished by a concurrent positive solar radiation anomaly, which may partially mitigate the shortfall by sustaining PV output. Despite their differences, the NAO+ and BL regimes exhibit convergent synoptic evolution during extreme events, manifesting as surface weather similarities and a dominant blocking pattern that drives the energy system toward critical stress.
This analysis aggregates PV potential at the national scale to align with the resolution of the available electricity demand data. Contextualizing our findings within the spatial planning framework of Díaz-Cuevas [59] reveals critical insights. We find that PV production surpluses during NAO− conditions spatially correspond to areas of high technical potential, notably the 2.8% of territory identified as suitable for the utility-scale PV plants within 10 km of transmission infrastructure. This indicates that NAO− phases create not only system-wide surpluses, but also ideal conditions for centralized grid integration, particularly across the inland plateaus. Conversely, AR-associated surpluses concentrate along the densely populated coast, where Díaz-Cuevas [59] report limited suitability for large-scale PV installations due to urban and infrastructural constraints, making these areas better suitable for small-scale distributed PV systems.
The persistence of WRs is crucial for energy system management. Prolonged episodes of NAO− (5.35 days) and AR (4.70 days) generate multi-day PV surpluses of 41.5 GWh/day and 13.5 GWh/day, respectively, necessitating adequate storage capacity. A greater challenge arises from the NAO+ and BL regimes. Although individual events last approximately three days, they can cluster into persistent sequences during ESD events, lasting nearly a month. During prolonged ESDs (≥3 days), the average shortfall rises sharply from 15 to 90 GWh/day for NAO+ and from 1.4 to 104 GWh/day for BL. Notably, the modest energy surplus observed in the southeast during these regimes largely coincides with areas classified as unsuitable for PV installation [59]. Managing such severe shortfalls requires robust backup generation and active control of electricity demand. These regime-dependent surplus and shortfall patterns provide a physically based framework that can inform future optimization and planning studies for PV-based power systems, as discussed in [60].
This study presents the first systematic analysis of the WRs governing summer solar energy in Algeria, a period coinciding with peak air-conditioning demand (JJA). It identified key atmospheric mechanisms behind these energy imbalances that have not been previously documented.
Our findings reveal a distinct seasonal reversal compared to winter conditions. Pozo-Vázquez [35] demonstrated, based on 20 years of satellite data and reanalyses, the positive correlations between NAO+ and solar radiation over the Iberian Peninsula and the Mediterranean basin, resulting from reduced cloud cover. More recently, Jurasz [34] extended this analysis to North Africa using ERA5 hourly reanalyses (1960–2020), confirming that, in the winter, the NAO+ regime is associated with higher potential PV performance in northern Algeria under dry and sunny anticyclonic conditions. Similar results were observed in Western and Central European winter, revealing energy shortfalls in the NAO− and BL regimes [27,28,31,32]. We propose that this reversal reveals a fundamental symmetry in atmospheric control, showing that opposing synoptic configurations can generate similar energy system stress, even as the dominant stressor shifts from winter cold to summer heat. This underscores the critical need for seasonally differentiated strategies in planning and operating a renewable-reliant Algerian power system.
5. Conclusions
This study presents the first systematic analysis of the atmospheric circulation regimes governing the combined variability of PV production and summer electricity demand in Algeria.
Our findings demonstrate that WRs explain a significant portion of daily summer energy variability, offering valuable predictability for the energy sector. The probability of a specific regime, which can be estimated from seasonal and sub-seasonal weather forecasts, enables the quantification of expected energy anomalies and ESD risks. However, substantial variability in energy production exists within WRs. ESD events result from the convergence of intensified anticyclonic circulation patterns, characterized by a simultaneous increase in surface heat and atmospheric blocking, and they are combined with a particularly low frequency of solar radiation. This superposition of factors limits the accuracy of energy forecasts based only on WRs.
Although our results are robust, they must be interpreted within their specific context and limitations. First, the PV potential model estimates theoretical yield based on meteorological drivers and does not account for site-specific factors (e.g., panel characteristics and soiling) or actual installed capacity, thus representing an upper bound of generation. Second, the meteorological regime framework is based on stationary patterns derived from ERA5 anomalies, which may not fully capture the long-term structural changes in atmospheric circulation under future climate scenarios. Third, spatial constraints may limit the localized expression of extremes, particularly heatwaves and dust outbreaks. As these phenomena were not independently diagnosed, they could represent a key driver of the observed within-regime PV variability and the occurrence of prolonged ESDs.
A deeper understanding of meteorology-energy system interactions at regional scales requires a paradigm shift toward an impact-based classification. We propose developing “energy regimes” defined by their direct effects on energy variables. Such regimes would exhibit lower internal variability and enable more precise identification of ESD events than standard atmospheric patterns. Building on this analysis, future work will investigate how the temporal persistence of these energy regimes modulates PV production and ESD duration. Furthermore, integrating CMIP6 climate projections across multiple radiative forcing scenarios is essential for assessing impacts at critical planning horizons. This forward-looking approach will provide a robust foundation for adapting national energy infrastructure, enabling the strategic anticipation of regional climate changes and optimizing the resilience of Algeria’s power system for both the short term (2030) and long term (2030–2100).
Author Contributions
Conceptualization, N.S. and G.S.; Methodology, N.S., G.S., R.K. and A.T.; Software, N.S. and G.S.; Validation, N.S. and G.S.; Investigation, N.S. and G.S.; Resources, F.T.; Data curation, N.S., F.T. and A.T.; Writing—original draft, N.S.; Writing—review & editing, G.S., R.K., F.T., A.T. and N.B.; Visualization, R.K. and N.B.; Supervision, A.T.; Project administration, R.K., F.T., A.T. and N.B. All authors have read and agreed to the published version of the manuscript.
Funding
This research was funded by the Algerian General Directorate of Scientific Research and Technological Development (DGRSDT) and the Algerian Ministry of Higher Education and Scientific Research (MESRS).
Data Availability Statement
The ERA5 reanalysis data and the ERA5-based fields from PECD v4.2 used in this study are openly accessible via the Copernicus Climate Change Service—Climate Data Store (CDS): https://cds.climate.copernicus.eu (accessed on 31 October 2025). Copernicus CDS—ERA5. The hourly/daily electricity-demand data are publicly archived on Mendeley Data (dataset ID z5x2d3mhw7, version 1): https://data.mendeley.com/datasets/z5x2d3mhw7/1 (accessed on 31 October 2025). Mendeley Data—Algeria Electricity Demand.
Conflicts of Interest
The authors declare that there are no conflicts of interest.
References
- Bouznit, M.; Pablo-Romero, M.P.; Sánchez-Braza, A. Residential Electricity Consumption and Economic Growth in Algeria. Energies 2018, 11, 1656. [Google Scholar] [CrossRef]
- Bélaïd, F.; Abderrahmani, F. Electricity Consumption and Economic Growth in Algeria: A Multivariate Causality Analysis in the Presence of Structural Change. Energy Policy 2013, 55, 286–295. [Google Scholar] [CrossRef]
- International Energy Agency (IEA). Algeria—Electricity: Final Consumption by Sector (2023). 2025. Available online: https://www.iea.org/countries/algeria/electricity (accessed on 31 October 2025).
- Khalfallah, E.; Missaoui, R.; El Khamlichi, S.; Ben Hassine, H. L’efficacité énergétique de la climatisation: Le cas du Maghreb. Des opportunités pour un marché plus efficient (MENA Energy Series, Report No. 105360-MNA); World Bank Group: Washington, DC, USA, 2016; Available online: https://documents.worldbank.org/pt/publication/documents-reports/documentdetail/352241472472218258 (accessed on 31 October 2025).
- Matallah, M.E.; Matzarakis, A.; Boulkaibet, A.; Ahriz, A.; Zitouni, D.C.; Ben Ratmia, F.Z.; Mahar, W.A.; Ghanemi, F.; Attia, S. Refining Climate Zoning in North Africa: A 30-Year Analysis of Heating and Cooling Degree Days for Energy Planning and Adaptation. Energy Build. 2025, 342, 115852. [Google Scholar] [CrossRef]
- Chabouni, N.; Belarbi, Y.; Benhassine, W. Electricity Load Dynamics, Temperature and Seasonality Nexus in Algeria. Energy 2020, 200, 117513. [Google Scholar] [CrossRef]
- International Energy Agency (IEA). National Climate Resilience Assessment for Algeria. 2025. Available online: https://www.iea.org/reports/national-climate-resilience-assessment-for-algeria (accessed on 31 October 2025).
- Sonelgaz. 19 135 MW: A New Record Peak in Electricity Demand Today, Thursday, July 18, 2024. 18 July 2024. Available online: https://www.sonelgaz.dz/fr/7189/19-135-mw-un-nouveau-pic-record-de-demande-en-energie-electrique-aujourdhui-jeudi-18-juillet-2024 (accessed on 31 October 2025).
- Farhani, S.; Kadria, M.; Guirat, Y. The Role of Energy and Environmental Quality in Exploring Economic Sustainability: A New Appraisal in the Context of North African Countries. Sustainability 2021, 13, 13990. [Google Scholar] [CrossRef]
- World Bank. Carbon Dioxide (CO2) Emissions Excluding LULUCF per Capita (t CO2e/capita)—Algeria (1970–2023). EDGAR Community GHG Database (JRC/IEA), 2024. Available online: https://data.worldbank.org/indicator/EN.GHG.CO2.PC.CE.AR5 (accessed on 31 October 2025).
- Oulimar, I.; Bouchouicha, K.; Bailek, N.; Bellaoui, M. Statistical Study of Global Solar Radiation in the Algerian Desert: A Case Study of Adrar Town. Theor. Appl. Climatol. 2024, 155, 3493–3504. [Google Scholar] [CrossRef]
- Bouraiou, A.; Necaibia, A.; Boutasseta, N.; Mekhilef, S.; Dabou, R.; Ziane, A.; Sahouane, N.; Attoui, I.; Mostefaoui, M.; Touaba, O. Status of Renewable Energy Potential and Utilization in Algeria. J. Clean. Prod. 2020, 246, 119011. [Google Scholar] [CrossRef]
- Gairaa, K.; Bakelli, Y. Solar Energy Potential Assessment in the Algerian South Area: Case of Ghardaïa Region. Int. J. Photoenergy 2013, 2013, 496348. [Google Scholar] [CrossRef]
- Stambouli, A.B.; Khiat, Z.; Flazi, S.; Kitamura, Y. A Review on the Renewable Energy Development in Algeria: Current Perspective, Energy Scenario and Sustainability Issues. Renew. Sustain. Energy Rev. 2012, 16, 4445–4460. [Google Scholar] [CrossRef]
- United Nations Framework Convention on Climate Change (UNFCCC). First Biennial Transparency Report: Algeria. 2024. Available online: https://unfccc.int/documents/645156 (accessed on 28 August 2025).
- Huld, T.; Gracia Amillo, A. Estimating PV Module Performance over Large Geographical Regions: The Role of Irradiance, Air Temperature, Wind Speed and Solar Spectrum. Energies 2015, 8, 5159–5181. [Google Scholar] [CrossRef]
- Hannachi, A.; Straus, D.M.; Franzke, C.L.E.; Corti, S.; Woollings, T. Low-Frequency Nonlinearity and Regime Behavior in the Northern Hemisphere Extratropical Atmosphere. Rev. Geophys. 2017, 55, 199–234. [Google Scholar] [CrossRef]
- Michelangeli, P.-A.; Vautard, R.; Legras, B. Weather Regimes: Recurrence and Quasi-Stationarity. J. Atmos. Sci. 1995, 52, 1237–1256. [Google Scholar] [CrossRef]
- Vautard, R. Multiple Weather Regimes over the North Atlantic: Analysis of Precursors and Successors. Mon. Weather Rev. 1990, 118, 2056–2081. [Google Scholar] [CrossRef]
- Ferranti, L.; Corti, S.; Janousek, M. How Far in Advance Can We Predict Changes in Large-Scale Flow Leading to Severe Cold Conditions over Europe? Q. J. R. Meteorol. Soc. 2018, 144, 1788–1802. [Google Scholar] [CrossRef]
- Yiou, P.; Goubanova, K.; Li, Z.X.; Nogaj, M. Weather Regime Dependence of Extreme Value Statistics for Summer Temperature and Precipitation. Nonlinear Process. Geophys. 2008, 15, 365–378. [Google Scholar] [CrossRef]
- Santos, J.A.; Corte-Real, J.; Leite, S.M. Weather Regimes and Their Connection to the Winter Rainfall in Portugal. Int. J. Climatol. 2005, 25, 33–50. [Google Scholar] [CrossRef]
- Yiou, P.; Nogaj, M. Extreme Climatic Events and Weather Regimes over the North Atlantic: When and Where? Geophys. Res. Lett. 2004, 31, L07202. [Google Scholar] [CrossRef]
- Cassou, C.; Terray, L.; Hurrell, J.W.; Deser, C. North Atlantic Winter Climate Regimes: Spatial Asymmetry, Stationarity and Predictability. J. Clim. 2004, 17, 1055–1068. [Google Scholar] [CrossRef]
- Plaut, G.; Simonnet, E. Large-Scale Circulation Classification, Weather Regimes, and Local Climate over France, the Alps and Western Europe. Clim. Res. 2001, 17, 303–324. [Google Scholar] [CrossRef]
- Trigo, R.M.; DaCamara, C.C. Circulation Weather Types and Their Influence on the Precipitation Regime in Portugal. Int. J. Climatol. 2000, 20, 1559–1581. [Google Scholar] [CrossRef]
- Rouges, E.; Brayshaw, D.J.; Zappa, G. On the Link between Weather Regimes and Energy Shortfall during Winter for 28 European Countries. Meteorol. Appl. 2025, 32, e70077. [Google Scholar] [CrossRef]
- Mockert, F.; Grams, C.M.; Moemken, J.; Pinto, J.G.; Leckebusch, G.C. Meteorological Conditions during Periods of Low Wind Speed and Insolation in Germany: The Role of Weather Regimes. Meteorol. Appl. 2023, 30, e2141. [Google Scholar] [CrossRef]
- Otero, N.; Soret, A.; Romero, R.; Jiménez-Guerrero, P. Characterizing Renewable-Energy Compound Events across Europe Using a Logistic-Regression Approach. Meteorol. Appl. 2022, 29, e2089. [Google Scholar] [CrossRef]
- Garrido-Perez, J.M.; Ordóñez, C.; Barriopedro, D.; García-Herrera, R.; Paredes, D. Impact of Weather Regimes on Wind Power Variability in Western Europe. Appl. Energy 2020, 264, 114731. [Google Scholar] [CrossRef]
- Bloomfield, H.C.; Brayshaw, D.J.; Gonzalez, P.L.M.; Pfenninger, S. Characterizing the Winter Meteorological Drivers of the European Electricity System. Meteorol. Appl. 2020, 27, e1858. [Google Scholar] [CrossRef]
- van der Wiel, K.; Bloomfield, H.C.; Lee, R.W.; Stoop, L.P.; Blackport, R.; Screen, J.A.; Selten, F.M. The Influence of Weather Regimes on European Renewable Energy and Links to Circulation. Environ. Res. Lett. 2019, 14, 094010. [Google Scholar] [CrossRef]
- Grams, C.M.; Beerli, R.; Pfenninger, S.; Staffell, I.; Wernli, H. Balancing Europe’s Wind-Power Output through Spatial Deployment Informed by Weather Regimes. Nat. Clim. Chang. 2017, 7, 557–562. [Google Scholar] [CrossRef]
- Jurasz, J.; Guezgouz, M.; Campana, P.E.; Kaźmierczak, B.; Kuriqi, A.; Bloomfield, H.; Hingray, B.; Canales, F.A.; Hunt, J.D.; Sterl, S.; et al. Complementarity of Wind and Solar Power in North Africa: Potential for Alleviating Energy Droughts and Impacts of the North Atlantic Oscillation. Renew. Sustain. Energy Rev. 2024, 191, 114181. [Google Scholar] [CrossRef]
- Pozo-Vázquez, D.; Santos-Alamillos, F.J.; Ruiz-Arias, J.A.; Lara-Fanego, V.; Tovar-Pescador, J. The Impact of the NAO on the Solar and Wind Energy Resources in the Mediterranean Area. In Hydrological, Socioeconomic and Ecological Impacts of the North Atlantic Oscillation in the Mediterranean Region; Vicente-Serrano, S.M., Trigo, R.M., Eds.; Springer: Dordrecht, The Netherlands, 2011; pp. 213–231. [Google Scholar] [CrossRef]
- Thépaut, J.N.; Dee, D.; Engelen, R.; Pinty, B. The Copernicus Programme and Its Climate Change Service. In IGARSS 2018; IEEE: Valencia, Spain, 2018; pp. 1591–1593. [Google Scholar] [CrossRef]
- Bloomfield, H.C.; Brayshaw, D.J.; Charlton-Perez, A. Hourly Historical and Near-Future Weather and Climate Data for Western Europe for Use in Energy System Modelling. Earth Syst. Sci. Data 2022, 14, 2749–2763. [Google Scholar] [CrossRef]
- Hersbach, H.; Bell, B.; Berrisford, P.; Hirahara, S.; Horányi, A.; Sabater, J.M.; Nicolas, J.; Peubey, C.; Radu, R.; Schepers, D.; et al. The ERA5 Global Reanalysis. Q. J. R. Meteorol. Soc. 2020, 146, 1999–2049. [Google Scholar] [CrossRef]
- Olauson, J. ERA5: The New Champion of Wind Power Modelling? Renew. Energy 2018, 126, 322–331. [Google Scholar] [CrossRef]
- Urraca, R.; Huld, T.; Gracia-Amillo, A.; Martinez-de-Pison, F.J.; Kaspar, F.; Sanz-Garcia, A. Evaluation of Global Horizontal Irradiance Estimates from ERA5 and COSMO-REA6 Reanalyses Using Ground and Satellite-Based Data. Sol. Energy 2018, 164, 339–354. [Google Scholar] [CrossRef]
- Troccoli, A.; Borga, M.; Zaramella, M.; Lusito, L.; Cordeddu, S.; Restivo, E.; Aldrigo, G.; Campostrini, S.; Strada, S.; Saint-Drenan, Y.M.; et al. Climate and Energy Related Variables from the Pan-European Climate Database Derived from Reanalysis and Climate Projections v4.2: Product User Guide (PUG). Copernicus Knowledge Base—ECMWF Confluence. 2025. Available online: https://confluence.ecmwf.int/pages/viewpage.action?pageId=540941752 (accessed on 31 October 2025).
- Cassou, C. Intraseasonal Interaction between the Madden–Julian Oscillation and the North Atlantic Oscillation. Nature 2008, 455, 523–527. [Google Scholar] [CrossRef] [PubMed]
- Jerez, S.; Thais, F.; Tobin, I.; Wild, M.; Colette, A.; Yiou, P.; Vautard, R. The CLIMIX Model: A Tool to Create and Evaluate Spatially-Resolved Scenarios of Photovoltaic and Wind Power Development. Renew. Sustain. Energy Rev. 2015, 42, 1–15. [Google Scholar] [CrossRef]
- Jerez, S.; Tobin, I.; Vautard, R.; Montávez, J.P.; López-Romero, J.M.; Thais, F.; Bartok, B.; Christensen, O.B.; Colette, A.; Déqué, M.; et al. The Impact of Climate Change on Photovoltaic Power Generation in Europe. Nat. Commun. 2015, 6, 10014. [Google Scholar] [CrossRef]
- Crook, J.A.; Jones, L.A.; Forster, P.M.; Crook, R. Climate Change Impacts on Future Photovoltaic and Concentrated Solar Power Energy Output. Energy Environ. Sci. 2011, 4, 3101–3109. [Google Scholar] [CrossRef]
- TamizhMani, G.; Ji, L.; Tang, Y.; Petacci, L.; Osterwald, C. Photovoltaic Module Thermal/Wind Performance: Long-Term Monitoring and Model Development for Energy Rating. In Proceedings of the NCPV and Solar Program Review Meeting, Denver, CO, USA, 24–26 March 2003; National Renewable Energy Laboratory (NREL): Golden, CO, USA, 2003; pp. 936–939, NREL/CD-520-33586. Available online: https://docs.nrel.gov/docs/fy03osti/35645.pdf (accessed on 31 October 2025).
- Davy, R.J.; Troccoli, A. Interannual Variability of Solar Energy Generation in Australia. Sol. Energy 2012, 86, 3554–3560. [Google Scholar] [CrossRef]
- Chenni, R.; Makhlouf, M.; Kerbache, T.; Bouzid, A. A Detailed Modeling Method for Photovoltaic Cells. Energy 2007, 32, 1724–1730. [Google Scholar] [CrossRef]
- Farah, R. Load Consumption Data—Algeria; Version 1; Mendeley Data: Online publication, 2023. [Google Scholar] [CrossRef]
- Farah, R.; Farou, B.; Kouahla, Z.; Seridi, H. Data-Driven Models on Load Forecasting: Case Study Algeria. Data Brief 2024, 52, 109854. [Google Scholar] [CrossRef]
- Raynaud, D.; Hingray, B.; François, B.; Creutin, J.D. Energy Droughts from Variable Renewable Energy Sources in European Climates. Renew. Energy 2018, 125, 578–589. [Google Scholar] [CrossRef]
- Hurrell, J.W.; Kushnir, Y.; Ottersen, G.; Visbeck, M. An Overview of the North Atlantic Oscillation. In The North Atlantic Oscillation: Climatic Significance and Environmental Impact; Hurrell, J.W., Kushnir, Y., Ottersen, G., Visbeck, M., Eds.; Geophysical Monograph Series; American Geophysical Union: Washington, DC, USA, 2003; Volume 134, pp. 1–35. [Google Scholar] [CrossRef]
- Selami, N.; Sèze, G.; Gaetani, M.; Grandpeix, J.-Y.; Flamant, C.; Cuesta, J.; Benabadji, N. Cloud Cover over the Sahara during the Summer and Associated Circulation Features. Atmosphere 2021, 12, 428. [Google Scholar] [CrossRef]
- Lavaysse, C.; Flamant, C.; Janicot, S.; Parker, D.J.; Lafore, J.-P.; Sultan, B.; Pelon, J. Seasonal Evolution of the West African Heat Low: A Climatological Perspective. Clim. Dyn. 2009, 33, 313–330. [Google Scholar] [CrossRef]
- Sultan, B.; Janicot, S. The West African Monsoon Dynamics. Part II: The “Preonset” and “Onset” of the Summer Monsoon. J. Clim. 2003, 16, 3407–3427. [Google Scholar] [CrossRef]
- Roehrig, R.; Chauvin, F.; Lafore, J.P. 10–25-Day Intraseasonal Variability of Convection over the Sahel: A Role of the Saharan Heat Low and Midlatitudes. J. Clim. 2011, 24, 5863–5878. [Google Scholar] [CrossRef]
- Cuesta, J.; Lavaysse, C.; Flamant, C.; Mimouni, M.; Knippertz, P. Northward Bursts of the West African Monsoon Leading to Rainfall over the Hoggar Massif, Algeria. Q. J. R. Meteorol. Soc. 2010, 136, 174–189. [Google Scholar] [CrossRef]
- Caton Harrison, T.; Washington, R.; Engelstaedter, S. Satellite-Derived Characteristics of Saharan Cold Pool Outflows During Boreal Summer. J. Geophys. Res. Atmos. 2021, 126, e2020JD033387. [Google Scholar] [CrossRef]
- Díaz-Cuevas, P.; Haddad, B.; Fernandez-Nunez, M. Energy for the Future: Planning and Mapping Renewable Energy. The Case of Algeria. Sustain. Energy Technol. Assess. 2021, 47, 101445. [Google Scholar] [CrossRef]
- Yang, Q.; Zhao, X.; Ma, Z.; Du, Z.; Chen, Y.; You, W.; Yang, J.; Gou, F.; Mao, M.; Bai, L.; et al. Stable Photovoltaic–Wind Hydrogen Production with Comprehensive Energy Management Strategy and Technical Economic Optimization. Renew. Energy 2025, 243, 122549. [Google Scholar] [CrossRef]
Disclaimer/Publisher’s Note: The statements, opinions and data contained in all publications are solely those of the individual author(s) and contributor(s) and not of MDPI and/or the editor(s). MDPI and/or the editor(s) disclaim responsibility for any injury to people or property resulting from any ideas, methods, instructions or products referred to in the content. |
© 2025 by the authors. Licensee MDPI, Basel, Switzerland. This article is an open access article distributed under the terms and conditions of the Creative Commons Attribution (CC BY) license.