Abstract
In the increasingly severe situation of global climate change, reducing CO2 emissions has become the consensus of governments. Grounded in the principle of consumer responsibility, policymakers are increasingly focusing on the cross-regional transfer of carbon emissions to delineate responsibilities more clearly. Evaluating embodied carbon emissions () in goods and services and forecasting transfer pathways is essential for driving the energy transition and devising effective carbon-reduction strategies. This study summarizes the evolutionary characteristics of the global -transfer network from 2013 to 2022 and analyzes the underlying causes. Further, a link prediction model incorporating both endogenous and exogenous factors is developed to investigate potential -transfer pathways. The findings reveal the following: (1) Since 2013, China, Russia, and India have dominated net out-strength, accounting for over 70% of total -transfer strength, primarily directed towards the European Union (EU) and the United States (USA). (2) The analysis of net out-intensity and in-intensity indicates that countries like Russia and South Africa have more carbon-emitting export-oriented industries in their economic structure and should transfer the corresponding carbon-emission responsibility to downstream consuming countries. Countries like Mexico and Switzerland, due to their reliance on importing -intensive products, should assume the corresponding carbon-emission responsibility. (3) Economies such as Germany, China, the USA, and France, characterized by high -transfer efficiency, serve as key drivers for the implementation of global emission-reduction strategies. (4) The link prediction based on the proposed hybrid similarity indicator has the highest accuracy. The results reveal a higher probability of forming stable links between net importers, and between net importers and exporters. This study enhances policymakers’ understanding of international trade and management, and facilitates the development of long-term strategies for cross-national collaborative emission reduction.
1. Introduction
A recent report from the World Meteorological Organization (WMO) emphasizes that the global average near-surface temperature has climbed to roughly 1.45 °C above pre-industrial levels, nearing the critical 1.5 °C threshold stipulated in the Paris Agreement [1]. Global warming not only harms the ecological environment but also poses a significant threat to human survival and development. The challenge of reducing carbon dioxide emissions to alleviate global warming has become a universal concern.
Environmental policies often clash with socio-economic development, particularly when it comes to balancing carbon emissions and economic growth. Current environmental regulations primarily target high-emission regions and sectors, reflecting the principle of production-related carbon responsibility. However, the actual distribution of production-related direct carbon emissions obscures the allocation of carbon-emission responsibilities, as it overlooks the significant portion of emissions transferred through intermediate products along the supply chain. Mitigation strategies that focus solely on direct emissions struggle to track carbon leakage due to international trade, thereby undermining the efficacy of unilateral mitigation policies [2]. In reality, many regions produce substantial direct carbon emissions not only to satisfy their own final demand but also to transfer emissions embodied in intermediate products to distant areas. This phenomenon is known as “embodied carbon emissions ()”, which permeates the entire supply chain beyond the consumer level. ECs include not only direct emissions, resulting from energy consumption in the production process. They also include indirect emissions, such as emissions from the energy used for production (e.g., electricity, fuel, etc.) during their production process. ECs are therefore a comprehensive perspective that takes into account the environmental impacts throughout the product lifecycle, not just at the production stage. Consequently, the principle of consumer-related responsibility has emerged, asserting that carbon emissions embodied in energy, goods, and services should be assessed from the consumer’s perspective. Studying can effectively address the challenge of fairly accounting for carbon-emission responsibilities.
In recent years, numerous researchers have focused on accounting for embodied carbon emissions. Multi-Regional Input–Output (MRIO) analysis has been utilized to evaluate flows in international trade. For instance, ref. [3] applied an MRIO methodology to investigate emission-transfer patterns across 39 nations during 1995–2011, with particular focus on spatial determinants of cross-border emission flows. The MRIO model was established to analyze the changes in transfer among the G7 economies, emphasizing the significant impact of technological progress on global -transfer patterns [4]. Based on the WIOD database, the of 40 developed and emerging economies from 1995 to 2008 were calculated, showing that the increase in domestic consumption in both developed and emerging economies is related to the increase in [5]. Using the CGE model and carbon flow-decomposition analysis, ref. [6] revealed the pathways and scale of carbon leakage under the Paris Agreement. It highlighted that the EU and developed Asian countries achieved emission reductions through adjustments in domestic production and trade structures, while regions like India and Russia were the main sources of leakage. Import tariffs partially alleviated the leakage, but export tax rebates exacerbated it. In addition, some studies have explored the driving factors behind transfers at both the national and sectoral levels [7,8,9,10,11]. For example, research on in trade among “Belt and Road” countries from 1995 to 2015 revealed that technological progress is the main driving force for emission reduction, while the growth of per capita final demand is the key factor for increased emissions [7]. Ref. [8] conducted a quantitative analysis of the driving factors of in global trade (1995–2007), finding that developed countries increasingly rely on imports from emerging economies, leading to an increase in import-related emissions, while export-related emissions in emerging economies have been rising. Ref. [9] analyzed three-dimensional panel data from from 18 manufacturing sectors across 38 countries from 2000 to 2014 and found that promoting the deep integration of service industry elements with manufacturing processes can effectively reduce the outflow of the manufacturing industry.
Existing research confirms that as economic integration progresses, transfers driven by international trade are evolving into a complex system. Therefore, understanding the structural evolution characteristics inherent to the functionality of complex systems is vital for tracking and managing global transfers [12]. Exploring the structure of complex systems and examining their functionality from a structural viewpoint is a fundamental concept of complex network theory [13,14,15]. Some researchers have integrated MRIO analysis with complex network theory to explore the structural features of -transfer networks at both national and provincial levels [16,17,18]. Additionally, recognizing the significant role sectors play in emissions and control, several studies have concentrated on the mechanisms of transfers among sectors within supply chain networks [18,19].
These initiatives have advanced understanding of interregional trade and management for policymakers. Furthermore, in the context of global warming, predicting CO2 emissions has become a priority. Numerous scholars have focused on developing various predictive models for accurate carbon emissions forecasting, including traditional models, neural network models, and hybrid models. Traditional CO2 emission-prediction models incorporate factors like population, wealth levels, and technological advancement [20,21] and utilize methods such as logarithmic mean division index [22], system dynamics [23], and time series analysis [24]. With the advancement of artificial intelligence, the application of neural networks in CO2 emissions prediction has progressively increased [25]. However, these two fundamental models possess certain limitations in predicting nonlinear data. Hybrid models enhance the performance of the aforementioned models using optimization algorithms and machine learning techniques [26]. Existing predictive models primarily emphasize exploring future CO2 emissions and evolutionary trends based on explicit data, while research on forecasting -transfer paths remains limited. Link prediction algorithms grounded in complex networks can leverage the topological information of networks to forecast potential links [27,28]. Essentially, they aim to uncover the reasons and driving forces behind complex systems to establish connections, which is crucial for comprehending the structure and dynamic evolution of complex systems. Initial research related to link prediction predominantly focused on enhancing algorithms and innovating new ones [29]. The Adamic/Adar () algorithm was shown by [30] to be the top-performing link prediction algorithm. Shortly thereafter, ref. [31] introduced the Resource Allocation () algorithm, which demonstrated higher accuracy based on the verification of prior research. Additionally, the Preference Attachment () algorithm operates on the principle of preferential attachment similarity between nodes. As research advanced, link prediction models found extensive applications in social networks, trade networks, and transportation networks, etc., yielding favorable predictive outcomes [30,32,33,34,35]. However, investigations into link prediction in -transfer networks remain sparse. Furthermore, the existing link prediction models primarily rely on endogenous attribute similarity indicators. Nonetheless, the complex and variable properties exhibited by real systems are driven by not only endogenous factors but also a variety of exogenous influences. Therefore, to enhance the accuracy of predictions, it is imperative to design a hybrid indicator that integrates both endogenous and exogenous attributes of the system for constructing the link prediction model.
In summary, the intensification of economic globalization has prompted countries to actively forge new diplomatic relationships to expand supply chain channels, resulting in -transfer and carbon-leakage phenomena. In this context, determining how to select suitable partners to facilitate synergistic emission reduction among economies has become a formidable challenge. To tackle this practical issue, this study constructs a series of global -transfer networks to investigate the evolutionary patterns of the roles and structural characteristics of various economies. Additionally, a hybrid indicator that amalgamates network topology information (endogenous factors) and node attributes (exogenous factors) is devised to construct a link prediction model to forecast potential -transfer paths between economies.
2. Data and Methods
2.1. Data
The MRIO tables and direct carbon emissions data utilized in this research are sourced from EXIOBASE 3, which encompasses economies representing 90% of the global Gross Domestic Product () [36]. EXIOBASE 3 offers a time series of Environmentally Extended Multi-Regional Input–Output (EE-MRIO) tables spanning from 1995 to 2022, covering 44 countries/regions (including 28 EU member states and 16 major economies) and five additional world regions. To investigate the potential -transfer links between countries/regions in the future, data for the other five regions of the world were excluded from this analysis. figures were retrieved from the World Bank, and geographical distance data between countries/regions were acquired from the CEPII database.
2.2. Methodology
2.2.1. Multi-Regional Input–Output Model
Because the MRIO model takes into account regional and technological variability, the model can systematically quantify the carbon flows embodied in trade and is applied to account for regional carbon footprints and transfers [37]. Suppose an MRIO table with n regions and m sectors, the total output of sector i in region r can be expressed on the basis of the horizontal accounting balance as follows:
where represents the intermediate input from sector i in region r to sector j in region s); denotes the final use by region s of goods or services from sector i in region r.
By using matrix notation, Equation (1) can be transformed into [38]:
The n-dimensional vectors X and F represent the total output and the final demand, respectively. The matrix A is composed of technical coefficients, serving as the foundation of the MRIO model. In this study, each element of this matrix, denoted as (), quantifies the amount of economy i’s goods or services consumed by economy j in order to produce one unit of the final product. Here, is the intermediate input from economy i to economy j, while corresponds to the total output of economy j. The matrix , referred to as the Leontief inverse matrix or the complete consumption matrix, whose elements that represent the direct and indirect inputs of economy i to satisfy one unit of final demand of economy j.
2.2.2. EC-Transfer Network
- (1)
- Accounting for EC transfers
Combining carbon-emission intensity and Equation (3), the -transfer matrix among economies is calculated as [39]:
where and are diagonal matrices corresponding to the vectors K (CO2 emission intensity) and F (final demand), respectively. The direct CO2 emissions of economy i are denoted as , with its emission intensity expressed as . The element of matrix W represents the total CO2 emissions generated by economy i to satisfy the final demand of economy j.
- (2)
- Establishing the -transfer network
Building upon the -transfer matrix defined in Equation (4), a directed and weighted -transfer network is constructed. In this network, 44 countries/regions are represented as nodes, the inter-country/regional -transfer relationships as directed links, and the transfers serve as weights. Since the network is fully connected, it becomes challenging to identify significant structural characteristics. Notably, some EC-transfer links are extremely weak and play a negligible role. As a result, a threshold must be set to filter out these weak links. The distribution of link weights is shown in Figure A1. Initially, the curve shows a steep decline and then stabilizes after including links with approximately 90% of the weight. The corresponding threshold for link weight here is set to 0.57 Mt, removing about 75% of the links. Consequently, the adjacency matrix R for the -transfer network has the elements resulting in the weighted adjacency matrix S with element .
- (3)
- Structural Features
- ①
- Degree centrality
The application of complex network theory provides a useful framework to analyze the structural features of intricate systems [40]. Here, it is used to examine the roles of economies within the -transfer network. Degree centrality (DC) is the most direct measure of node centrality in network analysis [41]. The average degree represents the mean number of links per node in the network, indicating the overall connectivity of the -transfer network. A higher average degree suggests closer inter-economy connections. In directed networks, the degree of a node i includes both in-degree and out-degree. The in-degree signifies the number of links directed towards node i, while the out-degree refers to the number of links extending from node i to other nodes. These are expressed as and .
Thus, the degree centrality of node i is given by , and the average degree of the network is calculated as
where n is the total number of nodes in the network.
- ②
- Strength centrality
The strength centrality of a node refers to the aggregate of link weights that are connected to the node [42]. In directed networks, the strength of node i includes both in-strength and out-strength. Specifically, the in-strength represents the total link weights from other nodes to node i, while the out-strength denotes the total link weights from node i to other nodes. These are mathematically expressed as and , where is the set of nodes linked to node i, and () corresponds to the weight of the link from node j (node i) to node i (node j). The strength centrality of node i is then defined as: . The network’s average strength is given by:
Subsequently, the net out-strength of node i is expressed as , provided that ; otherwise, denotes the net in-strength for node i.
Further, the net in-intensity (out-intensity ) of node i is defined as the net in-strength (out-strength) per unit of . This is mathematically represented as [43]:
where signifies the of node i. A higher implies that node i has a greater environmental cost embodied in its product supply per unit of economic gain. Conversely, a higher indicates that node i receives a significant inflow of environmentally costly products.
- ③
- Closeness centrality
Closeness centrality quantifies how easily a node can access all other nodes within the network. It is calculated as the inverse of the average shortest path length connecting this node to all other nodes in the network, as expressed in the following equation [44]:
where represents the shortest path length between node i and node j. A higher closeness centrality for node i suggests that node i is closely connected to numerous other economies and occupies a central position within the network.
2.2.3. Link Prediction Model
The variables employed in this section are illustrated in Table 1. Utilizing the global -transfer network, the link prediction model is constructed as follows:

Table 1.
Variables and their descriptions.
- Step 1: Design of similarity indicators
In conventional link prediction algorithms, similarity indicators are a range of endogenous attribute indicators relevant to the network structure. Considering the influence of external factors on the -transfer network, several similarity indicators with exogenous attributes are introduced below.
- (1)
- Endogenous attribute indicator
- ①
- indicator
If two nodes share more neighboring nodes, it is more probable to form -transfer links between them. Consequently, the indicator is defined as [34]:
where denotes the set of economies from which flows originate from economy i, and denotes the set of source economies whose flows to economy j.
- ②
- indicator
The likelihood of a link between two economies is proportional to the out-strength of the economy on the outflow side and the in-strength of the economy on the inflow side. Thus, the indicator is formulated as [34]:
- (2)
- Exogenous attribute indicator
- ①
- -based similarity
The probability of forming a link between two economies diminishes as the distance between them grows. Therefore, the probability of creating a connection between economies i and j is expressed as follows [45]:
where represents the geographical distance between economies i and j.
- ②
- -based similarity
Higher levels of two economies tend to indicate increased cooperation and interaction, leading to a stronger connection between them [45]. Thus, the probability of forming a link is given as:
where and represent the economic development levels of economies i and j, respectively.
- ③
- -based similarity
In the global -transfer network, the probability of forming an EC-transfer flow between countries i and j is not only related to the -transfer strength of the two countries but also closely related to geographical distance and levels. Taking into account the spatial directionality of the national gap and the network structure, the traditional gravity model is modified to obtain the probability of forming -transfer links between economies i and j [46]:
where and represent the economic development levels of countries i and j, respectively, and denote the strengths of countries i and j, respectively, and is the geographical distance between countries i and j. The larger the value of the similarity index, the higher the attractiveness between countries i and j. In other words, it is easier to form -transfer flows between i and j. Unlike traditional single indicators, the Integration indicator, by integrating multiple exogenous attribute indicators (such as geographical distance, , and node strength), can more comprehensively assess the potential connections between countries.
- (3)
- Hybrid indicator
Link prediction models based on different attribute indicators emphasize different aspects of the information available in complex networks [28]. The actual state of the system is usually the result of the combined effects of multiple attribute factors. The probability of forming an -transfer path between countries i and j is related not only to endogenous factors of the network (such as and similarity indicators) but also to exogenous factors (Distance-based similarity, -based similarity, and Integration-based similarity). Based on the weighted average algorithm, a Hybrid indicator that couples endogenous and exogenous indicators is proposed:
which reflects the likelihood of link formation. The Hybrid indicator improves the accuracy and robustness of predictions by coupling the advantages of different indicators to compensate for the shortcomings of a single indicator. Here, , with corresponding to the exogenous attribute indicator , and representing the endogenous attribute indicator . To unify the units for calculation, the value of each similarity indicator is normalized to the interval by dividing by its maximum value. In this way, the hybrid indicator, merging endogenous and exogenous factors, includes six types: , , , , , and .
- Step 2: Division of test set and training set [28].
Randomly select 20% of the links from the existing link set E to form the test set , with the remaining 80% constituting the training set .
- Step 3: Evaluation of unknown link scores [45].
The of the unknown links (including non-existent links and links in the test set) are calculated according to Equation (15) and sorted in descending order. Non-existent links with higher values are more likely to be true in the future.
- Step 4: Evaluation the accuracy of the link prediction algorithm.
Randomly select one link from the test set and the non-existent link set for the comparison of values, and repeat m times. If the value of the link in is greater than that in , 1 point is added, assuming that this scenario occurs cumulatively times. If the values of the two selected links are equal, points is added, assuming that this happens times in total.
(Area Under the Receiver Operating Characteristic Curve) is often used to measure the accuracy of the link prediction algorithm, with the expression [29]:
when the exceeds , the more accurate the prediction result of the corresponding algorithm.
3. Results
3.1. Structure Evolution
3.1.1. Evolution of Net EC-Transfer Flows
The cumulative net out-strength and in-strength from 2013 to 2022 are depicted in Figure 1. It is observed that countries like Russia, China, and India act as major net exporters, whereas countries such as the United States (USA), France, and the United Kingdom are identified as net importers. Figure 2 illustrates the evolving trend for countries/regions with significant net -transfer strengths. Overall, a consistent growth trend is apparent in the net -transfer strength, which rose from 343.42 Mt in 2013 to 350.80 Mt by 2022. Throughout the study period, Russia, China, and India have remained key contributors to global flows, with their net out-strength accounting for more than 70% of the total transfer strengths. Notably, Russia enhanced its net out-strength primarily via bilateral trade, with its contribution exceeding 50% by 2022. Conversely, China and India have exhibited annual declines, underscoring the effectiveness of energy conservation and emission-reduction strategies implemented in their manufacturing sectors. Specifically, China’s net out-strength share declined from 40.22% in 2013 to 15.21% in 2022. On the net inflow side, the European Union’s (EU) share decreased from 46.49% in 2013 to 42.92% in 2022, but it remains the largest destination of net flows. Apart from the EU, the United States consistently transfers substantial amounts of from other countries through bilateral trade, with its net in-strength share consistently remaining above 10%.
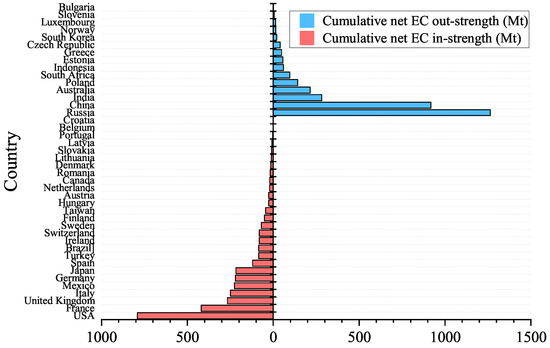
Figure 1.
Cumulative net out-strength and cumulative net in-strength for 42 countries/regions in 2013–2022.
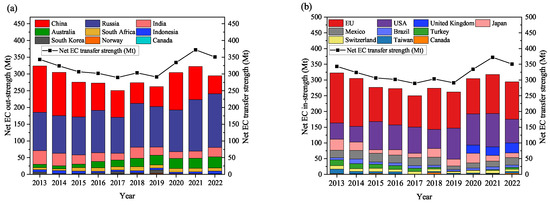
Figure 2.
Temporal and spatial evolution of major global net -transfer strength. (a) Net out-strength, (b) Net in-strength. The economies of the EU are combined into one region. Note: Between 2013 and 2019, the EU had 28 member states, including the United Kingdom; starting in 2020, the number of EU member states decreased to 27 following the United Kingdom’s exit from the EU.
Additionally, to evaluate the net transfers independent of economic scale, the trends of net out-intensity and net in-intensity are depicted in Figure 3a,b. Both exhibit a declining pattern, indicating that global economic growth surpasses EC transfers. The net out-intensity and net in-intensity can be calculated using Equations (7) and (8). As illustrated in Figure 3c, throughout the study period, Russia and South Africa show relatively high net out-intensity. As upstream countries in the supply chain, on one hand, they should take partial responsibility for the significant carbon emissions generated during their production processes. On the other hand, the carbon emissions from the production of high-carbon-emission products should be apportioned to the downstream consuming countries. On the net inflow side (as seen in Figure 3d), Mexico and Switzerland have higher net in-intensity due to their dependence on importing -rich products. They transfer their own carbon emissions to upstream producing countries through imports.
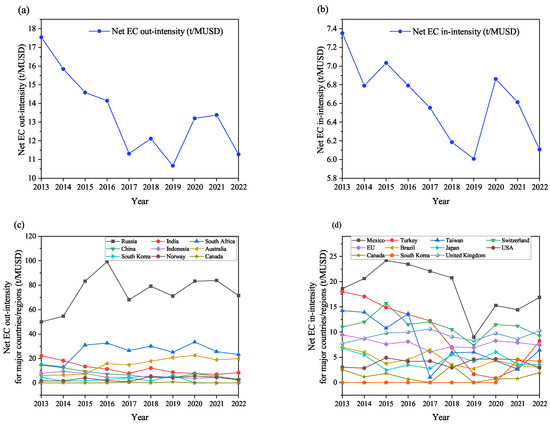
Figure 3.
Evolution of total net out-intensity (a), total net in-intensity (b), and net out-intensity (c) and net in-intensity (d) for major countries/regions in the global -transfer network.
3.1.2. Evolution of Centrality Indicators in Global EC-Transfer Networks
According to Equation (5), the average degree of the global -transfer network and the degree centrality of the main countries/regions are evaluated. The evolution trend is shown in Figure 4. In 2013, with the initiation of negotiations for the largest-scale free trade agreement in history, many countries/regions became more actively involved in the global supply chain, resulting in a rising trend in the network’s average degree, which peaked at 11.925 in 2015, as depicted in Figure 4a. However, following the full implementation of the “Paris Agreement”, countries/regions began adopting stricter emission-reduction measures, leading to significant restrictions on transfers. Consequently, the degree centrality of major countries/regions declined sharply, accompanied by a substantial drop in the network’s average degree. Since 2017, both the average degree and degree centrality of major countries/regions have experienced a steady upward trend. This resurgence is due to global governments implementing extensive measures to stimulate the economy after the financial crisis, fostering a rebound in global carbon supply chain involvement until 2017. According to Equation (6), the average strength of the global -transfer network and the strength centrality of the main countries/regions are evaluated. The evolution trend is shown in Figure 5. It reveals an overall increase in average strength, indicating that although interconnectivity between countries/regions has diminished since 2015 (reflecting a drop in average degree), the strength of their interactions has risen. Particularly from 2017 onward, robust global economic growth boosted resource flow efficiency, driving a marked increase in both average degree and strength in subsequent years.
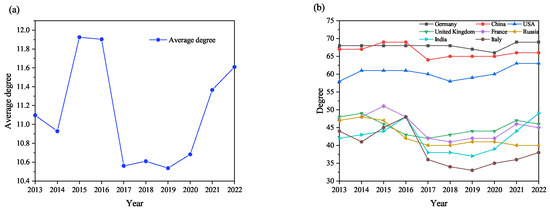
Figure 4.
Evolution of the average degree (a) and degree centrality of major countries/regions (b) in the global -transfer network.
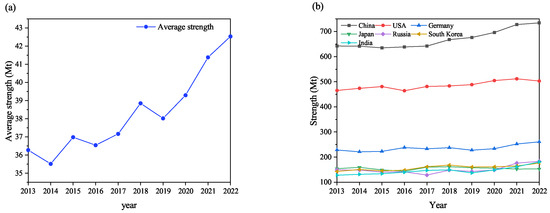
Figure 5.
Evolution of the average strength (a) and strength centrality of major countries/regions (b) in the global -transfer network.
According to Equation (9), the metrics for the top seven countries/regions based on closeness centrality throughout the study period are presented in Figure 6. It is evident that, since 2013, Germany, China, USA, France, Italy, United Kingdom, and Japan have consistently held dominant positions in closeness centrality, highlighting their higher likelihood of transfers with other economies. It is due to their high -transfer efficiency with other economies that these countries are important drivers for the implementation of carbon-emission-control and -management policies.
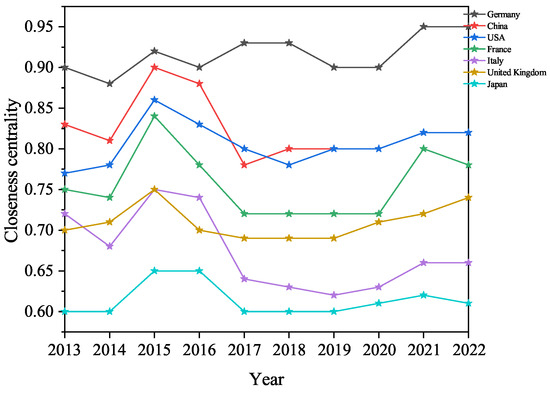
Figure 6.
Evolution of closeness centrality of major countries/regions in the global EC-transfer network.
3.2. Link Prediction Algorithm Selection
According to Equation (16), the values of the single similarity indicators and hybrid indicators were accounted for, and comparative analysis were conducted to determine the best algorithm for predicting potential -transfer flows. As shown in Section 2.2.3, an value greater than 0.5 indicates a more accurate corresponding algorithm. Using the example of the global -transfer network in 2022, Figure 7 illustrates the prediction accuracy of both single similarity indicators and the six hybrid indicators as a function of the parameter . It is observed that the hybrid indicators-based link prediction algorithm has an optimal parameter , leading to the highest value surpassing that of single similarity indicators. This suggests that the hybrid indicators outperform single ones and have a greater impact on the evolution of global transfers. Similar results are found for other years, as detailed in Figure A2.
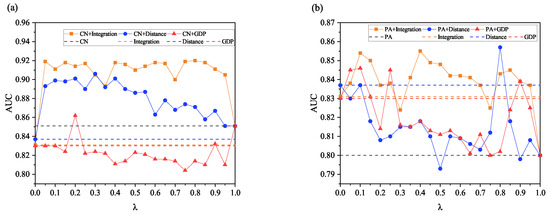
Figure 7.
Prediction accuracy ( value) based on similarity indicators as a function of parameter . (a) Comparative analysis of hybrid indicators CN+Integration, CN+Distance and CN+GDP with single attribute indicators, (b) comparative analysis of hybrid indicators PA+Integration, PA+Distance and PA+GDP with single attribute indicators.
Furthermore, the accuracy of link prediction utilizing the six hybrid indicators and the corresponding parameter is computed for the global -transfer network in 2022. The enhancement in in comparison to single similarity indicators is illustrated in Table 2. It is evident that the hybrid indicators, which coupling both exogenous and endogenous attribute information, achieve an average increase of 5.47% in values relative to single similarity indicators. Moreover, the indicator exhibits superior prediction accuracy compared to the indicator, suggesting that defining common neighbors as a similarity indicator more closely with the structural characteristics of the -transfer networks. Additionally, among all similarity indicators, the hybrid indicator has the highest value, showing an improvement in prediction accuracy of 8.11% and 10.71% compared to the single similarity indicators representing endogenous and exogenous factors, respectively. Similar results are observed for other years, with the evolution of link prediction accuracy for the six hybrid indicators corresponding to the optimal parameters depicted in Figure 8. The deeper the red color, the higher the value, indicating greater prediction accuracy. Notably, from 2013 to 2022, the indicator is associated with the reddest hue, reflecting the algorithm’s optimal performance. This suggests that the evolution of the global -transfer network is influenced not only by the number of common partners, but also by the strength and levels of the countries/regions, as well as the geographical distance between them. Consequently, this paper selects the indicator for predicting potential -transfer links.
Table 2.
Comparison of the predictive accuracy of various hybrid indicators and individual similarity indicators in 2022.
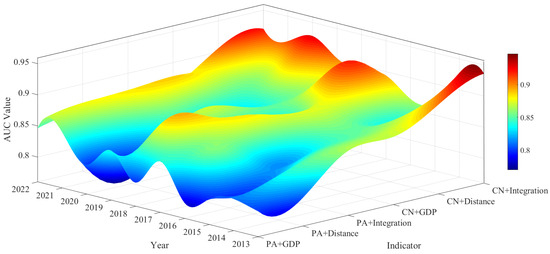
Figure 8.
Evolution of the prediction accuracy of the six hybrid algorithms from 2013 to 2022.
3.3. Comparison of Predicted Results with Actual EC Links
The ranking of the values for each pair of countries/regions in 2021 is presented in Figure 9. This assessment serves as a foundation for identifying potential flows from non-existent links. As illustrated in Figure 9, only a limited number of country/region pairs exhibit elevated values, highlighting the preferential characteristics of flows. Additionally, the results of the link prediction are compared with the actual flows to examine whether these potential links, characterized by high values, can be established in the future. Figure 10 displays the top 10 potential -transfer links based on the value for each year from 2013 to 2022. The positioning of the squares within the columns and rows corresponds to specific years and -transfer links, respectively. The red squares indicate the top 10 values for the respective -transfer links, while the blue squares represent actual -transfer links. White squares denote that the corresponding -transfer link does not currently exist and its value is not among the top 10. For instance, in the row corresponding to Mexico→Japan, a red square appears in 2013, indicating that this potential -transfer link was predicted for that year. A blue square appears in 2014, indicating that this country pair established an actual link in 2014. This reflects the fact that the country pair quickly established an actual link the year after it was first predicted as a potential -transfer link. Conversely, if a red square is present in the row for a potential link, but no subsequent blue squares appear, such as in the case of Slovakia→USA, this indicates that the predicted link did not materialize during the study period and is considered an invalid prediction. As observed in Figure 10, 22 out of 31 potential -transfer links were successfully predicted, resulting in a success rate exceeding 70%.
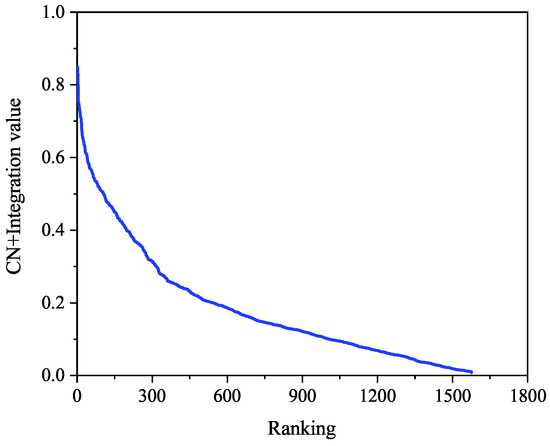
Figure 9.
Ranking of values by country/region pairs in 2021.
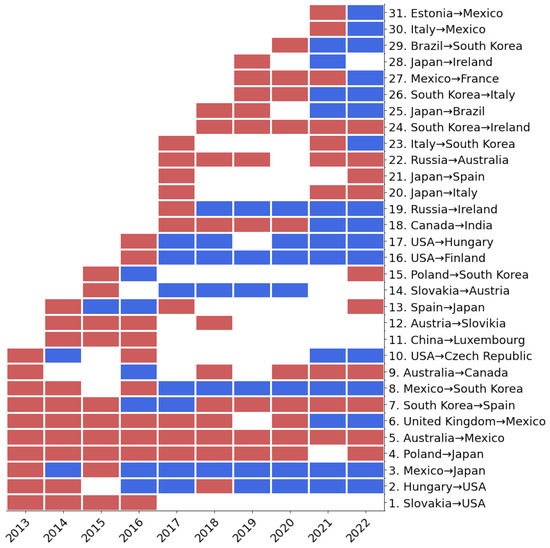
Figure 10.
Comparison of potential links and actual links of ECs. Note: The red squares indicate the top 10 values for the respective -transfer links. The blue squares represent actual -transfer links. The white squares denote that the corresponding -transfer link does not currently exist and its value is not among the top 10.
Based on the speed of establishing -transfer links, 22 countries/regions are classified into three categories. The consists of countries/regions that establish -transfer links quickly, including Mexico→Japan, USA→Finland, USA→Hungary, Japan→Ireland, Italy→Mexico, Slovakia→Austria, Russia→Ireland, Estonia→Mexico, South Korea→Italy, and Brazil→South Korea, a total of 10 pairs. These countries/regions successfully establish -transfer links within two years of being first predicted and do not disconnect again; even if disconnected, the links are re-established within three years. The consists of countries/regions that establish transfer links slowly, including 7 pairs of countries, namely Hungary→USA, Japan→Brazil, Mexico→France, United Kingdom→Mexico, Mexico→South Korea, Canada→India, and Italy→South Korea. These countries/regions successfully establish links after two years from being first predicted as potential connections and do not disconnect again; even if disconnected, the connections are re-established within three years. The , consists of country pairs with fluctuating -transfer links, including Spain→Japan, South Korea→Spain, Australia→Canada, USA→Czech Republic, and Poland→South Korea, a total of five pairs. Compared to the first two categories, the evolution of these -transfer flows exhibits the characteristic of “predicted”—“successful establishment of links”—“link interruption for more than three years”.
3.4. Summary of Success Rules for Link Prediction
By analyzing the roles of economies in the global -transfer network, the following rules for successful link prediction are summarized:
- (1)
- Potential -transfer links that became real during the study period but lasted less than two years were less likely to form again in the future. Out of the 20 links predicted to succeed (excluding the two new potential links from 2021, as only one year of testing was available in 2022), 15 (75%) persisted for at least two years. This suggests that countries/regions tend to select familiar -transfer partners. The remaining unsuccessful links may be influenced by factors such as political dynamics, geographical distance, or levels. Therefore, -transfer links lasting less than two years between 2013 and 2022 are unlikely to form again.
- (2)
- Among the potential -transfer links, real links are unlikely to be formed between net exporters. According to Figure 10, three potential -transfer links were identified between net outflow countries: China→Luxembourg, Russia→Australia, and Poland→South Korea. The first two links did not materialize during the study period, and while the Poland→South Korea link did occur, it was unstable and categorized under the . In other words, it is less likely that actual links will be formed between net exporters.
- (3)
- Among the potential -transfer links, there is a high probability of forming real stable links between net importers. From the successfully predicted stable potential -transfer links in Figure 10, 10 country pairs are included in , with 6 pairs (60%) consisting of net importers. In , 7 country pairs were identified, with 4 pairs (57%) composed of net importers. A typical feature of the net importers is that they all have many common net exporters as partners. On the one hand, there is a competitive relationship between these net importers, and on the other hand, to avoid the risk of supply chain disruptions, there are transfers between some importers. Overall, there is a high possibility of forming flows between importers, motivated primarily by product exchange rather than profit.
- (4)
- The potential -transfer links between net exporters and net importers are highly likely to become real in the future. Ten of the 22 potential -transfer links (45%) involve connections between net exporters and net importers. Of these, four and three fall into and , respectively, indicating a high likelihood of stable link formation. Specifically, if the potential link is from a net exporter to a net importer, it is likely to materialize within two years. Conversely, if the potential -transfer link is from a net importer to a net exporter, the predicted link has a higher probability of being realized after two years. Further, the performance of each country/region connected by potential -transfer links from historical data. It can be found that on the inflow side, if flows to countries such as Ireland, Italy, etc., it is easy to form links of . That is, real links are established quickly within two years. If flows to countries like USA, India, etc., it is easy to form links of . That is, real links are formed slowly after two years. If flows to countries like Mexico, South Korea, Japan, etc., links of (stable links) may be formed, and the links targeting South Korea and Japan may also belong to , i.e., the existence of real links fluctuates. On the outflow side, if flows originate from countries such as Russia, it is easy to form links of . If flows originate from countries such as Mexico, Italy, Japan, etc., links of or may be formed. If flows originate from countries such as USA and South Korea, links of or are likely to be formed. The serial numbers of the Top 10 potential -transfer links predicted in the last year of the study period are 4, 5, 7, 9, 13, 15, 20, 21, 22, and 24. First, the potential links with low probability were filtered out by Rules 1 and 2. It is worth noting that the most promising links discussed here are the ones with high probability of formation based on the data from the study period, and it does not mean that other links will not come true in the future. Then the probability of formation of the remaining links is evaluated based on Rules 3 and 4. Finally, it is obtained that South Korea→Spain and Spain→Japan have a high probability of becoming real in the future. Combined with the historical data performance of these economies, they may establish real links quickly in the next two years, but may fluctuate.
4. Conclusions and Suggestions
This research explores the global -transfer network, with the objective of identifying new -transfer partners and predicting potential future -transfer paths to adjust energy consumption structure to curb carbon emissions. The tracking of EC-transfer flows facilitates economies in targeting low-carbon technologies and improving energy efficiency to truly advance the energy revolution. The study employs the MRIO model combined with complex network theory to construct a series of directed and weighted -transfer networks spanning from 2013 to 2022. Using this framework, the extent of widespread carbon leakage is quantified, and the roles and evolution of each economy are described. Additionally, an innovative application of the link prediction model is employed to predict potential -transfer links. Specifically, a similarity indicator is designed that considers both endogenous and exogenous factors, addressing the limitations of previous models that only accounted for one aspect. Key conclusions include the following:
- (1)
- On the net outflow side, China, Russia, and India dominate net exports, representing over 70% of total transfers. The from these countries primarily flow to the EU and the US, making them the primary destinations for net flows. Furthermore, regardless of economic size, analysis shows that countries such as Russia and South Africa export large quantities of -rich products. This reflects the bias of their economic structure towards export-oriented high-carbon industries. The carbon-emission responsibility induced by foreign demand should be transferred downstream to the consuming countries as flows. In terms of net inflow, countries like Mexico and Switzerland rely more on importing carbon-intensive products, reflecting an import-oriented economic structure that shifts the responsibility for carbon emissions to trade partners.
- (2)
- The evolution analysis of the global -transfer network indicates that free trade agreements have significantly enhanced the involvement of various economies, leading to a notable rise in the network’s average degree. However, the “Paris Agreement” imposed restrictions on transfers, resulting in a temporary decline in both the average degree and the degree centrality of major economies. Following the global economic recovery in 2017, government-led stimulus measures fostered closer economic integration, restoring the network’s average degree and intensifying interactions between economies. However, both the net out-intensity and in-intensity show a downward trend during the observation period. Additionally, closeness centrality analysis reveals that some key economies/regions including Germany, China, USA, and France play important roles in driving transfers.
- (3)
- Link prediction results based on various similarity indicators reveal that the indicator achieves the highest value, averaging 0.92, an improvement of 8.11% and 10.71% compared to single endogenous or exogenous factor indicators, respectively. This suggests that factors such as the number of common trade partners among countries, -transfer strength, levels, and geographic distances positively influence the formation and evolution of -transfer links. Comparative analysis of potential links with actual links indicates that over 70% of economies have been successfully assessed at least once. Further, the rules governing potential -transfer links are discussed, providing a foundation for economies to select suitable -transfer partners.
Based on these findings, the following recommendations are made:
- (1)
- For countries/regions with a high net in-strength, such as the US and EU, strategies should be developed to optimize supply chain structures and reduce reliance on economies with high net out-strength. In particular, countries like Mexico and Switzerland are overly dependent on -intensive product imports, encouraging net outflow economies such as Russia and China to restructure their industries, promote green initiatives, and enhance energy efficiency to reduce in their supply chains. Given that the downward trend in net out-intensity and net in-intensity is mainly due to technological advances, international cooperation and exchanges among economies in the field of green and low-carbon technologies should be further strengthened. By sharing research results, technology transfer and diffusion, global energy efficiency and emission-reduction capabilities can be collectively enhanced.
- (2)
- Regarding potential -transfer paths, governments should proactively prepare to establish -transfer links that better address their own needs. Low-carbon policymakers should also strengthen consultations to develop synergistic carbon-emission-reduction-management mechanisms, promoting cross-regional cooperation and reducing carbon-leakage risks. For economies not currently involved, the forecasting rules obtained in this study offer a reference for identifying suitable -transfer partners. Core economies within the network—such as Germany, China, the USA, and France—play a critical role in implementing global carbon-emission control and are key drivers of international emission-reduction efforts.
The predicted links are likely to materialize in reality and should be prioritized by policymakers focused on low-carbon strategies. The goal of this work is not to predict specific timelines for link formation but to provide a reference for governments based on the topological properties of individual countries. Future research should incorporate geopolitical factors into the link prediction model to enhance its accuracy in assessing potential -transfer flows, providing robust support for advancing global low-carbon strategies.
Further research could consider the economic sector level of the country/region to reveal the structural role of various sectors in the industrial chain and their impact on flow, which can provide a more precise basis for industrial structure optimization and emission-reduction policy formulation. On the other hand, the function of actual systems is influenced not only by node pairs but more by the collective behavior of node groups. How to apply higher-order network models to describe the higher-order interaction behavior of node groups in the -transfer network is also a direction for future research.
Author Contributions
Conceptualization, R.D., X.G., G.D., L.T., X.F. and M.A.; Methodology, R.D., Y.L. and X.F.; Software, Y.L. and X.G.; Validation, R.D., Y.L., G.D., L.T., X.F. and M.A.; Formal analysis, R.D., Y.L. and L.T.; Investigation, R.D. and G.D.; Resources, R.D.; Data curation, Y.L. and X.G.; Writing—original draft, Y.L.; Writing—review & editing, R.D., Y.L., X.G., G.D., L.T., X.F. and M.A.; Visualization, R.D., Y.L. and M.A.; Supervision, R.D., Y.L., L.T., X.F. and M.A.; Project administration, R.D., G.D. and L.T.; Funding acquisition, R.D., G.D. and L.T. All authors have read and agreed to the published version of the manuscript.
Funding
This research was financially supported by the National Natural Science Foundation of China (Grant Nos. 72474086, 62373169, 72174091, 71974080, 61973143), the Major Program of National Natural Science Foundation of China (Grant No. 71690242), Young and Mid-career Academic Leader of the Jiangsu Province “Qinglan” Project, the National Key Research and Development Program of China (Grant No. 2020YFA0608601).
Data Availability Statement
The original contributions presented in the study are included in the article, further inquiries can be directed to the corresponding author.
Conflicts of Interest
The authors declare no conflicts of interest.
Appendix A

Figure A1.
The distribution of link weights. The red dot indicates the critical threshold for link weight.


Figure A2.
Prediction accuracy ( score) based on similarity indicators as a function of parameter in 2013–2021. Comparative analysis of hybrid indicators CN+Integration, CN+Distance and CN+GDP with single attribute indicators: (a) 2013, (c) 2014, (e) 2015, (g) 2015, (i) 2017, (k) 2018, (m) 2019, (o) 2020, (q) 2021; Comparative analysis of hybrid indicators PA+Integration, PA+Distance and PA+GDP with single attribute indicators: (b) 2013, (d) 2014, (f) 2015, (h) 2016, (j) 2017, (l) 2018, (n) 2019, (p) 2020, (r) 2021.
References
- World Meteorological Organization. State of the Global Climate 2023. 2024. Available online: https://wmo.int/publication-series/state-of-global-climate-2023 (accessed on 10 March 2024).
- Peters, G.P.; Hertwich, E.G. Post-Kyoto greenhouse gas inventories: Production versus consumption. Clim. Change 2008, 86, 51–66. [Google Scholar] [CrossRef]
- Zhong, Z.; Jiang, L.; Zhou, P. Transnational transfer of carbon emissions embodied in trade: Characteristics and determinants from a spatial perspective. Energy 2018, 147, 858–875. [Google Scholar] [CrossRef]
- Pan, X.; Wang, Y.; Shen, Z.; Song, M. Technological progress on embodied carbon emissions in G7 countries’ exports: A structural decomposition analysis. J. Clean. Prod. 2022, 372, 133800. [Google Scholar] [CrossRef]
- de Vries, G.J.; Ferrarini, B. What accounts for the growth of carbon dioxide emissions in advanced and emerging economies? The role of consumption, technology and global supply chain participation. Ecol. Econ. 2017, 132, 213–223. [Google Scholar] [CrossRef]
- Wu, L.; Zhou, Y.; Qian, H. Global actions under the Paris agreement: Tracing the carbon leakage flow and pursuing countermeasures. Energy Econ. 2022, 106, 105804. [Google Scholar] [CrossRef]
- Lu, Q.; Fang, K.; Heijungs, R.; Feng, K.; Li, J.; Wen, Q.; Li, Y.; Huang, X. Imbalance and drivers of carbon emissions embodied in trade along the Belt and Road Initiative. Appl. Energy 2020, 280, 115934. [Google Scholar] [CrossRef]
- Xu, Y.; Dietzenbacher, E. A structural decomposition analysis of the emissions embodied in trade. Ecol. Econ. 2014, 101, 10–20. [Google Scholar] [CrossRef]
- Huang, Y.; Zhang, Y.; Xiang, Y.; Dong, X. Has servitization reduced the embodied carbon emissions of manufacturing export trade? Evidence from 38 countries. Environ. Technol. Innov. 2022, 28, 102950. [Google Scholar] [CrossRef]
- Wood, R.; Grubb, M.; Anger-Kraavi, A.; Pollitt, H.; Rizzo, B.; Alexandri, E.; Stadler, K.; Moran, D.; Hertwich, E.; Tukker, A. Beyond peak emission transfers: Historical impacts of globalization and future impacts of climate policies on international emission transfers. Clim. Policy 2020, 20 (Suppl. S1), S14–S27. [Google Scholar] [CrossRef]
- Zhong, S.; Goh, T.; Su, B. Patterns and drivers of embodied carbon intensity in international exports: The role of trade and environmental policies. Energy Econ. 2022, 114, 106313. [Google Scholar] [CrossRef]
- Bandyopadhyay, A.; Kar, S. Impact of network structure on synchronization of Hindmarsh–Rose neurons coupled in structured network. Appl. Math. Comput. 2018, 333, 194–212. [Google Scholar] [CrossRef]
- Du, R.; Zhang, M.; Zhang, N.; Liu, Y.; Dong, G.; Tian, L.; Ziyang, K.; Ahsan, M. Evaluation of key node groups of embodied carbon emission transfer network in China based on complex network control theory. J. Clean. Prod. 2024, 448, 141605. [Google Scholar] [CrossRef]
- Du, R.; Zhang, N.; Zhang, M.; Kong, Z.; Jia, Q.; Dong, G.; Tian, L.; Ahsan, M. Identifying the optimal node group of carbon emission efficiency correlation network in China based on pinning control theory. Appl. Energy 2024, 368, 123353. [Google Scholar] [CrossRef]
- Dong, G.; Wang, F.; Shekhtman, L.M.; Danziger, M.M.; Fan, J.; Du, R.; Liu, J.; Tian, L.; Stanley, H.E.; Havlin, S. Optimal resilience of modular interacting networks. Proc. Natl. Acad. Sci. USA 2021, 118, e1922831118. [Google Scholar] [CrossRef] [PubMed]
- Lv, K.; Feng, X.; Kelly, S.; Zhu, L.; Deng, M. A study on embodied carbon transfer at the provincial level of China from a social network perspective. J. Clean. Prod. 2019, 225, 1089–1104. [Google Scholar] [CrossRef]
- Paterson, M.; Hoffmann, M.; Betsill, M.; Bernstein, S. The micro foundations of policy diffusion toward complex global governance: An analysis of the transnational carbon emission trading network. Comp. Political Stud. 2014, 47, 420–449. [Google Scholar] [CrossRef]
- Wang, H.; Ang, B. Assessing the role of international trade in global CO2 emissions: An index decomposition analysis approach. Appl. Energy 2018, 218, 146–158. [Google Scholar] [CrossRef]
- Chen, C.; Lu, Y.; He, G. Driving mechanisms for decoupling CO2 emissions from economic development in the ten largest emission countries. Ecosyst. Health Sustain. 2022, 8, 2059016. [Google Scholar] [CrossRef]
- Chai, Z.; Yan, Y.; Simayi, Z.; Yang, S.; Abulimiti, M.; Wang, Y. Carbon emissions index decomposition and carbon emissions prediction in Xinjiang from the perspective of population-related factors, based on the combination of STIRPAT model and neural network. Environ. Sci. Pollut. Res. 2022, 29, 31781–31796. [Google Scholar]
- Li, W.; Du, L. Assessment framework of provincial carbon emission peak prediction in China: An empirical analysis of Hebei province. Pol. J. Environ. Stud. 2019, 28, 3753–3765. [Google Scholar] [CrossRef]
- Zhang, S.; Yang, F.; Liu, C.; Chen, X.; Tan, X.; Zhou, Y.; Guo, F.; Jiang, W. Study on global industrialization and industry emission to achieve the 2 °C goal based on MESSAGE model and LMDI approach. Energies 2020, 13, 825. [Google Scholar] [CrossRef]
- Li, H.; Li, B.; Niu, D. Prediction on the Energy Consumption Structure in Liaoning Province Based on System Dynamics. Pol. J. Environ. Stud. 2021, 30, 5593–5604. [Google Scholar] [CrossRef]
- Malik, A.; Hussain, E.; Baig, S.; Khokhar, M.F. Forecasting CO2 emissions from energy consumption in Pakistan under different scenarios: The China–Pakistan economic corridor. Greenh. Gases Sci. Technol. 2020, 10, 380–389. [Google Scholar] [CrossRef]
- Yang, Y.; Du, Q.; Wang, C.; Bai, Y. Research on the method of methane emission prediction using improved grey radial basis function neural network model. Energies 2020, 13, 6112. [Google Scholar] [CrossRef]
- Amar, M.N.; Ghriga, M.A.; Ouaer, H.; Ben Seghier, M.E.A.; Pham, B.T.; Andersen, P.Ø. Modeling viscosity of CO2 at high temperature and pressure conditions. J. Nat. Gas Sci. Eng. 2020, 77, 103271. [Google Scholar] [CrossRef]
- Clauset, A.; Moore, C.; Newman, M.E. Hierarchical structure and the prediction of missing links in networks. Nature 2008, 453, 98–101. [Google Scholar] [CrossRef]
- Lü, L.; Zhou, T. Link prediction in complex networks: A survey. Phys. A Stat. Mech. Its Appl. 2011, 390, 1150–1170. [Google Scholar] [CrossRef]
- Liu, S.; Dong, Z.; Ding, C.; Wang, T.; Zhang, Y. Do you need cobalt ore? Estimating potential trade relations through link prediction. Resour. Policy 2020, 66, 101632. [Google Scholar] [CrossRef]
- Liben-Nowell, D.; Kleinberg, J. The link prediction problem for social networks. In Proceedings of the 12th International Conference on Information and Knowledge Management, New Orleans, LA, USA, 3–8 November 2003; pp. 556–559. [Google Scholar]
- Zhou, T.; Lü, L.; Zhang, Y. Predicting missing links via local information. Eur. Phys. J. B 2009, 71, 623–630. [Google Scholar] [CrossRef]
- Feng, S.; Li, H.; Qi, Y.; Guan, Q.; Wen, S. Who will build new trade relations? Finding potential relations in international liquefied natural gas trade. Energy 2017, 141, 1226–1238. [Google Scholar] [CrossRef]
- Guan, Q.; An, H.; Gao, X.; Huang, S.; Li, H. Estimating potential trade links in the international crude oil trade: A link prediction approach. Energy 2016, 102, 406–415. [Google Scholar] [CrossRef]
- Zhu, M.; Zhou, X.; Zhang, H.; Wang, L.; Sun, H. International trade evolution and competition prediction of boron ore: Based on complex network and link prediction. Resour. Policy 2023, 82, 103542. [Google Scholar] [CrossRef]
- Takahashi, Y.; Osawa, R.; Shirayama, S. A basic study of the forecast of air transportation networks using different forecasting methods. J. Data Anal. Inf. Process. 2017, 5, 49–66. [Google Scholar] [CrossRef][Green Version]
- Stadler, K.; Wood, R.; Bulavskaya, T.; Södersten, C.J.; Simas, M.; Schmidt, S.; Usubiaga, A.; Acosta-Fernández, J.; Kuenen, J.; Bruckner, M.; et al. EXIOBASE 3: Developing a Time Series of Detailed Environmentally Extended Multi-Regional Input–Output Tables. J. Ind. Ecol. 2018, 22, 502–515. [Google Scholar] [CrossRef]
- Leontief, W.W. Environmental Repercussions and the Economic Structure: An Input–Output Approach. Rev. Econ. Stat. 1970, 52, 262–271. [Google Scholar] [CrossRef]
- Xing, Z.; Jiao, Z.; Wang, H. Carbon footprint and embodied carbon transfer at city level: A nested MRIO analysis of Central Plain urban agglomeration in China. Sustain. Cities Soc. 2022, 83, 103977. [Google Scholar] [CrossRef]
- Brown, M.T.; Herendeen, R.A. Embodied energy analysis and EMERGY analysis: A comparative view. Ecol. Econ. 1996, 19, 219–235. [Google Scholar] [CrossRef]
- Watts, D.J. The “new” science of networks. Annu. Rev. Sociol. 2004, 30, 243–270. [Google Scholar] [CrossRef]
- Jiang, M.; Gao, X.; Guan, Q.; Hao, X.; An, F. The structural roles of sectors and their contributions to global carbon emissions: A complex network perspective. J. Clean. Prod. 2019, 208, 426–435. [Google Scholar] [CrossRef]
- Wang, X.; Wei, W.; Ge, J.; Wu, B.; Bu, W.; Li, J.; Yao, M.; Guan, Q. Embodied rare earths flow between industrial sectors in China: A complex network approach. Resour. Conserv. Recycl. 2017, 125, 363–374. [Google Scholar] [CrossRef]
- Xue, W.; Lei, Y.; Liu, X.; Shi, X.; Liu, Z.; Xu, Y.; Chen, X.; Song, X.; Zheng, Y.; Zhang, Y.; et al. Synergistic assessment of air pollution and carbon emissions from the economic perspective in China. Sci. Total Environ. 2023, 858, 159736. [Google Scholar] [CrossRef] [PubMed]
- Alhussam, M.I.; Ren, J.; Yao, H.; Abu Risha, O. Food trade network and food Security: From the perspective of Belt and Road Initiative. Agriculture 2023, 13, 1571. [Google Scholar] [CrossRef]
- Liu, H. Uncovering the network evolution mechanism by link prediction. Sci. Sin. Phys. Mech. Astron. 2011, 41, 816. [Google Scholar]
- Zhang, R.; Tai, H.; Cheng, K.; Zhu, Y.; Hou, J. Carbon emission efficiency network formation mechanism and spatial correlation complexity analysis: Taking the Yangtze River Economic Belt as an example. Sci. Total Environ. 2022, 841, 156719. [Google Scholar] [CrossRef] [PubMed]
Disclaimer/Publisher’s Note: The statements, opinions and data contained in all publications are solely those of the individual author(s) and contributor(s) and not of MDPI and/or the editor(s). MDPI and/or the editor(s) disclaim responsibility for any injury to people or property resulting from any ideas, methods, instructions or products referred to in the content. |
© 2025 by the authors. Licensee MDPI, Basel, Switzerland. This article is an open access article distributed under the terms and conditions of the Creative Commons Attribution (CC BY) license (https://creativecommons.org/licenses/by/4.0/).