Abstract
Plant biomass is playing a key role in the development of renewable energy sources. The share of biomass in renewable energy sources is about 70% in Poland and more than 40% in the European Union (EU). To assess the competitive position of farms selling plant biomass including straw and wood, including both future opportunities and threats, we conducted research on 185 farms in 2022. The aim of the research was to assess the usage of plant biomass, with the aim of increasing its position compared to other renewable energy sources. We used tabular, graph and descriptive methods to present the research results. Moreover, the Dornik–Hansen test (p = 0.003), Shapiro–Wilk test (p = 0.0017), Lilliefors test (p = 0.000) and Jargue–Berra test (p = 0.008) results show the significance of the research. The most important factors shaping the increased prices of biomass were the availability of raw materials on the market, totaling 41.1%, and calorific value, totaling 17.6%. Looking at the data, it can be seen that the most popular renewable energy technologies in which respondents plan to invest is photovoltaics (57.8%) and biomass (17.6%). According to the respondents, the most profitable renewable energy sources are photovoltaics (38.4%), wind energy (23%) and biogas (16.2%). Farmers also pointed out the most ecologically friendly, renewable energy sources. According to the respondents, the most ecologically friendly, renewable energy sources were wind energy (32.2%), photovoltaics (25.3%) and water energy plants (20.7%). The most frequently indicated limitations of biomass production were the long payback period (19.2%) and high investment costs (18.9%). The most important threat to biomass production was the shortage of arable land (32.5%) and poor farmland (23.5%). These results show that policymakers should adjust laws to encourage farmers to invest in biomass as a renewable energy source. Photovoltaics, which is considered a very clean renewable energy source, faces a big task in cleaning rural areas.
1. Introduction
Competitive position is one of the three dimensions of competitiveness, next to competitive advantage and competitive potential. Competitive position is primarily associated with the concept of competitive advantage. This results from the fact that each company has some competitive position (either better or worse), but not every company has a competitive advantage over other market participants. Each company has a competitive position, but depending on various factors, it may be more or less advantageous for the company [1]. According to Hutchins [2], an increase in costs in any field, whether production, processing or transport, weakens the competitiveness of a given region, while a decrease in costs increases its strength. The main factors contributing to a successful competitive position include the market and cost position of the company; brand and market embeddedness; technical competence and mastery of technology; and profitability and financial strength [1]. Taggart and Taggart [3] defined competitive position as the result of mutual relations between competitive potential, the process of competition, and the effects of this competition. Day [4] defined competitive position as the effect of competition developed using an appropriate competition strategy.
The competitiveness indicators of a company include aspects such as product quality, reliability, unique product features, company reputation, profitability, revenue growth dynamics, financial indicators, effectiveness of advertising and promotional strategies, team qualifications and experience, environmental impact indicators and customer service quality [5,6].
Competitive position concerns the location of a given company and its offer on the broadly understood market. It determines the benefits and risks that result from these factors. The market position of a company is often called competitive advantage, i.e., the achievement by the company of a superior position in relation to its competitors. It is a relative assessment of its presence on the market, enabling the provision of products or services to customers that meet their needs and, at the same time, stand out from competitors’ offer [7].
One of the key factors influencing the competitive position of an enterprise in a given sector is its ability to compete with other companies on the market. In this context, it is important not only to achieve good financial results, but also to compare them with the results of competitors. The competitiveness of an enterprise is a complex system that is shaped by many factors, including the environment, i.e., all phenomena, situations and entities that affect the market but are not components of competitiveness [8,9].
A company’s place in the competitive ranking is determined based on the level of benefits, both economic and non-financial, that the company provides to its stakeholders in relation to those offered by market rivals. In assessing competitive position, the assessments of buyers, owners, managers, employees, suppliers, cooperators and economic authorities are taken into account [10]. Competitive position means the place that the company occupies on the scale of economic and non-economic benefits in comparison to competitors [11]. It is worth noting that competitive position is not only an assessment of the current situation, but also encompasses future forecasts. It can be based on both subjective assumptions and objective market analyses [12].
Competitive position can be understood in several ways: as an expression of the competitive capabilities of a given enterprise, resulting from its potential; as a measure of the achieved competitive advantage or as both a source and a measure of competitiveness [8]. The concept of competitive position often refers to the participation of a given country in international economic exchange, which includes the exchange of products and production factors [8].
Competitive position can also be analyzed in the biomass market. Biomass can compete with other renewable energy sources on factors such as price, location in the market, logistics, storage and other market characteristics. The intention of this study is to fill in a gap in the existing literature, which is limited in this topic. Different renewable energy sources are rarely compared in terms of their competitive position in the market.
For farms, the raw materials and agricultural waste they produce, the availability of land resources, their quality and their location, including proximity to the sales market, facilitate their occupation of an especially competitive position on the biomass market [8,9]. Unfortunately, Poland’s poor competitiveness in the production of cereals and their products is mainly the result of the low quality of grain, which is caused by less favorable climatic and soil conditions compared to most European Union countries [13].
Poland is a very important producer of stable biomass. Stable biomass plays a key role as a renewable energy source. Moreover, stable biomass was the largest source of primary energy consumption in Poland in 2022 (64.1%), followed by wind energy (12.5%), biofuels (8.8%), photovoltaics (5.9%), biogas (2.6%), water energy (1.2%), renewable waste (0.8%) and geothermal energy (0.2%). Wood is most important renewable source for energy production. The emission intensity of the Polish economy is third in the world and first in the EU due to the large share of coal in the production of electricity and heat, the large amounts of unused coal due to mining and import and the high costs of coal import, reaching PLN 138 billion in 2023 [14].
Competitiveness, which includes competitive potential, advantage and position, is also linked to renewable energy sources. The competitive advantage can be achieved by export flows, which are responsible for the promise of green growth. Exports can be realized not only in energy, but also energy equipment, such as machinery [15].
The competitiveness of renewable energy sources is shaped by variability. For example, solar powers and wind electricity production vary due to weather conditions. This means that these sources of renewable energy sources should be supplemented by other energy sources, such as biomass or nuclear energy. Moreover, the competitiveness of renewable energy sources is shaped by subsidies for electricity production, which can encourage investment in renewable energy sources [16].
The competitiveness of renewable energy sources is also shaped by industries producing equipment such as PV panels and other renewable energy technologies. PV panels are generally small units, but their manufacturing has large-scale, significant potential for efficiency and cost improvements [17].
Biomass, which is the largest source of renewable energy, has a large competitive potential. Its share in energy differs between developed countries, varying from 2–3% to almost 35% in developing countries, with an average of 15%. Based on agriculture, countries have possibilities to produce and prepare more stable biomass not only from wood, but also agricultural straw. Poorer quality land can be devoted to the production of willow, miscanthus and other plants used for biomass and energy purposes [18,19,20].
The competitiveness of stable biomass depends on local resources of wood and straw. These products are imported from their original countries to other, mainly neighboring, countries, and are also traded over long distances. Woody pellets, roundwood and waste wood are traded from Russia to Eastern Europe [21,22]. The scale of international biomass trade reached the level of 600 PJ in 2015 [23].
The aim of this study was to assess the problems and limitations, as well as opportunities to increase the competitive position of biomass compared to other renewable energy sources.
The detailed research objectives were to:
- Assess the opportunities for plant biomass development on farms;
- Evaluate the threats to biomass development on farms.
The following research questions were formulated:
- What are the main opportunities for biomass development on farms?
- What are the main threats to biomass development on farms?
Hypothesis 1 (H1).
A shortage of arable land is the most important limitation for biomass production on farms.
The paper is organized as follows: the Section 1 presents the theory of ecological economics. The Section 2 summarizes the methods used. The results of our own research conducted on farms are presented in the Section 3. The final Section 4 and Section 5 discussion and conclusions gives key findings.
1.1. Competitive Position in Economic Literature
“Strengthening the competitive position of the economic system allows for achieving higher incomes of citizens and increasing their personal satisfaction” [13]. The concept of competitive position can be combined with competitive ability and competitive advantage. Competitive ability is understood in various ways [24], and one of the main factors in the competitive environment is knowledge management [25]. Competitive position is the result of previous competitive actions, which has been achieved in a given industry in comparison with the results obtained by rivals. It is not only the effect of previous competitive actions, but also the basis for taking further actions, and its assessment is a key issue [26,27]. The use of competitive strategies allows the company to adapt to changing environmental conditions and shape relations with suppliers in a way that is consistent with the company’s goals [26]. Competitive position is a measure of achieving a competitive advantage. It is understood as the result of competing in a given sector achieved by an enterprise, compared to the results achieved by its competitors [28,29,30]. Competitive position is defined as the result of competing in a specific sector generated by an enterprise, in relation to the results achieved by competitors [31]. Building a competitive system in enterprises is mainly based on recognizing the internal and external factors influencing their market position, as well as on developing their potential and selecting tools that determine the position and advantage they gain on the market [32]. The position of an enterprise in the competitive arena is shaped by the use of specific advantages in the market, and this assessment is always made in comparison to the competition in a given sector or strategic group. Therefore, changes in the competitive position of an enterprise in a given period allow for the assessment of the effectiveness of the competitive strategy, which is aimed at gaining a selected competitive advantage and achieving the desired competitive position [33,34]. The competitive position of an enterprise may result from the use of both internally and externally acquired resources. The ability to effectively manage these resources may affect the competitiveness of an enterprise [35]. The competitive position of a company is the result of its competition in a given sector and is assessed against the results achieved by competitors. M. Porter emphasizes that this position is dynamic and results from the constant struggle between enterprises, but this can be shaped by the choice of competitive strategy [33,36].
The competitive position of an enterprise can be defined as a multidimensional category that is determined by taking into account a number of factors, such as market share, share in key market segments, scope of market influence, size of operations, applied technologies and technical skills, as well as the adaptive capabilities of companies [37]. The competitive advantage of a given economic entity is reflected in its competitive position, which is one of the components of competitiveness that is often analyzed in the literature. Competitive position is the result of the competition in a given sector, assessed in relation to the achievements of competitors [33]. On the other hand, the competitive position of a country is the level of its involvement in international trade, and competitive ability determines the ability of the economy to compete with other countries in the international arena. Competition between countries is assessed in four key areas: technological, resource, structural and price. The assessment of a country’s competitiveness also includes matching the export structure to the import demands and requirements of its trading partners. The competitive advantage gained by countries in the international arena is unstable and temporary due to the presence of market mechanisms in the global economy [38].
To survive in a competitive market, exceptional capabilities and an exceptional competitive position are needed [39]. In a situation of global overproduction and falling consumption, successful companies must be innovative. Otherwise, the risk of remaining “trapped in the middle” without the possibility of action is significant [40,41,42].
Achieving an advantage does not guarantee market success; the ability to maintain it over time is crucial. In order to accurately determine the competitive position of an enterprise, it is necessary to analyze information from various sectors of activity and compare it with the results of rivals. Competitiveness is understood as the difference between market dominance and the distance separating companies from this dominance.
When interpreting competitiveness, both at the micro- and macroeconomic level, it is crucial to understand three of its aspects: competitiveness results, the management process and competitive potential [43].
Policies supporting renewable energy manifest in various types, including research, development, demonstration grants, financial incentives for investors and price- or quantity-based incentives like feed-in tariffs, feed-in premiums, net metering, renewable portfolio standards, renewable energy certificates and competitive procurement. Feed-in tariff (FIT) programs mandate that electric utilities buy the electricity generated by renewable energy providers within their jurisdiction at an established rate for a set duration, typically for 20 years. Feed-in-premiums ensure a stable premium in addition to the wholesale electricity market rate. Renewable portfolio standards (RPS) mandates demand that electric utilities generate a certain percentage of their electricity from renewable energy resources [44].
China’s trade in renewable energy plays a significant role in the global market. The thriving use of renewable energy has garnered significant interest in academia, leading numerous researchers to study the global competitiveness of renewable energy. Currently, studies on this topic primarily concentrate on wind and solar energy sources [45].
In 2023, renewable energy sources accounted for 24.5% of the European Union’s total energy consumption. The share was projected to have risen by one percentage point since 2022, primarily fueled by robust growth in renewable electricity generation. The share was further enhanced by a slight decrease in non-renewable energy usage in 2023. Achieving the new minimum EU goal of 42.5% for 2030 will require a twofold increase in the renewable deployment rates observed in the last ten years and a more profound change in the structure of European energy [46].
The competitiveness of renewable energy varies based on the energy service provided. Generating heat from renewable energy sources is typically economical. Nevertheless, biofuels and renewable electricity are still not competitive regarding production expenses; however, they are still rendered competitive in the market due to specific support mechanisms (subsidies, tax exemptions). Biomass has been utilized for heat generation since the beginning of history [47].
The worldwide renewable energy market is estimated to be valued at USD 1.74 billion in 2025 and is projected to grow to approximately USD 7.28 billion by 2034, with a CAGR of 17.23% from 2025 to 2034. The renewable energy market in the Asia Pacific region exceeded USD 600 million in 2025 and has been growing at a CAGR of 17.26% throughout the projected period [48].
The problem of competitiveness measurement concerning renewable energy sources (res) is very important. Some authors used the levelized cost of electricity (LCOE) method to measure the problem. However, this method only analyzes the cost of electricity production, which requires specific financial data [49].
1.2. Biomass Position in the Market
Energy is responsible for the development of the economy and building social well-being. Energy transformation, in addition to increasing energy efficiency, postulating liberalization, competitiveness and innovation, considered at the international level, also takes into account the processes of transformation in the power industry, heating and transport [50]. The EU perceives Poland as a country with great potential and production capabilities for biomass, where on a national scale, approx. 1.6 million ha of agricultural land can be used for production purposes [51,52]. Unfortunately, the production of biofuels from traditionally cultivated plants can create a number of problems, especially in the competition for arable land intended for consumption purposes, and those that will be cultivated for energy purposes may be threatened by a reduction in their biodiversity. For this reason, more efficient sources of biomass for energy purposes are sought-after, which pose a threat to the food economy and the environment [53]. Renewable energy sources can increase the level of energy security as they can be produced by local sources, consequently reducing fossil fuel exports and creating new jobs for agricultural workers and small- and medium-sized enterprises. The production of biofuels allows for the development of heavily polluted agricultural lands that are no longer suitable for the cultivation of edible plants, but are suitable for use for the cultivation of energy plants [54]. The use of local biomass of agricultural origin significantly contributes to the stimulation of economic development in rural areas through the diversification of activities, and thus the creation of new markets for agricultural raw materials, which constitute an important element of agricultural policy [53]. The main trends in the development of energy are:
- The diversification of energy sources (search for effective, cheaper production technologies, the impact of which on the environment is smaller than those used so far);
- The spatial decentralization of production sources (long-term process of transformation of the energy sector, based on a few large production units, towards territorial and raw material dispersion);
- The implementation of modern network solutions (technical and technological improvements for the functioning of power grids) for energy storage (ensuring an appropriate level of reserves in the energy system, which is achieved by using the entire spectrum of technological solutions) [54].
One way to effectively use plant biomass is to subject it to the process of methane fermentation in agricultural biogas plants. A biogas plant is an installation consisting of a set of devices and buildings that are a strictly designed technological chain, where biomass ferments inside by processing organic raw materials into biogas. Biogas plants are divided into two groups based on the types of biomass used: biogas plants and agricultural biogas plants [55]. The biogas produced in this way can be used to generate not only electricity but also heat, or after its purification for household needs. In such agricultural biogas plants, various types of raw materials can be used as fuel, including vegetable and fruit residues, which constitute 25% of all raw materials for biogas production; slaughterhouse waste (25.1%); liquid or solid animal excrements, including slurry, which is responsible for 21.6% and post-industrial waste, comprising residues from the processing of agricultural products or biomass obtained from areas other than those registered as agricultural or forest [56]. A detailed division of the use of raw materials for agricultural biogas production is presented in Figure 1 below.
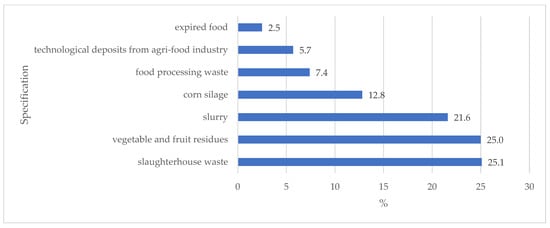
Figure 1.
Raw materials used for agricultural biogas production in the first half of 2019 in Poland (%). Source: own study, based on [57].
Polish conditions allow the use of energy from renewable sources, such as energy from solar radiation, wind, water, geothermal resources and energy that was generated using solid and liquid biofuels and biogas, as well as energy obtained by heat pumps [58,59]. The production of electricity from renewable energy sources in Poland in 2012–2019 is presented in Table 1. As can be seen, over the course of eight years, this production has almost doubled, from 16,879 GWh in 2012 to 28,248 GWh in 2020. The largest increase, more than threefold, was recorded in wind energy production, reaching a production level of 15,800 GWh. Due to the fact that the first major energy production only appeared in 2012, a significant increase photovoltaics could be only recorded from 2015 at the level of 57 GWh, and in 2019 it was already 1958 GWh. Therefore, it may be the fastest growing sector of renewable energy sources, due to the fact that energy from water has been oscillating at the same level of approx. 2000 GWh per year for many years, and energy from biomass and biogas has seen a decrease in electricity production since 2012 by 1723 GWh; it has already increased by almost 2000 GWh over the last 3 years (Table 1).

Table 1.
Electricity production by carriers in Poland.
The total electricity production increased from 16,879 GWh in 2012 to 28,248 GWh in 2020. During this period, biomass and biogas energy showed a general downward trend until 2017, after which it started to grow. Hydropower remained more or less constant. Wind power showed a strong growth, and photovoltaic energy, although starting from a very low level, started to grow rapidly from 2015.
Table 2 presents forecasts for net electricity production and primary energy demand in the country for 2020, 2025, 2030 and 2040. It presents the expected changes in the energy mix, taking into account both non-renewable and renewable fuels. This allows us to see the future development directions foreseen for the Polish energy sector. The table below shows that net electricity demand will increase from 171 TWh in 2020 to 204.2 TWh in 2040. At the same time, net electricity production is expected to increase from 157.7 TWh to 184.2 TWh. It can be assumed that the increase in demand is due to the further development of technology and infrastructure and increases in population, which increases energy consumption. The largest share of energy production in 2020 was held by non-renewable fuels, accounting for 79.8% of production, but their share will decrease to 53.9% in 2040. This is probably due to the transition to cleaner and more sustainable energy sources. A significant increase in production is expected in renewable energy sources, especially wind and photovoltaic power. Wind power production is expected to increase from 15.8 TWh (10% of total production) in 2020 to 36.3 TWh (19.7%) in 2040, while photovoltaic power production is expected to increase from 2.1 TWh (1.3%) to 17.3 TWh (9.4%).
Biomass and biogas production is also expected to increase from 8.2 TWh (5.2% of total production) in 2020 to 13.6 TWh (7.4%) in 2040. This is likely due to the growing understanding and acceptance of biogas as a sustainable energy source.
The increase projected in nuclear power production, from 0 TWh in 2020 to 9.6 TWh (5.2% of total production) in 2040. This may suggest that most experts consider nuclear power to be an important energy source in the future, despite potential safety and radioactive waste concerns [61].
The final energy source included in the table is other sources, including pumped-storage hydropower (PSH), which is expected to increase slightly from 3.8 TWh (2.4% of total production) in 2020 to 5.7 TWh (3.1%) in 2040 (Table 2).
Taken together, the data in the table shows a trend towards a decreasing share of non-renewable fuels and an increasing share of renewable energy sources in net electricity production. These trends are consistent with global efforts to reduce CO2 emissions and move towards sustainable energy production.
Table 2.
Forecast of net electricity production/primary energy demand according to experts in Poland.
Table 2.
Forecast of net electricity production/primary energy demand according to experts in Poland.
| Specification | 2020 | 2025 | 2030 | 2040 | ||||||||
|---|---|---|---|---|---|---|---|---|---|---|---|---|
| PJ | TWh | % | PJ | TWh | % | PJ | TWh | % | PJ | TWh | % | |
| Net electricity demand | - | 171.0 | - | - | 175.0 | - | - | 181.1 | - | - | 204.2 | - |
| Net electricity production | - | 157.7 | - | - | 160.0 | - | - | 161.1 | - | - | 184.2 | - |
| Imports | - | 13.3 | - | - | 15.0 | - | - | 20.0 | - | - | 20.0 | - |
| Gross electricity production | - | 175.2 | - | - | 177.8 | - | - | 179.0 | - | - | 204.7 | - |
| Non-renewable fuels | 1025.5 | 125.8 | 79.8 | 1000 | 123.8 | 77.4 | 863.9 | 109.6 | 68.0 | 745.2 | 99.3 | 53.9 |
| Wind | 0 | 15.8 | 10.0 | 0 | 17.0 | 10.6 | 0 | 24.0 | 14.9 | 0 | 36.3 | 19.7 |
| Photovoltaics | 0 | 2.1 | 1.3 | 0 | 5.0 | 3.1 | 0 | 10.8 | 6.7 | 0 | 17.3 | 9.4 |
| Water | 0 | 2.1 | 1.3 | 0 | 2.1 | 1.3 | 0 | 2.1 | 1.3 | 0 | 2.4 | 1.3 |
| Biomass/biogas | 59.0 | 8.2 | 5.2 | 61.2 | 8.5 | 5.3 | 70.6 | 9.8 | 6.2 | 97.9 | 13.6 | 7.4 |
| Nuclear energy | 0 | 0 | 0 | 0 | 0 | 0 | 1.8 | 0.16 | 0.1 | 91.2 | 9.6 | 5.2 |
| Others, including ESP* | 25.4 | 3.8 | 2.4 | 24.7 | 3.7 | 2.3 | 30.2 | 4.5 | 2.8 | 38.2 | 5.7 | 3.1 |
| Total net production structure | 1109.9 | 157.7 | 100 | 1085.9 | 160.0 | 100 | 966.5 | 161.1 | 100 | 972.5 | 184.2 | 100 |
ESP*—pumped storage power plants. Source: own findings, based on [62].
In recent times, the heating method based on biomass boilers, especially wood pellets, is gaining popularity due to its environmental friendliness. In Poland, wood sawdust is primarily used for the production of pellets. The growing demand for wood biomass in various industrial sectors means that alternative, easily accessible raw materials are sought-after [63].
The development of biomass-based power generation should be linked to the cultivation of energy crops, which allow 20 tons of dry mass/ha to be obtained per year, which translates into about 15 tons of coal used in the power industry. Energy companies play an important role in this process, because at this stage they should often be “patrons” of development. Investments in future profits are crucial for the further expansion of this sector [64].
Table 3 shows changes in the installed capacity of various renewable electricity sources in Poland in 2019–2021. The data presented shows that the installed capacity of all types of renewable energy power plants increased during this period. However, the pace of this growth varied significantly between the individual types of power plants. Without doubt, the most dynamic development occurred in the photovoltaic energy sector, which recorded a huge increase in installed capacity by 366.6% over three years. The installed capacity in wind farms also increased significantly, although not as spectacularly, increasing by 18.4% (Table 3).
Table 3.
Installed renewable energy capacity—2019/2021 in Poland.
Biogas power plants also increased their installed capacity, albeit on a smaller scale, with an increase of 10.1%. Biomass and hydropower plants grew at a much slower pace, with an increase of 1.0% and 0.56%, respectively, in installed capacity over the three years. Nevertheless, these sectors also saw some growth, indicating a general increase in interest in renewable energy. Overall, the installed capacity of all renewable energy power plants increased by 70.5% between 2019 and 2021, indicating the growing importance of renewable energy sources in Poland.
Table 4 shows the changes in electricity production from different renewable sources in Poland between 2019 and 2021. The table shows that all renewable electricity sources, except biomass, grew during this period. Hydropower, wind power and biogas grew by 19.4%, 7.4% and 15.2%, respectively. The most significant increase came from photovoltaic energy, which increased by an impressive 453.5% over the three-year period. However, biomass energy production decreased by 6.1% over the same period. Overall, renewable energy production increased by 19.6% between 2019 and 2021.
Table 4.
Electricity production from renewable energy sources in 2019–2021 in Poland.
Table 5 shows the change in heat production from different RESs in Poland in 2019–2021. As can be seen, heat production from each type of RES increased during this period, except for biogas, where a small decrease of 4.5% was observed.
Table 5.
Heat production from renewable energy sources in Poland in 2019–2021 in Poland (TJ).
The most important heat source in the context of RES is solid biofuels, which recorded a 31.7% increase in production over three years. A significant increase in heat production was also observed for municipal waste (by 118.7%) and heat pumps (by 71.0%), but their share in the total RES heat production is much smaller.
Bioliquids, despite their small share in the total RES heat production, also recorded an 8.7% increase in heat production in 2019–2021. Overall, RES heat production increased by 33.2% in 2019–2021, which indicates the growing importance of RES in heat production in Poland. The conclusions from this analysis are important for assessing the competitive position of plant biomass as an energy carrier in the context of other renewable energy sources in the heat production sector (Table 5).
An important element of the exploitation of renewable energy sources is shown in Figure 2, below. It shows four different types of renewable energy sources in terms of their efficiency, measured as the amount of energy that can be produced during the operational period per unit of power of the source. All values are given in units of megawatt hours per kilowatt (MWh/kWe) and assuming a discount rate of 7%.
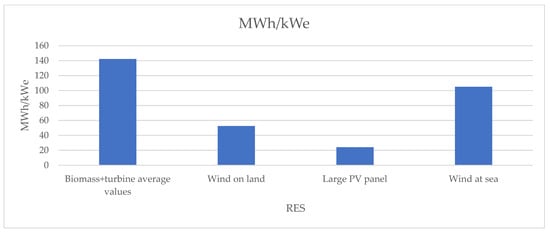
Figure 2.
Energy produced during the source’s operation period, per unit of source power, MWh/kWe (with a discount rate of 7%). Source: own findings, based on [67].
The average value for the biomass technology with a turbine, according to the International Renewable Energy Association (IRENA) report, is 142.3 MWh/kWe. This means that for every kilowatt of power installed in this technology, 142.3 MWh of energy can be expected to be generated during the operational period.
In the case of onshore wind energy, 52.5 MWh per kilowatt of power is expected. Although this is less efficient than the biomass technology and turbines, onshore wind can still provide significant amounts of energy.
Large solar panel installations generate the least energy per unit of power among the technologies analyzed, with a result of 24.1 MWh per each installed kilowatt of power.
Offshore wind generates 105.1 MWh of energy per installed kilowatt of capacity, which places it in the middle of our ranking.
In summary, biomass and turbine technology seems to be the most efficient renewable energy source among those compared. However, it is worth remembering that the ultimate efficiency of each of these technologies may depend on many factors, including local climate and geographic conditions and the costs associated with installing and maintaining the technology.
2. Materials and Methods
2.1. Data Sources
The main sources of research were data from Statistics Poland and the research concerned farms where surveys were carried out. During the research, additional issues were focused on, including respondents’ opinions regarding the renewable energy industry, including external and internal factors; the condition and assets of farms and the impact of biomass and other renewable energy sources on their competitiveness. The research was conducted in 2022.
Our own research was conducted on a group of 185 respondents, of which 18 farms only sold wood, 28 farms sold wood and straw and 139 only sold straw. The research involved a purposeful selection of farms. Their selection was based on two criteria: biomass production on the farm and its sale (straw and wood). Additionally, the possibility of obtaining revenues from the sale of energy plants and other agricultural waste necessary for the production of agricultural biogas, e.g., silage, green fodder, and wind and solar energy in the case of other renewable energy sources, was taken into account.
We divided the farms into four groups according to revenues from biomass sale to:
PLN 3000—58 farms (31.5%);
PLN 3001–6000—46 farms (25%);
PLN 6001–9000—20 farms (10.9%);
PLN above 9000—60 farms (32.6%).
2.2. Methods
Three methods were used to present the research results to ensure accurate and easily understandable presentation of the collected data. The first was the descriptive method, which involves a detailed and narrative description of discoveries and conclusions. The second was the tabular method, which allows for the orderly presentation of numerical data and statistics in the form of tables, facilitating their comparison and analysis. The last method was graphical, which uses various types of charts and diagrams to visually illustrate trends, patterns and relationships between the variables being studied, often allowing for faster understanding of complex data.
Farms were selected through purposive sampling, a significant portion of which were located in the Mazowieckie and Podlaskie voivodeships. The results of these studies provided important information on the role of biomass in farms, as well as its current and future potential. The questionnaire included different questions concerning farmers’ opinions about biomass.
The survey concerned opinions about biomass and other renewable energy sources. The questions in this section concerned whether farmers consider biomass an attractive source of energy in terms of prices, what external factors they think influence the price of biomass, what limitations they see in its production, whether they consider it competitive with other renewable energy sources and what renewable energy sources are currently used on their farms. These questions aim to find out farmers’ opinions about biomass, taking into account their personal experiences and the environment in which they work. The questions in the survey questionnaire concerned whether respondents believed that biomass could replace other renewable energy sources, as well as their plans related to renewable energy sources on their farms. Questions were asked about the use of renewable energy and the profitability and eco-friendliness of various energy sources, as well as the competitiveness of biomass compared to other energy sources. At the end of the survey, the questionnaire focused on the limitations of biomass production, such as the small amount of raw material per hectare, difficult cultivation, high investment costs or long payback period.
3. Results
3.1. Descriptive Statistics of Revenue from Biomass Sale on Farms
We compared results of three tests to analyze the normality of the data. The first test used for the analysis of the data was the Dornik–Hansen Test. The Dornik–Hansen test for normality was employed to determine if the data were normally distributed [68]. The result of the Dornik–Hansen test was 255.5 and the p value was p = 0.003, suggesting normal distribution.
Another test used for the analysis of the data was the Shapiro–Wilk test. The use of this test helps to verify the normality with a known mean. Moreover, it helps to analyze the significance level [69]. The result of the Shapiro–Wilk test was 0.716186, with the p value p = 0.0017, describing the normality.
Moreover, we used the Lilliefors test. This is a very important tool for analyzing the empirical cumulative distribution function of a randomly generated normal sample [70]. The result of the Lilliefors test was 0.278438 with p = 0.000, suggesting normal distribution with an estimated mean and standard deviation.
Finally, we performed the Jargue–Berra statistical test. This tool, as the previously mentioned, helps to evaluate the assumption that the data were normally distributed. It is useful in analyzing the datasets [71]. Our result for the Jargue–Berra test was 276,583, with p = 0.008.
Moreover, we evaluated the descriptive statistics for revenue from biomass sale on a farm. The results were statistically important.
Farmers were asked to evaluate their revenue from biomass sale. The descriptive statistics included: average, median, minimal, maximal, standard deviation, coefficient of variation and kurtosis (Table 6).
Table 6.
Descriptive statistics of revenue from biomass sale.
The average value of revenue from biomass sale on the farm was rather small, and amounted to 11,494. Even though the value of biomass sale on the farm is not big, the money may decide the survival of the farm. Many farms break down because of a small revenue and income. This particularly concerns Polish farms, which can struggle to survive in the market.
The coefficient of variation details the changes in analyzed data. The value of coefficient of variation was quite high, what suggests important changes in the value of revenue from biomass sale.
The kurtosis summarizes the statistical changes in volume of revenue from biomass sale. The value of skewedness and kurtosis was positive, suggesting that a higher number of examples were located on the right side of the average.
3.2. Biomass Chances of Development in Poland
Table 7 presents the results of a survey on farmers’ opinions on the price attractiveness of biomass in the context of their revenue from the sale of straw and wood. Most of the respondents pointed out that biomass is attractive in terms of price (33.0%), but 55.6% of respondents did not have an opinion.
Table 7.
Opinions on the attractiveness of the price of biomass depending on revenues from the sale of straw and wood.
As part of the research, farmers were divided into four groups according to the value of their revenue from the sale of straw and wood, and then asked about their opinions.
The analysis shows that 9.6% of farmers with the lowest revenue (up to PLN 3000) believed that biomass was attractively priced, while 2.8% did not share this opinion. The remaining 13.8% of people had no opinion on this subject.
In the group with revenue in the range of PLN 3001–6000, 6.4% of respondents assessed the price attractiveness of biomass positively, 2.8% negatively and 13.8% had no specific opinion.
Among farmers from the PLN 6001–9000 category, only 4.6% of them believed that biomass was attractively priced, 2.8% had the opposite opinion and 14.2% did not express a specific opinion.
The most positive opinions about the price attractiveness of biomass were expressed by farms with revenue above PLN 9000. In this group, 12.4% of people agreed with this statement, 3.0% disagreed and 13.8% had no opinion.
Taken together, these results suggest that revenues from the sale of straw and wood may influence farmers’ perception of the attractiveness of the price of biomass. In particular, farmers with higher revenue more often believed that biomass was attractively priced. At the same time, a large group of respondents in all categories did not have a specific opinion on this topic, which may indicate the need for further research and education in this area.
Table 8 presents the factors that, according to respondents, influence the price of biomass and how these factors are assessed by different groups of farmers depending on their income from the sale of straw and wood. The majority of farmers pointed out raw material availability (41.1%), calorific value (17.6%) and ease of combustion (13.0%) as the most important factors shaping the price of biomass.
Table 8.
Factors shaping the price of biomass depending on revenues from the sale of straw and wood.
For farmers with revenue up to PLN 3000, the most important factor influencing the price of biomass was the availability of raw material (13.4%), followed by calorific value (5.8%) and the possibility of storage (5.1%).
In the group with revenues of PLN 3001–6000, the availability of raw material (10.6%) and calorific value (5.1%) were also the most important, but a large sales market (3.8%) was more important than the possibility of storage (2.4%).
For farmers with revenue in the range of PLN 6001–9000, the availability of raw material was also crucial (5.5%), but other factors were much less important. Finally, for farmers with revenue above PLN 9000, the most important were the availability of raw material (11.6%) and ease of burning (6.2%).
Overall, the availability of the raw material seems to be the most important factor influencing the price of biomass according to all groups of farmers, regardless of their income from straw sales. At the same time, farmers’ responses suggest that their perception of other factors may vary depending on their economic situation.
Table 9 presents external factors that, according to farmers, influence the increase in the price of biomass, as well as how these factors are assessed by different groups of farmers, depending on their income from the sale of straw and wood. The whole group of respondents pointed out the availability of raw materials on the market (23.1%), poor harvest (16.0%) and hard winter (14.0%) as the most important external factors influencing the price of biomass.
Table 9.
External factors influencing the increase in the price of biomass depending on revenues from the sale of straw and wood.
For the group of farmers with the lowest revenue (up to PLN 3000), the most important factor was the availability of raw materials on the market (8.5%), followed by a poor harvest (4.3%) and large numbers of local farm animals and a difficult winter (4%).
For the group with revenues in the range of PLN 3001–6000, the factors were evenly distributed, with the greatest emphasis on local enterprises purchasing raw materials (5%) and the availability of raw materials on the market, a difficult winter and poor harvests (4.3%).
For farmers from the group with a revenue of PLN 6001–9000, all factors were less important, but the most important was the availability of raw materials on the market (2.3%).
In the group with the highest revenues (above PLN 9000), the most important factors were the availability of raw materials on the market (8%) and poor harvest (5.4%).
Generally, the availability of the raw material on the market was considered a key external factor influencing the increase in the price of biomass by all groups of farmers, regardless of their income from straw sales. However, the valuation of other factors differed between the groups.
Table 10 shows various factors that, according to respondents, influence the attractiveness of biomass as an energy source and how these factors are assessed by farmers from different income groups from the sale of straw and wood. Price (20%) and the ease of combustion (19.4%) were the most highly pointed out by respondents.
Table 10.
Factors shaping the attractiveness of biomass in the opinion of respondents.
In the group with the lowest revenue (up to PLN 3000), the most significant factor was ease of combustion and the availability of raw material (6.9%), followed by the price (6.4%). For farmers from the PLN 3001–6000 group, the most important factors were caloric value and price (4.8%). For the group with revenues of PLN 6001–9000, the most important factor was the price (2.6%).
However, for farmers from the group with the highest revenue (above PLN 9000), the important factors were the price (7.7%), ease of combustion (7.3%) and availability of raw material (7%).
Generally, all groups of farmers indicated price, ease of combustion and availability of raw material as the key factors influencing the attractiveness of biomass. However, the importance of individual factors varied depending on the revenue group.
Table 11 presents respondents’ opinions regarding the potential of biomass to replace other renewable energy sources (RES), depending on revenue from the sale of straw and wood. Biomass is so easy to use that 29.7% of farmers pointed out that it could replace other renewable energy sources.
Table 11.
Possibilities of replacing other renewable energy sources by biomass.
Respondents from the group with the lowest revenue (up to PLN 3000) most often expressed uncertainty about the possibility of replacing other renewable energy sources with biomass (14.3%) “I do not know”. However, (10.5%) of respondents from this group believed that it was possible
In the revenue group of PLN 3001–6000, a similar percentage of respondents answered “Yes” (7.7%), “No” (6.6%) and “I do not know” (12.6%).
In the revenue group of PLN 6001–9000, most respondents answered “Yes” (3.8%), and fewer answered “No” (2.2%) and “I do not know” (3.3%).
In the highest revenue group (above PLN 9000), 14.3% said “I do not know”, 11% said “No” and 7.7% said “Yes”.
In summary, respondents’ opinions on the potential of biomass to replace other renewable energy sources were divided and varied depending on the income group.
Table 12 shows the distribution of types of renewable energy sources (RES) on farms depending on the revenue obtained from the sale of straw and wood.
Table 12.
Type of renewable energy sources on the farm.
The most popular source of renewable energy among respondents in all income groups was solar energy (photovoltaics), except for the highest revenue group (above PLN 9000), in which biomass was the most popular.
In the group with the lowest revenue (up to PLN 3000), 13.6% of respondents stated that they did not have any source of renewable energy. Among those who had renewable energy, photovoltaics was the most popular (8.6%) and biomass was second (5.5%).
In the revenue group of PLN 3001–6000, photovoltaics was also the most popular (11.4%), and biomass was again the second most popular (5.5%). However, as many as 12.3% of respondents did not have any type of renewable energy. In the PLN 6001–9000 group, 4.1% of respondents indicated photovoltaics, 1.4% biomass and 2.7% did not have any type of renewable energy.
In the highest revenue group (above PLN 9000), the most common renewable energy source was photovoltaics (10.1%), followed by biomass (8.2%).
In summary, the results show that the most popular renewable energy sources on farms are photovoltaics and biomass, and their popularity varies depending on revenue from straw sales.
Table 13 illustrates investment plans in renewable energy sources (RES) on agricultural farms depending on revenues from the sale of straw and wood. The biggest number of respondents wanted to invest in photovoltaics (57.8%), biomass (17.6%) and windmills (12.4%).
Table 13.
Investment plans in renewable energy sources.
Looking at the data, it can be seen that the most popular renewable energy technology in which respondents plan to invest is photovoltaics. It is particularly popular among farms, with revenues from the sale of straw amounting to PLN 3001–6000 and above PLN 9000, where 19.6% and 18.6% of respondents, respectively, declared such an investment. In the revenue group of up to PLN 3000, 13.4% of respondents declared their willingness to invest in photovoltaics.
Biomass (pellet stoves, briquette stoves, etc.) is the second most popular technology in which respondents plan to invest. This is particularly visible in the revenue group of up to PLN 3000, where (6.2%) of respondents declared such plans.
Investments in windmills and biogas plants are less popular. Windmills were more popular in revenue groups up to PLN 3000 and PLN 3001–6000, while biogas plants were the most popular in the income groups up to PLN 3000 and above PLN 9000.
In summary, photovoltaics seems to be the most attractive renewable energy technology for respondents in all revenue groups. However, there is also a noticeable interest in investing in biomass, especially among respondents with lower income from straw sales. Investments in windmills and biogas plants are less popular, but still notable.
Table 14 presents the purpose of renewable energy sources (RES) on farms depending on revenues from the sale of straw and wood. The renewable energy sources can deliver electricity (51.1%) and heat (30.4%) to farms in most cases.
Table 14.
Purpose of renewable energy sources on the farm.
The data suggest that the dominant use of renewable energy sources is to provide electricity for the home/farm and to heat the home/farm. In particular, the vast majority of respondents in revenue groups up to PLN 3000, PLN 3001–6000 and above PLN 9000 declared the use of renewable energy for these purposes. The use of renewable energy sources to sell surplus energy production is much less popular in all income groups.
Furthermore, the responses to the “Other” category suggest that there are other applications of renewable energy beyond those included in this survey. In the revenue group above PLN 9000, 4.3% of respondents indicated other uses of renewable energy sources, which highlights the diversity of renewable energy applications on farms.
In summary, the results show that renewable energy sources are mainly used to provide electricity and heating on farms. The use of renewable energy sources to sell surplus energy production is less popular, although this practice still occurs. The variety of responses to the “Other” category suggests that there are many other applications of renewable energy that are specific to individual farms.
Table 15, below, presents respondents’ opinions regarding the most profitable source of renewable energy (RES) depending on the revenues obtained from the sale of straw and wood. The most profitable renewable energy source was photovoltaics (38.4%), followed wind energy (23.0%) and biomass (13.6%) in most cases.
Table 15.
Opinions about the most profitable renewable energy sources.
The data indicate that the majority of respondents in each income group consider photovoltaics to be the most profitable source of renewable energy. This tendency is particularly clear in the revenue group above PLN 9000, where photovoltaics is assessed as the most profitable by 14.1% of respondents.
At the same time, among other renewable energy sources, wind energy seems to be the second most popular answer, with 8.4%. In revenue groups up to PLN 3000 and above PLN 9000, wind energy is rated as the second most profitable source of renewable energy. Biomass (pellets, briquettes, etc.,) and biogas are also assessed as relatively profitable, especially in revenue groups up to PLN 3000 and above PLN 9000. The least popular source of renewable energy in the opinion of respondents is hydropower, which is rated the lowest in all revenue groups.
Taken together, the results indicate that photovoltaics is widely considered to be the most cost-effective source of renewable energy, while wind energy, biomass and biogas are also rated as relatively cost-effective. A hydroelectric power plant is definitely the least popular source of renewable energy in the opinion of respondents.
Table 16 presents respondents’ opinions regarding the most ecological sources of renewable energy (RES) depending on revenues from the sale of straw and wood. Wind energy was considered as the most ecologically friendly renewable energy source (32.0%), followed by photovoltaics (11.2%) and water energy plants (20.7%).
Table 16.
Opinions on the most ecologically friendly renewable energy sources.
The data show that in most income groups, wind energy is most often indicated as the most ecological source of renewable energy. This trend is particularly visible in revenue groups up to PLN 3000 and above PLN 9000, where 10.3% of respondents in each of these groups indicated wind energy as the most ecological source of renewable energy. Photovoltaics is also often assessed as one of the most ecologically friendly renewable energy sources, especially in revenue groups up to PLN 3000 and above PLN 9000, where 7.7% of respondents in each of these groups chose photovoltaics. Hydroelectric power plants are rated as one of the most ecologically friendly RESs in revenue groups of PLN 3001–6000 and above PLN 9000, while biomass (pellets, briquettes, etc.) and biogas seems to be rated as less ecologically friendly compared to other RESs in all income groups.
In summary, the data indicate that respondents consider wind energy to be the most ecologically friendly source of renewable energy, with photovoltaics in second place. Hydroelectric power, biomass and biogas are generally assessed as less ecologically friendly renewable energy sources.
Table 17 presents respondents’ opinions regarding the competitiveness of biomass compared to other renewable energy sources (RES). In 21.1% of cases, farmers pointed out that biomass on their farm is the most competitive renewable energy source.
Table 17.
Opinions on whether biomass is the most competitive renewable energy source.
It is clearly visible that many people do not have a strong opinion on this subject, which is most visible among respondents with the highest revenue (above PLN 9000), where as many as 21.6% of respondents did not express a specific opinion. Most seem to believe that biomass is competitive compared to other renewable energy sources. This view is most common among respondents with the highest income from straw sales (7.6%) of respondents. Finally, we have a group of respondents who do not consider biomass to be competitive compared to other renewable energy sources. The greatest number of such responses were recorded among respondents with the lowest revenue (up to PLN 3000), where 4.3% of people expressed such an opinion. To sum up, it is clearly visible that the issue of the competitiveness of biomass compared to other renewable energy sources is ambiguous for many respondents. More people seem to think that biomass is competitive, especially in the group with the highest income from straw and wood sales.
3.3. Threats to Biomass Development in Farms
Table 18 presents various limitations in biomass production that farmers face depending on the income from straw sales. These indicators were based on respondents’ experiences. The long payback period (19.2%), high investment costs (18.9%) and small amount of raw material (16.0%) were limitations to biomass development pointed out in most cases.
Table 18.
Limitations in biomass production.
In the group with revenue up to PLN 3000, the following are the most important barriers to biomass production: small amount of raw material per hectare (6.6%), high investment costs (6.3%) and low co-financing per hectare (5.3%). In the group with revenue between PLN 3001 and PLN 6000, the high investment costs (3.8%) and long payback period (4.1%) are the most frequently reported limitations. In the group with revenue from PLN 6001 to PLN 9000, the problems are less diverse, with a small amount of raw material per hectare, high investment costs and a long payback period being the dominant limitations. In the group with revenue above PLN 9000, the high investment costs (7.2%) and long payback period (8.8%) are the most important barriers, although having a small amount of raw material per hectare (5.3%) and low subsidy per hectare (4.7%) are also important. Overall, the results suggest that biomass production encounters many barriers, both economic and technical, that may discourage farmers from growing it (Table 18).
Table 19 illustrates the threats associated with biomass production on farms perceived by respondents, depending on different income groups from the sale of straw and wood. The biggest number of respondents pointed out shortage of arable land (32.5%), poor farmland (23.5%) and lack of appropriate agricultural equipment (17.89%) as the most important threats to biomass development on farms.
Table 19.
Threats associated with biomass production on farms depending on revenue from the sale of straw and wood.
Among farmers with the lowest revenue (up to PLN 3000), the most frequently indicated problem was the shortage of arable land (10.8%), followed by poor arable land (7.7%). The third most frequently indicated problem was the lack of appropriate equipment (5.4%) and increasingly difficult weather conditions (5%).
For the PLN 3001–6000 revenue group, the most important limitations were a shortage of arable land (8.9%) and the lack of appropriate agricultural equipment and poor arable land (5.6%).
For farmers from the PLN 6001–9000 group of revenue, the restrictions were generally less noticeable, with the shortage of arable land being the most frequently mentioned problem, by 3.1%.
However, in the group with the highest revenue (above PLN 9000), the most important limitations were the shortage of arable land (9.7%) and lack of labor (6.6%).
In general, respondents in all income groups indicated a lack of arable land as a key limitation to biomass production. However, other constraints, such as land quality, lack of labor, lack of appropriate equipment and climate change, varied in importance by income group.
4. Discussion
Biomass, as a renewable energy source, has many advantages, including low emissions of harmful gases, the possibility of waste management and the promotion of sustainable agriculture. It is also safe to transport and store, easily available and the costs of its combustion are low. However, significant disadvantages include the risk of greenhouse gas emissions during production, potential increases in food prices, soil degradation, the problem of uncontrolled deforestation and increased CO2 emissions during long-distance transport. A wide range of advantages and disadvantages of biomass have been studied.
The advantages of biomass production include the following:
- -
- Lower SO2, NO2 and CO2 emissions than fossil fuels, minimal CO2 emissions;
- -
- Waste management;
- -
- Lower food waste;
- -
- Biogas production reduces the amount of municipal waste;
- -
- Much lower environmental risk during storage and transport of biomass than gas or oil;
- -
- Offers the opportunity to develop wastelands and post-industrial areas;
- -
- Biomass has a more peaceful nature than solar or wind energy;
- -
- Biomass production supports sustainable development of agriculture;
- -
- Provides new ways of earning money for farmers;
- -
- Easy availability;
- -
- Offers the opportunity to improve energy security;
- -
- Biomass combustion prices are much lower than the prices of other fuels.
Disadvantages of biomass production include the following:
- -
- Releases harmful substances, namely proteins and fats;
- -
- There is the possibility of greenhouse gas emissions in the biomass production process;
- -
- Increase in food prices;
- -
- Soil degradation;
- -
- Uncontrolled deforestation, which is contrary to the principles of sustainable development and the fight against global warming;
- -
- The risk of introducing uniformity in plant cultivation;
- -
- Long-distance transport of biomass by diesel-powered vehicles causes an increase in CO2 in the atmosphere [72].
Biomass is a product that can be easily traded. However, the vast majority of imported biomass to Poland is from Belarus. This suggests that the supply chain of woody biomass should be controlled [73].
Biomass is a substrate for biogas production. Agricultural products such as straw, rapeseed, corn, wood and others can be easily used to enable a local supply of biogas. This is particularly important in the European Union, the largest producer of biogas, which is estimated at 59.3 billion m3 and increasing by about 9% each year [74].
Our research also has limitations. The most important is the reluctance to participate in research. Farmers are usually reluctant to participate in research because they fear that information about their farms will be shared with institutions.
The results of our research are rather advisory in nature and do not constitute scientific evidence. However, they provide valuable information about farmers’ opinions on solid biomass’s competitiveness potential.
Estimating the competitive position of biomass is extremely difficult due to the lack of financial data. This can only be assessed on the basis of interviews, which should be supplemented with statistical data. The competitive position of biomass in relation to other renewable energy sources can be estimated using the analysis of production, transport and combustion costs and the maintenance of devices. Difficulties in obtaining such data often force researchers to conduct sociological studies.
The limitations of the research can be overcome by the very detailed data possessed by companies that install renewable energy sources on farms. In addition, detailed data on electricity invoices and information from power plants on returns and savings can contribute to more detailed studies and solve many research problems.
Future studies on the competitive position of biomass in relation to other renewable energy sources should be more detailed. Obtaining comprehensive information on the costs and financial revenues related to the use of renewable energy sources on the farm may provide further insights, although we are aware of the reluctance of farmers to provide financial data. Institutions that conduct detailed studies and have reports from companies dealing with renewable energy sources should help address this issue.
5. Conclusions
The assessment of the competitive position of plant biomass on the domestic and European market sheds light on the complex energy landscape, in which biomass maintains an important role, despite the dynamic development of other renewable energy sources (RES) such as solar or wind energy. The advantages of biomass are not only its availability and adaptability, but also its versatility of applications, from the production of heat and electricity to the production of biofuels. This, combined with the possibility of using agricultural and forestry waste, increases its attractiveness as a source of renewable energy. In addition, plant biomass plays an important role in achieving the goals related to the reduction in greenhouse gas emissions, thanks to the carbon neutrality of the combustion of biological materials [75].
The role of biomass is not only increasing in heat production, but also in electricity production. As Poland’s largest sources of energy are hard coal (44.3%) and lignite (24.4%) the development of biomass is essential in increasing need for energy sources. Biomass is playing a key role in renewable energy sources, with a share of about 60%, followed by wind power (13.6%) and photovoltaics (5.2%) [76].
Our research shows the need for the continued development of renewable energy sources in Poland and other countries in the European Union; however, Poland still depends on fossil fuels, such as hard coal and lignite. The expanded analysis shows that the biggest share of energy production is still from fossil fuels.
Hypothesis 1 (H1).
A shortage of arable land is the most important limitation on biomass production on farms.
Based on our research, we positively verified the hypothesis. A shortage of land was chosen by 32.5% of respondents, followed by poor farmland (23.5%). The third most frequently indicated problem was the lack of appropriate equipment (17.8%) and increasingly difficult weather conditions (12%). These results indicate that farms can strongly contribute to the delivery of biomass, including straw and wood. However, the need to use straw in animal production, specifically on fields, and plowing it means that may be chosen by farmers because of the low incomes from straw sale.
The study results provide valuable information on the role of biomass in the renewable energy sector in Poland. They provide a comprehensive overview of the current state of biomass production, its competitiveness and its potential role in the future. The results indicate significant opportunities to increase the adoption of biomass and other renewable energy sources in the agricultural sector, but also highlight challenges that need to be overcome.
Based on the data presented, we can draw the following conclusions:
There is interest among farmers in biomass as an energy source and investment plans in renewable energy sources, in particular photovoltaics (57.8%) and biomass (17.6%). Moreover, the most profitable renewable energy sources were photovoltaics (38.4%), wind energy (23%) and biogas (16.2%).
Opinions on the competitiveness of biomass compared to other renewable energy sources are divided. Farmers were asked about the most ecological renewable energy sources. According to the respondents, the most ecologically friendly renewable energy sources were wind energy (32.2%), photovoltaics (25.3%) and water energy plants (20.7%).
Price as a market variable, also impacts the development of biomass in the market. According to the respondents, the most important factors shaping increasing biomass prices were the availability of raw materials on the market (41.1%) and calorific value (17.6%).
Respondents pointed to various limitations and barriers to biomass production. According to the vast majority of respondents, the most frequently indicated problems and limitations to biomass production was the long payback period (19.2%) and high investment costs (18.9%). The most important threats to biomass production were a shortage of arable land (32.5%) and poor farmland (23.5%).
The need to develop a communication strategy addressed to farmers to increase their awareness of the benefits of biomass production and the use of renewable energy sources is emphasized. This should include education about the technological and financial support available to farmers and technical advice.
Biomass can be valuable a renewable energy source on farms in heat production. However, the most important disadvantages of solid biomass production are logistical problems, problems with winters and straw, which can easily be used on farms for animal production as fodder and as organic fertilizer [77].
An essential component of agricultural policy should be to encourage the local production of biomass with agricultural origins to stimulate economic development in rural areas, diversifying and thereby opening up new markets for agricultural raw materials, increasing its sale, logistical operations and combustion [78].
Renewable energy sources may increase energy security by lowering fossil fuel exports and generating new jobs for small- and medium-sized businesses and farmers. The creation of biofuels makes it possible to develop heavily polluted agricultural land that can be used to grow energy plants but is no longer appropriate for eating [79].
Plant biomass can effectively be used by performing the methane fermentation process in agricultural biogas facilities. A biogas plant is a facility made up of a series of buildings and equipment that form a well-planned technical chain. Biomass ferments within the plant, turning organic raw materials into biogas [80].
This study has generated numerous recommendations for policy makers. Most of farmers selling biomass, including straw and wood, pointed out in most cases that they want to invest in photovoltaics. This results show that policymakers should adjust laws to encourage farmers to make this investment. Photovoltaics, which is considered a very clean source of renewable energy, has a big task in cleaning rural areas.
Only a mix of renewable energy sources can be considered, together, as an alternative to fossil fuels. Photovoltaics, which provide energy during the day, should be supplemented with energy from biomass at night, because most households do not have energy accumulators. Financial support for installing energy accumulators on households should be expanded. Another option is to supplement energy from photovoltaics with energy from wind turbines. These devices usually provide more energy in winter and at night, so they can be a good supplement to energy from photovoltaics, which is characterized by high variability.
Another option to improve the competitive position of RESs is nuclear power. Poland currently has no nuclear power plants, but intends to build them. Renewable energy sources, which are not stable due to changing weather conditions, should be supplemented by nuclear power.
Author Contributions
Conceptualization, R.W., P.B. and A.B.-B.; methodology, R.W., P.B. and A.B.-B.; software, R.W. and P.B.; validation, R.W. and P.B.; formal analysis, R.W. and P.B.; investigation, R.W. and P.B.; resources, R.W., A.B.-B. and P.B.; data curation, R.W., A.B.-B. and P.B.; writing—original draft preparation, R.W., A.B.-B. and P.B.; writing—review and editing, R.W., A.B.-B. and P.B.; visualization, R.W., A.B.-B. and P.B.; supervision, R.W., A.B.-B. and P.B.; project administration, A.B.-B. and P.B.; funding acquisition, A.B.-B. and P.B. All authors have read and agreed to the published version of the manuscript.
Funding
The results presented in this paper were obtained as part of a comprehensive study funded by the Ministry of Science under the Regional Initiative of Excellence Program, and were conducted at the University of Warmia and Mazury in Olsztyn, Faculty of Agriculture and Forestry, Department of Agrotechnology and Agribusiness (grant no. 30.610.012-110).
Data Availability Statement
Data are contained within the article.
Conflicts of Interest
The authors declare no conflicts of interest.
Abbreviations
| CO2 | Carbon dioxide |
| EU | European Union |
| GWh | Gigawatt hour |
| KWe | Kilowatt energy |
| MWh | Megawatt hour |
| PLN | Polish zloty |
| PSH | Pumped storage hydropower |
| RES | Renewable energy sources |
| RPS | Renewable portfolio standards |
| TWh | Terawatt hour |
References
- Gorynia, M. The Competitiveness of Polish Firms and the European Union. Available online: https://mariangorynia.pl/wp-content/uploads/Gorynia_The_competitiveness_of_Polish_firms_and_the_European_Union_Enlargement_PUR_2001_1.pdf (accessed on 7 February 2025).
- Hutchins, H.M. An Economic Analysis of the Competitive Position of the Northwest Fhozen Pea Industry. Ph.D. Thesis, Oregon State University, Corvallis, OR, USA, 1962; 155p. [Google Scholar]
- Taggart, J.; Taggart, J. International Competitiveness and the Single Currency. Bus. Strategy Rev. 1999, 10, 25–36. [Google Scholar] [CrossRef]
- Day, G.S. Maintaining the competitive edge: Creating and sustaining advantages in dynamic competitive environments. In Wharton on Dynamic Competitive Strategy; Day, G.S., Reibstein, D.J., Gunther, R.E., Eds.; John Wiley & Sons: Hoboken, NJ, USA, 1997; pp. 48–75. [Google Scholar]
- Bergsteiner, H.; Avery, G.C. When ethics are compromised by ideology: The global competitiveness report. J. Bus. Ethics 2012, 109, 391–410. [Google Scholar] [CrossRef]
- Pearce, R. The Implications for Host-Country and Home-Country Competitiveness of the Internationalisation of R&D and Innovation in Multinationals. In Global Competition and Technology: Essays in the Creation and Application of Knowledge by Multinationals; Palgrave Macmillan: London, UK, 1997. [Google Scholar]
- Gleißner, W.; Helm, R.; Kreiter, S. Measurement of competitive advantages and market attractiveness for strategic controlling. J. Manag. Control 2013, 24, 53–75. [Google Scholar] [CrossRef]
- Panchenko, O.; Balaziuk, O.; Portovars, T.; Andrieieva, V.; Kotkovskyy, V. Analysis of financial statements as a business management tool. AD ALTA J. Interdiscip. Res. 2024, 14, 157–161. [Google Scholar] [CrossRef]
- Ambroziak, Ł. The competitive positions of Poland and of the countries of the western Balkans in agri-food trade with the European Union. Agrofor 2016, 1, 60–68. [Google Scholar] [CrossRef]
- Pawlak, K.; Poczta, W. Competitiveness of Polish agriculture in the context of globalization and economic integration—Competitive potential and position. Probl. Agric. Econ. 2020, 4, 86–107. [Google Scholar]
- Ruaab, O.L.; Santosc, C. Linking brand and competitive advantage: The mediating effect of positioning and market orientation. Eur. Res. Manag. Res. Econ. 2022, 28, 100194. [Google Scholar] [CrossRef]
- Kusa, R. The Mediating Role of Competitive and Collaborative Orientations in Boosting Entrepreneurial Orientation’s Impact on Firm Performance. Entrep. Bus. Econ. Rev. 2023, 11, 25–42. [Google Scholar] [CrossRef]
- Gorynia, M. Competition and globalisation in economic sciences. Selected aspects. Econ. Bus. Rev. 2019, 5, 118–133. [Google Scholar] [CrossRef]
- Główny Urząd Statystyczny (GUS). Energia ze Źródeł Odnawialnych 2007–2022; Główny Urząd Statystyczny (GUS): Warsaw, Poland, 2023. [Google Scholar]
- Kuik, O.; Branger, F.; Quirion, P. Competitive advantage in the renewable energy industry: Evidence from a gravity model. Renew. Energy 2019, 131, 472–478. [Google Scholar] [CrossRef]
- Jankowska, B.; Staliński, B.; Trąpczyński, P. Public policy support and the competitiveness of the renewable energy sector—The case of Poland. Renew. Sustain. Energy Rev. 2021, 149, 111235. [Google Scholar] [CrossRef]
- Leibowicz, B.D. Growth and competition in renewable energy industries: Insights from an integrated assessment model with strategic firms. Energy Econ. 2015, 52, 13–25. [Google Scholar] [CrossRef]
- Stolarski, M.; Warmiński, M.; Krzyżaniak, M.; Olba-Zięty, E.; Akincza, M. Bioenergy technologies and biomass potential vary in Northern European countries. Renew. Sustain. Energy Rev. 2020, 133, 110238. [Google Scholar] [CrossRef]
- Szempliński, W.; Dubis, B.; Lachutta, K.M.; Jankowski, K.J. Energy Optimization in Different Production Technologies of Winter Triticale Grain. Energies 2021, 14, 1003. [Google Scholar] [CrossRef]
- Stolarski, M.; Niksa, D.; Krzyżaniak, M.; Tworkowski, J.; Szczukowski, S. Willow productivity from small- and large-scale experimental plantations in Poland from 2000 to 2017. Renew. Sustain. Energy Rev. 2019, 101, 461–475. [Google Scholar] [CrossRef]
- Lamers, P.; Marchal, D.; Heinimo, J.; Steierer, F. Woody biomass trade for energy. In International Bioenergy Trade: History, Status & Outlook on Securing Sustainable Bioenergy Supply, Demand and Markets; Junginger, M., Goh, C.S., Faaij, A., Eds.; Springer: Berlin/Heidelberg, Germany, 2013; pp. 41–64. [Google Scholar]
- Lamers, P.; Hoefnagels, R.; Junginger, M.; Hamelinck, C.; Faaij, A. Global solid biomass trade for energy by 2020: An assessment of potential import streams and supply costs to North-West Europe under different sustainability constraints. GCB Bioenergy 2015, 7, 618–634. [Google Scholar]
- Proskurina, S. International Trade in Biomass for Energy Production: The Local and Global Contex. Acta Universitatis Lappeenrantaensis 2018. Available online: https://lutpub.lut.fi/bitstream/handle/10024/158444/Svetlana%20Proskurina%20A4_ei_artik.pdf?sequence=1&isAllowed=y (accessed on 19 July 2024).
- Fagerberg, J.; Knell, M.; Srholec, M. The Competitiveness of Nations: Economic Growth in the ECE Region. UNECE Spring Sem inar, Competitivenessand Economic Growth in the ECE Region, Geneva. 23 February 2004. Available online: https://www.researchgate.net/publication/24134941_The_Competitiveness_of_Nations_Economic_Growth_in_the_ECE_Region (accessed on 10 February 2025).
- Binda, J.; Surówka, M.; Ambroży, T.; Kędra, A.; Małodobry, Z. Strategic management and the economic efficiency of the enterprise. Sci. J. Bielsk. Biala Sch. Financ. Law 2023, 27, 24–28. [Google Scholar] [CrossRef]
- Rockart, J.F. Chief Executives Define Their Own Information Needs. Harv. Bus. Rev. 1979, 57, 81–93. [Google Scholar]
- Tyszkiewicz, R.; Pawlak-Wolanin, A.; Markiewicz-Patkowska, J.; Jandova, S.; Oleśniewicz, P.; Jáčová, H.; Tyszkiewicz, M. Innovative Supplier Partnership Assessment Model in a Polish Trading Enterprise. Ekon. Manag. 2019, 22, 67–82. [Google Scholar] [CrossRef]
- Niezgoda, A.; Kowalska, K. Sharing Economy and Lifestyle Changes, as Exemplified by the Tourism Market. Sustainability 2020, 12, 5351. [Google Scholar] [CrossRef]
- Nowak, A. Competitiveness of Dairy Farms in European Union Countries in the Light of FADN Data. Ann. Univ. Mariae Curie-Skłodowska Sect. H–Oeconomia 2018, 52, 49–58. [Google Scholar] [CrossRef]
- Nowak, A. Regional Differences in the Competitiveness of Farms in Poland. J. Agribus. Rural. Dev. 2016, 41, 345–354. [Google Scholar] [CrossRef]
- Ziętara, W.; Sobierajewska, J. Competitiveness of the Polish fruit farms. Probl. Agric. Econ. 2017, 1, 101–116. [Google Scholar] [CrossRef]
- Juchniewicz, M.; Łukiewska, K. International Competitiveness of the Food Industry in European Union Member States. Eur. J. Soc. Sci. Educ. Res. 2014, 2, 254. [Google Scholar] [CrossRef][Green Version]
- Dolata, M.; Hadryjańska, B.; Wysokińska-Senkus, A.; Wolniak, R. The endogenous factors shaping competitiveness of banking industry enterprises in Poland. Enterp. Future 2024, 2, 42–74. [Google Scholar]
- Stawasz, E. Factors that Shape the Competitiveness of Small Innovative Companies Operating in International Markets with a Particular Focus on Business Advice. J. Entrep. Manag. Innov. 2019, 15, 61–78. [Google Scholar] [CrossRef]
- Romanowska, M. Strategie Dimension of Innovation. J. Manag. Financ. Sci. 2019, 29, 27–45. [Google Scholar] [CrossRef]
- Kagan, A. Assessment of competitiveness of commodity farms. Ann. Pol. Assoc. Agric. Agribus. Econ. 2018, 20, 67–72. [Google Scholar] [CrossRef]
- Porter, M.E. Competitive Advantage; The Free Press: New York, NY, USA, 1985; Chapter 1; pp. 11–15. [Google Scholar]
- Garbarski, L. Fair Trade in CSR Strategy of Global Retailers. Management and Business Administration. Cent. Eur. 2015, 23, 105–109. [Google Scholar] [CrossRef]
- Genge, E. An analysis of competitiveness of the EU countries using the dependent mixture model. Argum. Oeconomica 2017, 39, 111–128. [Google Scholar] [CrossRef]
- Traill, W.B.; Pitts, E. (Eds.) Competitiveness in the Food Industry; Blackie Academic & Professional: London, UK, 1998. [Google Scholar]
- Ma, H. Competitive advantage and firm performance. Compet. Rev. 2000, 10, 15–32. [Google Scholar] [CrossRef]
- Borch, O.J. Business strategy in transitional industries—Entrepreneurial response to the globalization of a fragmented industry. In Research in Global Strategic Management; International Entrepreneurship: Globalization of Emerging Businesses; Emerald Publishing Limited: Bingley, UK, 1999; Volume 7, pp. 101–130. [Google Scholar]
- Viaene, J.; Gellynck, X. Small firms, old traditions equals low profit: Pigmeat processing in Belgium. In Competitiveness in the Food Industry; Traill, W.B., Pitts, E., Eds.; Blackie Academic & Professional: London, UK, 1998. [Google Scholar]
- Kapitonov, I.A.; Zhukovskaya, I.V.; Khusaenov, R.R.; Monakhov, V.A. Competitiveness and Competitive Advantages of Enterprises in the Energy Sector. Int. J. Energy Econ. Policy 2018, 8, 300–305. [Google Scholar]
- Shuai, J.; Zhao, Y.; Wang, Y.; Cheng, J. Renewable energy product competitiveness: Evidence from the United States, China and India. Energy 2022, 249, 123614. [Google Scholar] [CrossRef]
- Share of Energy Consumption from Renewable Energy Sources in Europe. European Environment Agency. Available online: https://www.eea.europa.eu/en/analysis/indicators/share-of-energy-consumption-from (accessed on 15 March 2025).
- Are Renewable Energies Competitive? Available online: https://www.energyscope.ch/en/questions/are-renewable-energies-competitive (accessed on 15 March 2025).
- Renewable Energy Market Size, Share, and Trends 2025 to 2034. Available online: https://www.precedenceresearch.com/renewable-energy-market (accessed on 15 March 2025).
- Timilsina, G.R. Are renewable energy technologies cost competitive for electricity generation? Renew. Energy 2021, 180, 658–672. [Google Scholar] [CrossRef]
- Talar, S. The European Union’s Competitive Position in Relation to the Asian Region. In Research Papers of Wrocław University of Economics No. 126 Asia-Europe. Partnership or Rivalry? University of Economics in Katowice: Katowice, Poland, 2010; p. 81. [Google Scholar]
- Vambol, V.; Kowalczyk-Juśko, A.; Banaś, A. Dynamics of RES development in Poland and support mechanisms for this sector. In Proceedings of the 2nd International PhD Student’s Conference at the University of Life Sciences in Lublin, Poland: Environment—Plant—Animal—Product, Lubin, Poland, 19–20 April 2023. [Google Scholar] [CrossRef]
- Matyka, M.; Feledyn-Szewczyk, B.; Staniak, M. Diversity of weed flora, selected biometric characteristics and yielding of Miscanthus spp. cultivated on light and heavy soil. Acta Agrobot. 2016, 67, 1. [Google Scholar]
- Rana, A.; Gróf, G. Assessment of prosumer-based energy system for rural areas by using TRNSYS software. Clean. Energy Syst. 2024, 8, 100110. [Google Scholar] [CrossRef]
- Chorób, R. Linkage of agricultural farms with the environment in podkarpackie voivodeship from the perspective on the distribution of agricultural products. Ann. PAAAE 2018, XX, 22–27. [Google Scholar] [CrossRef]
- Kuźniarski, Ł. jak będzie wyglądał europejski sektor energetyczny w 2050 roku? Raport Komisji Europejskiej. PTJ 2014, Z.1, 57. [Google Scholar]
- Jarosz-Angowska, A.; Nowak, A.; Krukowski, A. The Competitive Position of Poland in Bio-Based Products Trade on the European Union Market. Ann. Univ. Mariae Curie-Skłodowska Sect. H—Oeconomia 2022, 56, 41–57. [Google Scholar] [CrossRef]
- Polski Instytut Ekonomiczny (PIE). Rozwój i Potencjał Energetyki Odnawialnej w Polsce [Development and Potential of Renewable energy in Poland]; Polski Instytut Ekonomiczny: Warsaw, Poland, 2020. [Google Scholar]
- SEJM. Ustawa z Dnia 8 Stycznia 2010 r.—Prawo Energetyczne; Dziennik Ustaw Rzeczypospolitej Polskiej (Dz.U.): Warszawa, Poland, 2010; p. 104. [Google Scholar]
- Zbroński, D.; Otwinowski, H.; Górecka-Zbrońska, A.; Urbaniak, D.; Wyleciał, T. Analysis of Changes in Electricity Generation from Renewable Energy Sources after Poland’s Accession to Structures of the European Union. Energies 2023, 16, 4794. [Google Scholar] [CrossRef]
- Główny Urząd Statystyczny (GUS). Gospodarka Paliwowo-Energetyczna w Latach 2019 i 2020; Główny Urząd Statystyczny (GUS): Warszawa, Poland, 2021; p. 29. [Google Scholar]
- Agencja Rynku Energii, S.A. Statystyka Elektroenergetyki Polskiej; Agencja Rynku Energii S.A.: Warszawa, Poland, 2014. [Google Scholar]
- Tokarski, S.; Tajduś, A. Challenges Facing the Polish Energy Sector in 2024 and Upcoming Years. Arch. Min. Sci. 2024, 69, 127–139. [Google Scholar] [CrossRef]
- Rabaçal, M.; Fernandes, U.; Costa, M. Combustion and emission characteristics of a domestic boiler fired with pellets of pine, industrial wood wastes and peach stones. Renew. Energy 2013, 51, 220–226. [Google Scholar] [CrossRef]
- Baxter, L. Biomass-coal co-combustion: Opportunity for affordable renewable Energy. Fuel 2005, 84, 1295–1302. [Google Scholar] [CrossRef]
- Ministerstwo Klimatu i Środowiska; Agencja Rynku Energii, S.A. Informacja Statystyczna o Energii Elektrycznej Biuletyn Miesięczny; Ministerstwo Klimatu i Środowiska, Agencja Rynku Energii S.A. (ARE): Warszawa, Poland, 2022; ISSN 1232-5457. [Google Scholar]
- Główny Urząd Statystyczny. Energia Ze Źródeł Odnawialnych 2021; Główny Urząd Statystyczny: Warsaw, Poland, 2022. [Google Scholar]
- Narodowe Centrum Badań Jądrowych. Analiza i Ocena Kosztów Energii Elektrycznej z Różnych Źródeł Energii w Polsce; Narodowe Centrum Badań Jądrowych: Otwock-Świerk, Poland, 2015. [Google Scholar]
- Mbah, L.T.; Molua, E.L.; Bomdzele, E., Jr.; Egwu, B.M.J. Farmers’ response to maize production risks in Cameroon: An application of the criticality risk matrix model. Helion 2023, 9, e15124. [Google Scholar] [CrossRef]
- Hanusz, Z.; Tarasińska, J.; Zieliński, W. Shapiro-Wilk test with known mean. REVISTA—Stat. J. 2016, 14, 89–100. [Google Scholar]
- Terán-García, E.; Pérez-Fernánde, R. A robust alternative to the Lilliefors test of normality. J. Stat. Comput. Simul. 2024, 94, 1494–1512. [Google Scholar] [CrossRef]
- Jarque-Bera Test: Guide to Testing Normality with Statistical Accuracy. Available online: https://dataaspirant.com/jarque-bera-test (accessed on 16 March 2025).
- Janiszewska, D.; Ossowska, L. Spatial Differentiation of Agricultural Biomass Potential in Polish Voivodeships. Energies 2023, 16, 6828. [Google Scholar] [CrossRef]
- Wyszomierski, R.; Bórawski, P.; Holden, L.; Bełdycka-Bórawska, A.; Rokicki, T.; Parzonko, A. The Trade of Woody Biomass in the Context of Environmental Economics in Poland. Energies 2024, 17, 4822. [Google Scholar] [CrossRef]
- Bórawski, P.; BełdyckaBórawska, A.; Kapsdorferová, Z.; Rokicki, T.; Parzonko, A.; Holden, L. Perspectives of Electricity Production from Biogas in the European Union. Energies 2024, 17, 1169. [Google Scholar] [CrossRef]
- Parmar, K. Biomass-An Overview on Composition Characteristics and Properties. IRA Int. J. Appl. Sci. 2017, 7, 42–51. [Google Scholar] [CrossRef]
- Bórawski, P.; Bełdycka-Bórawska, A.; Holden, L.; Rokicki, T. The Role of Renewable Energy Sources in Electricity Production in Poland and the Background of Energy Policy of the European Union at the Beginning of the COVID-19 Crisis. Energies 2022, 15, 8771. [Google Scholar] [CrossRef]
- Wyszomierski, R.; Bórawski, P.; Holden, L.; Bełdycka-Bórawska, A.; Rokicki, T.; Parzonko, A. Competitive Potential of Stable Biomass in Poland Compared to the European Union in the Aspect of Sustainability. Resources 2025, 14, 19. [Google Scholar] [CrossRef]
- Gotowska, M.; Jakubczak, A. Comparative assessment of renewable energy sources in Poland and other countries of the EU. Rocz. Nauk. Rocz. Nauk. Stowarzyszenia Ekon. Rol. I Agrobiznesu 2011, 13, 126–130. [Google Scholar]
- Tytko, R. Renewable Energy Sourcesy; Annales Universitatis Paedagogicae Cracoviensis Studia Technica VIII: Warsaw, Poland, 2011. [Google Scholar]
- Kościk, B.; Kowalczyk-Jusko, A.; Borecka, R.; Kielmas, K. Use of Renewable Energy Sources in Low-Emission Economy Plans of Selected Municipalities of the Lubelskie Province. Econ. Reg. Stud. 2019, 12, 33–44. [Google Scholar] [CrossRef]
Disclaimer/Publisher’s Note: The statements, opinions and data contained in all publications are solely those of the individual author(s) and contributor(s) and not of MDPI and/or the editor(s). MDPI and/or the editor(s) disclaim responsibility for any injury to people or property resulting from any ideas, methods, instructions or products referred to in the content. |
© 2025 by the authors. Licensee MDPI, Basel, Switzerland. This article is an open access article distributed under the terms and conditions of the Creative Commons Attribution (CC BY) license (https://creativecommons.org/licenses/by/4.0/).