Abstract
This paper presents an original method for modelling the energy intensity of an overhead crane using MATLAB–Simulink and MSC Adams software. The analysis focused on an overhead crane used in warehouses handling bundled goods, which are placed on pallets. The study examined the energy intensity of the crane in two reference, predefined work cycles: goods reception and order picking. During the development phase, data from logistics centres and the FLEXSIM system were used to define the test cycles. The author’s experience in implementing and developing standards was also applied. Reference measurements of the crane, necessary for validating the computer model, were carried out in real operating conditions at a logistics centre. The integration of the author’s proprietary approach—combining computer-based energy intensity modelling with test cycles for the crane—helped overcome barriers in supporting the concept of “green warehouses” (passive or energy-positive), making it possible to estimate and compare the energy intensity of intralogistics facilities. A high level of agreement was achieved between the measured and modelled data using the author’s proprietary EPI. The described methodology was verified using a double-girder overhead crane handling bundled load units in a warehouse. The test results determined the potential for energy recovery within the crane’s drive system.
Keywords:
overhead crane; energy consumption; energy recovery; modelling; test cycle; intralogistics 1. Introduction
The energy intensity of material handling systems is gaining importance due to rising energy costs [1,2], decarbonisation policies [3,4], and the need to improve the efficiency of intralogistics facilities [5,6,7].
While standardised test procedures for determining the energy intensity of industrial trucks are already in place [8] and such data are also published in operational specifications [9], there are no comparable methods for warehouse cranes (overhead cranes) used for handling large-sized loads. These loads typically include metal sheets (flat or coiled), steel profiles, or cartons. In such cases, there are no established methods for assessing energy intensity that would allow warehouses to determine whether they achieve passive or energy-positive performance levels. The operational and service parameters of cranes are analysed in terms of their classification and technical supervision requirements [10,11]. However, these regulations do not take energy intensity into account and therefore do not support the achievement of the aforementioned energy-performance levels in warehouse operations [3].
The aim of this study is to formulate repeatable and representative test cycles for warehouse cranes and to apply the proposed proprietary test cycles in practice—for a selected crane—in order to determine the potential of the developed methodology for technical and energy-intensity comparisons in material handling scenarios evolving towards passive and energy-positive warehouses. In the results analysis section, the application of the EPI (Energy Performance Index) is introduced and discussed. The EPI is used at transfer points (TPs)—locations where loads are handed over between material handling devices, or between a crane and pallet storage positions. The proposed proprietary EPI, which complements the test cycles, has not previously been applied to the assessment of crane energy intensity.
The study includes the development of an energy-intensity model of a warehouse crane within the MATLAB–Simulink (R2020a) and MSC Adams (http://www.mscsoftware.com/page/adams-student-edition (Online; 27 May 2025) environments, for two work cycles: (1) load reception into the warehouse and (2) order picking. The results of the computer simulations were compared with measurement data and field observations conducted on cranes operating in logistics centres located in Poland, Croatia, and Lithuania, which form parts of different supply chains.
The design of the test cycles was based on data obtained from the Warehouse Management System (WMS) and the FlexSim simulation environment. This approach made it possible to analyse real operational scenarios, the nature of the handled loads, and the organisation of internal warehouse processes occurring within the broader Supply Chain Management (SCM) system. The final part of the study presents a method for applying the EPI to evaluate energy intensity at TPs.
The research conducted in this study, addressing the identified research gap, provides new insights or expands existing knowledge in the following areas:
- −
- The energy-intensity model of an overhead crane with defined technical parameters under representative work cycles;
- −
- The potential for energy recovery, depending on the load mass, transport route and height, operational speed, and the technologies applied for energy recovery;
- −
- The identification of drive mechanisms (trolley travel, hoisting), which have the greatest impact on the crane’s energy intensity;
- −
- The definition of a proprietary, standardised test cycle for an overhead crane;
- −
- The analysis of TPs using the EPI.
The analysis of energy intensity in material handling systems at the micro scale—formulated for a single warehouse—has significant implications for the entire supply chain (SCM) at the macro scale.
The article consists of five sections. Section 1 presents the state of the art, the proposed method of modelling the energy intensity of an overhead crane, the results of experimental investigations conducted at a logistics centre, and the concept and application of the EPI. The paper concludes with findings, limitations of the proposed model, and references.
2. Literature Review and Identification of the Research Gap
The body of scientific literature concerning the energy intensity of cranes is extensive and covers various types and configurations of cranes. A distinct specialisation can be observed among publications, depending on aspects such as crane design, implementation, operation, and optimisation [12]. Although the subject of crane energy intensity has been thoroughly explored, most research has focused on port cranes used for container handling [12,13,14]. Studies addressing standardised test cycles of cranes with respect to their energy intensity have not been reported. This article focuses exclusively on cranes used in material handling systems—in warehouses, logistics centres, and production facilities. In particular, it concerns overhead cranes, gantry cranes (rail-mounted and mobile), and suspension cranes. Based on expert studies conducted in logistics centres, it can be stated that crane manufacturers generally offer serially produced models. Custom-designed cranes (“tailor-made” solutions) are rare and limited to specific industrial applications requiring specialised configurations.
Overhead cranes used in intralogistics belong to the group of material handling equipment, whose task is to move loads along three axes: gantry travel (X), trolley travel (Y), and load lifting/lowering (Z). A typical design comprises two runways (positioned either at the top of the warehouse or on the floor), a gantry, a trolley with a lifting mechanism, and—depending on the application—a gripper or hook (Figure 1). In practice, AC electric drives are used, increasingly with the option of energy recovery [15].
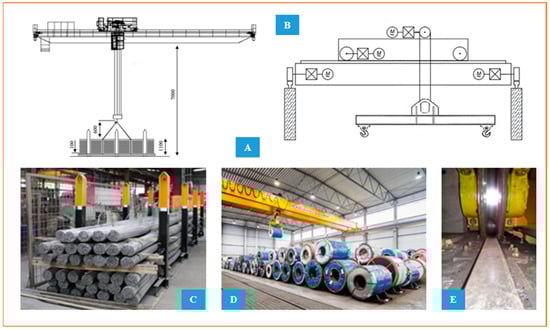
Figure 1.
Overhead crane and examples of its applications: (A)—structural diagram; (B)—simplified kinematic model; (C)—manipulation of steel bars; (D)—transport of rolled steel sheets; (E)—element of the travel system (wheel on rail). Photographs were taken during field observations with the consent of the technical operator.
Within intralogistics systems, cranes handle heavy and large-size bundled loads, such as sheet metal, rods, steel coils, and large cartons on reels. Unlike forklifts, they do not move freely throughout the warehouse but operate within designated zones—above floor storage areas and in logically defined transfer areas in the WMS, including the floor-to-truck loading transfer [16].
The energy intensity of overhead cranes depends on factors such as the type and configuration of drives, cycle frequency, load mass and form, motion dynamics, applied energy recovery systems, and local conditions (e.g., WMS strategies, power supply methods). Despite their significant contribution to energy consumption in heavy industry, cranes are not covered by a uniform standard for assessing energy intensity. There is also a lack of agreed unit indicators (e.g., energy per tonne of transported load) that would enable objective comparisons of solutions from different manufacturers [17].
Standards such as [10,11] define operational classes (A1–A8, M1–M8), which are useful for selecting mechanical components. However, these classes do not directly reflect actual energy consumption or the potential for energy recovery, limiting their analytical usefulness [18].
In the initial phase of material handling design within a logistics centre organised as part of SCM, the literature seeks tools that allow determining to what extent a specific crane selected for implementation will meet the assumed optimisation criteria under defined operating modes. This represents one challenge. Another is the concept of a “green warehouse”, which motivates warehouses to implement cranes—whether in the planning of new facilities or during revitalisation projects—that contribute to reducing energy intensity and CO2 emissions and enable the warehouse to achieve passive or energy-positive performance levels [19]. Consequently, knowledge of a crane’s energy intensity is extremely valuable, especially during preliminary design and optimisation phases. This addresses a previously existing barrier: energy intensity was traditionally known only post factum, after crane commissioning, when the crane’s adjustable operating ranges had essentially been exhausted. The energy demand associated with material handling simply existed, and with the extremely high costs of cranes, there was no practical possibility of reducing it at that stage. Individual crane units are characterised by specific parameters recorded in the manufacturer’s documentation. Key data include rated lifting capacity, lifting height, hoisting and lowering speeds, trolley travel speed with hoist, and crane span (the distance between the bridge girders, measured from the rail centrelines). In warehouse environments, a crane constitutes an integral part of the material handling system and, consequently, like the rest of material handling, is operated under the supervision of the Warehouse Management System (WMS). The WMS additionally integrates and supports the management of logistical processes, such as the selection of storage and retrieval locations for load units, task sequencing Last In, First Out (LIFO), First In, First Out (FIFO), and the optimisation of operational cycles. Effective Sapply Chain Management (SCM) requires the analysis of Life Cycle Assessment (LCA), CO2 reduction, and evaluation of energy intensity. Therefore, knowledge of the energy intensity of SCM components is particularly important, as discussed in detail in [13].
Assessment of the energy intensity of material handling equipment is guided by various standards, including EU, industry-specific, and ISO standards, with [8] being particularly well-known. Ongoing technological progress necessitates regular updates of these standards [20]. The ISO standard [21] (implemented, inter alia, in [22]) can also be applied in this context, although practical experience indicates challenges with result interpretation and defining the boundaries of the subsystem under evaluation [23]. Theoretical calculation of a crane’s energy intensity can be performed based on a complete energy balance. In practice, however, manufacturers often provide data only in the form of general parameters, which are insufficient for LCA analyses [24]. Common approaches include methods based on rated data, computational models, and actual measurements. The use of advanced virtual modelling systems requires extensive databases (e.g., material properties), expert knowledge in virtual modelling, and software licences. Technical departments of logistics centres and warehouses often struggle with such requirements, exacerbating the deficit in knowledge of material handling energy intensity in logistics centres. Therefore, the choice of an appropriate method for assessing energy intensity depends on the available data, the specific application, and the user’s requirements [25].
Several types of computational models are described in the literature. The empirical model assumes that energy consumption is equal to the product of the rated power of the mechanism and its operating time. This simple approach is frequently used during the design stage but is prone to underestimation. The mechanistic model takes into account the individual crane drives, calculating energy consumption as the sum of the products of the power of each mechanism and its operating time. The load-dependent model divides the work cycle into loaded and unloaded phases, allowing for a more realistic representation of actual operating conditions. Advanced hybrid models, which combine computer simulations with empirical data, are also employed in scientific research. For example, one study demonstrated that up to 40% of the energy used during load lifting can be recovered through energy regeneration during load lowering [26,27]. Crane manufacturers, recognising their customers’ need to assess energy intensity, offer relatively simple and low-accuracy real-time energy monitoring systems. One example (name omitted for marketing reasons) allows for online analysis of tower crane operation and, to a limited extent, enables the assessment of energy intensity [28].
The development of Digital Twin (DT) technology opens new possibilities for modelling the technical and operational state of a crane (position, load, energy consumption, overloads, work cycles). Integration of DT with control and monitoring systems (SCADA, IoT, PLC, current sensors, WMS) allows not only real-time synchronisation, but also scenario simulation, predictive diagnostics, energy intensity evaluation, and LCA analyses [29]. This is why the decision was made to pursue the test cycle approach: it provides a benchmark for calibrating and validating DT models, enables comparative simulations of different crane types without physical testing, and offers a reference point for “what-if” analyses. Although DT can automatically learn work cycles from sensor data, the absence of a reference cycle prevents standardised classification of energy intensity. Therefore, the development of a test cycle concept, incorporating load receiving and order-picking scenarios, is essential for the further validation and optimisation of models.
2.1. Computational Models for the Energy Intensity of Warehouse Cranes
The literature describes various types of models used to estimate the energy consumption of warehouse cranes. The accuracy of these models strongly depends on the level of detail of the input data, the complexity of the system, and the purpose of the analysis [30]. The empirical model assumes that energy consumption is equal to the product of the rated power of the mechanism and its operating time. It is easy to implement and often used during the design stage, but it tends to underestimate actual energy consumption, especially under variable load conditions [31]. The mechanistic model accounts for each drive separately (gantry motion, trolley motion, lifting), calculating energy intensity as the sum of the products of instantaneous power of each mechanism and its operating time. This approach requires more detailed data but provides a more accurate representation of energy use [32]. The load-dependent model divides the crane cycle into phases with and without load, enabling a more realistic estimation of energy consumption depending on the transported mass. This model extension fairly accurately reflects the operational conditions of warehouse cranes, including no-load operation cycles [33]. Hybrid and simulation-based models combine empirical data with computer simulation results. It has been shown that, with appropriate input data, up to 40% of the energy used during the lifting phase can be recovered during load lowering [34]. Such simulations are conducted in CAD and ADAMS environments; however, they are costly, time-consuming, and require specialised expertise. Online measurements and monitoring allow for real-time recording of energy consumption (e.g., using systems such as WINDCRANE or SCADA). When combined with current sensors and integration with WMS and IoT systems, they enable the analysis of operational trends and identification of energy-intensive work cycles [35]. Each of these approaches has advantages and limitations. However, there is no reference tool that allows for objective validation, comparison, and classification of crane energy intensity under validated operational conditions in SCM [14]. Such a role can be fulfilled by a test cycle, the concept of which is presented in Section 3.
A Digital Twin (DT) is an advanced digital model that replicates the real technical and operational state of a crane. It can simulate crane movements along the XYZ axes, the mass of the handled load, energy consumption, overloads, and the condition of individual components. Integration of DT with SCADA, PLC, HMI, and WMSs enables continuous representation and real-time analysis of the crane’s operation [36]. The application of DT in logistics and energy engineering offers wide-ranging possibilities, including energy intensity assessment [37,38], predictive diagnostics and maintenance planning [39], optimisation of motion trajectories and load handling [40], and “what-if” analyses for different operational scenarios [41].
For DT to effectively support benchmarking and comparative functions, it must have access to reliable and repeatable input data. This creates the need to develop a test cycle—a representative operational scenario for a crane in defined modes (e.g., goods receipt and order picking) [42]—which can be used for calibration and validation of digital models [43], classification of energy intensity across different crane designs [44], assessment of deviations from efficient operation (e.g., failures, organisational changes, overloads) [45], and creation of databases for artificial intelligence (AI/ML) systems trained on real-world data [46]. A test cycle is not a prerequisite for DT operation, as DTs can learn automatically from measurement data. However, the absence of such a reference model hinders the comparability of results between systems and manufacturers. Therefore, the next section of this paper presents a proposed test cycle, which can serve as a reference framework for assessing the energy intensity of cranes [45].
2.2. Research Gap and the Need for Standardisation of a Test Cycle
The state-of-the-art analysis revealed a significant gap in the area of unified methods for assessing the energy intensity of warehouse cranes. Data published by manufacturers (Table 1) are incomplete and heterogeneous, making direct comparison difficult. Some manufacturers provide only rated parameters or design simulation results, while others share calculation data or operational monitoring outcomes; however, these are presented without a consistent reference to the crane’s work cycle [45]. Leading global manufacturers have introduced tools referred to as “energy consumption calculators” [47,48,49,50,51,52], which enable approximate comparisons of the energy use of different technical solutions as well as the identification of potential energy savings and emission reductions. Their structure and functional scope position them within the Life Cycle Assessment (LCA) methodology. Table 1 presents a synthetic summary of the above analysis: Possibility of comparing the energy intensity of cranes in a warehouse (Manufacturers have been anonymised for the purpose of this study. Data are based on catalogues and technical documentation) [53,54,55]. The lack of unified data presentation principles, the absence of links to actual operating modes, and the lack of common measurement units make it impossible to conduct reliable comparative analyses. As a result, catalogue data cannot be directly used for LCA analyses, energy intensity estimation, or DT model training [56].

Table 1.
Possibility of comparing the energy intensity of cranes in a warehouse (Manufacturers have been anonymised for the purpose of this study. Data are based on catalogues and technical documentation) [54,55].
In response to these limitations, this study proposes the development of a standardised test cycle for overhead cranes operated in warehouse environments for palletised loads. This cycle serves as a basis for unit energy intensity classification (Wh/t), assessment of energy recovery potential, and benchmarking of computational and digital models (including the EPI) [57]. Following the definition proposed in [20], a local energy intensity indicator for TPs was introduced as a complementary element of the crane test cycle. To ensure methodological consistency, the approach also refers to the [21] standard “Energy management systems—Requirements with guidance for use”, which provides the framework for systematic energy management [21]. In practice, it is applied together with the [22] standard on environmental management, enabling the parallel assessment of both energy intensity and environmental impact [22]. Furthermore, in the field of material handling, reference is made to the VDI 2198 standard, which defines a test cycle for evaluating the energy intensity of industrial trucks [8]. Previous experiences of the authors were also utilised, including the PZM (Pawel Zajac Method) [9], the VDI 2198 procedures, and expert knowledge gained from participation in standardisation work within the Polish Committee for Standardisation (PKN).
In summary, differences in manufacturers’ approaches to estimating energy consumption—including the lack of common measurement units, divergent methodologies, and the absence of a standardised test cycle—currently prevent reliable comparison of the energy intensity of warehouse cranes operating within intralogistics systems. The development of such a test cycle forms the foundation for the subsequent parts of this study. Section 3 presents the proposed modelling and validation methodology as well as the application of the EPI to enable comparative assessment of various technical configurations under quasi-real operating conditions.
3. Test Cycle Model for Warehouse Cranes
Cranes used in intralogistics are designed for handling bundled and large-size loads placed on pallets, such as metal sheets, steel profiles, paper rolls, or cable drums. These operations are carried out between the warehouse floor and truck loading platforms, within designated storage zones marked on the warehouse floor. Unlike industrial trucks, cranes do not move freely across the storage area but operate along strictly defined travel paths and TPs. This operational specificity requires a dedicated approach to defining test cycles—one that accounts for both the geometric constraints of the workspace and the characteristics of the handled load units.
The proposed test cycle model was developed on the basis of multiple complementary data sources to ensure both representativeness and practical reliability. The following inputs were used: (i) information from WMS, including task structures and job sequencing rules (LIFO, FIFO); (ii) on-site observations of crane operations in logistics centers, complemented by interviews with operators and maintenance staff; (iii) video recordings documenting real loading and unloading scenarios; and (iv) energy intensity measurements carried out on reference cranes under operational conditions. This comprehensive data foundation enabled the definition of a test cycle that realistically reflects the actual working conditions of the equipment.
The test cycle was defined for a typical overhead crane equipped with the basic mechanisms: gantry travel, trolley travel, lifting and lowering of the load, and—where required—a gripper or pallet sling system. Special cases, such as synchronised operation of two cranes within the same working area or multi-aisle hall configurations, were deliberately excluded from the analysis as they represent individual scenarios. These simplifications made it possible to focus on the most common operational conditions, while maintaining the comparability of the energy analysis.
In this type of material handling system, frame-type spreaders equipped with rotating, automatically controlled twist-locks—used for gripping containers at their corners—are not employed. To define the boundary conditions more precisely, a systematic classification of load-attachment methods was introduced: manual, semi-automatic, and fully automated (Figure 2). Depending on the solution applied, an additional operator—apart from the crane operator—may be required to attach the palletised bundled load or detach it from the crane hook.
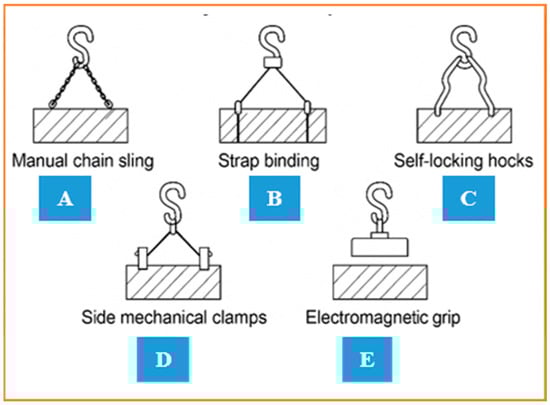
Figure 2.
Typical techniques used for attaching a pallet or bundled load to the crane hook in a warehouse. (A) Manual chain sling; (B) strap binding; (C) Self-locking hocks; (D) Side mechanical clams; (E) Electromagnetic grip. Own elaboration.
In industrial practice, the lack of a standardised interface between the load and the crane hook means that load-securing and release operations are carried out manually by auxiliary personnel. As a result, this leads to longer transport cycle times and greater vulnerability of material handling processes to human error. Standardisation—or at least classification—of attachment interface types can facilitate the definition of test cycles and improve the comparability of results.
To obtain operational data, a set of complementary methods was applied, differing in scope and accuracy. Video recordings enabled a detailed analysis of motion trajectories and the execution times of individual operations. A work sampling method was used to determine the frequency of transport tasks within selected time intervals, forming the basis for estimating cycle repeatability. Data from control systems (SCADA, PLC) provided information on current waveforms and drive operating states, while integration with WMS ensured accurate representation of the process control logic in warehouse operations. The application of data triangulation increased the reliability of results and enabled cross-validation across different measurement methods [58].
For a more comprehensive illustration of the proposed methodology, a set of figures and tables was developed. Figure 1 presents the structural diagram and sample operating scenarios of an overhead crane in a warehouse floor–truck loading configuration. Figure 2 illustrates the process of constructing the test cycle based on WMS data and task sequencing rules (FIFO, LIFO).
Figure 3 compares the results obtained from computer simulations, real-world measurements, and calculations adjusted using the EPI. Table 1 summarises the TPs and storage fields used to define the crane’s motion trajectories. These materials serve a supplementary role, documenting data sources and ensuring transparency of the assumptions adopted in the development of the test cycle.
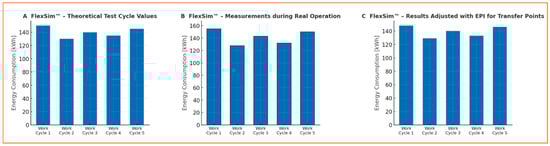
Figure 3.
Comparison of simulated and actual energy consumption values for the reception and order-picking cycle of a crane. The charts illustrate: (A) theoretical energy calculated based on the standard test cycle, (B) energy consumption measured during actual crane operation, and (C) results corrected using the EPI for TPs. The charts were developed in the FlexSim environment.
Figure 4 shows the logical relationship between the WMS, task sequencing methods (e.g., ABC, LIFO, FIFO), and data from the work sampling method, which together were used to develop test scenarios for the crane in FLEXSIM. The WMS provides information not only about movement trajectories and the locations of load units, but also about certain time intervals and operation modes of individual crane movements. The diagram in Figure 3 illustrates the data processing algorithm used to generate a realistic and repeatable test scenario for the crane. The inclusion of “Yes/No” decision points introduces a feedback mechanism enabling iterative refinement of the cycle until a defined and standardised version suitable for energy intensity analysis is achieved. The development process also incorporated insights from technical audits and surveys conducted among crane operators and maintenance engineers in logistics centers, who have practical knowledge of typical operational cycles, load attachment procedures, and non-standard events (e.g., related to the properties of handled loads).
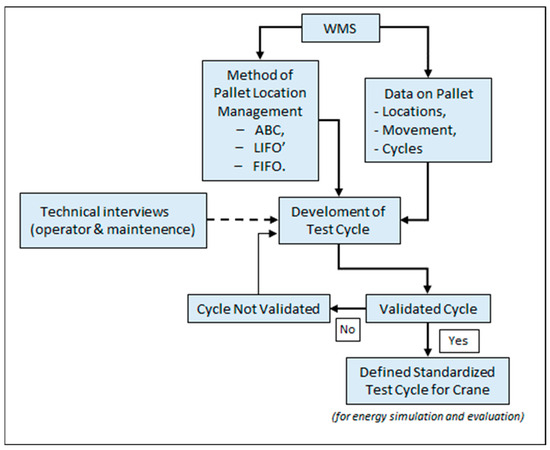
Figure 4.
Development and validation scheme of the crane test cycle based on WMS data and pallet location management rules. The dashed line indicates expert or qualitative input. Own elaboration.
Preliminary versions of the test cycle scenarios were validated using the FlexSim simulation environment. Figure 4 presents a comparison of three variants of crane energy consumption calculated for a standard warehouse cycle. Variant (a) refers to the energy value obtained from the simulation based solely on the test cycle model, excluding local load transfer effects.
Variant (b) illustrates the actual energy consumption measured on the crane during the reception and order-picking cycle. Variant (c), in turn, presents the calculation results in which the test cycle was supplemented with the EPIs related to the energy intensity of TPs in the transfer between the crane and material handling elements (e.g., warehouse floor, truck bed, loading ramp, etc.). The observed agreement between variant (c) and the actual measurements (b) confirms the validity of incorporating the EPI component into simulation-based energy analyses. Including the EPI reduces estimation errors and allows for a more realistic representation of real operating conditions, taking into account such factors as micro-movements, load attachment technique, pallet transfer technology, as well as timing and motion dynamics.
The combination of these data sources and methods enables the development of a consistent and representative test cycle that can be used for direct energy consumption measurements, simulations, and the validation of digital models (e.g., Digital Twins), as well as for assessing the energy intensity of cranes under various operating conditions.
Considering the experience gained in other transport sectors, where test cycles are widely used to assess the energy efficiency and reliability of systems, the need for an analogous solution for overhead cranes should be emphasised. In research on electric vehicles, standardised driving cycles such as WLTC are applied to simulate real-world operating conditions, enabling the evaluation of energy consumption and range under various scenarios [59]. In mechanical engineering, life cycle testing involves repeatedly performing defined operations under controlled conditions, allowing the assessment of the durability and reliability of machine components. For construction and agricultural machinery, the ISO 8178 standard [60] is widely used. It defines a set of test cycles for engines in high-mobility vehicles (e.g., excavators, tractors). For instance, the eight-mode ISO 8178 cycle is commonly applied to evaluate fuel consumption and emissions under different load conditions. Similarly, industrial vehicles are covered by specific standards [61] that define test procedures for forklifts and other material handling vehicles, incorporating diverse operational scenarios [62,63,64].
An analogous approach should be adopted for warehouse cranes, whose operational characteristics require a test cycle based on real-world data and repeatable scenarios. Only such a framework can ensure objective comparability of results, unit energy intensity classification, and the validation of computational and digital models. The following Section 3.1 presents the detailed objectives and assumptions of the proposed test cycle, which serve as a foundation for its practical application.
3.1. Objective and Assumptions of the Test Cycle
In designing the novel, proprietary test cycle for a warehouse crane, the following boundary conditions were established. First, the cycle had to ensure operational representativeness: similarly to standards [60,65], it should reflect typical crane operations, such as loading, transporting, and unloading cargo. Second, different operating modes needed to be considered, so the tests include both unloaded and loaded operations in order to assess energy intensity under various crane working conditions. Third, standardisation of testing procedures was required: the development of detailed testing protocols, as in standards [61,66], ensures the repeatability and comparability of results, analogous to the approach adopted in [67]. Finally, following the methodology of standard [66], suitable energy-intensity indicators had to be defined for cranes, allowing a consistent evaluation of their performance and energy efficiency.
The functional assumptions consider the primary material handling processes in warehouses handling unit loads stored on the warehouse floor. The process structure includes receiving areas (unloading docks), storage zones (racks or floor storage areas), and order-picking and shipping zones (packing areas, transport buffers). The dominant operations are goods receipt and order picking, which impose different loads on the crane drives. Goods receipt is characterised by longer load-handling movements within the storage area of the warehouse, where the geometric layout can be approximated as constant. In contrast, order picking involves a larger number of shorter movements/routes with pallets to various pick-up points, resulting in higher route variability and asymmetric lifting operations. The structure of the spatial test model is based on four test points representing real crane operation scenarios: A—Receiving zone: where cargo is loaded onto the crane; B—Storage zone: a floor storage area or specialised rack (e.g., cantilever rack). The order-picking zone (level 0) and storage zone are located at floor level, with defined storage areas—logical zones managed within the WMS. Goods receipt and dispatch operations are executed from and within the floor-level area of the transport unit, such as the floor of a truck or rail wagon. In warehouse logistics, storage zones referred to as “buffers” (entry/exit) are typically designated, serving as areas where the unit load is staged for dispatch. Physically, this function can be fulfilled by areas near the warehouse loading dock.
3.2. Characteristic Points and Crane Movement Trajectories
The layout of pallet locations in the warehouse, handled by the warehouse crane, includes both goods-receipt and order-picking zones. This corresponds to the crane’s test cycles: (1) goods receipt/goods issue; (2) order picking (Figure 5). TP1 corresponds to the transfer point between the crane and the truck, while TP2 corresponds to the transfer point between the crane and the storage area. The aim was not to replicate every possible warehouse configuration, but to create a standardised comparative model that preserves the key operational characteristics.
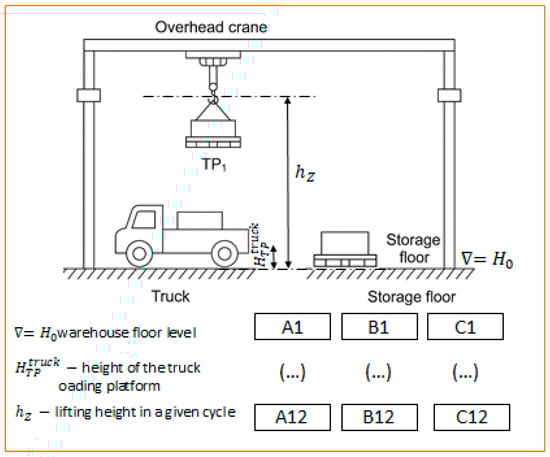
Figure 5.
Side view of the warehouse with an overhead crane. Visible characteristic points: TP1—transfer to/from the truck load bay (elevated level), TP2—transfer to the storage area located on the warehouse floor. Test cycle storage field codes: A1, …A12; B1, …B12; C1, …C12. Own elaboration.
From the perspective of energy intensity modelling and the test cycle, the height difference between TP1 and TP2 generates varied loads on the crane (particularly affecting work and time). Incorporating this variability into the model and the test cycle allows for a realistic representation of the process’s energy intensity.
Table 2 presents the results of the analysis of the storage area layout in the warehouse for two operating modes: goods receipt and order picking. Both receipt and picking take place within the same designated section of the warehouse, as defined in the WMS. For the purposes of the test cycle, the storage area is divided according to rotation in the WMS (or based on other data, e.g., invoices from a given period) into sections A, B, and C, corresponding to the frequency of retrievals (pallet queueing strategy LIFO or FIFO, as per the WMS). Within each group A, B, and C, the test cycle designates 12 storage locations for individual palletised loads. The transport path runs between the rows of storage locations in sections A, B, and C, as well as between specific storage positions (A6, B6, C6 and A7, B7, C7). This results in three transport aisles running along the storage positions A, B, and C and one aisle at a right angle to them. The truck loading/unloading area, which delivers or collects pallets in the test cycle, is located in front of position B1. It is assumed that the truck floor is parallel to the warehouse floor, with a vertical distance of approximately 1.1 m between the two surfaces (Figure 5). The test cycle does not define the dimensions of storage positions or the widths of transport aisles. The crane starts and ends each of the two operating modes at the same start-stop position.
Table 2.
Characteristic points handled by the crane in the two work cycles: 1—goods receipt; 2—order picking.
In Table 2, column 3 shows the sequence of pallet retrievals in the order-picking cycle, which involves taking a pallet from the warehouse floor and placing it on the truck floor, counting sequentially from the cab towards the rear of the vehicle. During the order-picking cycle (column 3), the crane first moves from its parking position to position C1. This movement is performed with the crane unloaded. After placing the last pallet on the vehicle in the order-picking cycle—pallet C8—the crane returns to its parking position. The parking position remains fixed for both cycles.
In the goods receipt cycle (column 2), the crane moves unloaded from its parking position to the truck’s load compartment to collect pallets sequentially as specified in column 2. The pallets are then placed at designated storage positions (columns 5–7). The goods receipt cycle begins at storage position B9 and ends at B6. After placing the pallet at B6, the unloaded crane returns to its parking position.
The determination of the crane’s energy intensity based on the test cycles for goods receipt and order picking is performed alternately over a period of 3600 s, with the minimum number of test cycles set at N = 15.
3.3. The EPI and the Crane Test Cycle Model
The proprietary Energy Performance Index (EPI) was first described in [20]. In this paper, the earlier research on the EPI is further developed by adapting its application to the analysis of energy intensity at pallet transfer points (TPs) between material-handling equipment (Equation (1)). Existing methods for assessing the energy intensity of material-handling systems do not allow for a direct determination of the EPI value at TPs. Measurements under real operating conditions are costly, time-consuming, and require the temporary shutdown of the crane, while the import and registration of measurement data using control and measuring equipment demand a dedicated methodology, which is described in the following section. The scientific objective of this part of the study is to determine the energy intensity at TPs using the EPI, ensuring that the test model described in Section 3 demonstrates both repeatability and reliability. The analysis has shown that the crane’s energy intensity at a TP may introduce an error into the model results if it is not analytically accounted for; combining the EPI with the test cycle ensures measurement consistency in both experimental and simulation environments. In this way, the EPI enables a shift from a global assessment of the energy intensity of the process to an energy diagnosis of individual TPs, supporting design and optimisation decisions aimed at achieving a passive or energy-positive warehouse. The diagnostic approach is based on the decomposition of energy intensity at TPs, the identification of loss sources, the definition of corrective measures, and the verification of the system’s progress towards energy self-sufficiency.
The research was carried out in a logistics centre over a measurement cycle of 3600 s and 30 complete operational cycles, in accordance with the principles of experimental design, ensuring repeatability of results. The scope of measurements included the pallet coupling and decoupling operations at the crane hook. The results are summarised in Table 3.
Table 3.
Summary of crane energy intensity in the goods-receipt mode—without and with energy recovery.
In the crane–truck loading platform transfer, the energy intensity may be affected by dynamic factors such as suspension compliance, tyre stiffness, number of axles, and load mass distribution. Although these parameters are not part of the intrinsic characteristics of material-handling systems, they represent significant environmental factors influencing the accuracy of test cycle comparisons. In this context, further research has been planned to reliably determine the order of energy intensity of the crane at the TP, enabling a more precise analysis of logistic scenarios aimed at achieving passive or energy-positive performance in warehouse and material-handling operations. It may prove important to introduce mandatory mitigation measures addressing the impact of truck platform suspension characteristics during loading and unloading; such design solutions are already applied, for example, in swap-body vehicles equipped with fixed supports. The analysis showed that suspension characteristics and mass distribution can affect the energy intensity at the TP by 15–25%, and expert data collected from logistics centres are presented in Table 4.
Table 4.
Influence of the pallet-to-hook fastening technique on energy intensity at the TP. Own elaboration.
In industrial practice, the EPI makes it possible to identify areas where energy intensity can be reduced—both in the machine design (e.g., the crane itself) and in the TP solutions. The added value of this paper lies in the first determination of EPI values for the interfaces crane–warehouse floor and crane–truck loading platform. For palletised loads, automatic coupling systems such as spreaders are not used, and the analysis of the data presented in Table 4 shows that the pallet fastening technique has a significant impact on the EPI value. The hook coupling time is variable and strongly dependent on the human factor; during the micro-movements of the hook at the TP, the crane continuously consumes energy. Therefore, the duration of these operations should be minimised and the operator’s actions simplified to ensure ease of repetition and reduced energy intensity.
The analysis of the crane–truck platform and crane–storage area (floor level) transfers requires a separate consideration in terms of energy recovery. During the pallet depositing and retrieval phases, a number of micro-movements (also referred to as creeping motions) occur, which are only weakly represented in the crane control system. Within these operational ranges, the crane does not perform energy recovery. In relationships (1) and (2), the possibility of energy recovery at the TP has been retained. However, this refers to energy recovered outside the crane and hoist mechanisms, achieved through a dedicated TP recovery system. An example of such a solution is a proprietary pallet positioning mechanism driven by gravity and the pallet’s own mass (see [68]). As this design is patented, it has not been described in detail so far. In that study, the micro-movement of the pallet connected to the crane hook was initiated from the control panel and carried out under the influence of its own weight and gravitational force.
The EPI is described by Equation (23), whereas is defined by Equation (24). Here, denotes the mass of the pallet, represents the efficiency of energy recovery by the crane, and corresponds to the energy associated with pallet positioning (micro-movements of the crane). These micro-movements occur when the material handling equipment transitions from steady-state motion to stopping during the test cycle phase, in accordance with the approach adopted in VDI 2198. represents the energy intensity during dynamic starts, determined by the characteristics of the truck body, including wheel features and parameters. denotes the crane’s energy intensity in standby mode, while represents the energy associated with manual operations, which depends on the complexity of operational tasks (such as crane hook attachment), placement precision, and frictional work.
The energy intensity includes the energy used by barcode reading devices (1D and 2D scanners, RFID [69,70], digital cameras, handheld terminals) as well as by computers with access to the WMS. This energy intensity is most often neglected due to its relatively small values compared to, for example, the 20 kW power of the crane drive motor. However, as demonstrated in the author’s previous studies [71,72], factors such as reading speed and accuracy (which affect scanning time), code density [73], code robustness against reading interference [74], and the technology used to apply the code to the pallet surface [73] have a significant impact on the crane’s energy intensity. This is because energy is expended after the reading and verification of the barcode information vector, the transmission of data to the WMS (or ERP), and the acceptance of the data.
Table 5 presents measured values of energy intensity and cycle times for different TP combinations, in which the crane transfers loads to other transport units (e.g., AGVs, forklifts, stacker cranes, trucks, storage areas). These data reflect the operational and technological diversity of these interfaces and enable more precise modelling of crane energy consumption using the EPI. The values in Table 6 were measured on-site in logistics centres.
Table 5.
Energy intensity of cranes in typical operational configurations, based on expert studies conducted in a logistics centre.
Table 6.
Energy and operational parameters of load transfers from the crane to various material handling subsystems.
The compilation of crane-to-other material handling device transfers highlights differences in energy intensity and cycle duration depending on the level of automation and device characteristics. The highest energy consumption (130–190 Wh/pallet) and the longest cycle time (28 ± 6 s) were observed in the crane → stacker crane transfer. This results from the need for highly precise movement synchronisation and the alignment of control logic between the two devices. The lowest energy consumption occurs during transfers to the storage area (90–140 Wh), which is due to the absence of an active receiver, but this comes at the cost of longer cycle times and potential disturbances in subsequent process stages. The crane → truck scenario requires precise placement of the load on the truck bed, resulting in the highest individual cycle time (25 ± 6 s). Transfers to automated systems (AGVs, conveyors) require precise stopping and the use of buffers but can be executed in a relatively short time with moderate energy consumption.
From this analysis, it follows that creating scenarios for cooperating material handling devices—particularly TPs involving the crane—should take into account not only the operational characteristics of the devices but also TP synchronisation and the level of TP automation.
Table 5 presents combinations of material handling device transfers in which the crane is always involved at the TP. Pallet transfers involving the crane are characterised by relatively high energy consumption (90–190 Wh/unit) and longer cycle times (18–28 s), which result, among other factors, from greater distances, precise manoeuvres, and the involvement of an operator or complex control systems.
The lowest energy consumption among these combinations was observed for the crane cooperating with a storage area or a roller conveyor, assuming optimised travel paths and minimised standby losses. The highest values occur in scenarios where the crane is required to transfer loads precisely to large heights or under constrained spatial conditions.
Crane energy intensity at the TP was determined based on on-site measurements at a logistics centre. However, it is undoubtedly more cost-effective and faster, with acceptable accuracy, to analyse energy intensity in the ADAMS environment. The developed model includes the vehicle body and suspension (1D/3D model of axles, springs, dampers, and nonlinearities); a tyre model integrated in Adams/Tire with vertical compliance and hysteresis components; a pressure parameterisation model for vertical stiffness; the number of wheels and axles and the cargo platform (modelled as a rigid body on the suspension); the pallet + load + hook/ropes as a rigid body; and the rope/hoist as a joint with a spring-damper element. The model verification in the ADAMS environment was performed analogously to the procedure described in [9].
In on-site measurements, it is not possible to directly and precisely separate each microphase of crane movement to record actual energy intensity. Therefore, for the purpose of recording energy intensity, time windows were defined using event markers. Auxiliary signals were introduced from sensors such as contact sensors, rope load cells, IMU, as well as signals from WMS and AUTO-ID systems.
The obtained results are unique, valuable, and essential for the verification of the TP energy intensity model in the ADAMS environment.
The measured average unit energy intensity for the crane at the TP was 0.18–0.29 kWh per pallet for the crane–warehouse floor transfer and 0.23–0.33 kWh per pallet for the crane–truck transfer. The difference in energy intensity of 10–15% is due to longer contact time and a higher number of micro-adjustments during pallet placement.
The presented energy intensity results of the crane during the goods receipt cycle and the order-picking cycle, combined with the EPI, allow for a clear determination of crane energy intensity in these operational cycles. The EPI prevents the mixing of technical conditions under which crane energy intensity in material handling is measured according to the test cycles described in the study. The measured energy intensity data, serving as verification data, are presented in Table 7 and Table 8.
Table 7.
Summary of crane energy intensity in the order-picking mode—without and with energy recovery.
Table 8.
Model validation. Agreement between simulation and measurement for test cycles.
3.4. Model Validation, Repeatability and Number of Test Cycles
For the purposes of the designed test cycle, it was assumed that energy intensity measurements would be conducted over a period of 3600 s, under constant technical and organisational conditions, including load, operating strategy, and starting point. Under these conditions, each cycle should generate a comparable energy profile, enabling a reliable validation of the model. The validation was carried out based on data recorded during the reference cycle for a selected overhead crane, characterised by typical operational parameters used in high-bay warehouses.
The design of the test cycle for cranes employing warehouse management systems (WMS/ERP) was based on an analysis of logistics processes conducted in five diverse warehouse facilities located in Croatia, Lithuania, and Poland. These facilities were selected deliberately, based on expert assessment of their representativeness for different types of warehouse infrastructure. The aim of the study was not the statistical generalisation of the warehouse population, but rather the identification of the most frequently occurring operational scenarios, which allow for the design of a repeatable and functionally standardised test cycle.
The analysed facilities utilised WMS and ERP systems, which supported both the allocation of loads within the storage space and the recording of operational data concerning the movement of load units and the scheduling of crane operations. Warehouse slotting strategies commonly applied in industrial practice, such as ABC, FIFO, and LIFO methods, were also taken into account. Data recorded in the systems regarding the distribution of load units, operation frequency, and crane movement trajectories enabled the identification of typical loading/unloading locations and operational cycle profiles. Based on these insights, the structure of the designed test cycle was developed, encompassing both the goods receipt process for receiving loads into the warehouse and the outbound process as part of order picking.
To ensure sufficient accuracy of energy intensity measurements, the minimum required number of test cycles was determined using the classical statistical formula (3).
where Z is the critical value of the normal distribution (for a 95% confidence level: Z = 1.96), δ is estimated standard deviation of energy consumption (e.g., 0.15 kWh per load unit), and e is allowable estimation error (approximately 5% of the mean value).
Assuming an average energy consumption of μ = 0.5 kWh per load unit, a value of N = 138 was obtained. This means that, to ensure sufficient accuracy in estimating the energy intensity of operations, the designed test cycle should be repeated at least 138 times under real or simulated operational conditions.
To ensure the stability of the unit energy consumption parameter (Eu), it is necessary to average the results over multiple repetitions of the test cycle. It was assumed that the minimum number of cycle repetitions, N, should guarantee the stabilisation of Eu within an error margin of no more than 2%. Based on variance analysis, it was determined that, under stable working conditions and with a known load unit mass, a sufficient number of repetitions is N ≈ 15.
The value N = 138 refers to the statistical requirements for precise energy intensity estimation, whereas N ≈ 15 indicates the minimum number of cycles required to achieve stable results in practical measurements. This demonstrates that the designed test cycle can be effectively applied in both experimental studies and simulation analyses.
The developed test cycle model fills a methodological gap in the assessment of energy intensity of material handling equipment and can serve as a foundation for further research aimed at developing industry-wide and international standards for evaluating the energy efficiency of warehouse cranes.
In the next stages, the study is planned to be extended to additional logistics centres with diverse operational and technological profiles. Increasing the number of analysed facilities will allow for the collection of a larger empirical dataset, enabling more in-depth validation of the model and verification of its applicability under various operational conditions. The objective of the further work is to develop a standardised measurement methodology with an international scope, providing a basis for the standardisation of energy intensity testing of warehouse cranes.
4. Mathematical and Computational Model of Crane Motion Dynamics
In order to analytically represent the motion of the crane along specified trajectories, a dynamic model based on Newton’s second law of motion was employed. The description takes into account the coefficient of rotating masses , the mass of the crane , the load mass [kg], and the total motion resistance [N], assuming the driving force (propelling or braking force) on the wheels [N] as a function of velocity. The initial form of the model is expressed as follows.
After transformation and separation of variables, the intermediate relationships are obtained:
Separating the given expressions on both sides yields:
Substituting gives an equation that can be expressed as:
where is the coefficient of rotating masses, and is the unit accelerating/braking force. By replacing the derivatives in the equation with finite differences, the following relationships are obtained:
where is an increment of distance [m], is an increment of time over the section [s], and is an average velocity over the section , calculated between initial and final velocities. Consequently:
The equation contains two unknowns, distance s and velocity v. Assuming distance increments , the corresponding velocity increments can be calculated.
Substituting these quantities into Equation (3) yields:
The computational challenge lies in estimating the unit accelerating force . Transforming Equation (4) yields:
Time increment ∆t is:
The increment of energy ΔW consumed by the crane is described by the following relationship:
In the calculations, it was assumed, based on measurements conducted at a real facility, that due to the efficiency of the motor and drive system, only 65% of the potential energy during lowering is converted into electrical energy. The energy conversion efficiency in the recovery system was assumed to be 95%.
The model accounts for nonlinearities arising from the characteristics of electric motors, losses in gear mechanisms, and variable load torque. For simulation purposes, three main modules were defined: the electric drive model (torque-speed characteristics), the motion model of the trolley with load (dynamic system with inertial forces), and the energy loss model (mechanical and electrical losses). In the model, longitudinal movement of the crane is considered translational, while the lifting motion is quasi-dynamic, taking into account gravity and energy recovered during braking. Input variable values were defined based on data recorded during a real test cycle. The developed model enables analysis of the influence of load mass, speed, cycle profile, and control parameters on total energy consumption. It serves as a tool not only for simulation calculations but also for evaluating the energy efficiency of the crane under different operational scenarios consistent with the reference cycle developed in Section 4.
4.1. Mathematical Model of the Crane Test Cycle
The purpose of developing the mathematical model was to quantitatively determine the energy intensity of the crane test cycle as a function of time, load mass, and travel speed. The model allows for the calculation of unit energy consumption in individual operational phases, providing a basis for further comparative analyses and validation of the EPI.
In a mechanical system that enables the movement of a technical object in space, losses occur, including energy losses, which originate, among others, from friction phenomena between elements of the drive transmission systems (in some cases, environmental resistances are also considered, such as air resistance).
In the presented model of the overhead crane motion, resistances were classified separately for the following subsystems: gantry travel, trolley travel, lifting, and lowering (hoist). A schematic diagram of the crane drive system is shown in Figure 6. It sequentially includes the motor, clutch, brake, gearbox, drive shaft, and wheels interacting with the track rails.
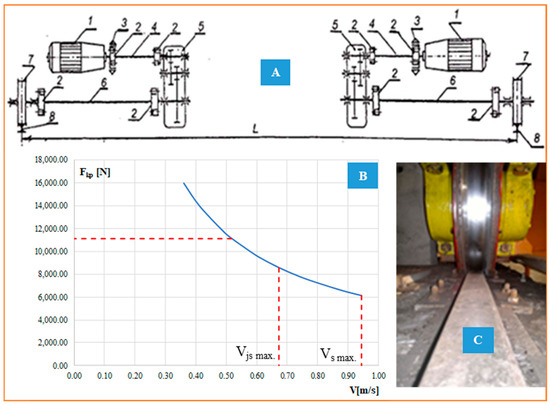
Figure 6.
Diagram of the crane drive system. (A) drive system: 1—motor, 2—clutch, 3—brake, 4—gearbox, 5—transmission, 6—drive shaft, 7—crane travel wheel, 8—rail; (B) drive characteristics; (C) wheel-rail contact. Own elaboration.
Figure 6B presents the traction characteristic of the crane travel drive, showing the variation in the driving force as a function of the crane travel speed V. The diagram indicates several key limitations, including the adhesion force of the travel wheels (Figure 6C), the force resulting from the motor and inverter characteristics, constraints related to motor power and rotational speed, as well as the maximum permissible crane travel speed. The characteristics are consistent with the crane data provided in Appendix A and Appendix B.
The schematic diagram of the trolley travel drive system is shown in Figure 7A, while its traction characteristic is presented in Figure 7B. The trolley drive operates within the range up to the first inflection point of the characteristic curve, corresponding to the nominal speed value in standard operating mode.
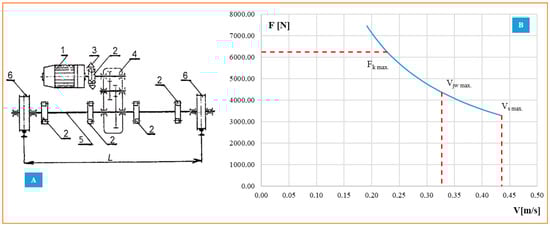
Figure 7.
Diagram of the crane trolley drive system. (A) drive system: 1—motor, 2—clutch, 3—brake, 4—gearbox, 5—drive shaft, 6—trolley travel wheels; (B) drive characteristics. Own elaboration.
Hoisting drive system. Among all subsystems, the hoisting drive unit usually has the highest power demand. This corresponds to the operational intensity of the crane component responsible for lifting and lowering heavy loads. The schematic diagram of the system is shown in Figure 8A, while its drive characteristic is presented in Figure 8B. Due to its significant energy consumption and recovery potential (during braking and lowering of loads), this subsystem constitutes the main area of analysis in the context of achieving passive or energy-positive warehouse operation levels.
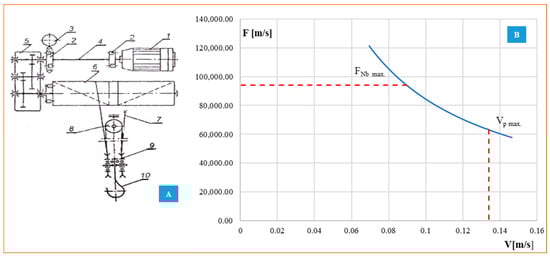
Figure 8.
Diagram of the hoisting drive system. (A) drive system: 1—motor, 2—clutch, 3—brake, 4—drive shaft, 5—gearbox, 6—hoist drum, 7—rope system, 8—pulley, 9—rope pulley block, 10—hook; (B) drive characteristics. Own elaboration.
The adopted mathematical model enables complete representation of power and energy profiles as functions of time and provides a basis for developing computational and simulation models describing crane motion dynamics in the MATLAB–Simulink environment.
4.2. Model Validation: Consistency Between Simulation and Measurement
As an introduction to the simulation results, it is of particular interest to verify to what extent it is possible to determine the energy intensity of the crane based on tests that are routinely performed—for example, during crane acceptance procedures, performance tests, or technical audits. The standard acceptance protocol (Appendix A) includes current measurement data obtained during testing. It also contains information such as load-bearing and strength parameters, which are not directly related to the scope of this paper. The known current values make it possible to calculate the energy intensity of the crane according to the well-known relationship (19), valid for discrete operation. In cases where no direct power measurement is available, the current and voltage of a three-phase system can be used. In such situations, both apparent and active power are taken into account, assuming a power factor of .
For the crane under study (Appendix A), it was calculated that the total energy consumption may range from approximately 100 to 210 kWh over an eight-hour shift. The discrepancy results from variations in the actual current profile, the duration of operational phases, and the proportion of energy recovered during regenerative operation. The actual measured energy intensity values may therefore be either lower or higher. The available current readings represent instantaneous (maximum) current values rather than the mean current within a defined measurement window, as the current fluctuates throughout the work cycle. In addition, the PF is unknown, and there is no direct measurement of active power. The recorded current data also lack any reference to the duration of specific operational phases (lifting, travelling, or standstill). Furthermore, the protocol does not include information regarding energy consumption by the travelling and trolley drives, auxiliary systems, or control units. Nor does it account for energy recovery during braking or the efficiency of motors and gearboxes, both of which affect the conversion of electrical energy into mechanical work and the associated losses.
Reputable crane manufacturers, as part of the agreements preceding performance and acceptance tests, may agree to implement certain innovations or modifications extending the standard testing protocol (Appendix A). A proposed extension or amendment to the protocol may include the introduction of additional measurements and data logging, such as:
- −
- Three-phase power meter—measurement of active power (kW) with data logger recording at the crane’s main power supply;
- −
- Event markers—for example, time stamps for the start and end of operations, such as lifting, travelling, lowering, and motor start/stop events;
- −
- Recording of phase currents, voltages, and PF using a power analyser, including both active and reactive power;
- −
- Separate recording of parameters for the hoist motor, travel drives (gantry/trolley), and auxiliary loads, where separate power feeds are available;
- −
- Endurance test recording—full test duration (4–8 h) with determination of the average energy profile;
- −
- Recording of environmental parameters (e.g., temperature)—in relation to efficiency.
Returning to the simulation results obtained in the MATLAB–Simulink environment, the analysis was carried out for an overhead crane with parameters specified in Appendix B. The given force values, and Fkw, refer to the acceleration phase. During motion at a constant velocity, they were equal to the motion resistance Rc. The unit accelerating force is described by the following equation:
The subject of the study is an overhead crane equipped with an electric wire rope hoist with a hook, designed for the transport of palletised loads within a warehouse hall. The gantry is supplied with 500 V (power circuits) and 220 V (control circuits). The lifting mechanism is a general-purpose hoist of the 5J9-C type. Despite being produced by different manufacturers and having separate serial numbers and documentation, both components form an integrated lifting device subject to technical supervision, serving as a source of verification data for the energy intensity model in defined work cycles.
Detailed technical specifications of the crane and hoist are presented in Appendix B and Appendix C.
The simulation results of the crane operating in the test cycle within MATLAB–Simulink, in goods-receipt mode, are presented in Figure 8 and Figure 9.
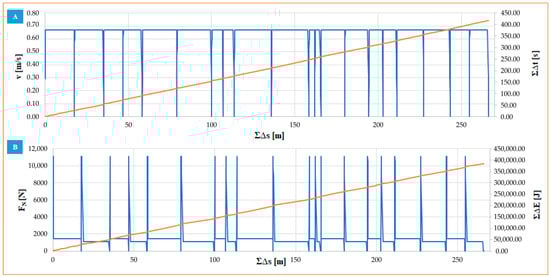
Figure 9.
Graphs of relationships: (A)—v(s) and t(s) for the crane travel system in the goods-receipt mode; (B)—FN(s) and Ʃ∆E(s) for the crane travel system in the goods-receipt mode.
Figure 9 and Figure 10 present the simulation results obtained in MATLAB–Simulink for the goods-receipt mode, for two motion mechanisms: gantry travel and trolley travel. Part A illustrates the relationships of velocity and time versus distance, v(s) and t(s), whereas part B shows the profiles of the unit accelerating and braking force, FN(s), and the cumulative energy, ΣΔE(s). This comparison makes it possible to clearly distinguish the contribution of both drive systems to the total energy intensity of a single receipt cycle.
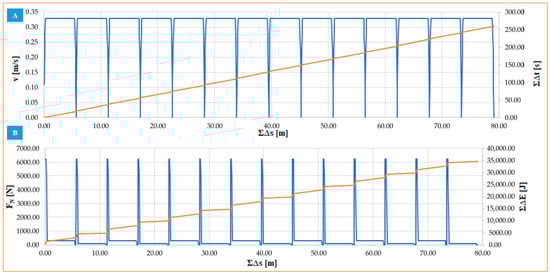
Figure 10.
(A)—Graphs of v(s) and t(s) for the trolley travel system in the goods-receipt mode; (B)—Graphs of FN(s) and ΣΔE(s) for the trolley travel system in the goods-receipt mode.
The graphs clearly illustrate the typical structure of the cycle: the acceleration and braking segments (local maxima of FN(s)) correspond to phases with the highest dynamics, where the fastest increase in ΣΔE(s) is observed; in contrast, the constant-speed segments are characterised by a more gradual energy accumulation. The definitions and methods for determining FN and ΔE are derived directly from the adopted differential motion model and the energy balance along the trajectory S.
It should be noted that the cycle geometry and the TPs determine the load profiles: the difference in elevation between the TP on the vehicle and the storage location affects the distribution of loaded and empty cycles, and consequently the shape of ΣΔE(s) for both gantry and trolley travel.
The conclusions drawn from Figure 8 and Figure 9 provide a starting point for the aggregated presentation in Table 3 and Table 4 (comparison of energy intensity for handling individual storage locations and the variant with energy recovery), which is discussed in the following subsection.
Table 6 presents the agreement between the model (speed derived from position) and the SpeedFeedback measurements, evaluated per cycle and aggregated using the median. The NRMSE was approximately 2–3% and R2 ≈ 0.94–0.98 for all drives, indicating a high quality of trajectory reproduction. Elevated MAPE values are primarily associated with segments where speed approaches zero.
Operational data and model files (MATLAB–Simulink, FlexSim, PLC) are not publicly available due to intellectual property protection and confidentiality obligations to the logistics center. More comprehensive data can be shared upon request, exclusively for non-commercial research and subject to a data use agreement (DUA/NDA). The provided package ensures reproducibility of the method.
4.3. Recording the Crane’s Energy Intensity During Tests at the Logistics Centre
The purpose of testing the crane at the logistics centre—whose energy intensity had previously been calculated—was to obtain data for validating the computational model in MATLAB-Simulink. During the tests, the active power drawn by the crane was measured separately for the following circuits: hoist, trolley, gantry, and auxiliary systems. Power measurements were performed using long-term PQ recorders, current probes and transformers, voltage transformers, and digital input modules for collecting TTL signals from the PLC, which allowed synchronisation of power profiles with the operational cycle phases. All measurements were conducted in accordance with occupational health and safety procedures, with zone marking and plan approval by safety authorities.
Data were recorded in CSV or binary formats and subsequently analysed in MATLAB. The database structure was designed to enable direct import into MATLAB and Python computational environments, with automatic mapping of variable names and units. This setup allows automatic comparative analysis of multiple test cycles as well as calculation of EPI values and statistical parameters such as mean, variance, standard deviation, and confidence intervals.
The measurement results obtained on the real object were used to verify the results from the model, as described in Section 5.
As mentioned earlier, the test studies, conducted using energy intensity test cycles of the crane in the goods-receipt and order-picking cycles, were performed alternately over a period of 3600 s. The conducted tests revealed a noticeable pattern: the duration of individual cycles gradually decreases as the test progresses. A certain stabilisation of cycle times is expected. Meanwhile, due to loss of operator concentration, a higher number of errors may occur, which prolongs the duration of the test cycles. In the final stage of the test, a noticeable reduction in errors and shortening of cycle times are observed. This phenomenon will be further investigated, and its results will be presented in a separate publication.
In this study, the methodology applied follows the approach used for forklift energy intensity tests based on the VDI 2198 standard and the PZM Method [9].
The collected dataset enabled the development of a computational and mathematical model describing the crane’s motion dynamics, presented in Section 5. This model allows quantitative analysis of the relationships between motion profile, load mass, and energy consumption, providing a foundation for further optimisation of the energy efficiency of material handling equipment.
4.4. Discussion and Summary of Test Cycle Modelling Results
The obtained results (Table 4 and Table 5, Appendix B, and Table 7 and Table 8) allow us to formulate a series of observations regarding the relationship between the crane’s cycle configuration and energy consumption. In particular, a significant difference was observed in the energy intensity characteristics of the analysed operating modes: goods receipt and order picking.
The summary of results, presented in the tables, shows the total energy consumption of each of the crane’s working mechanisms. In this cycle, the active contribution to moving the load came from the crane travel mechanism and the hoisting/lowering system. The total energy consumed by the device is as follows:
means the total energy consumed by the crane travel mechanism during the entire cycle [J] and is the total energy consumed by the hoisting/lowering mechanism during the cycle [J]. . The total cycle duration for the crane in the goods-receipt mode, while handling storage location B9, was .
Information regarding the travel trajectory of each crane mechanism is presented in summary tables describing the handling of key points during the goods-receipt and order-picking processes. The energy consumption values given above do not account for recovery during the lowering of the hoist hook.
The crane studied in this article is equipped with three separately operating electric motors, each with different drive-force characteristics, which are used to overcome both structural resistances and resistances arising from the loads of transported units. The most suitable subsystem for implementing an energy-limiting system is the hoisting mechanism. This mechanism consumes the most energy and therefore presents the greatest potential for energy recovery during the load-lowering stage. Solutions that do not involve energy recovery are also considered as they can still provide a form of energy saving during the execution of each subsequent work cycle.
The efficiency of energy recovery systems for lifting devices is relatively high. For the purpose of analysing values obtained during load lowering in the simulated work cycle, an efficiency of was assumed. Inverters adapted for electrical energy recovery generate more losses than standard inverters. These differences are noticeable not only in standby mode but also during operation. Input filters built into the inverter help reduce losses caused by current harmonics. These filters allow harmonic distortion to be reduced to [20]. (Total Harmonic Distortion) is the ratio of the root mean square (RMS) value of higher-order harmonics to the RMS value of the fundamental component [45]. Achieving a THD of less than 5% means that, according to the relevant standards [75], direct feedback of energy into the grid becomes possible. It should be noted that an inverter connected to the grid exchanges only active power. Data provided by manufacturers of modules designed for feeding energy back into the grid indicate that, during braking, the drive system generates energy corresponding to approximately 50% of the difference between the initial and final energy in a given work cycle. This value depends on the type of device and the efficiency of the individual components, including the electric motors.
Based on the simulation analyses of the crane’s energy intensity during the goods-receipt and order-picking modes, tables were compiled presenting the total values of energy and work obtained for individual work cycles corresponding to the handling of designated storage locations.
Taking into account the efficiency of the energy recovery system, assumed as , it was possible to determine the energy intensity of the crane including the recovered energy. The energy consumption with recovery, denoted as , is expressed as:
where represents the amount of energy generated and partially recoverable during the handling cycle of a storage location. The remaining values of the crane’s energy intensity in individual work cycles as well as the total consumption in the goods-receipt and order-picking modes are summarised in the following tables.
The data presented in the tables indicate that the goods-receipt mode, despite involving a higher average mass of the handled load, is characterised by lower unit energy intensity (kWh/t or kWh/pallet) compared to the order-picking cycle. The difference in energy intensity between the two cycles can be explained by the nature of the movement trajectories in the goods-receipt mode: longer travel distances are performed under full load, whereas in the order-picking cycle, frequent changes in load location and movements with partial or no load lead to an increased share of non-productive energy losses. Additionally, a higher number of stops and short accelerations in the order-picking cycle result in reduced utilisation of the motors’ dynamic torque, thereby decreasing the total energy intensity in absolute terms.
In the analysis of unit energy intensity, an interesting nonlinear relationship was observed between load mass and energy intensity. For low load masses (below 30% of the nominal lifting capacity), the energy consumption per tonne increases significantly, then stabilises within the 50–80% capacity range and subsequently decreases again near the upper limit. This behaviour can be explained by the combined effects of frictional losses, drive inertia, and—partially—the operation of the energy recovery system during the lowering of heavier loads. The results indicate the existence of an optimal operating range for the crane in terms of energy intensity, which can be taken into account when planning the spatial allocation of materials within the storage zones.
In the test cycle, a distinct contribution of recovered energy was observed during braking and load lowering—particularly in the hoisting mechanism. In the goods-receipt mode, where the pallet is transferred between storage positions at different height levels, the potential for energy recovery is limited. In contrast, in the order-picking cycle, where downward movements occur more frequently, the recovered energy accounted for a significant portion of the overall balance—in some cases exceeding 20% of the energy consumed by the hoisting drive. It should be noted, however, that the effectiveness of energy recovery depends not only on the drive design (i.e., its regenerative capability) but also on the control strategy and the use of dynamic or mechanical braking. In cranes equipped with frequency converters featuring energy feedback to the grid (or local energy storage), the potential for savings can be even greater. The results for the pallet receiving process are presented in tabular form in Appendix C.
Based on own data, the unit energy consumption per cycle was estimated at 0.83–1.75 kWh/cycle (calculated from the range of 100–210 kWh per 8 h, corresponding to 12.50–26.25 kWh·h−1, and assuming a minimum number of cycles N ≥ 15 per hour), yielding a mean value of approximately 1.29 kWh/cycle. This range is consistent with values reported in the literature for comparable crane systems (see Table 9): lower than those of port cranes (due to larger ΔH), comparable to AS/RS (stacker cranes), and in agreement with the observed influence of trajectory shape and control strategy.
Table 9.
Overview of energy intensity ranges based on literature versus obtained results. Own elaboration.
From Table 9, it can be inferred that the results lie near the mid-range of values reported for warehouse cranes and AS/RS systems, confirming the validity of the assumed trajectories and control strategies. Additionally, the observed trends in energy recovery (during lowering phases) qualitatively agree with literature reports.
5. Discussion
The discussion of the presented results enables a synthetic assessment of the usefulness of the proposed methodology and the identification of its limitations and directions for further research. The findings confirm the validity of employing a dedicated test cycle to assess the energy intensity of overhead cranes operating in warehouses that handle bundled loads. Incorporating into the test cycle a sequence of operations that reflects real operating conditions made it possible to obtain stable and comparable unit energy intensity values. Such conditions constitute the basis for reliable validation of the dynamic model in both simulation studies and field measurements. The results further indicate that neglecting local phenomena occurring at transfer points (TPs) would systematically underestimate the crane’s energy intensity—consistent with earlier industrial observations on discrepancies between catalogue data and real-world measurements.
The analyses demonstrate that the energy processed at TPs is not solely a function of the motion of drive mechanisms but arises from a more complex interaction between the hoist, the crane’s supporting structure, and the receiving material-handling subsystem. The influence of local microdisplacements, the method of pallet attachment, and—in the case of TP2—the compliance of the supporting surface (e.g., originating from the vehicle suspension) may amount to several to more than ten percent of the reference energy associated with hoisting and travelling mechanisms. From a practical perspective, this implies that omitting these effects would lead to significant errors when designing warehouses aimed at reducing energy intensity, particularly those aspiring to achieve passive or energy-positive performance characteristics.
Validation of the numerical model against field measurements demonstrated a high degree of agreement for both analysed operational cycles: goods reception and order picking. The highest consistency was observed when the EPI was incorporated into the model as a corrective component describing energy intensity at the TP. This finding confirms that the EPI can serve as a complementary element to dynamic models, analogous to approaches used in other transport sectors where local phenomena at object–object interfaces are decisive for accurate energy exchange estimation.
A pronounced effect of the load-coupling technology and the level of automation on the overall energy intensity of the crane was also observed. The comparative analysis of pallet-suspension methods revealed multi-fold differences in the duration of coupling operations and substantial variability in EPI values. This highlights the importance of organisational, ergonomic, and integration-related factors. From the perspective of designing and modernising warehouses with reduced energy intensity in mind, the analysis of TPs should be considered on par with the evaluation of crane drive mechanisms, as it is at the TP where the actual interaction between material-handling devices and the load becomes evident.
The study also identified several areas requiring further investigation. These include determining the variability of EPI as a function of the type and mass of the handled load and the structural characteristics of the TP environment, as well as clarifying in greater detail the influence of surface compliance at TP2 on energy intensity outcomes. Although vehicle suspension is not part of intralogistics in the strict sense, its role in the load-depositing process is undeniable, as evidenced by the observed corrective motions of the hoist and variations in micro-adjustment energy.
The ongoing development of automation and digitalisation in logistics processes, together with the evolution of supply chains toward autonomous systems, will require close synchronisation of information exchanged between the EPI and Digital Twin models. Such integration will enable dynamic forecasting of process energy intensity and will support the systematic improvement of warehouse performance toward passive and energy-positive solutions.
6. Conclusions
The conducted research and energy intensity modelling of the crane in the designed work cycle enabled the development of a methodology to assess the energy efficiency of material handling equipment in a warehouse environment. A repeatable test cycle was proposed, covering two typical crane operating modes: goods receipt and order picking, and energy consumption measurements were performed in selected logistics centres to validate the computational model and evaluate the accuracy of energy profile reproduction. The analysis also considered the potential for energy recovery (regeneration) in the hoist and travel mechanisms. For the goods-receipt mode, energy consumption without recovery was 1,039,506.42 J (0.2888 kWh), whereas with regeneration it was 650,516.25 J (0.1807 kWh), meaning that 388,990.17 J (0.1081 kWh) was returned to the network, corresponding to approximately 37% energy recovery. In the order-picking mode, for ten cycles performed, energy consumption without regeneration amounted to 1,172,054.98 J (0.3256 kWh), while with regeneration it was 839,623.74 J (0.2332 kWh). The energy recovered in this case was 332,431.24 J (0.0924 kWh), representing about 28% of the total energy consumption.
To assess the agreement between the model results and experimental measurements, the EPI100 indicator was applied, relating the total energy consumed by the device to the useful work performed on the load (sum of potential and kinetic energy). The obtained EPI values were 74.43 for the goods-receipt cycle and 93.20 for the order-picking cycle, indicating that the goods-receipt mode is approximately 25% less energy-intensive. This result confirms the significant impact of the nature of transport operations on the overall energy intensity of the crane and demonstrates the suitability of the proposed indicator for differentiating between operating modes.
The combined use of the EPI100, the developed test cycle, and the computational drive model provides a basis for comparable classification of material handling equipment in terms of energy efficiency. The proposed methodology can be applied both in technical certification processes and in the development of industry standards for energy intensity assessment. Furthermore, the study results indicate the potential application of the model in the development of Digital Twins and AI/ML predictive models for energy analysis and optimisation in warehouse environments, supporting “green warehouse” concepts and systematic energy management in intralogistics systems.
7. Future Research Directions
Future research will progress along both scientific and application-oriented lines. On the scientific side, further development of the test cycle model and the associated EPI indicator is envisaged, with particular emphasis on the complex phenomena governing energy exchange within transfer points (TPs) between the hoist, the structural components of the crane, and the interacting elements of internal transport. The next stage of research will focus on formulating predictive and adaptive variants of the EPI indicator capable of assessing the energy demand of the operating cycle in real time, while accounting for load variability, the dynamic behaviour of supporting structures, and the interaction parameters specific to each TP. In the longer term, an important objective will be the formalisation of criteria for evaluating material-handling processes with respect to their degree of energetic passivity and their potential to achieve an energetically positive balance.
In parallel, the application-oriented dimension of the proposed methodology will be further advanced. The test cycle will be implemented in practice as a tool for assessing the energy demand of cranes both at the design stage—before installation—and under real operating conditions. This will enable objective comparison of different combinations of hoist units and supporting structures, as well as evaluation of how control strategies and integration characteristics with internal transport equipment influence overall energy demand. Expanded studies in logistics centres are planned to increase data representativeness and verify the stability and robustness of the model under variable operational conditions. Collectively, these efforts aim to support the development of energetically passive or even energy-positive warehouse environments through more accurate characterisation of crane–load interaction in TPs.
Funding
This research received no external funding.
Data Availability Statement
The data presented in this study are based on operational observations and publicly available equipment specifications. Further details are available from the corresponding author upon request.
Conflicts of Interest
The author declares no conflicts of interest.
Nomenclature
| Symbol/Abbreviation | Description |
| TP | Transfer Point (pallet handover point) |
| LIFO | Last In, First Out |
| EPI | Energy Point Index |
| FIFO | First In, First Out |
| ABC | ABC classification based on item picking frequency |
| PKN | Polish Committee for Standardization |
| SCM | Sapply Chain Management |
| WMS | Warehouse Management System |
| WLTC | Worldwide Harmonized Light Vehicles Test Cycle |
| SCADA | Supervisory Control and Data Acquisition |
| PLC | Programmable Logic Controller |
| HMI | Human–Machine Interface |
| UDT | Urząd Dozoru Technicznego (Polska) |
Appendix A


Appendix B
Table A1.
Energy consumption of an overhead crane in warehouse receipt mode. Own study.
Table A1.
Energy consumption of an overhead crane in warehouse receipt mode. Own study.
| 1 | 2 | 3 | 4 | 5 | 6 | 7 | 8 | 9 | 10 |
|---|---|---|---|---|---|---|---|---|---|
| 2 | Tryb przyjęcia do magazynu | ||||||||
| 3 | Obsługiwany punkt | Ʃ∆E | Ʃ∆W | Ʃ∆tc | Ʃ∆Eo | Ʃ∆Wo | Ʃ∆to | Ʃ∆h | Ʃ∆E¸ pomiar |
| 4 | [J] | [kWh] | [s] | [J] | [kWh] | [s] | [m] | [J] | |
| 5 | B9 | 110,060.97 | 0.0306 | 185.42 | 61,043.83 | 0.01696 | 65.45 | 8.77 | 111,789.28 |
| 6 | C6 | 99,635.92 | 0.0277 | 199.95 | 56,745.18 | 0.01576 | 63.06 | 8.45 | 101,667.00 |
| 7 | A11 | 123,801.99 | 0.0344 | 198.83 | 56,979.66 | 0.01583 | 63.21 | 8.47 | 125,326.13 |
| 8 | B3 | 81,711.81 | 0.0227 | 146.92 | 56,526.36 | 0.01570 | 62.31 | 8.35 | 83,175.63 |
| 9 | C12 | 129,336.27 | 0.03593 | 242.49 | 65,036.41 | 0.01807 | 68.21 | 9.14 | 130,719.68 |
| 10 | C1 | 79,605.34 | 0.0221 | 186.67 | 65,593.28 | 0.01822 | 68.36 | 9.16 | 81,369.35 |
| 11 | A7 | 108,499.11 | 0.0301 | 208.61 | 56,536.30 | 0.0157 | 63.21 | 8.47 | 110,994.59 |
| 12 | A4 | 94,140.63 | 0.02615 | 193.23 | 57,562.31 | 0.01599 | 64.47 | 8.64 | 95,067.97 |
| 13 | C8 | 116,141.17 | 0.0323 | 226.52 | 64,812.02 | 0.0180 | 69.78 | 9.35 | 117,468.29 |
| 14 | B6 | 96,573.22 | 0.02683 | 164.68 | 57,611.07 | 0.0160 | 64.03 | 8.58 | 97,688.49 |
| 15 | SUMA | 1,039,506.42 | 0.2888 | 1953.32 | 598,446.41 | 0.16624 | 652.09 | 87.38 | 1,051,121.21 |
Table A2.
Energy consumption of an overhead crane in picking mode. Own study.
Table A2.
Energy consumption of an overhead crane in picking mode. Own study.
| 1 | 2 | 3 | 4 | 5 | 6 | 7 | 8 | 9 | 10 |
|---|---|---|---|---|---|---|---|---|---|
| 2 | Tryb kompletacji | ||||||||
| 3 | Obsługiwany punkt | Ʃ∆E | Ʃ∆W | Ʃ∆tc | Ʃ∆Eo | Ʃ∆Wo | Ʃ∆to | Ʃ∆h | Ʃ∆E, pomiar |
| 4 | [J] | [kWh] | [s] | [J] | [kWh] | [s] | [m] | [J] | |
| 5 | C1 | 145,358.47 | 0.0404 | 240.55 | 50,910.17 | 0.01414 | 67.84 | 9.09 | 148,701.71 |
| 6 | B4 | 122,978.57 | 0.0342 | 185.87 | 52,101.70 | 0.01447 | 66.27 | 8.88 | 125,675.09 |
| 7 | A2 | 138,003.39 | 0.0383 | 233.23 | 51,281.15 | 0.01424 | 66.56 | 8.92 | 139,617.89 |
| 8 | B7 | 103,072.90 | 0.0286 | 160.50 | 49,140.94 | 0.01365 | 62.53 | 8.38 | 104,802.93 |
| 9 | A11 | 93,497.07 | 0.02597 | 186.22 | 53,723.39 | 0.01492 | 66.34 | 8.89 | 94,758.26 |
| 10 | A9 | 104,379.75 | 0.0290 | 194.28 | 50,509.20 | 0.01403 | 65.59 | 8.79 | 105,869.40 |
| 11 | C10 | 98,520.44 | 0.0274 | 189.05 | 51,447.00 | 0.01429 | 65.38 | 8.76 | 99,210.08 |
| 12 | B2 | 127,843.37 | 0.03551 | 193.34 | 53,146.80 | 0.014763 | 65.22 | 8.74 | 130,678.80 |
| 13 | A5 | 127,754.32 | 0.0355 | 219.50 | 49,923.30 | 0.01387 | 66.86 | 8.96 | 129,677.71 |
| 14 | C8 | 110,646.70 | 0.03074 | 199.50 | 49,249.03 | 0.01368 | 65.82 | 8.82 | 111,920.34 |
| 15 | SUMA | 1,172,054.98 | 0.3256 | 2002.04 | 511,432.68 | 0.1421 | 658.41 | 88.23 | 1,196,238.44 |
Appendix C
—crane mass 8560 [kg], mw—trolley mass 1160 [kg], —load mass 2500 [kg], —initial speed 0 [m/s], —final speed [m/s], —distance increase 0.1 [m], —weight of the crane with load 108,498.6 [N], —rotating mass coefficient 0.104, —resistance of the crane running system for a 2500 kg load 1479.53 [N], —driving force read from the traction characteristics 11,128.73 [N], Fkw—driving force on the trolley wheels 6238.08 [N], Fwc—driving force on the winch drum 14,566.41 [N].
Table A3.
Technical parameters of the reference crane. Source: technical documentation.
Table A3.
Technical parameters of the reference crane. Source: technical documentation.
| 1 | 2 | 3 | 4 | 5 | 6 | 7 | 8 | 9 |
|---|---|---|---|---|---|---|---|---|
| 2 | Component | Manufacturer | Type /Model | Serial No. | Year of Manufacture | Application | Operating Temp. (°C) | Remarks |
| 3 | Crane | Fabryka Urządzeń Dźwigowych S.A., Mińsk Mazowieck, Poland | XL-516N40HFC | 10,403 | 1997 | Indoor transport | −20 to +40 | Power supply: 500 V (main), 220 V (control) |
| 4 | Hoist | Bytomskie Zakłady Urządzeń Technicznych, Bytom, Poland | 5J9-C | - | 1997 | General purpose | −25 to +40 | IP54, not for explosive atmospheres |

Figure A1.
Functional and operational diagram of the reference crane. Source: technical documentation.
Figure A1.
Functional and operational diagram of the reference crane. Source: technical documentation.

References
- Anand, V.; Lee, S.; Prabhu, V. Energy-Aware Models for Warehousing Operations. IFIP Adv. Inf. Commun. Technol. 2014, 439, 390–397. [Google Scholar] [CrossRef]
- Swinderman, R. Conveyor Technology: Designing for the Future by Innovating the Present. Coal Age 2022, 127, 22–25. Available online: https://www.coalage.com/features/conveyor-technology-designing-for-the-future-by-innovating-the-present/ (accessed on 8 December 2025).
- Cannava, L.; Perotti, S.; Petrillo, A. The Role of Digital Technologies in Improving Energy Efficiency at Logistics Facilities: A State-of-the-Art. In Proceedings of the Summer School Francesco Turco, Genoa, Italy, 6–8 September 2023; pp. 1–6. [Google Scholar]
- Cannava, L.; Javan, F.; Najafi, B.; Perotti, S. Green Warehousing Practices: Assessing the Impact of PV Self-Consumption Enhancement Strategies in a Logistics Warehouse. Sustain. Energy Technol. Assess. 2024, 72, 104054. [Google Scholar] [CrossRef]
- Perotti, S.; Cannava, L.; Najafi, B.; Gronda, E.; Rinaldi, F. Sustainable and Energy-Efficient Industrial Systems: Modelling the Environmental Impact of Logistics Facilities. Lect. Notes Bus. Inf. Process. 2024, 507, 146–157. [Google Scholar] [CrossRef]
- Carli, R.; Dotoli, M.; Digiesi, S.; Facchini, F.; Mossa, G. Sustainable Scheduling of Material Handling Activities in Labor-Intensive Warehouses: A Decision and Control Model. Sustainability 2020, 12, 3111. [Google Scholar] [CrossRef]
- Rüdiger, D.; Schön, A.; Dobers, K. Managing Greenhouse Gas Emissions from Warehousing and Transshipment with Environmental Performance Indicators. Transp. Res. Procedia 2016, 14, 886–895. [Google Scholar] [CrossRef]
- VDI 2198; Motive Power Units for Industrial Trucks—Test Cycles for Energy Consumption. VDI: Düsseldorf, Germany, 2012.
- Zajac, P.; Rozic, T. Energy Consumption of Forklift versus Standards, Effects of Their Use and Expectations. Energy 2022, 239, 122187. [Google Scholar] [CrossRef]
- ISO 4301-1; Cranes—Classification—Part 1: General. International Organization for Standardization: Geneva, Switzerland, 2016.
- FEM 9.511; Rules for the Design of Series Electric Motors for Lifting Appliances. Fédération Européenne de la Manutention: Brussels, Belgium, 1989.
- Rücker, A.; Rief, J.; Fottner, J. An Investigation of Mean Energy Demand, Performance and Reference Cycles for Stacker Cranes. FME Trans. 2020, 48, 307–312. [Google Scholar] [CrossRef]
- Jerman, B.; Zrnić, N.; Jenko, M.; Lerher, T. Energy Regeneration in Automated High-Bay Warehouse with Stacker Cranes. Teh. Vjesn. 2017, 24, 1411–1416. [Google Scholar] [CrossRef]
- Kosucki, A.; Stawiński, Ł.; Malenta, P.; Zaczyński, J.; Skowrońska, J. Energy Consumption and Energy Efficiency Improvement of Overhead Crane’s Mechanisms. Eksploat. Niezawodn. 2020, 22, 322–330. [Google Scholar] [CrossRef]
- Céspedes-Cubides, A.; Jradi, M. A Review of Building Digital Twins to Improve Energy Efficiency in the Building Operational Stage. Energy Inform. 2024, 7, 13. [Google Scholar] [CrossRef]
- Khattak, S.; Oates, M.; Greenough, R. Towards Improved Energy and Resource Management in Manufacturing. Energies 2018, 11, 1006. [Google Scholar] [CrossRef]
- Therkelsen, P.; Rao, P.; Sholes, D.; McKane, A.; Nimbalkar, S.; Meffert, B.; Green, R. The Value of Regression Models in Determining Industrial Energy Savings. In Proceedings of the ECEEE Industrial Summer Study, Berlin, Germany, 12–14 September 2016; pp. 389–399. [Google Scholar]
- Davydenko, L.; Davydenko, V.; Davydenko, N.; Sprake, D. Monitoring of Energy Efficiency of District Heating System Facilities: Methodology for Determining the Energy Baseline. Probl. Reg. Energetics 2022, 53, 68–83. [Google Scholar] [CrossRef]
- Li, Y.; Li, S.; Zhang, Q.; Xiao, B.; Sun, Y. Application of Big Data Technology in Ship-to-Shore Quay Cranes at Smart Port. Infrastructures 2022, 7, 73. [Google Scholar] [CrossRef]
- Zajac, P. Energy Consumption of Transfer Points in Passive and Plus-Energy Warehouses—A Systemic Approach to Internal Transport. Sustainability 2025, 17, 9419. [Google Scholar] [CrossRef]
- ISO 50001; Energy Management Systems—Requirements with Guidance for Use. International Organization for Standardization: Geneva, Switzerland, 2018.
- ISO 14040; Environmental Management—Life Cycle Assessment—Principles and Framework. International Organization for Standardization: Geneva, Switzerland, 2006.
- Dong, Q.; Hu, S.; Xu, G.; Nan, F.; Qi, Q. Digital Twin System Construction Method for Evaluating Load-Carrying Capacity of Crane Structures. Comput. Integr. Manuf. Syst. 2024, 30, 837–851. [Google Scholar] [CrossRef]
- ISO 14044; Environmental Management—Life Cycle Assessment—Requirements and Guidelines. International Organization for Standardization: Geneva, Switzerland, 2006.
- Daniel, J.; Kulkarni, H.; Mahajan, S.; Bhardwaj, S.; Rahman, H.; Agrawal, S. Enhancing Efficiency of Wind Farm Energy Using Digital Twin Technology. In Proceedings of the 15th International Conference on Computing Communication and Networking Technologies (ICCCNT 2024), Kamand, India, 24–28 June 2024; IEEE: Kharagpur, India, 2024. [Google Scholar] [CrossRef]
- Sobowale, A.; Freitas, L.; Lima, A.; Marujo, P.; Pereira, F.; Lopes, H. Leveraging the ISO 23247 Framework for the Development of Digital Twins of Stacker Cranes. In Innovations in Industrial Engineering III; Lecture Notes in Mechanical Engineering; Springer: Cham, Switzerland, 2024; pp. 36–50. [Google Scholar] [CrossRef]
- Fotland, G.; Haskins, C.; Rølvåg, T. Trade Study to Select Best Alternative for Cable and Pulley Simulation for Cranes on Offshore Vessels. Syst. Eng. 2020, 23, 177–188. [Google Scholar] [CrossRef]
- Ba, L.; Tangour, F.; El, A.I.; Absi, R. Analysis of Digital Twin Applications in Energy Efficiency: A Systematic Review. Sustainability 2025, 17, 3560. [Google Scholar] [CrossRef]
- Thakare, P.; Chandra, S.; Singh, B.; Rahate, V.; Agrawal, P.; Malik, M. Digital Twins in Renewable Energy Systems: Enhancing Efficiency Projecting Sustainability. In Leveraging AI for Innovative Sustainable Energy: Solar, Wind and Green Hydrogen; IGI Global: Hershey, PA, USA, 2025; pp. 123–137. [Google Scholar] [CrossRef]
- Hamacher, M.; Boehner, J.; Reger, A. Identifying Energy Efficiency Potentials by Applying Flexible Measuring Systems. Appl. Mech. Mater. 2014, 655, 47–52. [Google Scholar] [CrossRef]
- Świątek, M.; Imbault, F. Better Energy Management by Implementing an Energy Measurement and Monitoring Plan. In Proceedings of the 17th IEEE International Conference on Environment and Electrical Engineering (EEEIC/I & CPS Europe 2017), Milan, Italy, 6–9 June 2017; IEEE: New York, NY, USA, 2017. [Google Scholar] [CrossRef]
- Dunning, J. Importance of ISO 50001 to an Energy Manager. In Proceedings of the World Energy Engineering Congress (WEEC 2013), Marrakech, Morocco, 9–14 June 2013; pp. 215–223. [Google Scholar]
- Therkelsen, P.; Siciliano, G.; Scheihing, P. Establishing a Platform to Harmonize ISO 50001 Energy Performance Improvement Measurement and Verification Protocols. In Proceedings of the ECEEE Industrial Summer Study, Berlin, Germany, 11–13 June 2018; pp. 301–312. [Google Scholar]
- Bosi, A.; Grizzetti, A.; Silvestri, M.; Villanueva, C. Determine the Efficiency Frontier of a Manufacturing Factory through a Data-Driven Approach. IFAC-PapersOnLine 2022, 55, 779–784. [Google Scholar] [CrossRef]
- Repo, A.; Montonen, J.; Sizonenko, V.; Lindh, P.; Pyrhönen, J. Energy Efficiency of Hoisting Motors. In Proceedings of the 2014 International Conference on Electrical Machines (ICEM 2014), Berlin, Germany, 2–5 September 2014; pp. 144–149. [Google Scholar] [CrossRef]
- Shuangchang, F.; Jun, Q.; Jiai, X.; Jie, C. Research on Method of Checking and Measuring Energy Utilization Efficiency for Quayside Container Crane. In Proceedings of the 3rd International Conference on Electron Device and Mechanical Engineering (ICEDME 2020), Suzhou, China, 1–3 May 2020; IEEE: Guangzhou, China, 2020; pp. 410–413. [Google Scholar] [CrossRef]
- Manner, J.; Lindroos, O.; Arvidsson, H.; Nordfjell, T. Evaluation of a New Energy Recycling Hydraulic Lift Cylinder for Forwarders. Croat. J. For. Eng. 2016, 37, 219–231. [Google Scholar]
- Weihrauch, M.; Turek, K.; Hofmann, W.; Schmidt, T. Optimierte Bahnplanung für Regalbediengeräte in Hochregallagern (Optimized Trajectory Planning for Stacker Cranes in High Racking Systems). ETG-Fachbericht 2021, 164, 49–55. Available online: https://www.vde.com/resource/blob/2002642/526b56583335bb015c1f8e10a847ce3f/vde-antriebssysteme2021-tagungsband-inhalt-download-data.pdf (accessed on 8 December 2025).
- Braun, M.; Furmans, K. Evaluation of Simulation Models for Forecasting the Energy Demand of Stacker Cranes with Empirically Collected Data. Logist. J. 2016. [Google Scholar] [CrossRef]
- Kłodawski, M.; Jachimowski, R.; Chamier-Gliszczyński, N. Analysis of the Overhead Crane Energy Consumption Using Different Container Loading Strategies in Urban Logistics Hubs. Energies 2024, 17, 985. [Google Scholar] [CrossRef]
- Ertl, R.; Günthner, W. Meta-Model for Calculating the Mean Energy Demand of Automated Storage and Retrieval Systems. Logist. J. 2016. [Google Scholar] [CrossRef]
- Zhao, N.; Fu, Z.; Sun, Y.; Pu, X.; Luo, L. Digital-Twin-Driven Energy-Efficient Multi-Crane Scheduling and Crane Number Selection in Workshops. J. Clean. Prod. 2022, 336, 130175. [Google Scholar] [CrossRef]
- Tong, Y.; Zhao, R.; Ye, W.; Li, D. Research on Energy Efficiency Evaluation for Overhead Crane. Kybernetes 2016, 45, 788–797. [Google Scholar] [CrossRef]
- Levy, M. Life Cycle Analysis—Strengths and Limitations of LCA. In Encyclopedia of Sustainable Technologies; Elsevier: Amsterdam, The Netherlands, 2017; pp. 233–236. [Google Scholar] [CrossRef]
- Curran, M. Life-Cycle Assessment. In Encyclopedia of Ecology, 2nd ed.; Elsevier: Amsterdam, The Netherlands, 2019; pp. 359–366. [Google Scholar] [CrossRef]
- Osman, A.; Ries, R. Life Cycle Assessment of Electrical and Thermal Energy Systems for Commercial Buildings. Int. J. Life Cycle Assess. 2007, 12, 308–316. [Google Scholar] [CrossRef]
- AG Cranes Ltd. How Much Current Does an Overhead Crane Use? 2023. Available online: https://www.agcranes.com/product/how-much-current-does-an-overhead-crane-use/ (accessed on 20 August 2025).
- Liebherr. Energy Efficiency Calculator for Cranes. 2022. Available online: https://www.liebherr.com/en-us/earthmoving/information-sales/energy-efficiency-calculator-6354607 (accessed on 20 August 2025).
- WINDCRANE. Power Monitoring Solutions for Cranes. 2022. Available online: https://www.windcrane.com/?srsltid=AfmBOorHaU_010O6ovzP68LfPw9JiwZuzvBH-6GUBiFBibHObftIax8x (accessed on 20 August 2025).
- Toyota Material Handling. VDI Cycle Analysis—Case Study for Forklifts. 2021. Available online: https://media.toyota-forklifts.eu/published/32071_Original%20document_toyota%20mh.pdf (accessed on 20 August 2025).
- Demag Cranes. Energy Recovery Systems in Crane Drives. 2023. Available online: https://www.demagcranes.com/en-us/industries/powerenergy (accessed on 20 August 2025).
- Konecranes. Crane Modernisation and Energy Efficiency Whitepaper. 2020. Available online: https://www.konecranes.com/en-us/service/modernization/modernizing-your-crane (accessed on 20 August 2025).
- Chandra, R.; Kumar, V.; Tripathi, S.; Sharma, P. Phytoremediation of Industrial Pollutants and Life Cycle Assessment. In Phytoremediation of Environmental Pollutants; CRC Press: Boca Raton, FL, USA, 2017; pp. 441–470. [Google Scholar] [CrossRef]
- Barbashov, N.; Polyantseva, A. Reducing the Energy Consumption of Lifting Machines. E3S Web of Conf. 2024, 525, 03015. [Google Scholar] [CrossRef]
- Zhang, Y.; Li, H.; Chen, X.; Wang, J. A Parameterized Model for Tower Crane Energy Consumption Based on Theoretical Formulation and Field Data. Sci. Rep. 2025, 15, 10453. [Google Scholar] [CrossRef]
- Karaman, Ö.S. The Limitations of LCA Methodology towards Sustainable Construction Materials. Lect. Notes Civ. Eng. 2018, 6, 102–113. [Google Scholar] [CrossRef]
- Inyim, P.; Zhu, Y. A Framework for Integrated Analysis of Building Designs Using a Life-Cycle Assessment and Energy Simulation. In Proceedings of the 2013 International Conference on Construction and Real Estate Management (ICCREM 2013), Karlsruhe, Germany, 10–11 October 2013; pp. 316–327. [Google Scholar] [CrossRef]
- Zajac, P. System logistyczny magazynu do składowania stali. Nowocz. Hale 2018, 2, 50–53. [Google Scholar]
- Cheng, R.; Zhang, W.; Yang, J.; Wang, S.; Li, L. Analysis of the Effects of Different Driving Cycles on the Driving Range and Energy Consumption of BEVs. World Electr. Veh. J. 2025, 16, 124. [Google Scholar] [CrossRef]
- ISO 8178; Reciprocating Internal Combustion Engines—Exhaust Emission Measurement. International Organization for Standardization: Geneva, Switzerland, 2017.
- JIS TS B 0024; Guidelines for Standardization and Specification Writing. Japanese Standards Association (JSA): Tokyo, Japan, 2012.
- Genorma. Genorma Standards Database. 2025. Available online: https://genorma.com/en/ (accessed on 20 August 2025).
- Polish Committee for Standardization (PKN). Official Website. 2025. Available online: https://www.pkn.pl/en (accessed on 20 August 2025).
- Verein Deutscher Ingenieure e.V. VDI—Verein Deutscher Ingenieure. 2025. Available online: https://www.vdi.de/ (accessed on 20 August 2025).
- EN 16796; Energy Efficiency of Industrial Trucks—Test Methods. European Committee for Standardization: Brussels, Belgium, 2016.
- EN 17038-1; Hydraulic Fluid Power—Test Methods for Pumps and Motors—Part 1: Cavitation Erosion Test. European Committee for Standardization (CEN): Brussels, Belgium, 2019.
- Schudeleit, T.; Züst, S.; Wegener, K. Methods for Evaluation of Energy Efficiency of Machine Tools. Energy 2015, 93, 1964–1970. [Google Scholar] [CrossRef]
- Polska Grupa Energetyczna Spółka Akcyjna. Vacuum Grab for Large-Sized Panes. Patent PL 230844, 28 August 2018. [Google Scholar]
- Zajac, P.; Skoczynski, W.; Romanowicz, W. Studies of Properties of RFID Tags Used in Mechatronic and Logistic Systems. In Proceedings of the 25th International Conference Engineering Mechanics, Svratka, Czech Republic, 13–16 May 2019; pp. 415–418. [Google Scholar]
- Zajac, P.; Kwasniowski, S. The Reliability Problems of Reading RFID Tags in Logistics Warehouse Systems. In MATEC Web of Conferences; EDP Sciences: Paris, France, 2017; p. 05012. [Google Scholar]
- Zajac, P.; Kowalczyk, L. Comprehensive Service of Conference Participants Using Automatic Identification. In Proceedings of the 23rd International Conference Engineering Mechanics, Svratka, Czech Republic, 15–18 May 2017; pp. 1–4. [Google Scholar]
- Zajac, P.; Kwasniowski, S. Reliability of Automatic Identification Systems in Logistics Systems. In Proceedings of the 23rd International Conference Engineering Mechanics, Svratka, Czech Republic, 15–18 May 2017; pp. 15–18. [Google Scholar]
- Zajac, P. Evaluation of Automatic Identification Systems According to ISO 50001:2011. In Proceedings of the International Conference on Automation, Gothenburg, Sweden, 24–28 August 2015; Springer International Publishing: Cham, Switzerland, 2015; pp. 345–355. [Google Scholar]
- Bujak, A.; Zajac, P. Monitoring of Cargo in Logistic Systems of Transport and Storage. In Proceedings of the International Conference on Transport Systems Telematics, Katowice, Poland, 23–26 October 2013; Springer: Berlin/Heidelberg, Germany, 2013; pp. 361–369. [Google Scholar]
- IEEE Std 519-2014; IEEE Recommended Practices and Requirements for Harmonic Control in Electrical Power Systems. IEEE: New York, NY, USA, 2014. Available online: https://standards.ieee.org/standard/519-2014.html (accessed on 20 August 2025).
- Takalani, R.L.E.; Masisi, L. Development of an Optimal Port Crane Trajectory for Reduced Energy Consumption. Energies 2023, 16, 7172. [Google Scholar] [CrossRef]
- Tang, G.; Li, M.; Fang, Z.; Shen, C.; Qi, Y.; Zhen, Z.; Zhao, Z. Efficiency and Energy Consumption of the Automated Container Yard with Twin Rail-Mounted Gantry Cranes Considering Crane Scheduling Strategies and Handshake Area Designs. Simul. Model. Pract. Theory 2024, 135, 102981. [Google Scholar] [CrossRef]
- Brzeziński, M.; Pyza, D.; Archutowska, J.; Budzik, M. Method of Estimating Energy Consumption for Intermodal Terminal Loading System Design. Energies 2024, 17, 6409. [Google Scholar] [CrossRef]


Disclaimer/Publisher’s Note: The statements, opinions and data contained in all publications are solely those of the individual author(s) and contributor(s) and not of MDPI and/or the editor(s). MDPI and/or the editor(s) disclaim responsibility for any injury to people or property resulting from any ideas, methods, instructions or products referred to in the content. |
© 2025 by the author. Licensee MDPI, Basel, Switzerland. This article is an open access article distributed under the terms and conditions of the Creative Commons Attribution (CC BY) license (https://creativecommons.org/licenses/by/4.0/).