Abstract
Innovation in the new energy industry serves not only as a key accelerator for the global green and low-carbon energy transition but also as a core driving force of the ongoing energy revolution. This study utilizes data on publications, patents, and the spatial distribution of representative innovation enterprises in the new energy industry of the Yangtze River Delta urban agglomeration from 2009 to 2023 to construct a multilayer science–technology–industry innovation network. Social network analysis is employed to examine its evolutionary dynamics and structural characteristics, and the Quadratic Assignment Procedure (QAP) is used to investigate the factors shaping intercity innovation linkages. The results reveal that the multilayer innovation network has continuously expanded in scale, gradually forming a multi-core radiative structure with Shanghai, Nanjing, and Hangzhou at the center. At the cohesive subgroup level, the scientific and technological layers exhibit clear hierarchical differentiation, where core cities tend to engage in strong mutual collaborations, while the industrial layer shows a hub-and-spoke pattern combining large, medium, and small cities. In terms of layer relationships, the centrality of the scientific layer increasingly surpasses that of the technological and industrial layers. Inter-layer degree correlations and overlaps also display a strengthening trend. Furthermore, differences in regional higher education scale, urban economic density, and geographic proximity are found to exert significant influences on scientific, technological, and industrial innovation linkages among cities. In response, this study recommends enhancing the leadership role of core cities, leveraging the bridging and intermediary functions of peripheral cities, and promoting application-driven cross-regional innovation collaboration, thereby building efficient science–technology–industry networks and enhancing intercity innovation linkages and the flow of innovation resources, and ultimately promoting the high-quality development of the regional new energy industry.
1. Introduction
Against the backdrop of global climate change and carbon reduction targets, new energy sources that are renewable, clean, and widely available not only alleviate the supply pressure of fossil fuels but also accelerate the green and low-carbon transition in key sectors such as industry, transportation, and construction, thereby steering the global economy toward a more sustainable and efficient trajectory [1,2,3]. Major economies worldwide have elevated the development of the new energy industry to the level of national strategy, continuously promoting the adoption of clean energy through policy incentives, capital investment, and international cooperation [4,5]. As the world’s largest energy consumer and importer, China is actively building a new energy system centered on renewable energy sources, with strong emphasis on industries such as photovoltaics, wind power, and hydrogen energy [6]. In the knowledge economy era, the competitiveness of the new energy industry is increasingly driven by innovation rather than by resource endowments, labor, or capital, making innovation a decisive factor in shaping global and regional competitiveness [7].
Nevertheless, high investment costs, technological risks, and long innovation cycles pose persistent challenges to the high-quality development of the new energy industry worldwide [8]. In China, these challenges are reflected in heavy dependence on core technologies, a gap between basic research and market demand, and fragmented major technological breakthroughs [9]. Such issues highlight the urgent need to foster deep integration among scientific research, technological development, and industrial application to achieve systematic innovation. At the spatial level, cities serve as the primary vehicles for innovation activities, forming interconnected networks across the stages of scientific, technological, and industrial innovation [10]. The flow of resources and knowledge spillovers among cities drives the aggregation and diffusion of regional innovation capabilities, shaping the spatial patterns of new energy innovation [11]. Therefore, identifying the structural characteristics of the new energy innovation network, as well as the intercity linkages and functional roles of cities within it, is an important pathway to enhancing the industrial competitiveness of China’s new energy industry.
Research on the relationship between science, technology, and industry has evolved from linear to non-linear perspectives. Early studies largely treated innovation as a unidirectional process, flowing from basic research to technological development and finally to industrial application [12]. This linear model is evident in the development of the new energy industry. For example, the initial spread of photovoltaic and wind power technologies was often seen as a step-by-step change from basic research to technological development and ultimately to market application [13]. With the development of complexity science, researchers have increasingly recognized that these interactions are far from linear [14]. Non-linear frameworks, such as chain-linked and helix models, highlight multidirectional interactions and circulation among science, technology, and industry [15,16]. As a technology-driven industry, the new energy industry particularly aligns with this non-linear innovation paradigm. For instance, basic research on new energy materials is often guided by industrial applications, while technological breakthroughs can prompt new scientific inquiry [17]. These studies highlight the importance of continuous interplay among science, technology, and industry, yet most research relies on case studies to analyze the interaction mechanisms, while studies adopting quantitative methods and network analysis remain relatively rare.
Regarding the research on new energy innovation networks, existing studies have primarily focused on specific fields and on networks driven by the flow of single innovation elements. For example, Hu F et al. examined the structural characteristics of China’s photovoltaic technology innovation networks at multiple spatial scales [18], while W Li and X Zheng constructed an industry–university–research collaboration innovation network in China’s hydrogen energy and analyzed its evolutionary dynamics [19]. Similarly, Yi S et al. constructed an innovation network in China’s new energy industry and found that strengthening technological collaboration among enterprises with complementary capabilities effectively addresses complex technical challenges [20]. These studies generally relied on patent collaboration data to establish inter-city innovation linkages and employed Social Network Analysis (SNA) to uncover the topological characteristics of the new energy innovation networks, identify the functional roles of cities within the network, and spatiotemporal distribution characteristics of innovation activities. However, reliance on a single data dimension is insufficient to fully capture the complex structure of new energy innovation networks. Consequently, the study of multilayer innovation networks, which integrates multiple types of relational data, has recently emerged as a new research frontier. For example, Sun H et al. constructed knowledge, policy, and R&D member networks for green technology innovation in renewable energy enterprises and analyzed their effects on green technology innovation [21]. Regarding the driving factors of innovation networks, existing studies have primarily employed the Quadratic Assignment Procedure (QAP) or Exponential Random Graph Models (ERGMs) to examine determinants based on city attributes such as economic level, R&D investment, and administrative status, as well as intercity proximities including organizational, geographical, and cultural factors [22,23]. For example, Yuan Q et al. employ the exponential random graph model to investigate how the network structural, node, and edge attributes drive the formation of industry-university-research collaborative networks in China’s clean energy industry [24]. Overall, existing studies have provided essential references for this research, but certain limitations remain, and further exploration is needed. First, they overlook the heterogeneity of different innovation stages and therefore cannot fully capture the structural characteristics of new energy innovation networks. Second, research on new energy innovation from a multilayer network perspective remains relatively scarce and lacks studies on the driving factors of multilayer networks.
To make up for the above-mentioned deficiencies, this study divides the innovation process into three stages: scientific innovation, technological innovation, and industrial innovation. Scientific innovation, primarily conducted by universities, research institutes, and other research entities, drives the generation of original and disruptive ideas through basic research. Technological innovation builds upon scientific advances, encompassing the development of new technologies as well as the applied innovation of existing ones. Industrial innovation is primarily driven by representative innovative firms, focusing mainly on business model innovation and market-oriented innovation [25,26]. Based on this framework, a multilayer innovation network is constructed, using data from publications, patents, and the spatial distribution of representative innovation enterprises in the new energy industry. Then, the evolutionary dynamics and structural characteristics of the new energy innovation network were analyzed, and the Quadratic Assignment Procedure (QAP) was employed to examine the factors shaping intercity innovation linkages. Compared with the existing literature, this paper has the following marginal contributions: first, in terms of research perspective, this paper integrates a non-linear innovation framework into the new energy innovation network and conducts a quantitative analysis of their interrelationships among science, technology, and industry. Second, in terms of network construction, this paper characterizes different stages of new energy innovation using multi-dimensional data, providing a novel perspective for systematically understanding the structure and evolutionary dynamics of innovation networks in the new energy industry. Third, in terms of practical significance, the research results of this paper help to deepen the theoretical understanding of innovation networks in the new energy industry, but also provide empirical evidence for the interaction mechanisms among science, technology, and industry, offering practical insights for shaping regional innovation policies.
2. Materials and Methods
2.1. Study Area
The Yangtze River Delta urban agglomeration, located in eastern coastal China, is one of the country’s most developed, open, and innovation-oriented regions. According to the Yangtze River Delta Urban Agglomeration Development Plan released in May 2016, the region covers 26 cities across Shanghai, Jiangsu, Zhejiang, and Anhui, China, covering 211,700 km2 (Figure 1). In the 2024 ranking of “China’s Top 50 New Energy Cities,” 15 cities from the region were listed, reflecting the region’s national leadership in the industry. In the first half of 2024, the output value of the new energy industry in the Yangtze River Delta urban agglomeration exceeded CNY 1.2 trillion, representing a 28% year-on-year increase and 43% of the national total. This solid foundation positions the Yangtze River Delta urban agglomeration to become a world-class hub for new energy with strong international competitiveness.
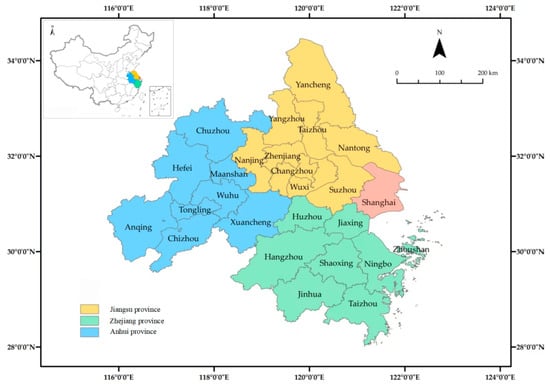
Figure 1.
Geographical Location of the Study Area.
2.2. Network Construction and Representation
Based on the study by Wu [27], the science-technology-industry innovation network can be represented as a three-layer structure. Each layer contains the same set of city nodes, with inter-layer edges linking identical cities across different layers and intra-layer edges representing cooperative relationships among cities within the same layer. Specifically, the scientific layer is denoted as α, the technological layer as β, and the industrial layer as γ. The overall network framework is illustrated in Figure 2.
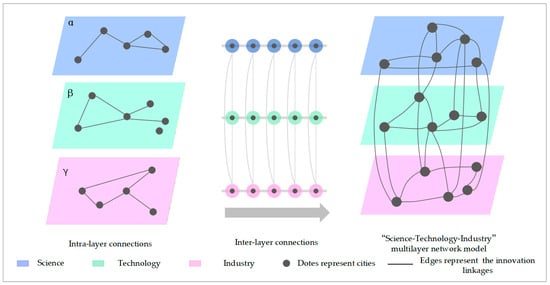
Figure 2.
Science-Technology-Industry Multilayer Network Framework.
The multilayer network can be represented by a supra-adjacency matrix . Here, denotes the set of intra-layer adjacency matrices [28], where represents the adjacency matrix of layer α. denotes the set of nodes in layer , with node denoted as , and denotes the set of intra-layer edges. The inter-layer network is expressed as , where represents the inter-layer connections between layers α and β, and denotes the set of inter-layer edges linking two layers. Accordingly, the general form of the multi-layer network can be expressed as:
The supra-adjacency matrix is represented as:
2.3. Network Structural Indicators
2.3.1. Network Evolution Indicators and Node Centrality
Following previous studies, six network-level metrics-number of nodes, number of edges, network density, network diameter, average path length, and average clustering coefficient—were used to analyze the network’s dynamic evolution. Four centrality measures—degree, closeness, betweenness, and eigenvector-were employed to quantify node positions and assess their importance or influence within the network topology. Detailed calculation methods are provided in the cited references [29,30].
2.3.2. Layer Centrality
Following the layer centrality calculation method proposed by Chen [31]. The multilayer network is first aggregated into a single-layer network [32]. The adjacency matrix of the aggregated network is denoted as , where the values of are defined as follows:
Next, the betweenness centrality of each edge in the aggregated network is calculated using the following formula:
In Equation (4), denotes the betweenness centrality of the edge e connecting nodes i and j in the aggregated network, denotes the total number of shortest paths between node i and j, denotes the total number of shortest paths between nodes i and j that pass through edge e.
Subsequently, the betweenness centrality of each edge in the aggregated network is evenly distributed across all layers, as defined by the following formula:
In Equation (5), denotes the betweenness centrality of edge e in layer k, and M represents the total number of layers containing edge e.
Finally, the sum of the betweenness centrality of all edges within each layer is taken as the centrality of that layer, calculated as follows:
In Equation (6), denotes the centrality of the layer k.
2.3.3. Layer Degree Correlation
The degree correlation across layers is an indicator used to measure the correlation between the degree sequences of different layers [33]. In this study, the Pearson correlation coefficient is employed to quantify the layer degree correlation, which is calculated as follows:
In Equation (7), denotes the degree of the city i in layer α, and represents the average degree of all cities in layer α.
2.3.4. Layer Overlap
Layer overlap is an indicator used to measure the similarity of connection structures across different layers. It is quantified by calculating the proportion of edges shared between two nodes across layers, which is computed as follows:
In Equation (8), L denotes the maximum number of edges across all network layers, and T represents the total number of network layers.
2.4. Research Hypotheses and Model Specification
2.4.1. Research Hypotheses
The development of innovation networks in the new energy industry is strongly influenced by urban attributes and resource endowments [34]. Accordingly, this study examines how differences across six dimensions (economy, education, industrial structure, informatization, openness, and geographical proximity) shape the formation of inter-city innovation linkages in the new energy industry.
First, economic development provides the material foundation for innovation, determining cities’ capacities to invest in R&D, attract high-quality innovation resources, and support the industrialization of key new energy technologies such as photovoltaics, wind power, and energy storage. Prior studies also indicate that regions with pronounced economic disparities tend to experience weaker innovation collaboration due to mismatched absorptive capacities [35]. Based on this, the following hypothesis is proposed:
H1:
Significant differences in urban economic development levels hamper the formation of scientific, technological, and industrial innovation linkages.
Second, the scale of higher education determines the availability of research talent, which is essential for technological breakthroughs and the diffusion of new energy technologies [36]. Cities with substantial gaps in educational scale often exhibit divergent innovation capabilities [37]. Thus, the following hypothesis is proposed:
H2:
Significant differences in regional higher education scales hamper the formation of scientific, technological, and industrial innovation linkages.
Third, industrial diversification enhances the potential for cross-sector knowledge recombination, particularly across the energy, materials, and advanced manufacturing domains, thereby contributing to stronger regional innovation synergies [38]. However, substantial disparities in industrial structures can limit complementarities and reduce inter-city collaboration. Based on this, the following hypothesis is proposed:
H3:
Significant differences in regionalindustrial structure hamper the formation of scientific, technological, and industrial innovation linkages.
Fourth, openness reflects connectivity with domestic and international markets and resources, which affects knowledge inflows, capital circulation, and participation in regional innovation networks [39]. Based on this, the following hypothesis is proposed:
H4:
Significant differences in the degree of openness hamper the formation of scientific, technological, and industrial innovation linkages.
Fifth, Informatization determines the efficiency of knowledge exchange, data interoperability, and digital coordination, which is increasingly critical for the development and demonstration of new energy technologies [40]. Based on this, the following hypothesis is proposed:
H5:
Significant differences inthe informatization level hamper the formation of scientific, technological, and industrial innovation linkages.
Sixth, although digital technologies reduce spatial constraints, geographical proximity continues to play a critical role in fostering trust, reducing collaboration costs, and enabling coordinated deployment of demonstration projects, pilot plants, and equipment logistics [41]. Based on this, the following hypothesis is proposed:
H6:
Geographic proximity between cities facilitates the formation of scientific, technological, and industrial innovation linkages.
2.4.2. Model Specification
Based on the above six dimensions, this study employs the Quadratic Assignment Procedure (QAP) to investigate the factors shaping intercity linkages in scientific, technological, and industrial innovation, and constructs the following model:
In Equation (9), denotes the dependent relational matrices, while ED, ES, etc., represent the independent difference matrices. The variable names and measurement methods are presented in Table 1.

Table 1.
Variable Definitions and Measurement Method.
2.5. Research Data
The scientific innovation network is primarily shaped by intercity research collaborations and can be represented through co-publications. This study refers to the definition of the new energy industry in the Catalogue of Strategic Emerging Industries in China and integrates the research topics of existing literature as well as commonly used classifications in the energy field to ensure the selected keywords are appropriate and sufficiently comprehensive for the new energy industry. First, search keywords were defined as follows: solar energy (photovoltaics, solar thermal devices), wind energy (wind power), nuclear energy (nuclear power, nuclear fuel), geothermal energy, marine energy (tidal, tidal current, wave, and ocean thermal energy), biomass energy (biogas), hydrogen energy (hydrogen fuel), smart grids, and coal-based new fuels. Second, these terms were applied to the “title, keyword, or topic” fields in the CNKI and WOS databases, and publications were retrieved for three periods: 2009–2013, 2014–2018, and 2019–2023. After deduplication, a total of 13,036 papers were obtained.
The technological innovation network is primarily shaped by intercity technology collaborations and can be represented by co-patents. Using the IncoPat Global Patent Database, the emerging industry classification for “new energy industry (category 6)” was selected. The following search query was then applied: ((INDUSTRY2 = 6) AND (AP-ALL = ((City A) AND AP-ALL = (City B))) AND (AD = [start year TO end year])), resulting in a total of 15,244 patents.
The industrial innovation network is primarily driven by the spatial distribution of representative innovation firms and can be modeled using their “headquarters–branch” structure [42]. First, the lists of the world’s top 500 new energy companies in 2013, 2018, and 2023 were collected. Second, firms headquartered in the Yangtze River Delta urban agglomeration were selected. Finally, information on subsidiaries, branches, and offices with more than 50% equity ownership, including their establishment and closure dates, was collected from company websites and commercial databases, yielding the intercity distribution of leading innovative enterprises across the three periods.
Data for the QAP analysis were obtained from the China Statistical Yearbook, the China Science and Technology Statistical Yearbook, and the statistical yearbooks of individual cities and provinces. Missing values were supplemented using interpolation methods.
3. Results
3.1. Evolution Characteristics of the Multilayer Innovation Network
Network visualization is a crucial approach for revealing network structures and analyzing their evolutionary processes. Firstly, the data were imported into Gephi 0.10.1 to compute the evolutionary metrics of the scientific, technological, and industrial layer networks across three periods: 2009–2013 (Stage I), 2014–2018 (Stage II), and 2019–2023 (Stage III), with the results summarized in Table 2. Then, using the VOSviewer 1.6.20 visualization software, the evolutionary processes of the scientific, technological, and industrial networks across the three stages were mapped (Figure 3).
Table 2.
Descriptive Statistics of the Evolution Characteristics of the Multilayer Innovation Network.
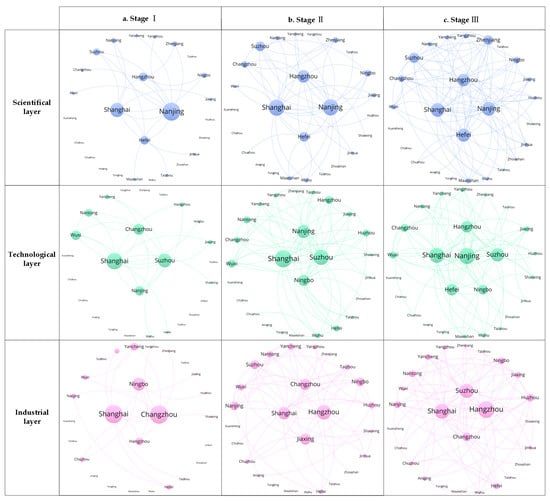
Figure 3.
Process of Multilayer Innovation Network Evolution.
As shown in Table 2 and Figure 3, the scientific layer exhibited significant expansion from Stage I to Stage III. The number of nodes increased from 16 to 23, while the number of edges surged from 22 to 93, resulting in a rise in network density from 0.07 to 0.29. This trend indicates that academic collaborations among cities in the field of new energy research have intensified, driving the continuous enlargement of the innovation network. Concurrently, the average clustering coefficient increased from 0.67 to 0.82, and the average path length declined from 2.05 to 1.67, suggesting that any two nodes could be connected through relatively short paths. These changes underscore the increasingly pronounced small-world property and the progressive consolidation of the network structure.
Between Stage I and Stage II, the technological layer underwent substantial expansion, with the number of nodes, edges, and network density increasing by factors of 1.77, 2.79, and 3, respectively. However, the increase in network diameter (from 3 to 4) and average path length (from 1.80 to 1.95), along with a decrease in the average clustering coefficient (from 0.77 to 0.66), suggest that the expansion of the network scale did not enhance node connectivity efficiency. Instead, many newly added nodes exhibited single-point attachment characteristics. By Stage III, as intercity cooperative relationships diversified, the overall network structure became progressively optimized.
In the industrial layer, the degree of agglomeration in the Yangtze River Delta new energy industry rose sharply from Stage I to Stage II. Resource sharing and collaboration among enterprises along the new energy industry chain facilitated the establishment of numerous innovation linkages between cities. From Stage II to Stage III, the pace of network expansion slowed somewhat. Nevertheless, across the entire period, the average path length decreased from 2.55 to 1.84, while the average clustering coefficient increased markedly from 0.23 to 0.65, indicating improved network accessibility and enhanced responsiveness.
3.2. Node Characteristics of the Multilayer Innovation Network
3.2.1. Analysis of the Node Centrality
As shown in Figure 4, the node centrality of the multilayer innovation network exhibits significant hierarchical and regional disparities, further highlighting cross-layer heterogeneity in which individual cities occupy distinct centrality positions across the scientific, technological, and industrial dimensions.
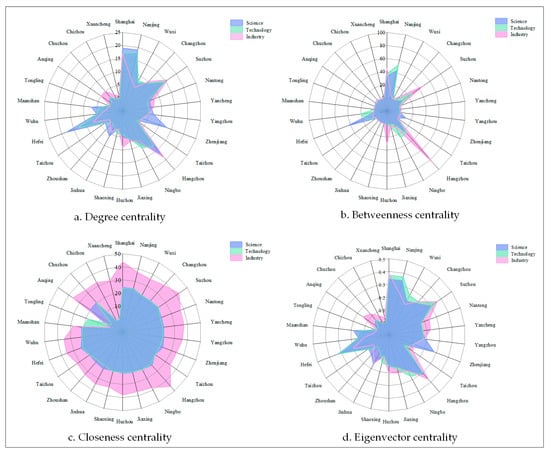
Figure 4.
Node Centrality of the Multilayer Innovation Network in Stage III.
In the scientific layer, Shanghai, Nanjing, and Hefei record the highest degree centrality values (19, 19, and 18, respectively), along with elevated betweenness and closeness scores. This indicates that these cities function as primary hubs, controlling a substantial share of knowledge flows and information diffusion. Hangzhou and Suzhou, although slightly lower in degree, display relatively high levels of eigenvector centrality, suggesting strong connections with other well-linked nodes. By contrast, several Anhui cities (e.g., Tongling, Chizhou, Xuancheng) are weakly embedded or absent, reflecting their peripheral status in scientific collaboration.
In the technological layer, Nanjing attains the highest degree centrality (18) and the greatest betweenness centrality (52.63), underscoring its bridging role in intercity technological collaboration. Shanghai and Suzhou also register high centrality values, confirming their positions as major hubs within the technological innovation network. Hangzhou, Ningbo, and Suzhou form a secondary cluster of highly connected nodes, whereas most Anhui cities, aside from Hefei, occupy marginal positions, indicating limited integration into the technological innovation network.
In the industrial layer, Hangzhou, Suzhou, and Shanghai achieve the highest degree centrality values (19, 16, and 17, respectively). Hangzhou’s betweenness centrality (86.63) and Suzhou’s (47.12) are substantially higher than those of other cities, highlighting their critical roles in mediating industrial linkages and resource flows across the region. In contrast, most Anhui cities, including Anqing, Chuzhou, Chizhou, and Xuancheng, exhibit very low centrality values, revealing an uneven spatial distribution of industrial cooperation.
Taken together, these findings demonstrate a clear layer-specific centrality structure: Shanghai, Nanjing, and Hefei dominate the scientific and technological layers, while Suzhou and Hangzhou emerge as pivotal nodes in the industrial layer. Such patterns underscore the differentiated functional roles of provincial regions, with Shanghai holding comparative advantages in research and technology, Jiangsu and Zhejiang displaying strong agglomeration effects in industrial collaboration.
3.2.2. Analysis of the Cohesive Subgroup
In this study, the CONCOR algorithm implemented in Ucinet was applied to divide nodes of the multilayer innovation network into four subgroups in stage III, using a maximum split depth of 2 and a convergence criterion of 0.2. The results are reported in Table 3.
Table 3.
Subgroup Division Results.
In the scientific and technological layers, the distribution of subgroups reveals pronounced hierarchical stratification among cities. In contrast, the industrial layer exhibits a hierarchical hub-and-spoke structure, where economically advanced or regional hub cities act as central nodes, and medium- and small-sized cities serve as satellite nodes. Within the scientific layer, Subgroups I and II are dominated by core cities, whereas Subgroups III and IV are composed of smaller cities with relatively loose internal structures, underscoring the uneven agglomeration of innovation resources. In the technological layer, the scale of core-oriented subgroups expands. The industrial layer, by contrast, displays a more dispersed subgroup structure. Subgroup IV is the largest, encompassing several globally leading new energy enterprises such as Risen Energy, Huaguang Environmental & Energy, and Jiangsu Zhenjiang New Energy Equipment.
A cross-layer comparison further demonstrates that Nanjing and Hefei consistently belong to core subgroups in the scientific and technological layers but shift to the Changzhou-centered subgroup in the industrial layer, whereas Chizhou and Huzhou remain peripheral in the scientific and technological layers yet ascend to core subgroups in the industrial layer.
3.3. Layer Characteristics of the Multilayer Innovation Network
3.3.1. Analysis of the Layer Centrality
As shown in Table 4, the scientific layer gradually surpasses both the technological and industrial layers in centrality, indicating that linkages established through scientific innovation increasingly serve as the primary driver of overall network structure. Meanwhile, supported by recent policies from the Chinese government, leading enterprises along the industrial chain have rapidly clustered in the Yangtze River Delta, fostering the gradual formation of intercity industrial collaboration networks and contributing to a steady rise in the centrality of the industrial layer. By contrast, the technological layer exhibits relatively lower centrality, indicating its weaker role in sustaining overall network connectivity.
Table 4.
Layer Centrality Evolution.
3.3.2. Analysis of the Degree Correlation Across Layers
As shown in Table 5, the degree correlations across layers increase consistently, indicating a growing convergence of core cities’ positions within the multilayer innovation network of the new energy industry. Specifically, the degree correlations increase from 0.63 to 0.90 between scientific and technological layers, from 0.46 to 0.72 between scientific and industrial layers, and from 0.66 to 0.78 between technological and industrial layers. Notably, the correlation is highest between the scientific and technological layers, whereas it is relatively low between the scientific and industrial layers, indicating that cities exhibit certain differences in their node attributes across these two layers.
Table 5.
Evolution of Degree Correlation across Layers.
3.3.3. Analysis of the Overlap Across Layers
As shown in Table 6, the proportion of shared edges across different layers increases steadily, indicating that the connection structures of the scientific, technological, and industrial layers are becoming more similar. Specifically, the overlap rises from 0.46 to 0.71 between scientific and technological layers, from 0.32 to 0.53 between scientific and industrial layers, and from 0.33 to 0.58 between technological and industrial layers. Moreover, the three-layer overlap increases from 0.21 to 0.43, highlighting the systemic integration of science, technology, and industry within the innovation network of the new energy industry.
Table 6.
Evolution of Layer Overlap.
3.4. Analysis of the Driving Factors
QAP correlation and regression analyses were conducted using UCINET 6.186 with 10,000 random permutations, and the results are presented in Table 7.
Table 7.
Results of the QAP Analysis on Multilayer Innovation Networks.
As shown in Table 7, differences in urban economic density (ED), differences in regional higher educational scale (ES), differences in industrial structure (IND), and geographic proximity (GE) are significantly correlated with the intercity linkages of the scientific and technological layers. For the industrial innovation network, significant correlations are observed with differences in urban economic density (ED), educational level (ES), and informatization level (INF). In contrast, differences in openness (OP) exhibit no significant correlation with any of the three networks.
The regression results indicate that urban economic density has a significantly negative effect on intercity linkages, significant at the 5% level, suggesting that economically advanced cities are better positioned to facilitate scientific, technological, and industrial innovation cooperation. Less-developed cities, constrained by limited talent pools, small market sizes, and insufficient demand, encounter greater obstacles to the flow of innovation factors compared with more developed counterparts. These findings provide support for H1; The regional higher educational scale is one of the key factors influencing intercity innovation linkages. It exerts a significant negative influence; cities with a larger regional higher educational scale tend to form like-with-like partnerships, which significantly limit linkage opportunities for lower-tier cities, leaving them in structural holes and excluded from core networks. These findings provide support for H2. Differences in industrial structure also impede intercity innovation linkages, with significant negative effects on both scientific (1% significance level) and technological (5% significance level) innovation networks, indicating that industrial structural mismatches hinder the alignment of innovation resources. These findings provide partial support for H3. The level of informatization has differentiated effects on intercity scientific and technological innovation linkages. Compared with scientific innovation cooperation, technological innovation cooperation places higher demands on the timeliness of information and requires prompt access to the latest technological frontiers and market dynamics. Otherwise, information silos may emerge, hindering intercity innovation linkages. These findings provide partial support for H5. Finally, geographic proximity fosters both intercity technological and industrial linkages by reducing cooperation costs and facilitating tacit knowledge spillovers. These findings provide partial support for H6.
4. Conclusions and Policy Recommendations
4.1. Conclusions
Based on the data of publications, patents, and the spatial distribution of representative innovative firms in the new energy industry, this study constructs a multilayer science–technology–industry innovation network of the Yangtze River Delta urban agglomeration. Using Social Network Analysis (SNA) and Quadratic Assignment Procedure (QAP), the research investigates both the structural characteristics and the driving factors. The main conclusions are as follows:
First, the Yangtze River Delta urban agglomeration has experienced substantial strengthening of intercity linkages across scientific, technological, and industrial innovation stages, with cities displaying a clear hierarchical differentiation in network positions. Evolutionary analysis across these three layers indicates that network scale, density, average path length, and clustering coefficient have all been optimized to varying degrees. A multi-centric radiation system has gradually emerged, with Shanghai, Nanjing, and Hangzhou forming the core. Cities such as Suzhou, Hefei, and Changzhou exhibit high centrality within the science–technology–industry innovation network, reflecting their advantages across multiple layers, whereas non-core cities like Wuhu and Huzhou serve indispensable intermediary roles. These findings provide valuable insights for the innovative development of the global new energy industry, suggesting that cities with relatively weaker economic influence can still integrate into regional innovation networks and act as key nodes at specific stages of innovation.
Second, with respect to layer structural features, the scientific and technological layers exhibit pronounced hierarchical differentiation, as core cities tend to adopt strong mutual collaborations. By contrast, the industrial layer presents a hub-and-spoke pattern that integrates large, medium, and small cities. The hub role of the scientific layer has become increasingly evident, with its centrality rising to the foremost position. Degree correlations and overlaps across layers have shown a notable upward trend, with the strongest linkages found between the scientific and technological layers, while the ties between the scientific and industrial layers remain relatively weak.
Third, in terms of influencing factors, differences in economic density and higher educational scale significantly restrict intercity innovation linkage in science, technology, and industry. Differences in industrial structure hinder scientific and technological intercity innovation linkages. Differences in the level of informatization can promote intercity scientific innovation linkages but inhibit intercity technological innovation linkages. Furthermore, geographical proximity reduces factor flow costs and thus positively promotes intercity technological and industrial innovation linkages.
4.2. Policy Recommendations
Based on the existing research findings, this paper proposes the following policy recommendations, which also provide several insights for the development of the new energy industry worldwide.
First, the radiative role of core cities within the innovation network should be leveraged to enhance their agglomeration and diffusion effects. For example, in this study, core cities such as Shanghai, Nanjing, and Hangzhou should take the lead in establishing cross-regional joint laboratories for new energy, common-technology R&D platforms, and collaborative innovation centers for the new energy industry, thereby promoting the sharing of major research infrastructures, interoperability of data resources, and mobility of high-level talents. Meanwhile, other cities should leverage their industrial cluster advantages in offshore wind power, photovoltaic industry, and hydrogen energy by developing mechanisms for mutual recognition of technical standards, co-construction of application scenarios, and integration of supply chains, thereby promoting coordinated regional development. Such measures would facilitate the bidirectional flow of innovation elements between core and peripheral cities, enabling cities to more fully integrate into a new energy innovation network. Such measures, which can also be applied and adapted to other regions worldwide, would facilitate the bidirectional flow of innovation elements between core and peripheral cities, enabling cities to more fully integrate into a science-technology-industry innovation network of the new energy industry.
Second, the advantages of different regions’ resource endowments and innovation factors should be fully considered to identify more targeted and differentiated development pathways. Peripheral cities can serve as “bridges” and “intermediaries” within the innovation network by developing specialized industries, such as technology transfer services and pilot-scale testing bases. By strategically embedding themselves within industrial and innovation chains, these cities can effectively capture technology spillovers. For example, in this study, other small and medium-sized cities can leverage land resource advantages to host new energy equipment manufacturing capacities originating from Shanghai, Suzhou, and Hangzhou, while complementing the production of specialized components such as photovoltaic ribbons and wind turbine towers. Additionally, peripheral cities should establish virtual innovation communities online and offshore R&D centers offline to implement a “research conducted elsewhere, commercialization localized” innovation model. This development model can promote differentiated, city-specific development strategies and reduce inefficient homogeneous competition.
Third, an application-driven innovation model should be promoted to enhance the efficiency of science–technology–industry collaborative innovation. For example, in this study, governments across the Yangtze River Delta can introduce relevant policy incentives to guide leading new energy enterprises in forming cross-regional innovation alliances, integrating upstream and downstream industrial partners, universities, and research institutes, thereby establishing a full-chain incubation system encompassing applied R&D, engineering validation, and commercial deployment. At the same time, comprehensive innovation support systems should be developed, including talent exchange hubs, patent navigation, and industrial incubation services, while exploring cross-regional initiatives such as technology commercialization benefit-sharing mechanisms, collaborative frameworks for industry–university–research partnerships, and joint intellectual property protection centers, to continuously stimulate endogenous innovation capacity across cities. This innovation model can likewise be extended to other regions worldwide.
5. Limitations and Prospects
This paper also has some research limitations. First, this study utilizes publications, patents, and the spatial distribution of representative innovation enterprises to represent scientific, technological, and industrial innovation activities. However, these data may not fully capture the full scope of such activities, and future research should further enrich and refine the knowledge carriers of scientific, technological, and industrial innovation activities. Meanwhile, although the keywords used for retrieving publications on new energy are relatively comprehensive, some omissions may still exist, which should be further supplemented in future research. Second, the multilayer innovation network model employed simplifies cross-layer interactions and may not fully capture the complex dynamic coupling among science, technology, and industry in the new energy industry, which warrants further investigation in future research. Third, this study focuses on the Yangtze River Delta urban agglomeration. While the policy recommendations may offer valuable insights for other regions worldwide, the findings primarily reflect the regional characteristics of the new energy industry and cannot be fully generalized to other regions or sectors, which need to be further supplemented in future research.
Author Contributions
S.W.: Supervision, Validation. S.M.: Writing—review & editing. L.X.: Data curation. F.L.: Conceptualization, Software. All authors have read and agreed to the published version of the manuscript.
Funding
This research was funded by the National Social Science Foundation of China, grant number 25AKX001.
Data Availability Statement
Data available on request from the authors. The data that support the findings of this study are available from the corresponding author, F.L., upon reasonable request.
Acknowledgments
The authors gratefully acknowledge numerous colleagues who reviewed and helped refine earlier versions of this article.
Conflicts of Interest
The authors declare no conflicts of interest.
References
- Griffiths, S.; Sovacool, B.K.; Kim, J.; Bazilian, M.; Uratani, J.M. Industrial decarbonization via hydrogen: A critical and systematic review of developments, socio-technical systems and policy options. Energy Res. Soc. Sci. 2021, 80, 102208. [Google Scholar] [CrossRef]
- Horzela-Miś, A.; Semrau, J.; Wolniak, R.; Grebski, W.W. Energy Transformation in the Construction Industry: Integrating Renewable Energy Sources. Energies 2025, 18, 2363. [Google Scholar] [CrossRef]
- Zhang, W.; Tan, N.; Ma, T. Mechanisms for the Low-Carbon Transition of Public Transport Energy Systems: Decoupling Emissions and Energy Consumption in Inner Mongolia and the Path to Three-Chain Synergy. Energies 2025, 18, 4817. [Google Scholar] [CrossRef]
- IEA. World Energy Investment 2024; International Energy Agency (IEA): Paris, France, 2024; Available online: https://www.iea.org/reports/world-energy-investment-2024 (accessed on 15 May 2025).
- Su, C.W.; Khan, K.; Umar, M.; Zhang, W. Does renewable energy redefine geopolitical risks? Energy Policy 2021, 158, 112566. [Google Scholar] [CrossRef]
- Wang, Y.; Chen, H.; Liu, M.; Zhou, M.; Liu, L.; Zhang, Y. Decoding the Developmental Trajectory of the New Power System in China via Bibliometric and Visual Analysis. Energies 2025, 18, 4809. [Google Scholar] [CrossRef]
- Li, D.X.; Ge, A.D. New energy technology innovation and sustainable economic development in the complex scientific environment. Energy Reports 2023, 9, 4214–4223. [Google Scholar] [CrossRef]
- Wu, Z.; Fan, X.; Zhu, B.; Xia, J.; Zhang, L.; Wang, P. Do government subsidies improve innovation investment for new energy firms: A quasi-natural experiment of China’s listed companies. Technol. Forecast. Soc. Change 2022, 175, 121418. [Google Scholar] [CrossRef]
- Wang, S.W.; Guo, R.; Wang, S.B. Research on the coordinated evolution and influencing factors of energy resilience and scientific and technological innovation in China. China Soft Sci. 2025, 1, 208–224. (In Chinese) [Google Scholar]
- Asheim, B.T.; Smith, H.L.; Oughton, C. Regional innovation systems: Theory, empirics and policy. Reg. Stud. 2011, 45, 875–891. [Google Scholar] [CrossRef]
- Xiong, W.; Li, J. The knowledge spillover effect of multi-scale urban innovation networks on industrial development: Evidence from the automobile manufacturing industry in China. Systems 2023, 12, 5. [Google Scholar] [CrossRef]
- Leydesdorff, L.; Rotolo, D.; de Nooy, W. Innovation as a nonlinear process, the scientometric perspective, and the specification of an ‘innovation opportunities explorer’. Technol. Anal. Strateg. Manag. 2013, 25, 641–653. [Google Scholar] [CrossRef]
- Sovacool, B.K.; Sawin, J.L. Creating technological momentum: Lessons from American and Danish wind energy research. Whitehead J. Dipl. Int’l Rel. 2010, 11, 43. [Google Scholar]
- Lewis, P. The innovation systems approach: An Austrian and Ostromian perspective. Rev. Austrian Econ. 2021, 34, 97–114. [Google Scholar] [CrossRef]
- Micaëlli, J.P.; Forest, J.; Coatanéa, E.; Medyna, G. How to improve Kline and Rosenberg’s chain-linked model of innovation: Building blocks and diagram-based languages. J. Innov. Econ. Manag. 2014, 15, 59–77. [Google Scholar] [CrossRef]
- Koutsouris, A.; Zarokosta, E. Supporting bottom-up innovative initiatives throughout the spiral of innovations: Lessons from rural Greece. J. Rural Stud. 2020, 73, 176–185. [Google Scholar] [CrossRef]
- Oktik, Ş. The Holy Triangle of Science, Technology and Industry for Photovoltaic Solar Energy Conversion. In Renewable Energy Based Solutions; Uyar, T.S., Javani, N., Eds.; Springer International Publishing: Cham, Switzerland, 2022; pp. 51–80. [Google Scholar]
- Hu, F.; Mou, S.; Wei, S.; Qiu, L.; Hu, H.; Zhou, H. Research on the evolution of China’s photovoltaic technology innovation network from the perspective of patents. Energy Strategy Rev. 2024, 51, 101309. [Google Scholar] [CrossRef]
- Li, W.; Zheng, X. Development mechanism and technological innovation of hydrogen energy: Evaluating collaborative innovation based on hydrogen patent data. Int. J. Hydrogen Energy 2024, 52, 415–427. [Google Scholar] [CrossRef]
- Yi, S.; Jiaxing, G.; Wenjing, W. A research on the evolution of cooperative innovation network of new energy industry based on multi-dimensional proximities. Sci. Res. Management 2021, 42, 67–74. (In Chinese) [Google Scholar]
- Sun, H.; Yan, Y.; Han, Y. The influencing factors of green technology innovation in renewable energy companies based on hyper-network. Energy Inform. 2024, 7, 66. [Google Scholar] [CrossRef]
- Yang, X.; Zhu, L. Spatial correlation network of China’s carbon emissions and its influencing factors: Perspective from social network analysis. J. Clean. Prod. 2025, 516, 145671. [Google Scholar] [CrossRef]
- Zinilli, A.; Gao, Y.; Scherngell, T. Structural dynamics of inter-city innovation networks in China: A perspective from TERGM. Netw. Spat. Econ. 2024, 24, 707–741. [Google Scholar] [CrossRef]
- Yuan, Q.; Chen, H.; Liu, C. Formation drivers and evolutionary dynamics of industry-university-research collaborative networks in China’s clean energy industry. Systems 2025, 13, 173. [Google Scholar] [CrossRef]
- Coccia, M. Disruptive firms and industrial change. J. Econ. Soc. Thought 2018, 4, 437–450. [Google Scholar]
- Liu, J.; He, B.; Fang, Y.; Cai, S.Y.; Sun, W.Y. Research on the global urban innovation network spatial pattern based on three innovative stages. Urban Dev. Stud. 2024, 31, 101–108. (In Chinese) [Google Scholar]
- Wu, Z.N.; Di, Z.; Fan, Y. The structure and function of multilayer networks: Progress and prospects. J. Univ. Electron. Sci. Technol. China 2021, 50, 106–120. (In Chinese) [Google Scholar]
- McClean, K.; Greer, D.; Jurek-Loughrey, A. Social network analysis of open source software: A review and categorisation. Inf. Softw. Technol. 2021, 130, 106442. [Google Scholar] [CrossRef]
- Amure, R.; Agarwal, N. A comparative evaluation of social network analysis tools: Performance and community engagement perspectives. Soc. Netw. Anal. Min. 2025, 15, 1. [Google Scholar] [CrossRef]
- Bloch, F.; Jackson, M.O.; Tebaldi, P. Centrality measures in networks. Soc. Choice Welf. 2023, 61, 413–453. [Google Scholar] [CrossRef]
- Chen, X.; Lu, Z.M. Measure of layer centrality in multilayer network. Int. J. Mod. Phys. C 2018, 29, 1850051. [Google Scholar] [CrossRef]
- Battiston, F.; Nicosia, V.; Latora, V. Structural measures for multiplex networks. Phys. Rev. E 2014, 89, 032804. [Google Scholar] [CrossRef]
- Boccaletti, S.; Bianconi, G.; Criado, R.; Del Genio, C.I.; Gómez-Gardenes, J.; Romance, M.; Sendiña-Nadal, I.; Wang, Z.; Zanin, M. The structure and dynamics of multilayer networks. Phys. Rep. 2014, 544, 1–122. [Google Scholar] [CrossRef] [PubMed]
- Wang, X.; Li, B.; Yin, S.; Zeng, J. Formation mechanism for integrated innovation network among strategic emerging industries: Analytical and simulation approaches. Comput. Ind. Eng. 2021, 162, 107705. [Google Scholar] [CrossRef]
- Tang, Y.; Chen, Y.; Wang, K.; Xu, H.; Yi, X. An analysis on the spatial effect of absorptive capacity on regional innovation ability based on empirical research in China. Sustainability 2020, 12, 3021. [Google Scholar] [CrossRef]
- Yu, S.; Zhang, S.; Yuizono, T. Exploring the influences of innovation climate and resource endowments through two types of University–Industry collaborative activities on regional sustainable development. Sustainability 2021, 13, 7559. [Google Scholar] [CrossRef]
- Wen, F.; Yang, S.; Huang, D. Heterogeneous human capital, spatial spillovers and regional innovation: Evidence from the Yangtze River Economic Belt, China. Humanit. Soc. Sci. Commun. 2023, 10, 365. [Google Scholar] [CrossRef]
- Chen, Y.; Guo, C. Industrial Diversification, Entrepreneurship, and Urban Economic Resilience. Systems 2025, 13, 366. [Google Scholar] [CrossRef]
- Wen, J.; Zhou, Y. Trade openness and urban green innovation: A dual perspective based on financial agglomeration and human capital accumulation. Sustain. Futures 2025, 9, 100478. [Google Scholar] [CrossRef]
- Li, C.; Wen, M.; Jiang, S.; Wang, H. Assessing the effect of urban digital infrastructure on green innovation: Mechanism identification and spatial-temporal characteristics. Humanit. Soc. Sci. Commun. 2024, 11, 320. [Google Scholar] [CrossRef]
- Santamaría, L.; Nieto, M.J.; Rodríguez, A. Failed and successful innovations: The role of geographic proximity and international diversity of partners in technological collaboration. Technol. Forecast. Soc. Change 2021, 166, 120575. [Google Scholar] [CrossRef]
- Ma, H.; Wei, Y.D.; Huang, X.; Zhang, W. The innovation networks shaped by large innovative enterprises in urban China. J. Geogr. Sci. 2023, 33, 599–617. [Google Scholar] [CrossRef]
Disclaimer/Publisher’s Note: The statements, opinions and data contained in all publications are solely those of the individual author(s) and contributor(s) and not of MDPI and/or the editor(s). MDPI and/or the editor(s) disclaim responsibility for any injury to people or property resulting from any ideas, methods, instructions or products referred to in the content. |
© 2025 by the authors. Licensee MDPI, Basel, Switzerland. This article is an open access article distributed under the terms and conditions of the Creative Commons Attribution (CC BY) license (https://creativecommons.org/licenses/by/4.0/).