Abstract
This study undertakes a detailed computational examination of a direct refrigerant cooling approach for a 50 Ah prismatic lithium iron phosphate (LiFePO4) battery. We conducted a systematic assessment to determine how the cooling plate’s topological layout and flow orientation influenced key performance indicators, namely thermal homogeneity, heat removal efficiency, and hydraulic pressure loss. Utilizing a validated two-phase flow model with 1,1,1,2-Tetrafluoroethane (R134a), simulations were performed on six distinct serpentine channel designs under a wide range of operating scenarios, covering variations in mass flow rate, saturation temperature, and inlet vapor quality. The simulation data revealed a strong correlation between the cooling plate’s geometric parameters and the system’s thermal behavior. In terms of uniformity, the optimized Case 6 configuration significantly outperformed Case 2, achieving a 76% improvement by narrowing the maximum mid-plane temperature difference from 2.02 °C down to 0.48 °C. A trade-off was observed regarding the mass flow rate: while higher rates lowered the peak temperature by approximately 18%, they simultaneously led to increased hydraulic pressure loss and slight non-uniformity. Similarly, decreasing the saturation temperature improved heat extraction but exacerbated flow resistance. Notably, this study identified an inlet vapor quality of 0.1 as the optimal point for maximizing temperature uniformity. These insights provide a robust theoretical foundation for optimizing the design and operation of compact direct refrigerant-based BTMSs.
1. Introduction
Lithium-ion batteries (LIBs) serve as fundamental energy storage units in electric vehicles (EVs). Their operational safety, cycle life, and overall performance are intrinsically governed by their thermal characteristics [1,2,3]. In addition, the electrochemical performance and stability of LIBs are strongly influenced by their material composition, particularly cathode chemistry [4]. To ensure electrochemical stability and mitigate aging effects, industrial standards typically mandate that traction batteries function within a strict thermal window, optimally between 15 °C and 25 °C, while the maximum cell-to-cell temperature difference should remain below 5 °C [5,6,7]. Temperatures approaching 40 °C are considered highly undesirable due to accelerated aging, increased internal resistance, and heightened thermal-safety risks. These strict thermal and safety requirements highlight the necessity of designing a high-efficiency and reliable battery thermal management system (BTMS) capable of maintaining uniform and well-controlled temperature distributions during various operating conditions [8,9,10].
To meet these requirements, various cooling strategies have been developed for EV battery systems, including air cooling [11,12,13], liquid cooling [14,15,16], phase-change material (PCM) cooling [17,18,19], and direct refrigerant cooling (DRC) [20,21,22]. Although air-based cooling systems are valued for their cost-effectiveness and structural simplicity, they are often constrained by insufficient heat dissipation rates. Conversely, liquid cooling has emerged as the dominant solution in modern EV applications, driven by its enhanced controllability and superior thermal transfer efficiency [23,24]. PCM-assisted cooling can reduce transient temperature fluctuations but cannot provide sustained heat dissipation under prolonged high-load conditions.
As battery capacity, power density, and fast-charging requirements continue to increase, conventional air- and liquid-based BTMSs face limitations in both heat-transfer capability and structural integration [25]. To overcome these challenges, direct refrigerant cooling (DRC) has attracted growing research interest. By allowing the refrigerant to evaporate directly in the cooling plate, DRC eliminates intermediate heat-transfer media and takes advantage of the large latent heat of vaporization, significantly improving cooling efficiency. In addition, DRC can be integrated with the vehicle heat pump or air-conditioning loop, reducing system size and improving overall energy efficiency [26,27]. Shen et al. [20] demonstrated through system-level simulation that a refrigerant-based BTMS effectively restrains rises in battery temperature and maintains good uniformity even under high ambient temperatures. Guo et al. [21] further proposed a refrigerant-based system capable of both heating and cooling without additional auxiliary components, showing fast heating under sub-zero ambient conditions.
A number of studies have explored optimization strategies for cooling plates in both liquid-cooled and refrigerant-cooled BTMSs. For liquid cooling, Ding et al. [28] analyzed the effects of the channel aspect ratio on hotspot evolution and temperature difference, while Wang et al. [29] investigated rib geometry using computational fluid dynamics (CFD) to improve heat transfer and pressure characteristics. Mohammad et al. [30] introduced hybrid microchannel configurations to enhance thermal uniformity in cylindrical-cell modules. For direct refrigerant cooling, Gao et al. [31] examined the influence of flow path and boiling conditions on rising temperature during 1C–3C discharge, and Min et al. [32] evaluated the effects of channel diameter and spacing on phase-change performance. Gao et al. [33] studied fin-type RCP structures and showed that channel geometry and refrigerant parameters jointly influence temperature uniformity and pressure drop. These studies demonstrate that structural optimization can enhance cooling effectiveness; however, many previous works focus mainly on geometric improvements or isolated operating factors. While liquid cooling currently dominates the EV market, the industry is advancing toward direct refrigerant cooling. Specifically, refrigerant cooling plates offer a superior solution by combining rapid heat removal with a compact, scalable design for better battery integration.
Comprehensive investigations that simultaneously consider refrigerant operating parameters—such as mass flow rate, saturation temperature, vapor quality, and subcooling degree—together with cooling-plate geometry remain limited, particularly for serpentine-channel configurations where flow distribution and boiling characteristics are strongly coupled. Thermal conditions critically impact electrical performance, as excessive heat or non-uniformity increases resistance and degradation [34]. Although this study focuses on thermal behavior, the enhanced temperature uniformity achieved by the optimized cooling plates implicitly supports improved electrochemical stability and efficiency.
To address this research gap, this study designs six serpentine-channel refrigerant cooling plate configurations and performs multi-physics numerical simulations to evaluate the combined effects of geometric parameters and refrigerant operating conditions. A two-phase thermal model using R134a, coupled with a validated NTGK–MSMD electrochemical heat-generation model, is employed to analyze temperature evolution, temperature uniformity, and flow resistance under various operating scenarios. The findings provide quantitative insights for optimizing cold-plate structures and matching refrigerant operating conditions, offering guidance for the development of efficient and safe next-generation refrigerant-based BTMSs for electric vehicles. The remainder of this manuscript is organized as follows: Section 2 introduces the numerical methods, modeling framework, and boundary conditions. Section 3 presents the results and discussion regarding geometric design, refrigerant parameters, and their influence on thermal performance. Section 4 summarizes the main conclusions.
2. Numerical Method
2.1. Physical Model
In this study, a LiFePO4 cell with a nominal capacity of 50 Ah was adopted as the fundamental research unit [35]. The cell dimensions are 180 mm × 135 mm × 30 mm, and its key physical and thermal properties are summarized in Table 1. LiFePO4 chemistry was selected due to its high thermal stability, long cycle life, and superior safety characteristics compared with other lithium-ion chemistries, making it particularly suitable for electric vehicle applications involving stringent thermal management requirements.

Table 1.
Parameters of the battery characteristics [35].
The investigated battery module is composed of four identical cells connected in parallel to ensure stable voltage output and high discharge capacity. To maintain appropriate temperature uniformity during operation, liquid cooling plates are symmetrically mounted on both sides of the module, thereby enabling efficient bidirectional heat removal. Between each cooling plate and the adjacent cell, a 1.5 mm thermal insulation pad is inserted to prevent electrical shorting and to regulate the heat flux distribution, ensuring safe and controlled thermal transfer. The overall structural layout of the module, including the cells, insulation layers, and liquid cooling plates, is depicted schematically in Figure 1a.
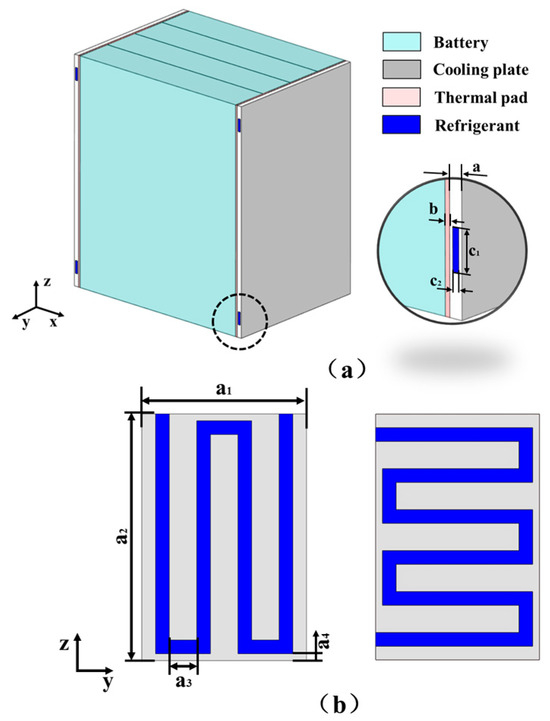
Figure 1.
Geometric model: (a) battery module and (b) cooling plate.
To investigate the impact of cooling plate geometry on the thermal behavior of the battery module, two types of liquid cooling plates with distinct flow channel arrangements were proposed. Table 2 outlines the specific geometric dimensions for the various configurations, and Figure 1b depicts the corresponding structural schematics. These designs aim to explore how variations in flow path topology affect coolant distribution, heat transfer efficiency, and temperature uniformity within the module.
Table 2.
Size table of the cooling plate.
Based on the two geometric configurations, six simulation cases were established to perform a systematic evaluation of the heat transfer performance under different flow orientations. Among them, Cases 3–6 share identical geometric features with Cases 1–3, respectively, but differ in the coolant flow direction, as illustrated in Figure 2. This approach enables a comparative assessment of how flow directionality influences thermal management effectiveness without introducing structural deviations.
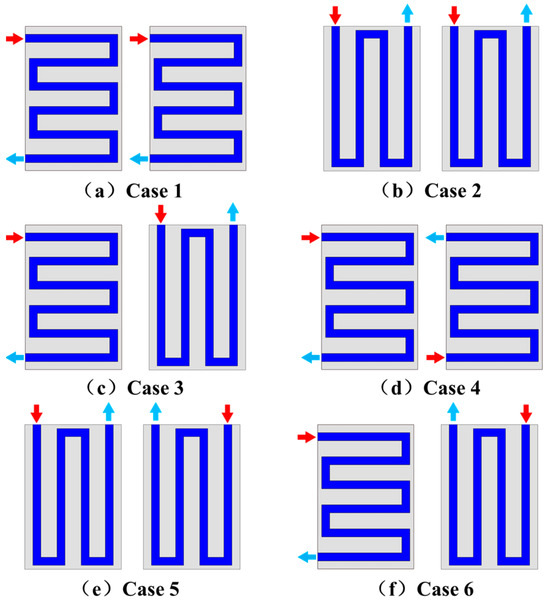
Figure 2.
Schematic diagrams of six serpentine-channel refrigerant cooling plate configurations.
2.2. Heat Generation Model of Battery
For a precise depiction of the prismatic LiFePO4 cell’s transient thermal dynamics, the volumetric heat generation source term was mathematically defined using the Newman–Tiedemann–Gu–Kim (NTGK) electrochemical model, integrated within the MSMD (multi-scale multi-domain) framework. This hybrid modeling strategy is computationally economical while effectively capturing the primary heat generation mechanisms inherent to lithium-ion batteries. This hybrid approach effectively captures the major heat-generation mechanisms of lithium-ion cells while maintaining computational efficiency suitable for module-level simulations. By utilizing experimental voltage–current data fitting, the NTGK formulation effectively reconstructs the primary heat sources, encompassing both reversible and irreversible components. This method provides a balance between physical accuracy and computational efficiency for cell heating analysis [35].
The transient energy balance for a single battery cell is expressed as follows:
In Equation (1), the symbols , and correspond to the battery cell’s effective density, specific heat capacity, and thermal conductivity, respectively. is the local cell temperature. Under normal operation, thermal-abuse and internal short-circuit heating are neglected, and .
According to the NTGK formulation, the total electrochemical heat generation qECh consists of two components: the irreversible (ohmic and polarization) losses and the reversible (entropic) heat associated with the entropy change during charge transfer. This can be expressed as follows:
Here, jECh signifies the volumetric rate of electrochemical current transfer (A·m−3). The variables U and V represent the open-circuit voltage and the local terminal voltage, respectively, while T denotes the absolute temperature (K) and dU/dT indicates the temperature coefficient of the OCV. The first term represents irreversible Joule and polarization heating, while the second term accounts for reversible (entropic) heat generation or absorption depending on the entropy change.
Within the NTGK–MSMD framework, the electrochemical current transfer rate is estimated from an empirical voltage–current relationship as follows:
where Vol is the active volume of the cell (m3), and are the nominal and reference capacities (Ah), and and are temperature-dependent empirical functions determined through experimental fitting. The difference between the positive and negative phase potentials yields the local terminal voltage, .
The depth of discharge (DOD) is used as the state variable and is defined as follows:
where denotes the local current density (A·m−2).
The fitted voltage–current characteristics are represented by temperature-dependent polynomial functions:
where and are regression coefficients determined from experimental voltage–current data, and are NTGK model constants, and is the reference temperature. The fitted and values are listed in Table 3 [36]. The fitted voltage–current characteristics and the associated NTGK parameters are directly adopted from the experimental results reported in Ref. [36], and no additional measurements were conducted in this study.
Table 3.
Fitting parameter values of the MSMD-NTGK model [36].
The ohmic and polarization losses are implicitly captured in the NTGK formulation via the electrical potential fields of the positive and negative electrodes. The local irreversible heat rate can be equivalently expressed as
where and denote the effective electrical conductivities of the positive and negative electrodes, and , are the corresponding phase potentials. These potential distributions are solved through the charge-conservation equation:
For standard discharge conditions without internal short-circuit effects, .
2.3. Governing Equations
To mathematically describe the thermal dynamics of the battery pack, coupled conductive and convective heat transfer mechanisms were resolved. Equation (9) governs the transient heat conduction within the solid components (cells, thermal pads, and plates):
In this equation, , , and k represent the density, specific heat capacity, and thermal conductivity along the principal axes (x, y, z), respectively, while q denotes the volumetric heat generation source term.
In this work, the refrigerant R134a is used as the coolant within the liquid cooling plate. R134a has long been applied in vehicle air-conditioning and thermal management systems due to its favorable thermophysical stability and established safety profile. Although emerging refrigerants such as R1234yf and CO2 exhibit lower global warming potential (GWP), R134a remains widely used in simulation studies for its extensive validation and mature property data. Its thermophysical properties, expressed as polynomial functions of temperature, are summarized in Table 4 [37].
Table 4.
Polynomial approximations of thermophysical properties for R134a [37].
The intricate multiphase interactions and heat-mass transfer processes of R134a within the micro-channels were simulated using the Volume of Fluid (VOF) scheme. This technique is specifically chosen for its ability to track the dynamic shifts in the liquid–vapor interface during phase transition. The governing equations for the two-phase flow can be expressed as [38]:
where and denote the liquid and vapor phase volume fractions, respectively; and are the corresponding densities; is the velocity vector; and , represent the mass transfer rates due to phase change.
The momentum conservation equation is written as
and the corresponding energy conservation equation is given by
where is the pressure, is the dynamic viscosity, keff is the effective thermal conductivity, and represents the energy source term due to latent heat exchange.
Modeling of the boiling heat transfer characteristics of R134a was achieved by implementing the Chen correlation [38]. This semi-empirical method superimposes two heat transfer mechanisms: single-phase macroscopic convection and microscopic nucleate boiling. Although originally developed for water and hydrocarbons, this semi-empirical approach has been validated for refrigerants such as R134a in microscale cooling channels. The overall heat transfer coefficient can be expressed as follows:
In this expression, denotes the heat transfer contribution from single-phase convection, while signifies the rate associated with two-phase nucleate boiling. The convective term, , is determined by the following equation:
The phase-change source term caused by liquid evaporation at overheated wall regions is expressed as
where is the local heat flux, and are the interfacial area and corresponding cell volume, and is the latent heat of vaporization.
Overall, the coupled VOF–Chen model framework enables accurate prediction of two-phase flow dynamics and boiling heat transfer behavior of R134a in the battery cooling channels, ensuring a realistic representation of the refrigerant-based BTMS performance.
2.4. Boundary Conditions and Mesh Independent Study
To achieve effective thermal regulation, the prismatic battery module is flanked by dual liquid cooling plates featuring serpentine micro-channels. A silicone thermal interface layer (1.5 mm thick) is interposed between the cooling surfaces and the battery cells to mitigate contact resistance and facilitate heat transfer. The specific thermophysical parameters for these components, derived from established literature, are tabulated in Table 5 [34,39].
Table 5.
Thermal properties of battery module components [35,40].
In the numerical simulation of both direct and indirect refrigerant cooling of the battery pack, the boundary conditions play a crucial role in determining the accuracy and physical fidelity of the predicted results. In addition to the conventional inlet and outlet flow conditions and the spatial heat generation profile within the cells, several key factors must be carefully defined, including the phase-change characteristics of the refrigerant, the wall surface roughness of the microchannels, and the local convective heat transfer coefficients. Phase transition has a significant influence on heat transfer efficiency, while wall roughness alters the flow field and enhances local convective effects. Furthermore, the interfacial heat transfer coefficient between the refrigerant and the cell surfaces critically affects the overall cooling performance. Therefore, the boundary conditions were specified with great care to ensure reliable and physically meaningful simulation results. The flow inside the microchannels was assumed to be laminar, as the Reynolds number under the investigated operating conditions remains below the critical threshold for turbulent transition.
A typical high-temperature application scenario for electric vehicles in summer was established by initializing both the battery and ambient temperatures at 40 °C, representing a typical high-temperature operating condition frequently used in EV thermal safety assessments. Such elevated temperatures may occur during fast charging, summer operation, or high-load driving. In addition, the refrigerant inlet temperature of 18 °C corresponds to the common evaporation temperature range of R134a in automotive air-conditioning and heat pump systems. A temperature difference of approximately 20 °C between the battery surface and the refrigerant is therefore consistent with real vehicle operation and necessary to ensure adequate heat absorption during high C-rate discharge. These settings are thus physically realistic and intentionally selected to test the robustness of the proposed cooling plate designs under demanding thermal conditions.
To balance computational cost with physical fidelity, the model incorporates specific simplifications: (1) simulation domain is restricted to the refrigerant fluid domain and the solid cooling plate structure; (2) heat generation is treated as spatially uniform throughout the battery cell volume; (3) solid material properties are assumed to be constant, neglecting temperature-dependent fluctuations; (4) given that the Reynolds number falls below the critical threshold, the flow regime within the microchannels is modeled as laminar; and (5) radiative heat transfer is deemed negligible, with only convection to the ambient air being considered.
Numerical stability and solution accuracy were secured through a rigorous meshing approach implemented in STAR-CCM+ 2020.3. The computational domain was discretized using unstructured elements. To precisely capture the heat transfer gradients at the fluid–structure interface, a prism layer consisting of five sub-layers was generated. Furthermore, considering the slender profile of the thermal pads, a specialized dual-layer thin-wall mesh was utilized to efficiently resolve their thermal conduction. The resulting mesh topology is visualized in Figure 3.
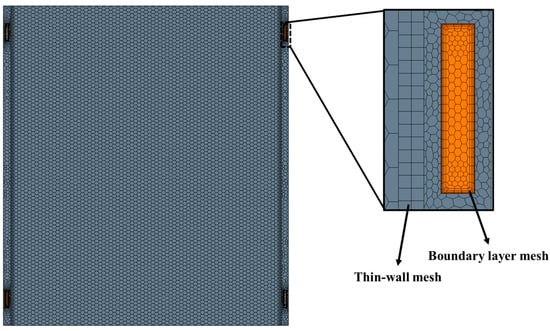
Figure 3.
Meshes of the full model and fluid–solid interface.
A grid independence test was then conducted to validate the reliability of the numerical model. Five mesh configurations were tested, with the total number of elements increasing from approximately 0.53 million to 8.58 million. The variation in maximum cell temperature and pressure drop across the cooling channel for each case is shown in Figure 4. It can be seen that as the mesh density increased, both parameters gradually converged toward stable values. When the total number of cells surpassed 2.14 million, the variation in temperature and pressure drop with grid numbers was kept consistent within 0.1% and 0.15% deviation for temperature and pressure drop, respectively. Considering both computational accuracy and efficiency, the grid containing about 2.14 million elements was selected for all subsequent simulations to ensure accurate representation of the coupled heat transfer and fluid flow behavior within the system.
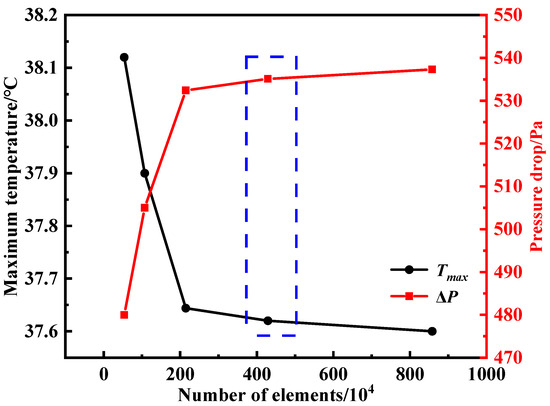
Figure 4.
Grid independence test showing the variation in maximum cell temperature and pressure drop with increasing mesh elements.
2.5. Numerical Validation
To verify the accuracy of the developed model, a single-cell heat generation model was established based on the experimental data reported in Ref. [35]. The simulation results were compared with the measured data, where all monitoring points were located on the front surface of the battery. Specifically, Point 1 was positioned at the center of the surface, while Points 2 and 3 were located 10 mm below the positive and negative tabs, respectively, as illustrated in Figure 5.
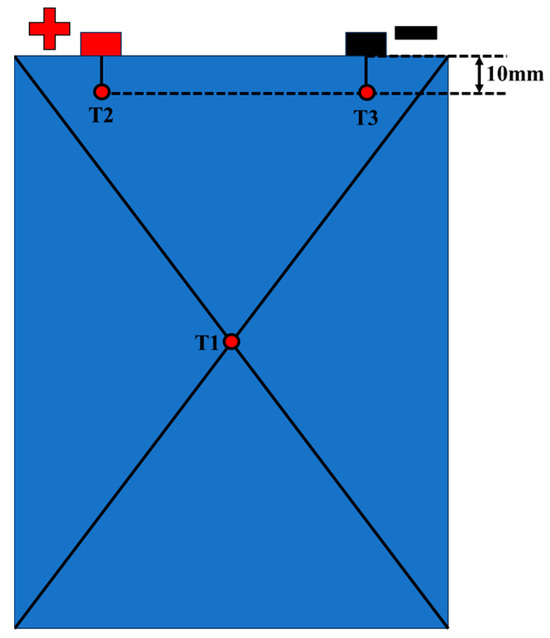
Figure 5.
Locations of temperature measurement points.
Figure 6 presents the comparison between the simulated and experimental temperatures at Points 1–3 under various discharge rates. As shown in Figure 6a–c, higher discharge rates led to increased surface temperatures and slightly larger deviations between simulation and experiment. The maximum discrepancies at Points 1, 2, and 3 occurred under the 3C discharge condition, all remaining below 10%. In all cases, Point 3 exhibited the highest temperature, followed by Point 2, whereas Point 1 at the center showed the lowest. This indicates that the surface region near the negative tab experiences a higher temperature compared to that near the positive tab, and both are hotter than the central area. Overall, the simulation results showed good agreement with the experimental measurements, confirming the accuracy of the discharge simulation and the reliability of the single-cell thermal model.
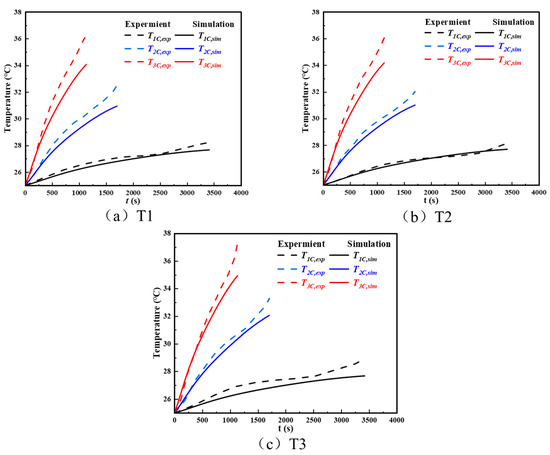
Figure 6.
Comparison between simulated and experimental temperature values [35] at different points.
The deviation observed in the later stage of discharge is likely caused by non-uniform current density and localized heating near the tabs in the experiment, whereas the NTGK–MSMD model assumes spatially uniform heat generation. Additional differences in sensor contact resistance may further contribute to the higher measured surface temperatures.
3. Results and Discussion
3.1. Effects of Cooling Plate Structural Parameter
To evaluate the thermal performance of the refrigerant direct-cooling BTMS under various flow channel configurations, six liquid cooling plate layouts were designed and analyzed under identical operating conditions, as illustrated in Figure 2. The battery module was discharged at a rate of 3C, with an inlet refrigerant mass flow rate of 10 kg/h. R134a was selected as the working fluid, injected at an inlet temperature of 18 °C, corresponding to a saturation pressure of 0.54 MPa and a vapor quality of 0.2. Regarding the thermal environment, a uniform temperature of 40 °C was applied to both the ambient air and the initial state of the battery cells. The influence of flow channel design on the module’s maximum temperature, temperature uniformity, and pressure drop was systematically investigated to reveal the governing trends of BTMS thermal behavior.
The time-dependent progression of the maximum and minimum temperatures is depicted in Figure 7. As shown in Figure 7a,b, the internal arrangement of the channels significantly affects the temperature distribution. The Case 2 layout exhibits the highest maximum temperature, while Case 4 achieves the lowest. Regarding the minimum temperature, Case 6 records the highest value, and Case 1 the lowest. It should be noted that Cases 1–3 and Cases 4–6 share identical geometric configurations but differ in the coolant flow direction within the plates. The reversed flow direction in Cases 4–6 leads to lower peak temperatures and higher minimum temperatures than in Cases 1–3, indicating a more uniform temperature field. As illustrated in Figure 7c, Case 2 shows the largest temperature difference (2.02 °C), whereas Case 4 achieves the smallest (0.48 °C), representing a 76% reduction. The temperature difference in Case 6 is slightly higher (0.68 °C), but still much lower than that of Case 2, demonstrating its superior thermal uniformity.
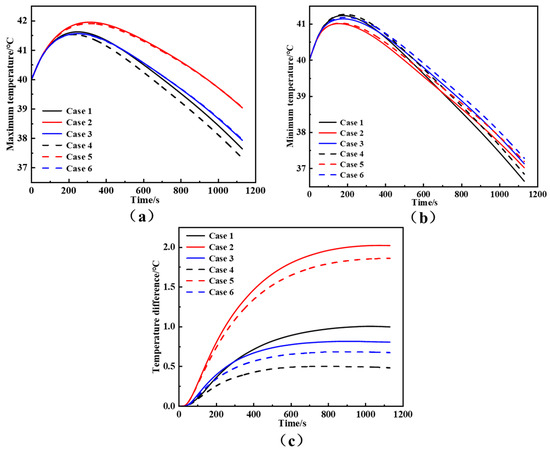
Figure 7.
Temporal evolution of mid-plane temperature characteristics for different cooling plate designs: (a) maximum temperature, (b) minimum temperature and (c) temperature difference of battery mid-plane.
The pressure drop results under different channel designs are summarized in Figure 8. Case 5 exhibits the lowest pressure drop (358 Pa) but suffers from poor temperature uniformity. In contrast, Case 4 shows the smallest temperature difference but a relatively high pressure drop (522 Pa). Case 6 provides an optimal balance, achieving a low temperature gradient with a moderate pressure drop of 395 Pa. Hence, Case 6 demonstrates the best overall performance when both thermal uniformity and flow resistance are considered.
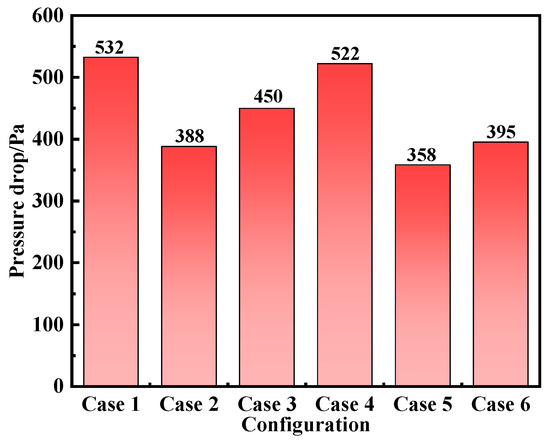
Figure 8.
Pressure drop comparison for different channel layouts.
Figure 9 further illustrates the mid-plane position and corresponding temperature contours of the module. A more detailed temperature distribution can be observed, showing that Cases 4 and 6 achieve the most uniform temperature fields, while Cases 2 and 5 exhibit extensive hot spots. These results are consistent with the quantitative temperature difference analysis.
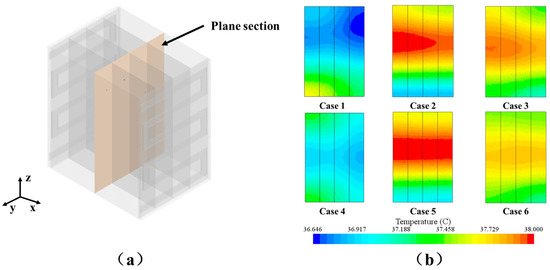
Figure 9.
(a) Mid-plane and (b) temperature contours for various channel configurations.
Figure 10 compares the velocity distributions under two distinct channel orientations of Case 6. It is evident that the flow and temperature distributions are closely correlated with the flow path arrangement. When the serpentine channel is aligned along the y-axis, a greater effective cooling area can be achieved under identical spacing, leading to enhanced temperature uniformity compared with the z-axis alignment. Moreover, intensified heat transfer is observed at the channel bends due to the formation of local secondary vortices. These vortices induce fluid mixing between the low-temperature core region and the high-temperature boundary layer, breaking the temperature stratification and promoting more efficient and homogeneous heat transfer.
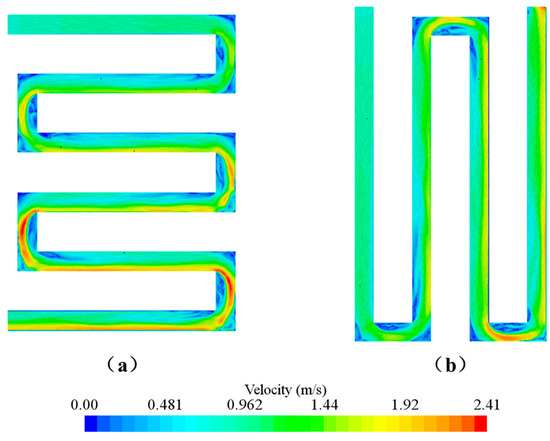
Figure 10.
Velocity contours in dual-sided cooling plates (Case 6): (a) left, (b) right.
3.2. Effect of Refrigerant Mass Flow Rate
The refrigerant mass flow rate in the battery cooling plate is a crucial parameter that directly determines the heat dissipation capability of the battery thermal management system (BTMS). In practical engineering applications, the BTMS often adjusts the refrigerant mass flow rate dynamically in response to transient variations in battery heat generation, such as by regulating the compressor speed or controlling the opening of the expansion valve. Therefore, investigating the influence of refrigerant mass flow rate on the thermal behavior of the battery module is of significant importance for the design and control of high-efficiency BTMSs. In this section, the refrigerant mass flow rate varied from 5 kg/h to 40 kg/h, while the C-rate of the battery discharge was kept constant at 3C. The refrigerant R134a entered the cooling plate at 18 °C with a vapor quality of 0.2. Both the initial and ambient temperatures were maintained at 40 °C.
As illustrated in Figure 11, the variations in peak and trough temperatures were monitored under different refrigerant mass flow rates. Simulation data reveals a substantial decline in the battery module’s bulk temperature as the refrigerant mass flow rate is elevated. Physically, this improvement stems from the augmented heat removal capability associated with higher flow rates, which ensures a sufficient supply of liquid refrigerant for effective phase-change heat transfer. Quantitatively, ramping up the flow rate from 5 kg/h to 40 kg/h lowered the peak discharge temperature from 40.2 °C to 32.9 °C. This corresponds to an approximate 18% reduction compared to the initial state, confirming that higher flow rates are instrumental in boosting the BTMS’s cooling efficacy.
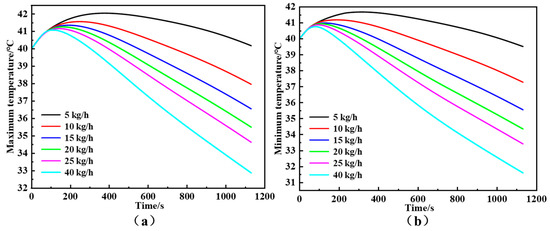
Figure 11.
(a) Maximum and (b) minimum temperatures at various refrigerant mass flow rates.
Figure 12 shows the variations in temperature difference across the battery mid-plane and the pressure drop in the cooling plate as functions of refrigerant mass flow rate. Observations indicate a progressive widening of the temperature difference, which escalated from 0.6 °C to 1.3 °C as the mass flow rate was ramped up from 5 kg/h to 40 kg/h. This trend can be explained by the intensified flow velocity at higher mass flow rates, which increases the overall pressure loss and results in incomplete phase change and locally non-uniform heat transfer. Although the convective heat transfer coefficient improves with increasing flow rate, the reduced residence time of the refrigerant in the channel limits the degree of vaporization. Consequently, the utilization efficiency of the latent heat is weakened, leading to a less uniform temperature distribution. Meanwhile, the pressure drop in the cooling plate increases significantly with higher flow rates, reaching up to 4246 Pa within the investigated range.
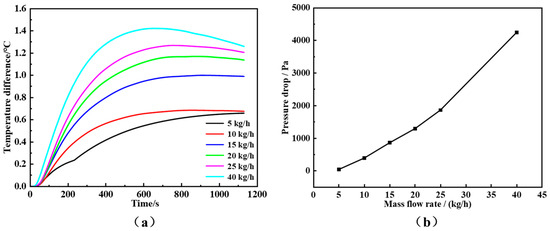
Figure 12.
(a) Temperature difference and (b) pressure drop at different mass flow rates.
A comparison of the temperature contours at the mid-plane is provided in Figure 13. A clear trade-off is observed: while elevating the mass flow rate significantly suppresses the module’s bulk temperature, it simultaneously degrades thermal uniformity. Therefore, although increasing the refrigerant flow rate can effectively lower the maximum cell temperature, it cannot improve thermal uniformity. This finding highlights the fact that in the design of liquid-based direct-cooling systems, a trade-off must be achieved between cooling efficiency and temperature uniformity by optimizing both the refrigerant flow rate and the flow channel configuration.
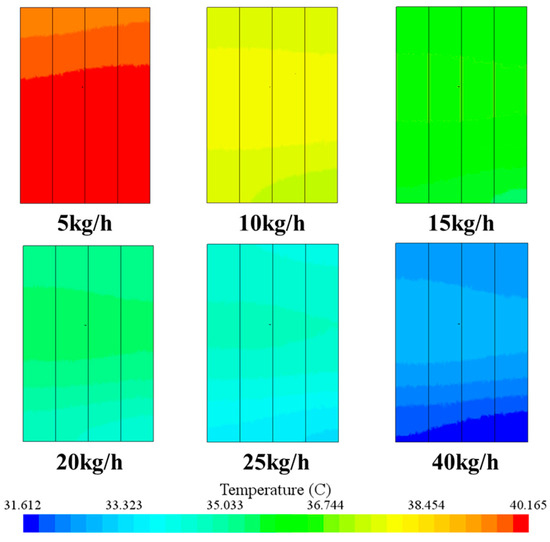
Figure 13.
Mid-plane temperature contours for various mass flow rates.
3.3. Effect of Refrigerant Saturation Temperature
The saturation temperature of the refrigerant is one of the key parameters affecting the thermal performance of the battery thermal management system (BTMS). It directly determines the phase-change characteristics and heat transfer efficiency of the refrigerant inside the cooling plate. The refrigerant saturation temperature served as the independent variable in this analysis, spanning a range from 3 °C to 20 °C (specifically 3, 6, 9, 15, 18, and 20 °C). To isolate its impact on thermal distribution, uniformity, and pressure drop, all other boundary conditions were held constant: a battery discharge rate of 3C, a mass flow rate of 10 kg/h, an inlet vapor quality of 0.2, and an ambient/initial temperature of 40 °C.
Figure 14 depicts the temporal progression of the maximum and minimum temperatures on the battery’s mid-plane surface. The data reveals a strong dependency: lowering the refrigerant saturation temperature causes a substantial drop in the module’s overall thermal profile. When the saturation temperature decreased from 20 °C to 3 °C, the maximum temperature at the end of discharge dropped from approximately 39.5 °C to 31.8 °C, representing a reduction of nearly 19.5%. This improvement can be attributed to the enhanced subcooling effect at lower saturation temperatures, which increases the refrigerant’s heat absorption capability and improves the utilization of latent heat during phase change. Although both the maximum and minimum temperatures decreased, the reduction in the maximum temperature was more pronounced, indicating that lower saturation temperatures have a stronger impact on hotspot mitigation within the battery pack.
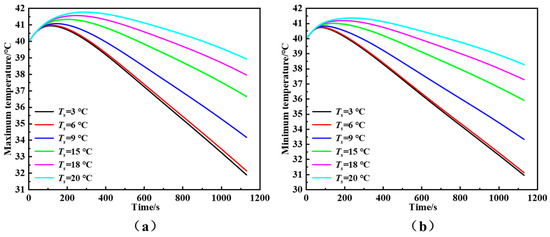
Figure 14.
(a) Maximum and (b) minimum temperatures at different refrigerant saturation temperatures.
Figure 15 further illustrates the variations in temperature difference and pressure drop as functions of saturation temperature. As the saturation temperature decreases, the temperature difference first increases and then decreases. In detail, as the saturation temperature was lowered from 20 °C to 3 °C, the temperature difference exhibited a non-monotonic trend: it initially widened from 0.65 °C to a peak of 1.01 °C at 6 °C, before subsiding slightly to 0.94 °C. This non-monotonic behavior arises from the change in the dominant heat transfer mechanism. At moderate-to-high saturation temperatures, vigorous but unstable phase-change heat transfer dominates, leading to large heat fluxes but poor uniformity. At very low saturation temperatures, the refrigerant remains mostly in the liquid phase, and heat transfer transitions to a more stable and uniform single-phase convection process, improving uniformity but slightly reducing overall heat removal capability. Meanwhile, the pressure drop increases as the saturation temperature decreases, reaching approximately 512 Pa at 3 °C—about 27.5% higher than that at 20 °C. This is mainly due to the higher density and viscosity of the refrigerant at lower temperatures, which increases the overall flow resistance in the channels.
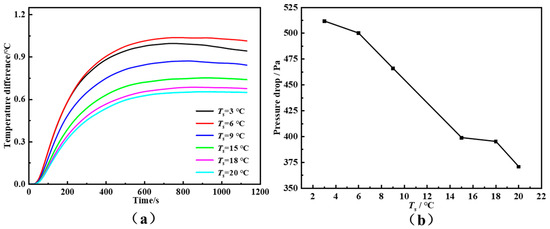
Figure 15.
(a) Temperature difference and (b) pressure drop at various saturation temperatures.
Figure 16 compares the mid-plane temperature contours of the battery pack at different saturation temperatures. A reduction in saturation temperature yields a progressive decline in the module’s bulk temperature; however, this cooling benefit is accompanied by a marginal degradation in thermal uniformity. At a saturation temperature of 3 °C, a more pronounced temperature gradient appears across the battery surface, whereas at 20 °C, the temperature field is more uniform, though the overall temperature remains higher. This observation suggests that while lowering the saturation temperature effectively suppresses the peak temperature of the battery, it may compromise temperature homogeneity. Therefore, in practical BTMS design, the refrigerant saturation temperature should be carefully optimized to balance cooling performance and temperature uniformity.
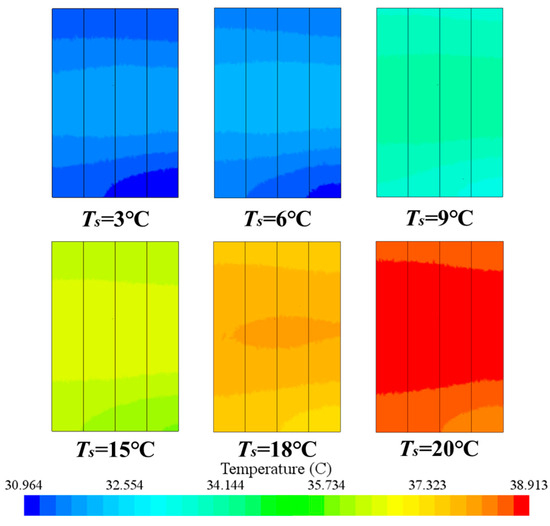
Figure 16.
Mid-plane temperature contours for different saturation temperatures.
3.4. Effect of Refrigerant Vapor Quality
The inlet subcooling and vapor quality of the refrigerant are two critical operational parameters governing the two-phase flow heat transfer characteristics, as they jointly determine the thermodynamic state of the refrigerant at the cooling plate inlet and its subsequent phase-change behavior. To systematically investigate their effects on the battery thermal management performance, a series of simulations was conducted under fixed operating conditions, including a battery discharging rate of 3C, refrigerant mass flow rate of 10 kg/h, saturation temperature of 18 °C, and ambient temperature of 40 °C. Different combinations of inlet vapor quality (0, 0.1, 0.2, 0.25) and subcooling degree (1 °C, 2 °C) were considered.
Figure 17 presents the temporal evolution of the maximum and minimum cell temperatures under various subcooling and vapor quality conditions. It can be observed that, at the same subcooling degree, the maximum temperature of the battery pack increases significantly with rising vapor quality. When the vapor quality increases from 0 to 0.25, the maximum temperature at the end of discharge rises from approximately 32.8 °C to 38.5 °C, representing an increase of about 14.8%. This phenomenon can be attributed to the reduced liquid-phase proportion and the shortened effective boiling heat transfer region at higher vapor qualities, leading to weakened overall heat absorption capacity of the refrigerant. In contrast, increasing the subcooling degree slightly decreases the overall temperature level of the battery pack, although the improvement margin remains limited. This indicates that while a higher subcooling enhances the sensible heat absorption before boiling onset, its effect on the total cooling capacity is less pronounced compared to the influence of vapor quality.
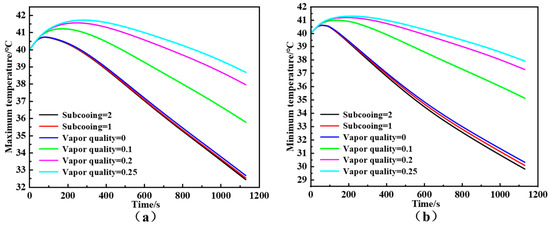
Figure 17.
(a) Maximum and (b) minimum temperatures at various refrigerant subcooling degrees and vapor qualities.
Figure 18 further compares the temperature difference across the mid-plane section and the pressure drop of the cooling plate under different subcooling–vapor quality combinations. It is evident that, for a fixed subcooling degree, the temperature difference first decreases and then increases with increasing vapor quality, reaching a minimum around x = 0.1. This suggests that a moderate vapor quality can optimize the balance between latent and sensible heat transfer, promoting more uniform temperature distribution. However, excessive vapor quality results in premature dry-out and local overheating near the outlet region. Regarding hydraulic performance, the pressure drop exhibits an overall increasing trend with vapor quality, as the growing gas-phase fraction leads to higher flow resistance and accelerates momentum losses within the microchannel.
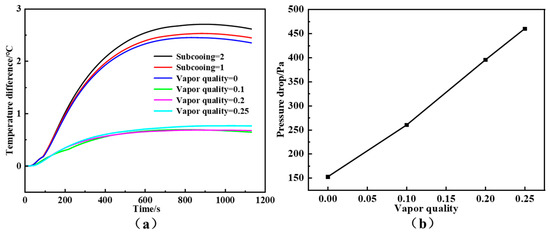
Figure 18.
(a) Temperature difference and (b) pressure drop at different subcooling degrees and vapor qualities.
Figure 19 illustrates the temperature distribution contours of the mid-plane battery pack for different subcooling and vapor quality combinations. The case with a vapor quality of 0.1 exhibits the most uniform surface temperature, indicating the most effective two-phase flow regime for heat removal. In contrast, although the fully liquid inlet condition (x = 0) yields a lower overall temperature, the non-uniformity is more pronounced due to limited phase-change heat transfer and local thermal stratification near the coolant inlet. These findings highlight that moderate inlet vapor quality, rather than excessive subcooling or pure liquid inflow, is more conducive to achieving both efficient and uniform battery cooling in two-phase refrigerant-based BTMSs.
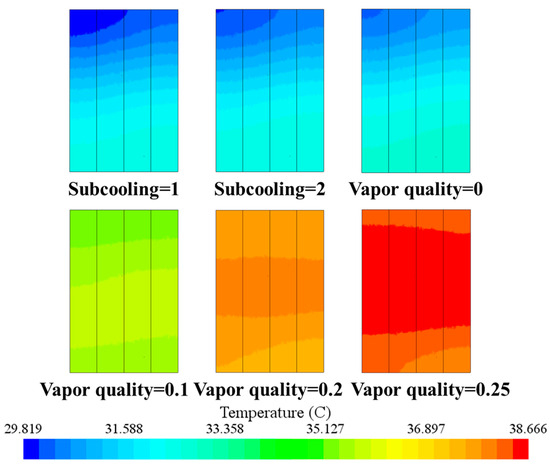
Figure 19.
Mid-plane temperature contours for various subcooling degrees and vapor qualities.
4. Conclusions
This study systematically investigated the thermal performance of a refrigerant-cooled BTMS under 3C transient discharge conditions. By analyzing multiple serpentine channel geometries and flow directions, the effects of cooling plate structure, refrigerant mass flow rate, saturation temperature, subcooling, and vapor quality on heat dissipation were explored. Based on the numerical simulations of the specific serpentine configurations defined in this work, the main conclusions are summarized as follows:
- (1)
- The geometric layout and flow direction of the cooling plate play a dominant role in temperature uniformity. Under identical channel geometries, reorienting the flow direction (from Cases 1–3 to Cases 4–6) reduced the maximum temperature difference from 2.02 °C to 0.48 °C, demonstrating that flow optimization is an efficient and economical strategy to achieve uniform temperature distribution.
- (2)
- When the refrigerant mass flow rate increased from 5 kg/h to 40 kg/h, the peak temperature decreased from 40.2 °C to 32.9 °C (a reduction of approximately 18%), while the temperature difference rose from 0.6 °C to 1.3 °C, accompanied by a sharp increase in pressure drop (up to ~4246 Pa). This reveals a clear trade-off between cooling intensity and temperature uniformity, highlighting the need for balanced system control.
- (3)
- As the saturation temperature decreased from 20 °C to 3 °C, the peak temperature dropped by about 19.5%. However, due to uneven phase-change behavior, the temperature difference exhibited a non-monotonic trend—first increasing and then decreasing. In addition, the pressure drop increased by approximately 27.5% under low saturation conditions, emphasizing the necessity of selecting an appropriate operating balance point.
- (4)
- A moderate inlet vapor quality (x = 0.1) achieved the best temperature uniformity by promoting efficient boiling without premature drying. Fully liquid or highly vaporized inlets led to uneven temperature fields. Increasing subcooling slightly reduced the overall temperature but had a limited impact on overall cooling capacity.
Despite these findings, several limitations of this study should be acknowledged. First, the results are based on numerical simulations; while the single-cell model was validated against data from the literature, the full module assembly lacks direct experimental verification. Second, the battery and cooling plate geometries were treated as idealized domains, neglecting manufacturing tolerances and contact thermal resistance variations. Third, although mechanical constraints were noted, a detailed stress analysis was not performed.
Future work will focus on addressing these gaps by (1) constructing a physical prototype to experimentally validate the optimized cooling plate design; (2) incorporating mechanical stress simulations to ensure structural integrity under high refrigerant pressures; and (3) integrating the component-level BTMS model with a vehicle-level heat pump system to evaluate energy efficiency under realistic driving cycles (e.g., WLTC).
Author Contributions
Conceptualization, Y.G.; methodology, Y.G.; software, F.W.; validation, F.W.; formal analysis, Y.G.; investigation, H.Y.; resources, F.Z.; data curation, H.Y.; writing—original draft preparation, Y.G.; writing—review and editing, J.Z.; supervision, J.Z. and F.Z.; project administration, F.Z.; funding acquisition, J.Z. All authors have read and agreed to the published version of the manuscript.
Funding
The research was funded by Chongqing Provincial Natural Science Foundation (Grant No. CSTB2024NSCQ-MSX0313).
Data Availability Statement
The original contributions presented in the study are included in the article, further inquiries can be directed to the corresponding author.
Conflicts of Interest
The authors declare no conflicts of interest.
References
- Jiang, F.; Yuan, X.; Hu, L.; Xie, G.; Zhang, Z.; Li, X.; Hu, J.; Wang, C.; Wang, H. A Comprehensive Review of Energy Storage Technology Development and Application for Pure Electric Vehicles. J. Energy Storage 2024, 86, 111159. [Google Scholar] [CrossRef]
- Abdelhamid, S.; Hassanein, H.S.; Takahara, G. Vehicle as a Resource (Vaar). IEEE Netw. 2015, 29, 12–17. [Google Scholar] [CrossRef]
- Ding, N.; Prasad, K.; Lie, T.T. The Electric Vehicle: A Review. Int. J. Electr. Hybrid Veh. 2017, 9, 49–66. [Google Scholar] [CrossRef]
- Theodore, A.M. Promising Cathode Materials for Rechargeable Lithium-Ion Batteries: A Review. J. Sustain. Energy 2023, 14, 51–58. [Google Scholar]
- Du, H.; Wang, Y.; Kang, Y.; Zhao, Y.; Tian, Y.; Wang, X.; Tan, Y.; Liang, Z.; Wozny, J.; Li, T. Side Reactions/Changes in Lithium-Ion Batteries: Mechanisms and Strategies for Creating Safer and Better Batteries. Adv. Mater. 2024, 36, 2401482. [Google Scholar] [CrossRef]
- Kim, T.; Song, W.; Son, D.-Y.; Ono, L.K.; Qi, Y. Lithium-Ion Batteries: Outlook on Present, Future, and Hybridized Technologies. J. Mater. Chem. A 2019, 7, 2942–2964. [Google Scholar] [CrossRef]
- Li, Y.; Jiang, C.; Zhao, C.; Zhu, D.; Wang, L.; Xie, H.; Yu, W. A Comprehensive Review for the Heat Traceability in Lithium-Ion Batteries: From Generation and Transfer to Thermal Management. Renew. Sustain. Energy Rev. 2025, 216, 115706. [Google Scholar] [CrossRef]
- Moore, A.L.; Shi, L. Emerging Challenges and Materials for Thermal Management of Electronics. Mater. Today 2014, 17, 163–174. [Google Scholar] [CrossRef]
- Wu, W.; Wang, S.; Wu, W.; Chen, K.; Hong, S.; Lai, Y. A Critical Review of Battery Thermal Performance and Liquid Based Battery Thermal Management. Energy Convers. Manag. 2019, 182, 262–281. [Google Scholar] [CrossRef]
- Sankhwar, P. Evaluation of Transition to 100% Electric Vehicles (Evs) by 2052 in the United States. Sustain. Energy Res. 2024, 11, 35. [Google Scholar] [CrossRef]
- Chen, K.; Zhang, Z.; Wu, B.; Song, M.; Wu, X. An Air-Cooled System with a Control Strategy for Efficient Battery Thermal Management. Appl. Therm. Eng. 2024, 236, 121578. [Google Scholar] [CrossRef]
- Yang, C.; Xi, H.; Wang, M. Structure Optimization of Air Cooling Battery Thermal Management System Based on Lithium-Ion Battery. J. Energy Storage 2023, 59, 106538. [Google Scholar] [CrossRef]
- Oyewola, O.M.; Awonusi, A.A.; Ismail, O.S. Design Optimization of Air-Cooled Li-Ion Battery Thermal Management System with Step-Like Divergence Plenum for Electric Vehicles. Alex. Eng. J. 2023, 71, 631–644. [Google Scholar] [CrossRef]
- Yates, M.; Akrami, M.; Javadi, A.A. Analysing the Performance of Liquid Cooling Designs in Cylindrical Lithium-Ion Batteries. J. Energy Storage 2021, 33, 100913. [Google Scholar] [CrossRef]
- Shang, Z.; Qi, H.; Liu, X.; Ouyang, C.; Wang, Y. Structural Optimization of Lithium-Ion Battery for Improving Thermal Performance Based on a Liquid Cooling System. Int. J. Heat Mass Transf. 2019, 130, 33–41. [Google Scholar] [CrossRef]
- Sheng, L.; Su, L.; Zhang, H.; Li, K.; Fang, Y.; Ye, W.; Fang, Y. Numerical Investigation on a Lithium Ion Battery Thermal Management Utilizing a Serpentine-Channel Liquid Cooling Plate Exchanger. Int. J. Heat Mass Transf. 2019, 141, 658–668. [Google Scholar] [CrossRef]
- Wang, R.; Liang, Z.; Souri, M.; Esfahani, M.; Jabbari, M. Numerical Analysis of Lithium-Ion Battery Thermal Management System Using Phase Change Material Assisted by Liquid Cooling Method. Int. J. Heat Mass Transf. 2022, 183, 122095. [Google Scholar] [CrossRef]
- Albdour, S.A.; Haddad, Z.; Sharaf, O.Z.; Alazzam, A.; Abu-Nada, E. Micro/Nano-Encapsulated Phase-Change Materials (Epcms) for Solar Photothermal Absorption and Storage: Fundamentals, Recent Advances, and Future Directions. Prog. Energy Combust. Sci. 2022, 93, 101037. [Google Scholar] [CrossRef]
- Sun, W.; Li, P.; Cheng, W.; Li, C.; Qi, X.; Shen, H.; Shao, X. Novel Hybrid Thermal Management System for Cylindrical Lithium-Ion Battery Based on Cpcm and Topology-Optimized Liquid Cooling. Energy 2025, 329, 136719. [Google Scholar] [CrossRef]
- Shen, M.; Gao, Q. System Simulation on Refrigerant-Based Battery Thermal Management Technology for Electric Vehicles. Energy Convers. Manag. 2020, 203, 112176. [Google Scholar] [CrossRef]
- Guo, J.; Jiang, F. A Novel Electric Vehicle Thermal Management System Based on Cooling and Heating of Batteries by Refrigerant. Energy Convers. Manag. 2021, 237, 114145. [Google Scholar] [CrossRef]
- Park, S.; Jang, D.S.; Lee, D.; Hong, S.H.; Kim, Y. Simulation on Cooling Performance Characteristics of a Refrigerant-Cooled Active Thermal Management System for Lithium Ion Batteries. Int. J. Heat Mass Transf. 2019, 135, 131–141. [Google Scholar] [CrossRef]
- Subhedar, D.; Chauhan, K.V.; Panchal, S.; Bais, A. Numerical Investigation of Performance for Liquid-Cooled Cylindrical Electrical Vehicle Battery Pack Using Al2O3/Eg-Water Nano Coolant. Mater. Today Proc. 2023. [Google Scholar] [CrossRef]
- Wang, H.; Tao, T.; Xu, J.; Mei, X.; Liu, X.; Gou, P. Cooling Capacity of a Novel Modular Liquid-Cooled Battery Thermal Management System for Cylindrical Lithium Ion Batteries. Appl. Therm. Eng. 2020, 178, 115591. [Google Scholar] [CrossRef]
- Sadeghian, M.S.; Esfahanian, V.; Akrami, M.; Shokouhmand, H.; Pasandeh, R.; Zand, E.; Afshar, M.R. Enhanced Indirect Liquid Cooling for Cylindrical Lithium-Ion Battery Module Using Microtubes and Housing System. Int. J. Heat Mass Transf. 2026, 255, 127588. [Google Scholar] [CrossRef]
- Lyu, W.; Xu, Z.; Xu, Y.; Wang, Z.; Jiang, C.; Li, X.; Li, J.; Gou, X. A Comprehensive Review of Influencing Factors and Energy Efficiency Improvement Strategies for Variable Refrigerant Flow Systems. Int. J. Refrig. 2025, 179, 27–43. [Google Scholar] [CrossRef]
- Ding, Y.; Wei, M.; Liu, R. Channel Parameters for the Temperature Distribution of a Battery Thermal Management System with Liquid Cooling. Appl. Therm. Eng. 2021, 186, 116494. [Google Scholar] [CrossRef]
- Wang, J.; Lv, D.; Sha, H.; Lai, C.; Zeng, J.; Gao, T.; Yang, H.; Wu, H.; Jiang, Y. Numerical Investigation on the Thermal Performance of a Battery Pack by Adding Ribs in Cooling Channels. Energies 2024, 17, 4451. [Google Scholar] [CrossRef]
- Yu, B.; Ouyang, H.; Shi, J.; Guo, Z.; Chen, J. Experimental Evaluation of Cycle Performance for New-Developed Refrigerants in the Electric Vehicle Heat Pump Systems. Int. J. Refrig. 2021, 129, 118–127. [Google Scholar] [CrossRef]
- Dhamodharan, P.; Salman, M.; Prabakaran, R.; Choi, G.S.; Kim, S.C. Revolutionizing Electric Vehicle Cooling: Optimal Performance of R1234yf Two-Phase Refrigerant Cooling for Ev Battery Thermal Management System. Appl. Therm. Eng. 2025, 260, 125070. [Google Scholar] [CrossRef]
- Gao, T.; Wang, J.; Sha, H.; Yang, H.; Lai, C.; Fu, X.; Zhai, G.; Zeng, J. Investigation on Thermal Performance of a Battery Pack Cooled by Refrigerant R134a in Ribbed Cooling Channels. Energies 2025, 18, 1011. [Google Scholar] [CrossRef]
- Min, H.; Xiao, J.; Sun, W.; Min, Z. Numerical Investigation and Structural Optimization of a Battery Thermal Management System Based on Refrigerant Evaporation. J. Energy Storage 2024, 104, 114438. [Google Scholar] [CrossRef]
- Gao, X.; Gao, Q. Structural Design and Multi-Criteria Evaluation of Refrigerant-Based Cold Plate for Battery Thermal Management System. Appl. Therm. Eng. 2025, 273, 126481. [Google Scholar] [CrossRef]
- Saxena, V.; Sahu, S.K.; Kundalwal, S.I.; Tsai, P.A. Enhanced Thermal Management System for Li-Ion Batteries Using Phase Change Material and Liquid Cooling under Realistic Driving Cycles. Energy 2025, 318, 134759. [Google Scholar] [CrossRef]
- Fan, L.; Li, J.; Chen, Y.; Zhou, D.; Jiang, Z.; Sun, J. Study on the Cooling Performance of a New Secondary Flow Serpentine Liquid Cooling Plate Used for Lithium Battery Thermal Management. Int. J. Heat Mass Transf. 2024, 218, 124711. [Google Scholar] [CrossRef]
- Madani, S.S.; Swierczynski, M.; Kær, S.K. Cooling Simulation and Thermal Abuse Modeling of Lithium-Ion Batteries Using the Newman, Tiedemann, Gu, and Kim (Ntgk) Model. ECS Trans. 2017, 81, 261. [Google Scholar] [CrossRef]
- ASHRAE. 2013 ASHRAE Handbook: Fundamentals, SI ed.; American Society of Heating, Refrigerating and Air-Conditioning Engineers: Atlanta, GA, USA, 2013. [Google Scholar]
- Zhuan, R.; Wang, W. Flow Pattern of Boiling in Micro-Channel by Numerical Simulation. Int. J. Heat Mass Transf. 2012, 55, 1741–1753. [Google Scholar] [CrossRef]
- Chen, J.C. Correlation for Boiling Heat Transfer to Saturated Fluids in Convective Flow. Ind. Eng. Chem. Process Des. Dev. 1966, 5, 322–329. [Google Scholar] [CrossRef]
- Zeng, J.; Feng, S.; Lai, C.; Song, J.; Fu, L.; Chen, H.; Deng, S.; Gao, T. Prediction on Thermal Performance of Refrigerant-Based Battery Thermal Management System for a Hev Battery Pack. Int. J. Heat Mass Transf. 2023, 201, 123657. [Google Scholar] [CrossRef]
Disclaimer/Publisher’s Note: The statements, opinions and data contained in all publications are solely those of the individual author(s) and contributor(s) and not of MDPI and/or the editor(s). MDPI and/or the editor(s) disclaim responsibility for any injury to people or property resulting from any ideas, methods, instructions or products referred to in the content. |
© 2025 by the authors. Licensee MDPI, Basel, Switzerland. This article is an open access article distributed under the terms and conditions of the Creative Commons Attribution (CC BY) license (https://creativecommons.org/licenses/by/4.0/).